
Abstract
Automated assessment of tomato crop maturity is vital for improving agricultural productivity and reducing food waste. Traditionally, farmers have relied on visual inspection and manual assessment to predict tomato maturity, which is prone to human error and time-consuming. Computer vision and deep learning automate this process by analysing visual characteristics, enabling data-driven harvest decisions, optimising quality, and reducing waste for sustainable and efficient agriculture. This research demonstrates deep learning models accurately classifying tomato maturity stages using computer vision techniques, utilising a novel dataset of 4,353 tomato images. The Vision Transformer (ViT) model exhibited superior performance in classifying tomatoes into three ripeness categories (immature, mature, and partially mature), achieving a remarkable testing accuracy of 98.67% and the Convolution neural network (CNN) models, including EfficientNetB1, EfficientNetB5, EfficientNetB7, InceptionV3, ResNet50, and VGG16, achieved testing accuracies of 88.52%, 89.84%, 91.16%, 90.94%, 93.15%, and 92.27%, respectively, when tested with unseen data. ViT significantly surpassed the performance of CNN models. This research highlights the potential for deploying ViT in agricultural environments to monitor tomato maturity stages and packaging facilities smartly. Transformer-based systems could substantially reduce food waste and improve producer profits and productivity by optimising fruit harvest time and sorting decisions.
Keywords
Introduction
The agriculture industry has witnessed significant technological advancements, particularly in crop monitoring and management. Among various crops, Tomatoes hold significant economic importance and are extensively cultivated worldwide. Determining tomato maturity stages ensures optimal harvest timing, quality control, and efficient supply chain management. Traditionally, farmers rely on manual inspection to assess tomato maturity, which is labour-intensive, time-consuming, and prone to subjective errors. Recent advancements in machine learning and computer vision techniques automate tomato maturity stage prediction, which has gained attention due to their potential to streamline the process, enhance accuracy, and reduce labour costs. In this century, computer vision offers a promising and significant set of tools for rapid, low-cost, non-destructive approaches for tomato maturity prediction. Computer vision and deep learning techniques are popular in the agriculture and food industries due to their effectiveness in performing critical tasks, such as grading, sorting, and fruit recognition. In addition, deep neural techniques have been used to classify the tomato maturity stage, such as immature, mature and partially mature [1]. Deep neural networks possess the valuable capacity to study raw tomato images across various datasets and independently identify meaningful patterns that characterise maturity levels. This data-driven strategy circumvents the need for manual feature extraction. Deep learning models based on convolutional architectures have set new benchmarks for tomato image analysis, particularly in maturity prediction [2] and sorting applications [3]. The key to their success lies in efficiently utilising pre-trained neural networks. These networks have been trained on extensive labelled datasets, which can significantly reduce the computational power associated with the training process. Deep neural networks allow efficient fine-tuning for specific tasks like tomato maturity classification through automated feature learning and transfer learning and can outperform analysing tomato images to determine maturity level. Tomatoes go through distinct colour changes, such as green (immature), pink (partially mature), and red (mature). Image processing analyses tomato images and extracts colour features to determine their ripeness stage. Feature extraction from images using deep learning presents a promising solution for the classification process with high accuracy and efficiency. This colour-based computer vision approach allows consistent and scalable assessment of tomato maturity compared to subjective human evaluation. The concept could also be extended to assess the ripeness of other fruits and vegetables.
Several studies have explored the application of deep learning in agriculture, particularly using (Convolutional Neural Networks) CNNs for crop and fruit classification tasks. CNNs have demonstrated remarkable success in image recognition tasks by automatically extracting and learning features from images. Non-destructive prediction of tomato maturity has been evaluated using colour sensors that measure parameters like green and red [4]. Hyperspectral imaging [5] and spatially resolved spectroscopic systems [6] to assess qualities of tomatoes like soluble solids and firmness. Computer vision systems and deep neural networks have shown promise for various fruit quality assessments [7, 8], including size estimation [9, 10] and colour-based maturity prediction [11]. Techniques such as deep learning, transfer learning, and Back Propagation Neural Networks (BPNNs) have been developed for applications maturity detection [12, 13, 14], crop identification [15] and fruit sorting [16]. Maturity detection methods had been proposed involving image processing and CNNs to detect tomato maturity and even predict harvest times for individual fruits [17, 18]. Recent advancements in deep learning could predict disease in the tomato leaf [19]. Additionally, Transformers was used for tomato ripeness prediction using segmentation [20, 21]. These technologies aimed to support the development of automated tomato sorting and grading tools to optimise harvesting. Moreover, real-time tomato detection, using deep learning models such as the Multi-level deep residual network [22], YOLOv4-tiny model [23] and YOLOv5 model [24] had been deployed. Despite the proven effectiveness of CNNs in image-based applications within agriculture, they have limitations in capturing long-range dependencies between image parts due to their local receptive fields. Vision Transformer (ViT), a novel architecture proposed by Dosovitskiy et al. [25] has shown remarkable performance in various computer vision tasks, surpassing traditional CNN architectures in certain scenarios. ViT provides self-attention mechanisms to process images as sequences of patches rather than relying on the inductive biases of convolutional layers like CNNs. This potentially provides ViTs more flexibility and efficiency in capturing global dependencies within images. However, ViT remains relatively unexplored for agricultural uses, particularly in predicting crop maturity stages like in tomatoes. Moreover, the lack of exploration of ViT in agriculture provides an interesting research opportunity. Additionally, comparative studies evaluating efficiency and performance against established transfer learning CNN approaches could offer useful insights.
This research reflects the effectiveness of the proposed ViT model by comparing transfer learning-based CNNs in predicting the maturity stages of tomatoes from images. It involves a comprehensive evaluation based on accuracy, computational efficiency, and the ability to generalise across different tomato varieties and environmental conditions. The results put a significant step towards harnessing the power of deep learning in transforming agricultural practices, ultimately contributing to enhanced food security and sustainability. Moreover, it provides detailed insights into each approach. This research endeavours to contribute to advancement in agricultural practices and pave the way for more effective crop management strategies.
The remaining section of this manuscript is organised as follows: Section 2 details the previous studies related to this field. Section 3 introduces groundbreaking deep-learning techniques for categorising tomato ripeness; and in Section 4, subsequent results of classification models across the proposed dataset are demonstrated. Finally, Section 5 summarises the findings and future implications of this study.
Related studies
Tomato quality and maturity are crucial in marketability, shelf life, and overall consumer acceptance. Traditional methods for assessing these factors often involve destructive testing, which is time-consuming, labour-intensive, and results in product loss. Researchers have explored non-destructive techniques for evaluating tomato maturity and quality factors during ripening and storage to overcome these challenges.
Hyperspectral imaging and visible and near-infrared (VIS/NIR) spectroscopy have proven effective techniques for assessing various quality factors in tomatoes during storage and ripening. Mollazade et al. [26] predicted quality factors of tomato fruit during storage using backscattering and multispectral imaging techniques, employing a novel strategy that utilised wavelengths identified by the fusion of genetic algorithm and t-Score techniques. Similarly, Dai et al. [5] utilised hyperspectral imaging to identify maturity stages in tomatoes and quantify lycopene content. In the domain of VIS/NIR spectroscopy, Lu et al. [27] accurately estimated tomato ripeness, highlighting the effectiveness of this method in evaluating fruit maturity. Saad et al. [28] monitored the physicochemical qualities of intact tomatoes over a 12-day storage period using VIS/NIR spectroscopy in the range of 350–1050 nanometers, while Akpolat et al. [29] developed a rapid technique using handheld Raman spectroscopy and chemometric methods for profiling and quantifying major carotenoids in tomatoes.. Zhang et al. [30] evaluated tomato soluble solids content, an indicator of maturity, using VIS/NIR spectroscopy across different stages. Their study utilised 168 tomato samples at various ripeness levels, employing two systems that measured wavelength ranges of 500-930 nanometers and 900–1400 nanometers. Huang et al. [6] demonstrated that spatially resolved spectroscopy could assess maturity in different layers of the tomato pericarp, while Huang et al. [31] specifically focused on predicting tomato fruit firmness using visible and near-infrared spectroscopy. These studies collectively show the ability of hyperspectral imaging and spectroscopic techniques to predict and monitor various tomato quality parameters throughout the storage and ripening stages. Beyond hyperspectral and spectroscopy, other optical techniques have shown promise for nondestructive tomato analysis. For example, Pieczywek et al. [32] tested biospeckle methods against spectroscopy for predicting maturity indices like firmness and pigment content in tomatoes. Damayanti et al. [4] designed an RGB imaging system using a TCS3200 colour sensor to predict tomato maturity and vitamin C content automatically. Nurulhuda et al. [33] monitored fluorescence characteristics on tomato skin and flesh during over-ripening.
Several studies had developed fuzzy logic systems for agricultural modelling and prediction tasks. Chen et al. [34] used a fuzzy optimisation strategy to improve the prediction of fruit maturity using visible-NIR spectroscopy. Huang et al. [6] proposed a fuzzy Mask R-CNN model to identify the ripeness levels of cherry tomatoes automatically. Villaseñor-Aguilar et al. [35] compared fuzzy logic and neural networks for classifying bell pepper ripeness levels from images. Beyond fuzzy logic, some studies had combined fuzzy methods with deep learning for agriculture. Villaseñor-Aguilar et al. [36] developed a low-cost sensor correlating tomato lycopene content to epicarp colour using fuzzy logic. Hsieh et al. [37] used computer vision and fuzzy logic techniques to identify mature green tomatoes and predict fruit size. Soft computing techniques, such as fuzzy logic and genetic algorithms, are increasingly being employed in various health monitoring sectors to address complex challenges and enhance the robustness and accuracy of healthcare systems. Umoh et al. [38] underscored the integration of interval type-2 fuzzy logic (IT2FL) with the flower pollination algorithm (FPA) in healthcare systems, proposing a hybrid intelligent telemedical monitoring and predictive system. This model enhances robustness in handling healthcare data, overcoming the limitations inherent in individual methods. Kadam et al. [39] explored cardiac arrhythmia classification through a two-stage model that combines Genetic Algorithm feature selection and an ensemble of Support Vector Machines with bagging. This approach not only optimises the feature subset but also improves classification quality through bootstrap aggregating.
Deep learning techniques have shown promise for various agricultural applications such as plant disease detection, fruit quality assessment, and crop growth monitoring. For plant disease detection, Prabhakar et al. [40] used a deep Residual Network (ResNet101) to assess the severity of early blight disease in tomato leaves. Juyal and Sharma [41] proposed using an R-CNN mask to identify and segment disease-infected regions in tomato leaves accurately. Elleuch et al. [42] introduced a deep learning-based diagnostic method for identifying plant diseases caused by nutrient deficiencies, utilising transfer learning architectures like VGG-16 and ResNet. This approach aims to surpass the detection accuracy of existing methods by analysing leaf images. Some studies had focused on monitoring crop growth for robotic harvesting. Seo et al. [43] developed a real-time tomato monitoring system to detect ripe fruits in greenhouses using Faster R-CNN. Tej et al. [44] compared ResNet152 and ResNet50 with and without data augmentation to recognise tomato and pepper diseases. Islam et al. [45] proposed an attention-based dilated CNN model called attention-based dilated CNN logistic regression (ADCLR) for tomato leaf disease detection. Beyond disease and growth monitoring, some work had assessed fruit maturity and quality. Aherwadi et al. [46] aimed to identify the best deep learning algorithms for non-destructive prediction of fruit maturity and quality to determine shelf life. Bouni et al. [19] used CNNs and transfer learning for tomato leaf disease identification. Nahak et al. [47] evaluated diseases present in the plant utilising CNN and LabVIEW software. Nennuri et al. [48] proposed a multi-stage deep learning technique for different crop and disease identification. Finally, for quality assessment of stored produce, Stasenko et al. [49] proposed synthesised and segmented visible/near-infrared spectral imaging data to predict decay and fungal zones in stored apples using generative adversarial networks and CNNs. Furthermore, the study by Li et al. [50] utilised MHSA-YOLOv8 for tomato maturity detection and counting, achieving mAP scores of 0.864 and 0.916, respectively. ViT also plays a pivotal role in image classification. Kadri et al. [51] addressed Alzheimer’s disease classification using a hybrid approach that combines CNNs and ViT in a Cross ViT Wide Residual Squeeze-and-Excitation Network. They also innovated with a self-attention progressive generative adversarial neural network for data augmentation, tackling the challenge of limited data in neuroimaging analysis. Deep learning has shown significant promise for various agricultural applications, with continued research improving disease detection, growth monitoring, maturity and quality prediction, and post-harvest quality assessment.
In recent years, various techniques have been employed to predict tomato crop maturity, including hyperspectral imaging, visible and near-infrared (VIS/NIR) spectroscopy, and CNNs. While these methods have shown promising results, the application of ViT for tomato maturity prediction remains relatively unexplored. The proposed study aims to bridge the gap in the existing literature by conducting a comprehensive evaluation of the ViT model compared to various transfer learning-based CNN approaches for tomato maturity prediction.
Methodology
This study introduces a sequential process for classifying the maturity stages of tomatoes, depicted in Fig. 1. The process involves taking images from the dataset of tomatoes and then applying image pre-processing techniques before training and then, validating for deep learning models. Subsequently, rigorous testing is carried out to ensure precise classification of tomato maturity stages.
Flowchart for tomato maturity stage classification.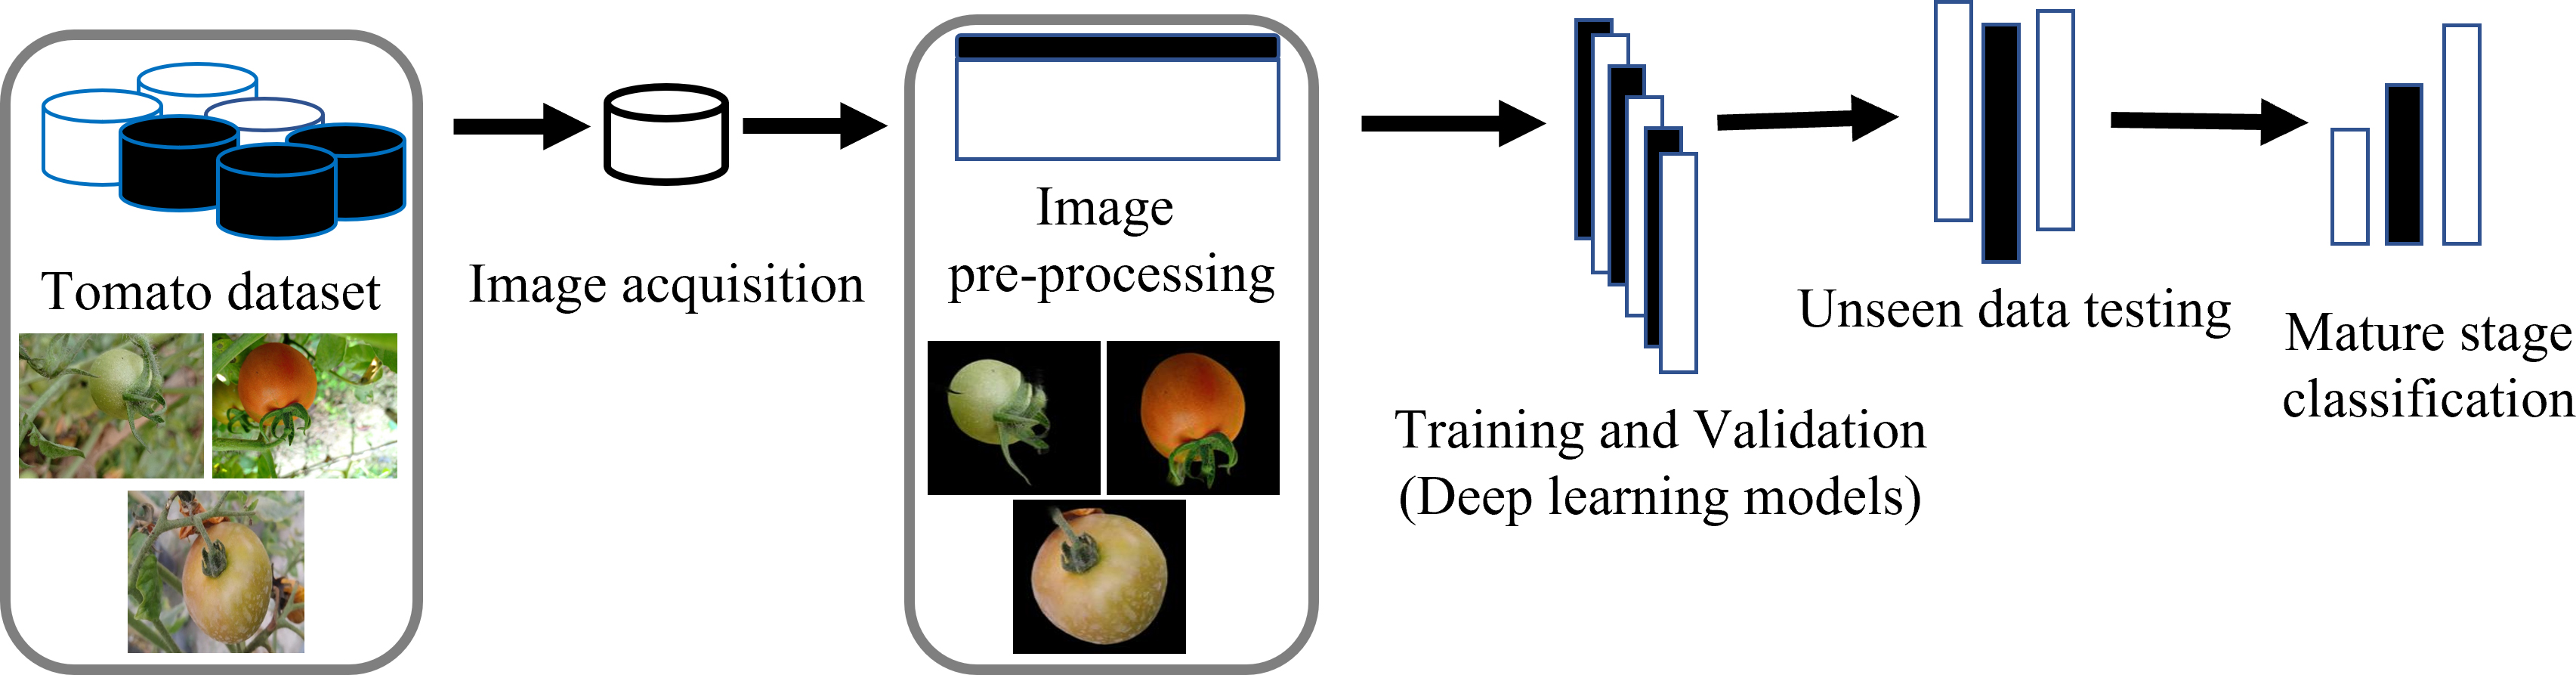
The dataset utilised in this research contains 4353 images of tomatoes of three stages immature, partially mature and mature. The training set contains 3120 images and 780 images were assigned to the validation set, used for model optimisation and hyperparameter tuning during training. The validation images enable unbiased evaluation of model performance on new data. Finally, 453 unseen tomato images constituted the test set for final model testing and accuracy quantification. Rigorous benchmarking on the test data ensures the machine learning approach can precisely classify the maturity stage of tomato crops. Strategic data preparation techniques, such as pre-processing, resizing and splitting among train, validation and test sets, are crucial for creating standardised and unbiased image datasets.
ViT model architecture
ViT has emerged as a promising architecture for computer vision tasks. The study proposes customising a ViT model for automated tomato maturity stage prediction. ViT applies the transformer architecture shown in Fig. 2 commonly used in natural language processing directly to image classification. The ViT model would first split tomato images into small patches, treating each as a visual word. The sequence of image patches passes through multiple encoder blocks containing multi-headed self-attention layers to model global dependencies between patches. After the sequence of encoder self-attention operations, the model applies a Multilayer perception (MLP) head block for final classification into maturity categories. Within each encoder block, a layer normalisation step first normalises image patch inputs.
ViT model architecture.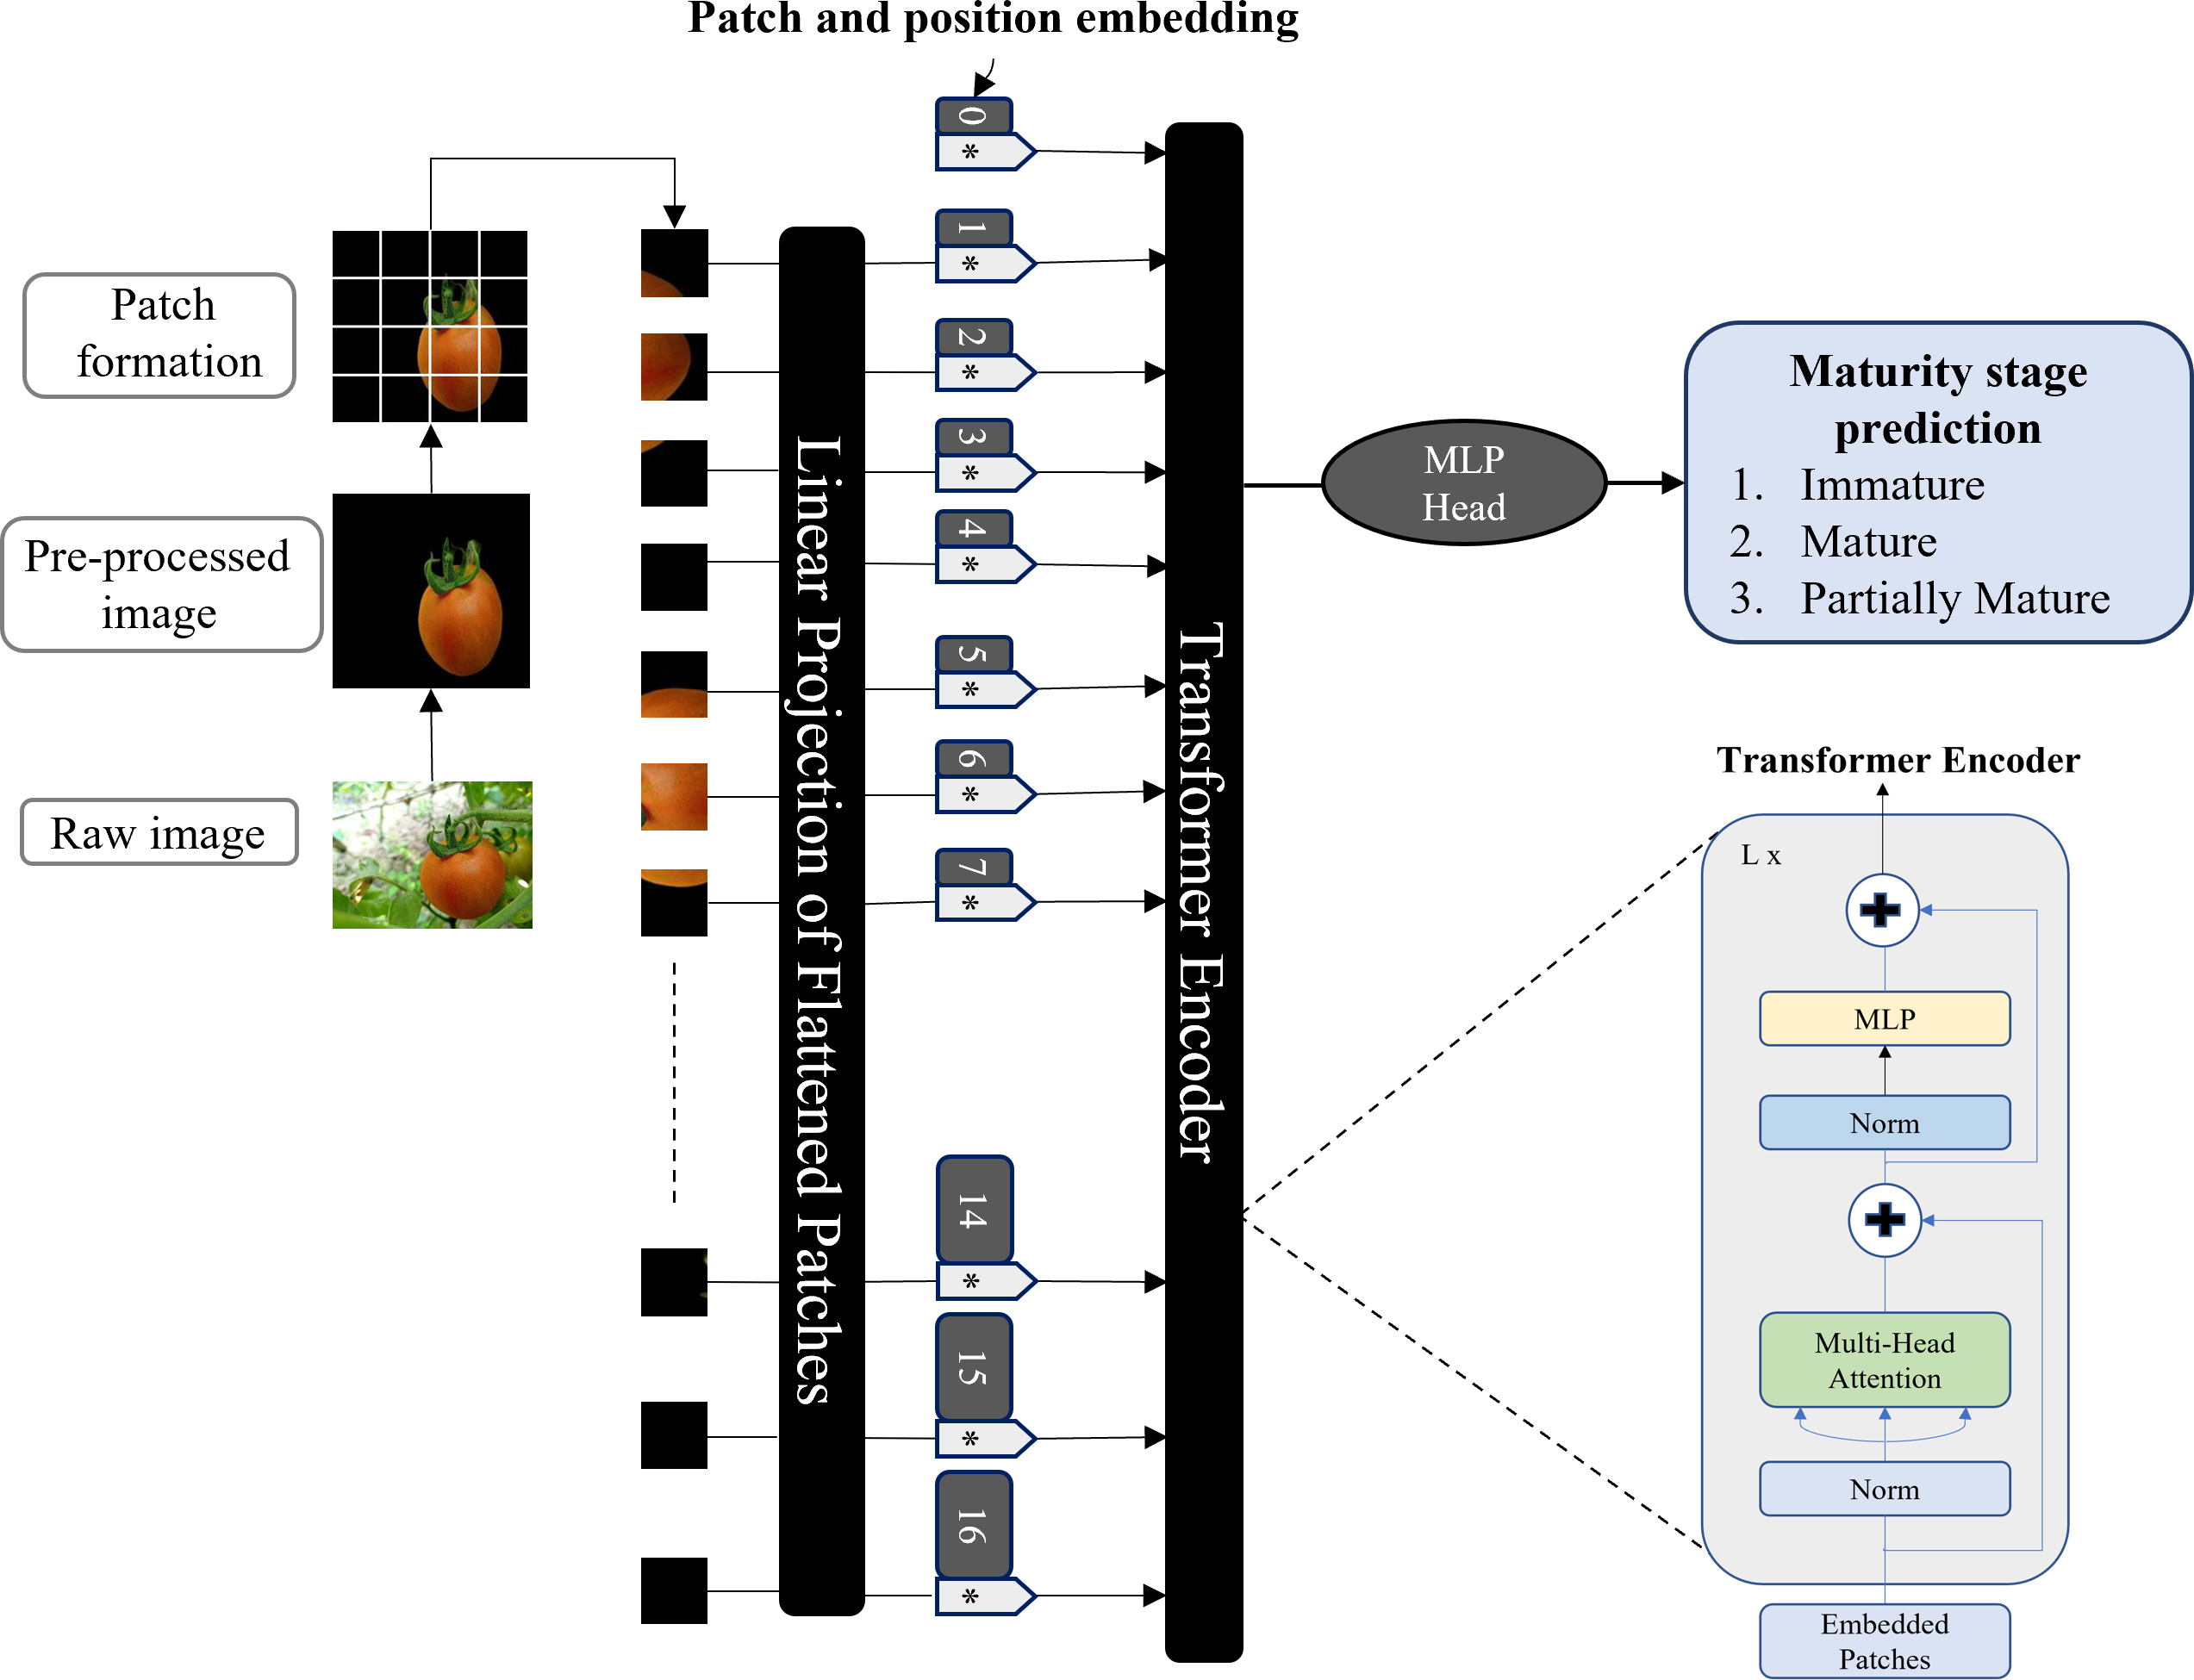
The normalised inputs enter a multi-headed self-attention layer to relate different spatial regions, capturing visual relationships valuable for assessing ripeness based on colour, firmness, and shape changes over time. Residual skip connections after each attention layer help convergence during backpropagation. The specific model parameters, such as the number of encoder blocks, attention heads, hidden layer dimensions, and embedded image patch resolution, can be optimised via cross-validation on the tomato image dataset. Additionally, regularisation techniques will help to limit overfitting and improve generalisation across diverse tomato varieties, lighting conditions, and growth levels. The ViT architecture’s strength in implicitly learning global interdependencies between local pattern representations in images can complement convolutional approaches. The transformer-based architecture’s inherent strength in relating spatial regions provides a promising result for robust computer vision across diverse settings.
Deep convolutional Neural Network (DCNN) architecture (Fig. 3) for automated assessment of agricultural products typically contains input and output layers alongside multiple hidden layers of convolutional filters, pooling operations, nonlinear activations, and fully connected mappings that enable representation learning. Through hierarchical feature extraction, CNN models can capture visual qualities indicative of internal ripeness and projected shelf life. classification from image datasets.
Basic CNN model architecture.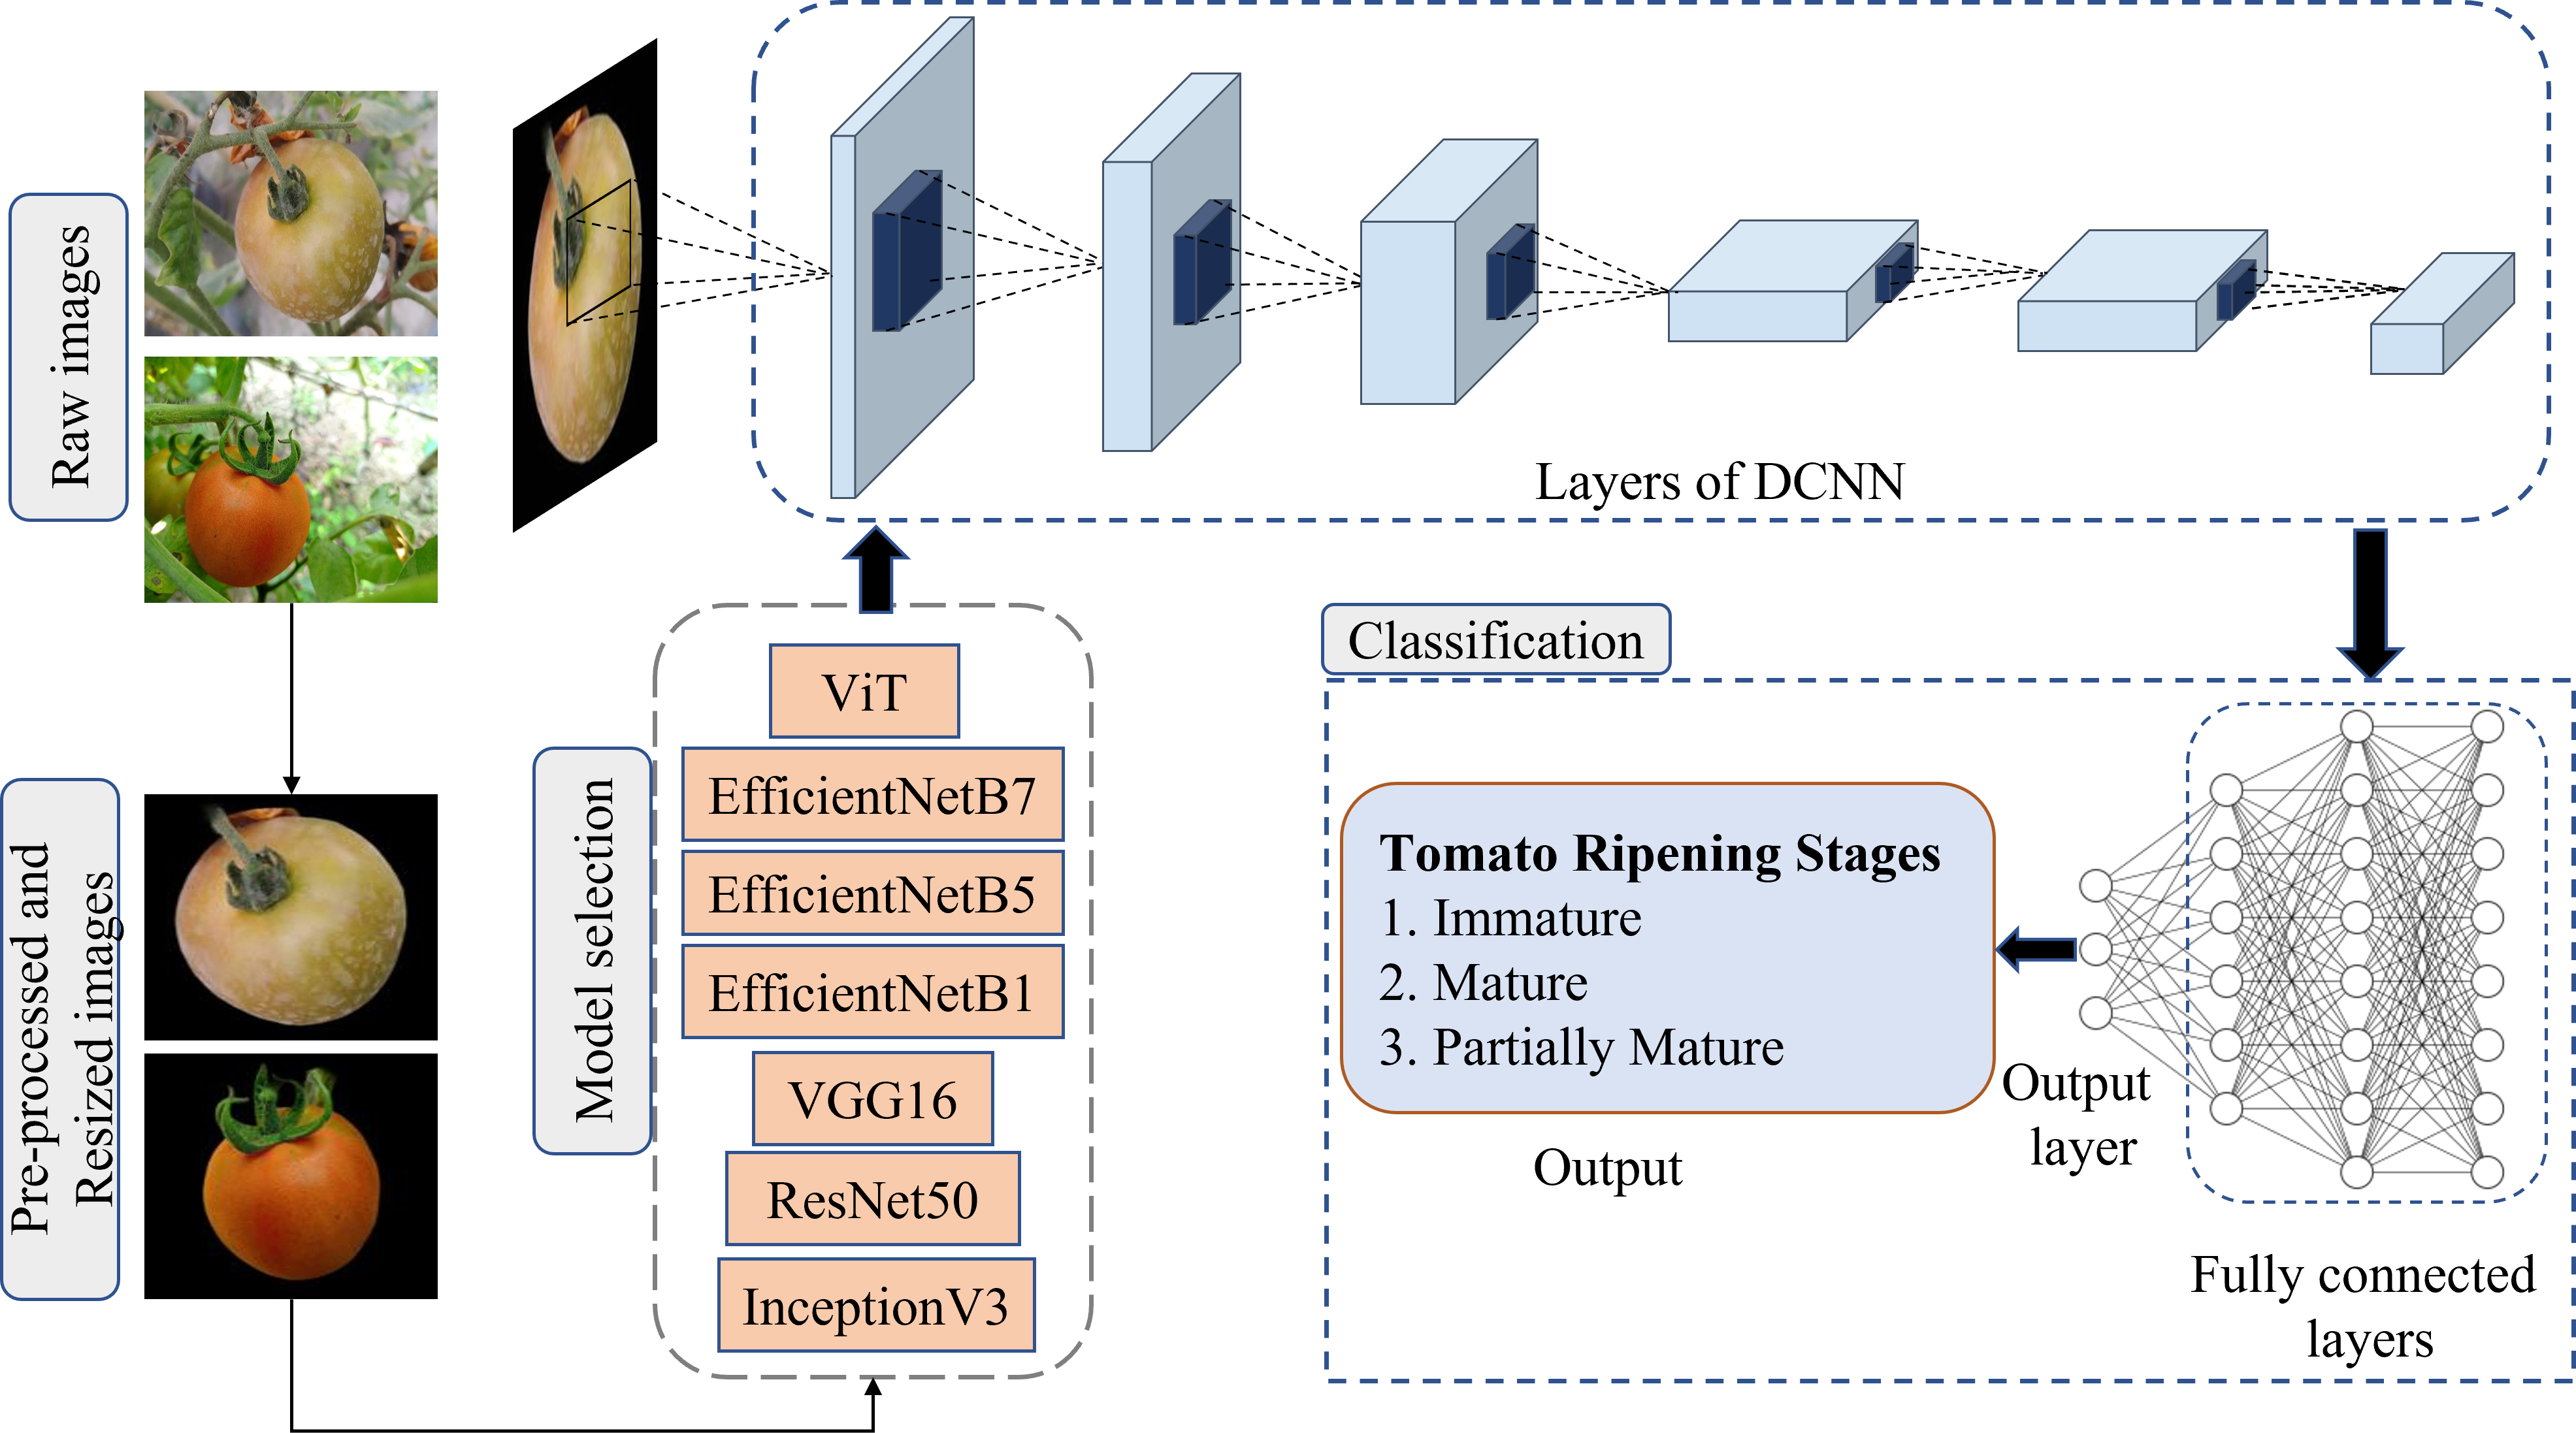
Low-level convolutional layers detect basic edges, colours, and textures, while deeper layers integrate these into higher-level features correlating with maturity timelines. Various established CNNs leverage this translation invariant local receptive fields to achieve state-of-the-art performance on parallel perception tasks. For this research, promising architectures like EfficientNetB1, EfficientNetB5, EfficientNetB7, InceptionV3, ResNet50 and VGG16 will be evaluated as baseline models for non-destructive tomato quality.
EfficientNetB1 [52] is a state-of-the-art CNN architecture designed for high performance and efficiency. It features an input image dimension of 240
EfficientNetB5
EfficientNetB5 [52] is a scaled-up variant of EfficientNet4 that utilises compound scaling to uniformly increase the depth, width, and resolution of the network architecture for improved accuracy. It features an increased input image dimension of 456
EfficientNetB7
EfficientNetB7 [52] is the most advanced model in the EfficientNet family of CNN architectures, achieving state-of-the-art performance and efficiency through extreme compound scaling. It uses an ultra-high-resolution input size of 600
InceptionV3
InceptionV3 [53] is a CNN architecture designed for efficient computation and high performance in computer vision tasks. It is built around Inception modules, which consist of parallel convolutional filters of different sizes (1
ResNet50
ResNet50 [54] is a CNN architecture that utilises residual learning to enable the training of very deep models without accuracy degradation. The core component is the residual block, which learns a residual mapping using stacked 3
VGG16
VGG16 [55] is a CNN architecture consisting of a stack of convolutional layers arranged in blocks, each containing multiple convolutional layers using small 3
Fine-tuning and performance metrics
The pre-trained deep learning models can be fine-tuned to detect various maturity levels of the tomato dataset. The initial convolutional layers that extract generic visual features are frozen, while the later higher-level feature layers are unfrozen and trained at a low learning rate using tomato ripeness data and maturity labels to learn domain-specific patterns. The model performance will be evaluated using accuracy (Eq. (1)), precision (Eq. (2)), recall (Eq. (3)), F1-score (Eq. (4)), and area under the receiver operating characteristics curve (AUROC). Confusion matrices will be a key metric to assess model skill at tomato maturity stage classification, with rows corresponding to actual maturity labels and columns indicating predicted ripeness levels. The goal is to optimise the classifier to achieve higher precision and generalise the model.


where TP represents true positives, TN indicates true negatives, FP denotes false positives and FN represents false negatives.
This research demonstrates tomato maturity stage classification utilising the ViT model and Deep CNNs. These models were trained on an open-source dataset [56] comprising 4353 tomato images. This dataset was split into training, validation and testing sets, consisting of 3120, 780 and 453 images, respectively. Several performance metrics were used to predict the efficacy of the ViT and CNN models, including precision, recall, Area Under the Curve (AUC) scores from the receiver operating characteristic curve (ROC) curve, confusion matrices and test accuracies. PyTorch and Keras libraries were utilised to develop the ViT and CNN-based deep learning models, respectively. The training was performed on an NVIDIA GeForce GTX 1070 Ti GPU for 50 epochs. The ViT and CNNs models were trained on field captured tomato image dataset to categorise the maturity stage into three classes: immature, partially mature and mature tomatoes.
Performance evaluation of ViT model
The ViT model was trained for 50 epochs on the newly created tomato dataset. The training accuracy (Fig. 4a) increased from an initial value of 0.43 to 0.94 within five epochs and then gradually increased to a final accuracy of 99.16%, indicating the model’s improving ability to classify maturity classes in the training data over time correctly. Meanwhile, the validation accuracy (Fig. 4a) curve displayed a similar upward trajectory. starts from 0.69 and reaches 0.91% within five epochs and then gradually increases to 98.75% and becomes plateauing to the training curve. This demonstrates that while the model continued improving on the training data past epoch 5, generalising the model without overfitting and underfitting. The training loss (Fig. 4b) decreased from an initial value of 1.2 to a final loss of 0.0831, indicating an improving ability of the model to distinguish between the maturity classes. The Validation was concurrently carried out on unseen images after each training epoch iteration. The validation loss (Fig. 4b) curve displayed a downward trajectory initially at 0.9 and, within ten epochs, reached 0.12, then before reaching a minimum at epoch 50 and then plateauing. Based on the loss and accuracy curves, training was halted at epoch 50 to deploy the best iteration of the model just before overfitting effects. The model parameter state at the optimal checkpoint will be saved for tomato maturity detection on new datasets.
Accuracy and loss distribution of ViT model.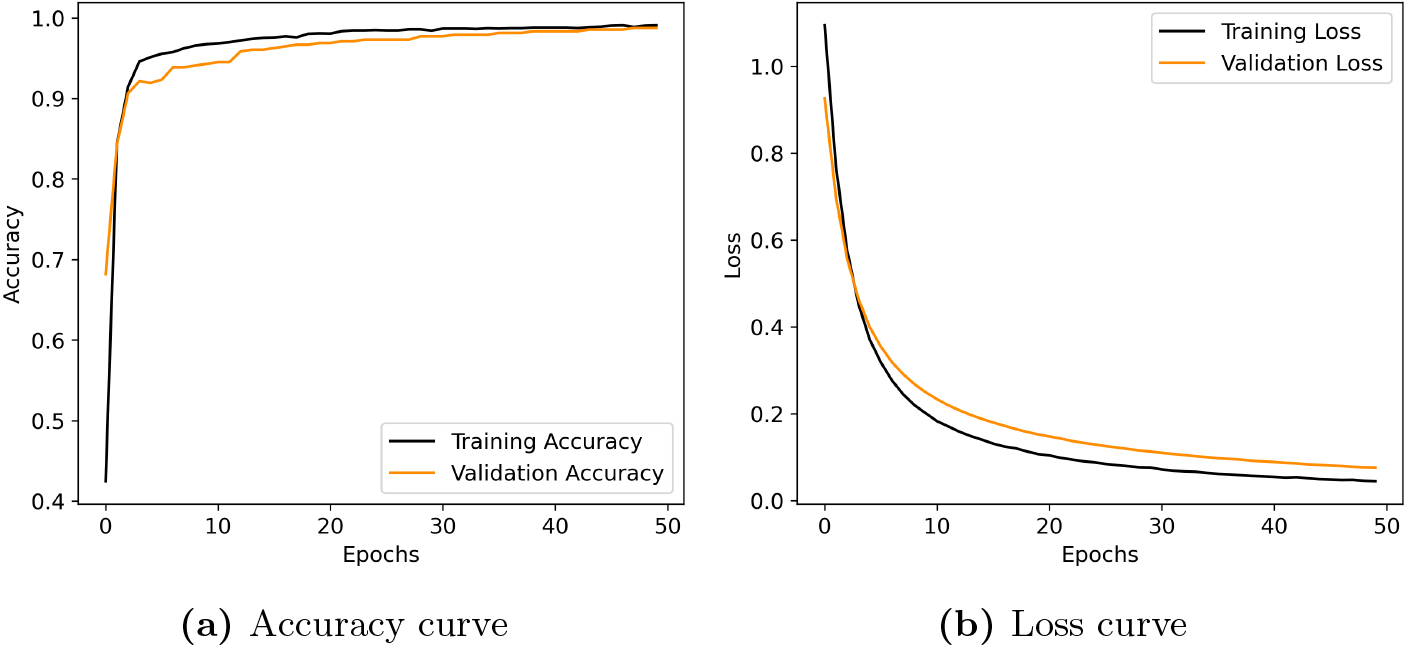
Confusion matrix and ROC curve of ViT model.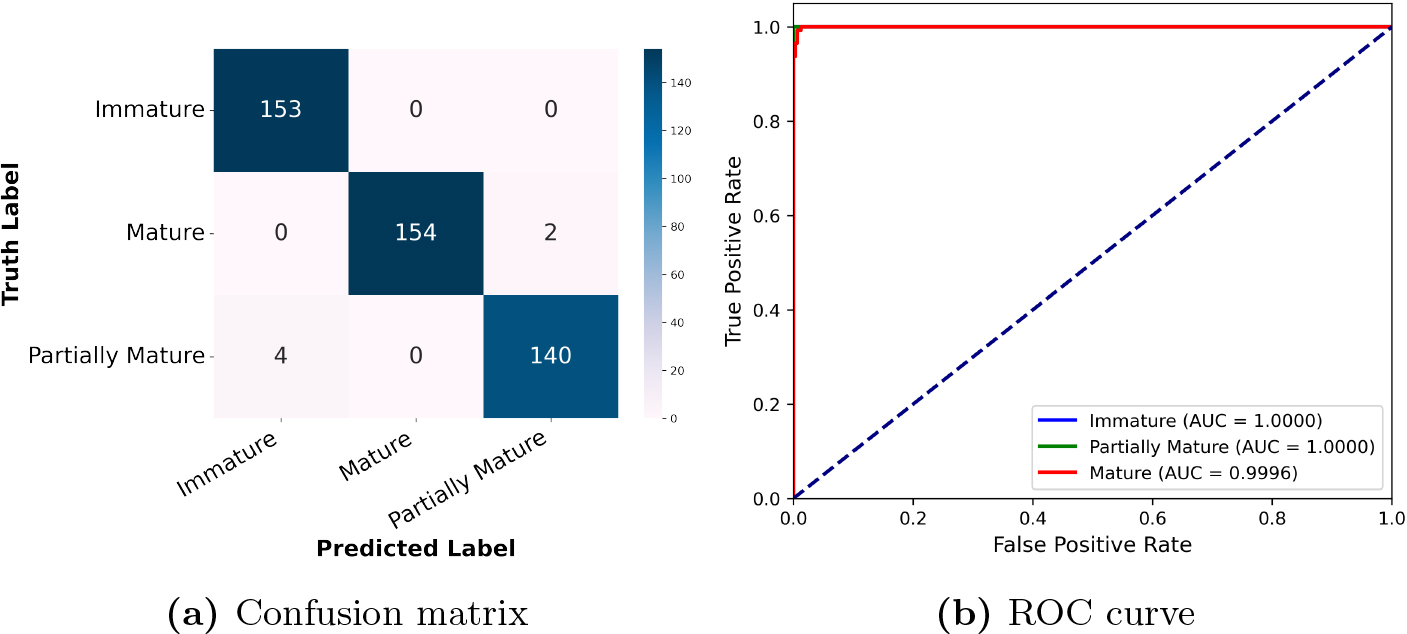
Based on the loss and accuracy curves, training was halted at epoch 50 to deploy the best iteration of the model just before overfitting effects. The model parameter state at the optimal checkpoint will be saved for tomato maturity detection on new datasets. The confusion matrix (Fig. 5a) was constructed on a test set of 453 tomato images classified into immature, partially mature and mature ripeness levels. The model achieved an overall accuracy of 98.67%, correctly predicting 153 out of 153 immature tomatoes, 154 out of 156 mature tomatoes, and 140 out of 144 partially mature tomatoes. This reliable identification capability is evidenced by the high diagonal confusion matrix counts complemented by robust precision and recall metrics for all ripeness categories. The high precision and recall for all the class classes confirm the model’s exceptional capability in detecting tomato maturity image samples. The ROC curve (Fig. 5b) metric demonstrates that, in the immature and partially Mature class, the AUC is 1, representing a perfect model for classifying the immature and partially mature class. Similarly, for the mature class, the AUC of 0.9996 is extremely very high, illustrating the model’s strong capability to distinguish the mature category accurately.
This section presents a quantitative evaluation of CNN models, such as EfficientNet B1, EfficientNet B5, EfficientNet B7 Inception V3, ResNet50, and VGG16, for classifying tomato ripeness from images. The models were trained over 50 epochs, with their evaluations in the form of the validation accuracy. The models achieved strong performance, with validation accuracy ranging from 91.02% to 98.75%, reaching 50 epochs. The top performers were ViT at 98.75%, ResNet50 at 95.89%,VGG16 at 94.23%, InceptionV3 at 93.3%, EfficientNetB1 at 93.07%, EfficientNetB5 at 92.56%, and EfficientNetB7 at 91.02% validation accuracy.
Accuracy and loss distribution of CNN models in the training process.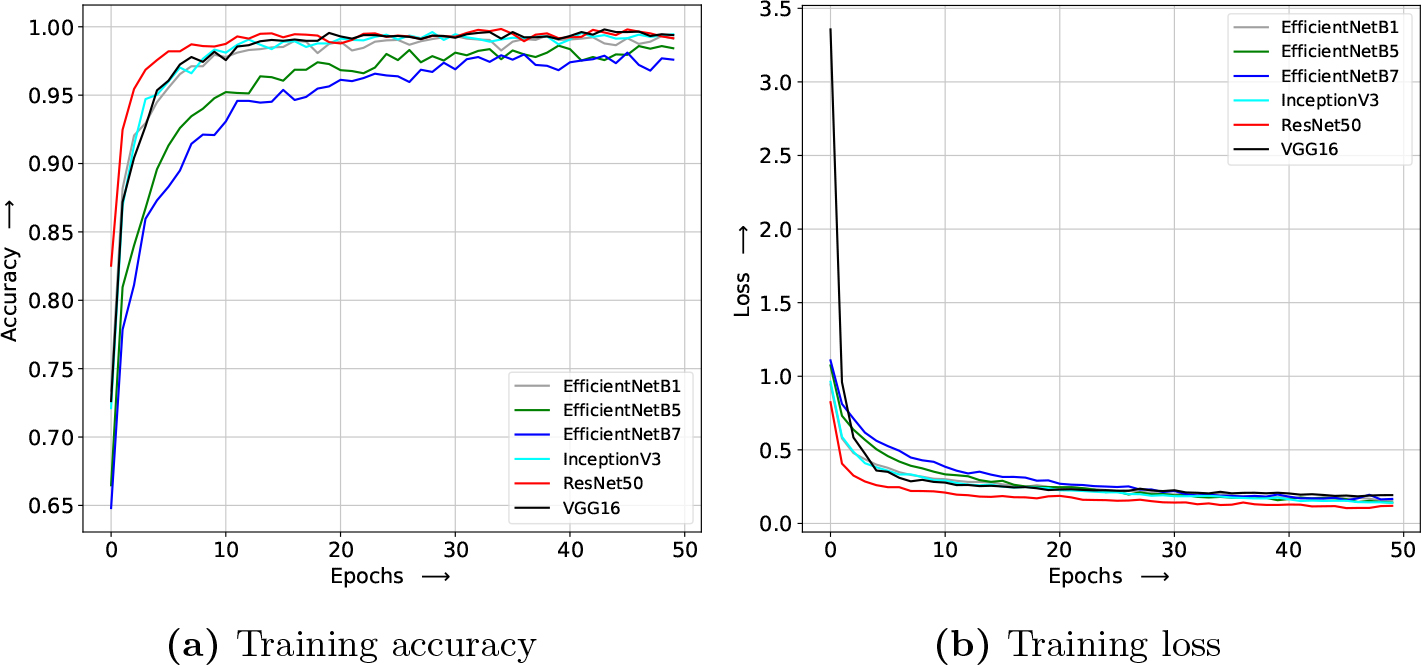
Accuracy and loss distribution of CNN models in the validation process.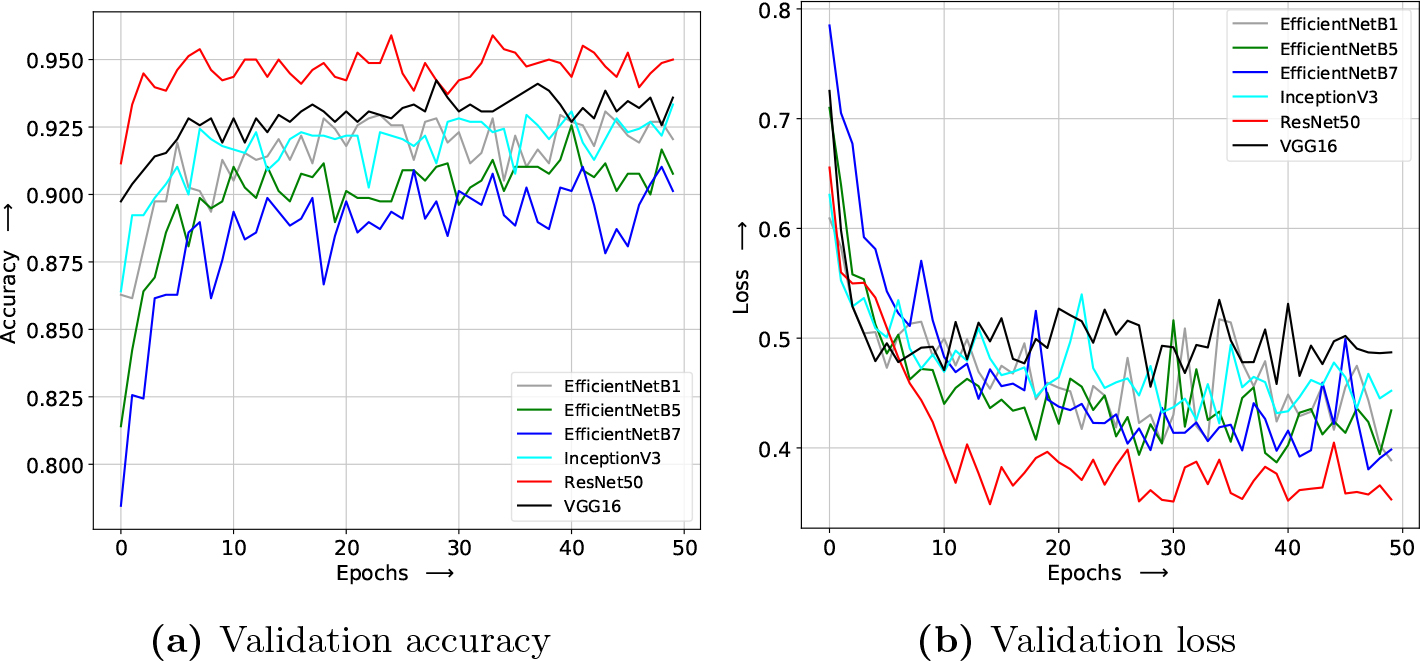
The EfficientNetB1 model steadily improves training and validation metrics over 50 epochs. Starting from 0.73, training accuracy (Fig. 6a) climbs gradually to 0.99, aligned with the training loss (Fig. 6b), dropping from 0.94 to 0.15. Similarly, validation accuracy (Fig. 7a) rises steadily from an initial 0.86 to nearing 0.9307, while the validation loss (Fig. 7b) decreases from 0.61 to 0.47. Taken together, these curves demonstrate the model effectively learning patterns from the training data and transferring those gains to improved predictions on the unseen validation data over time.
Confusion matrix and ROC curve of EfficientNetB1 model.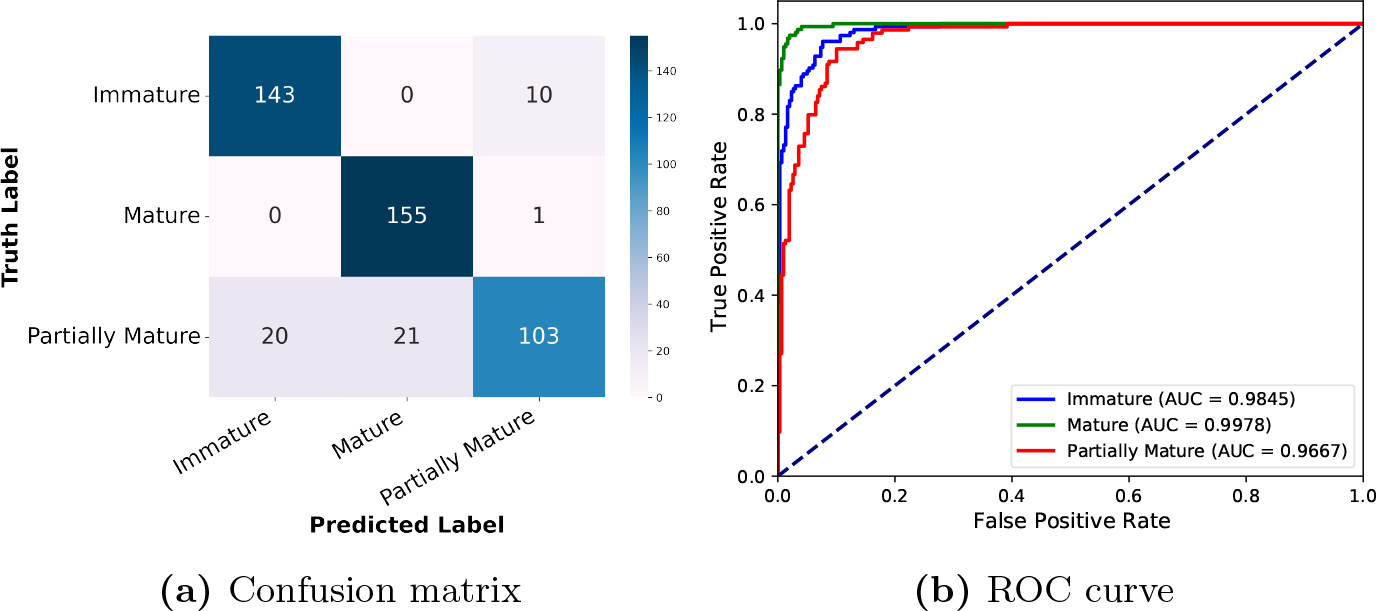
The confusion matrix is shown in Fig. 8(a), which displays the model’s categorisation across the three maturity classes: Immature, Mature, and Partially Mature. The model identifies the Mature class, with an exceptional 0.9978 AUC shown in Fig. 8(b) reflecting near-perfect true positives and minimal false positives. Classification also reliably distinguishes immature instances, with a strong 0.9845 AUC (Fig. 8b). However, some overlap exists between immature and partially mature, seen through more errors between the pair and a comparatively lower 0.9667 AUC (Fig. 8b) for partially mature. Testing accuracy achieved 88.52%, which indicates the model capably categorises maturity level from the available training data.
This model demonstrates strong, stable learning throughout training. It starts with high initial training (Fig. 6a) and validation accuracy (Fig. 7a), around 0.664 and 0.814 respectively, indicating good initial performance. Rapid gains in the first ten epochs improve training accuracy to 0.97 and validation above 0.908 Both continue gradual gains through the 50 epochs, ending at peak values of 0.986 training accuracy and 0.9256 validation. The training (Fig. 6b) and validation loss (Fig. 7b) curves exhibit a decreasing trend in learning the model effectively. This aligned progress demonstrates effective optimisation and a robust modelling approach. The confusion matrix (Fig. 9a) shows a reliable classification, with a large predominance of examples accurately assigned to their true classes, as seen in the strong diagonals. The ROC (Fig. 9b) curves also showcase impressive distinction of the three classes, with AUCs of 0.9879, 0.986, and 0.9693 showing balanced true positives and false alarms for immature, mature and partially mature, respectively. Additionally, The model achieved 89.84% testing accuracy for unseen data.
Confusion matrix and ROC curve of EfficientNetB5 model.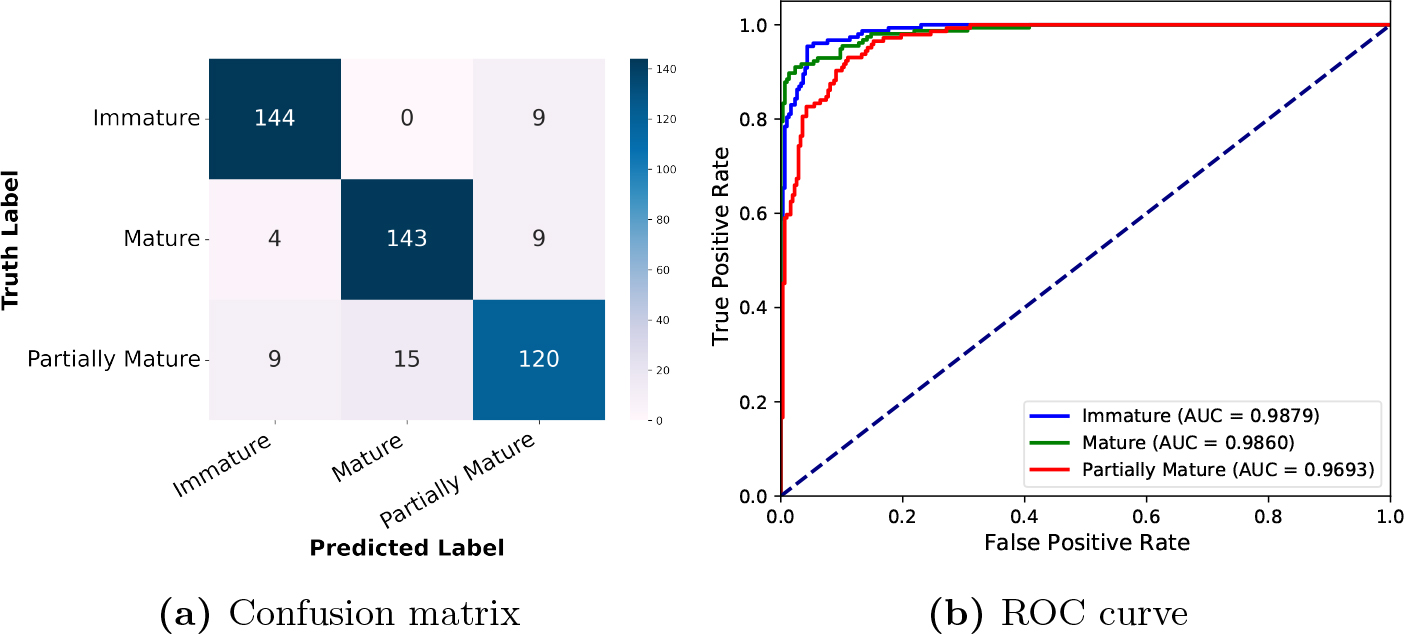
This EfficientNetB7 model starts with 0.64 training accuracy (Fig. 6a), with rapid gains to a final value of 0.981. However, smooth training loss (Fig. 6b) descent from a competitive 1.11 to 0.156 shows more gradual refinement. Validation accuracy (Fig. 7a) precisely ties top results at 0.91 but followed marginally alternate early dynamics before sharing the 0.38 final loss (Fig. 7b) and achieved 91.16% testing accuracy. Validation accuracy (Fig. 7a) precisely ties top results at 0.91 but follows marginally alternate early dynamics before sharing the 0.38 final loss (Fig. 7b) and achieved 91.16% testing accuracy. The confusion matrix (Fig.10a) displays reliable classification with strong diagonals and indicates minimal confusion between partially mature and mature classes. Meanwhile, AUCs (Fig. 10b) of 0.9886, 0.9965, and 0.9708 demonstrate balanced true and false positives distinguishing immature, mature and partially mature respectively.
Confusion matrix and ROC curve of EfficientNetB7 model.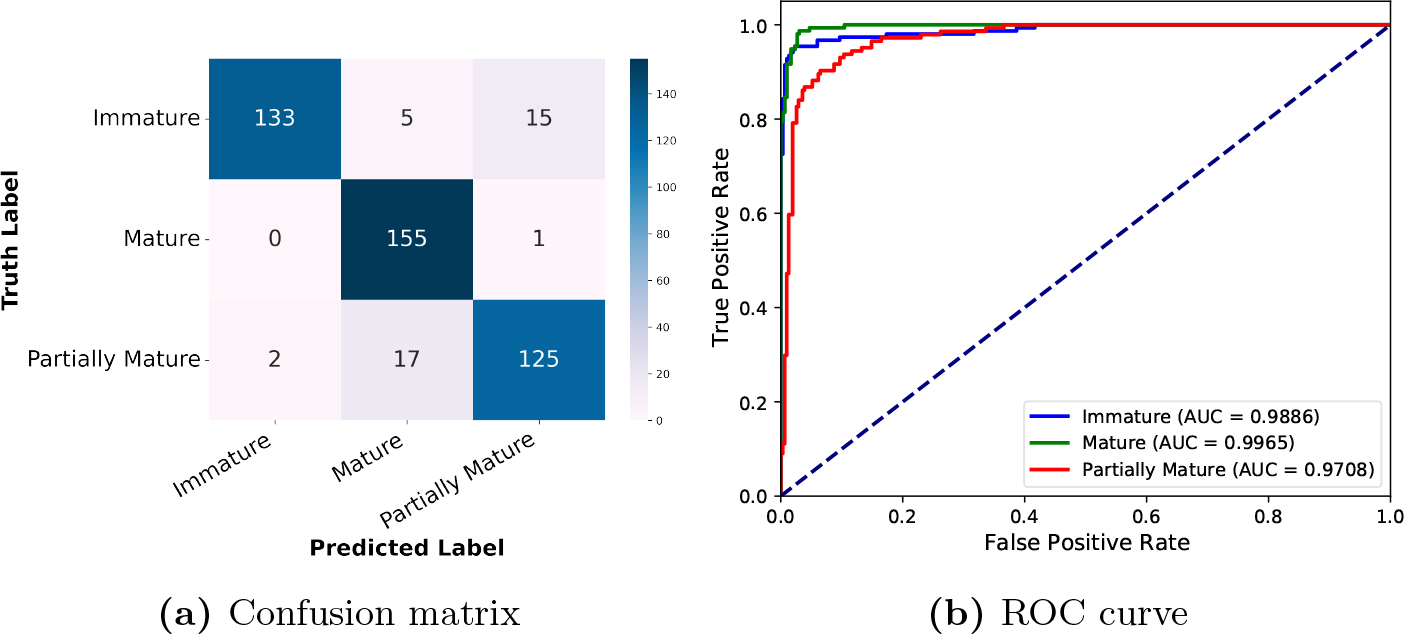
The training accuracy (Fig. 6a) of the InceptionV3 model exhibited a remarkable ascent, starting from a modest 0.72 and increasing to an impressive 0.97. This means the model learned the training data very well. Simultaneously, the training loss (Fig. 6b) experienced a sudden decline, starting from 0.96 to 0.24 within the first 20 epochs before gradually descending to a respectable 0.14. The validation phase also commenced with a strong performance, as the accuracy surged from 0.86 to an impressive 0.926 over the initial 30 epochs. However, the metrics reached a plateau unexpectedly early, attaining a maximum accuracy of 0.9333 (Fig. 7a) and a corresponding loss of 0.422 (Fig. 7b). The confusion matrix (Fig. 11a) revealed generally accurate categorisation, although a partially mature class introduced some confusion, resulting in an overall testing accuracy of 90.84%. Furthermore, the ROC (Fig. 11b) analysis demonstrated the model’s capability to separate classes effectively, with an average AUC of around 0.9873.
Confusion matrix and ROC curve of InceptionV3 model.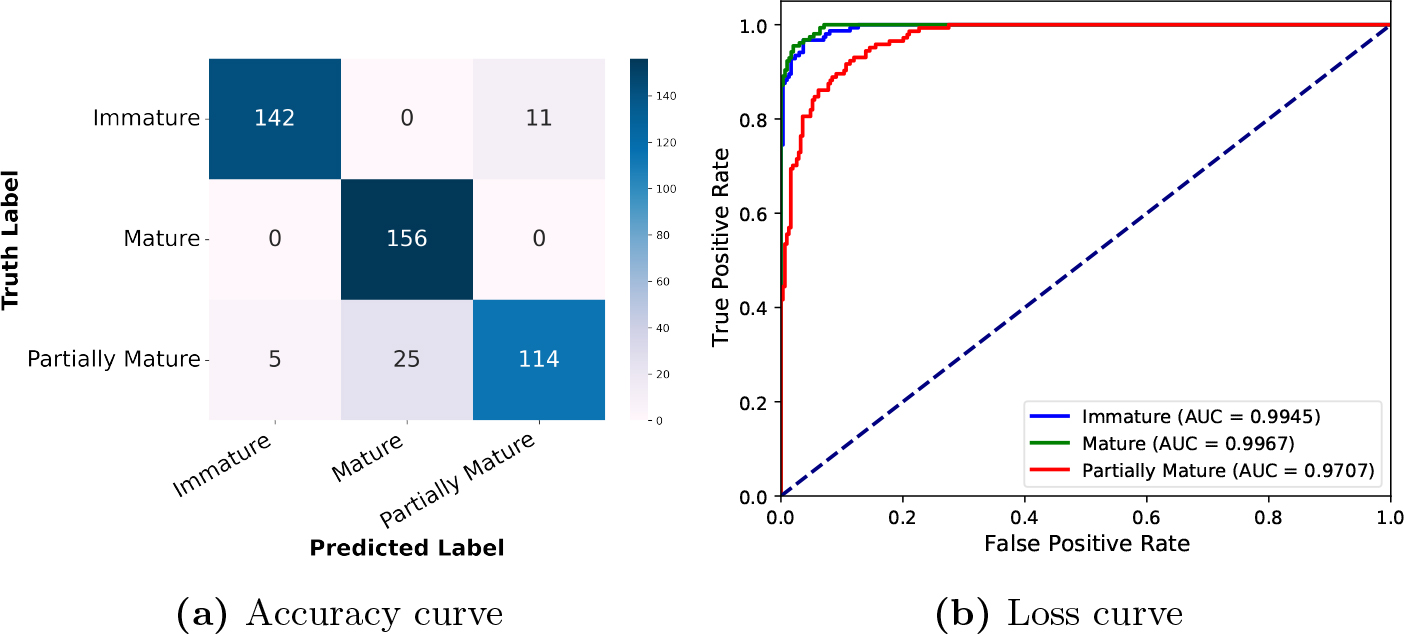
The ResNet50 model exhibits rapid initial learning, with training accuracy (Fig. 6a) increasing from 0.82 and loss (Fig. 6b) decreasing to 0.83. Accuracy plateaus below the peak performance of other models, with gains slowing from 0.96 onwards, while loss reduction decelerates from 0.43. The validation phase reinforces this trend, with accuracy starting at 0.91 and loss at 0.65, subsequently validation accuracy (Fig.7a) and loss (Fig. 7b) reached after 50 epoch at 0.95 and 0.34 respectively.
Confusion matrix and ROC curve of ResNet50 model.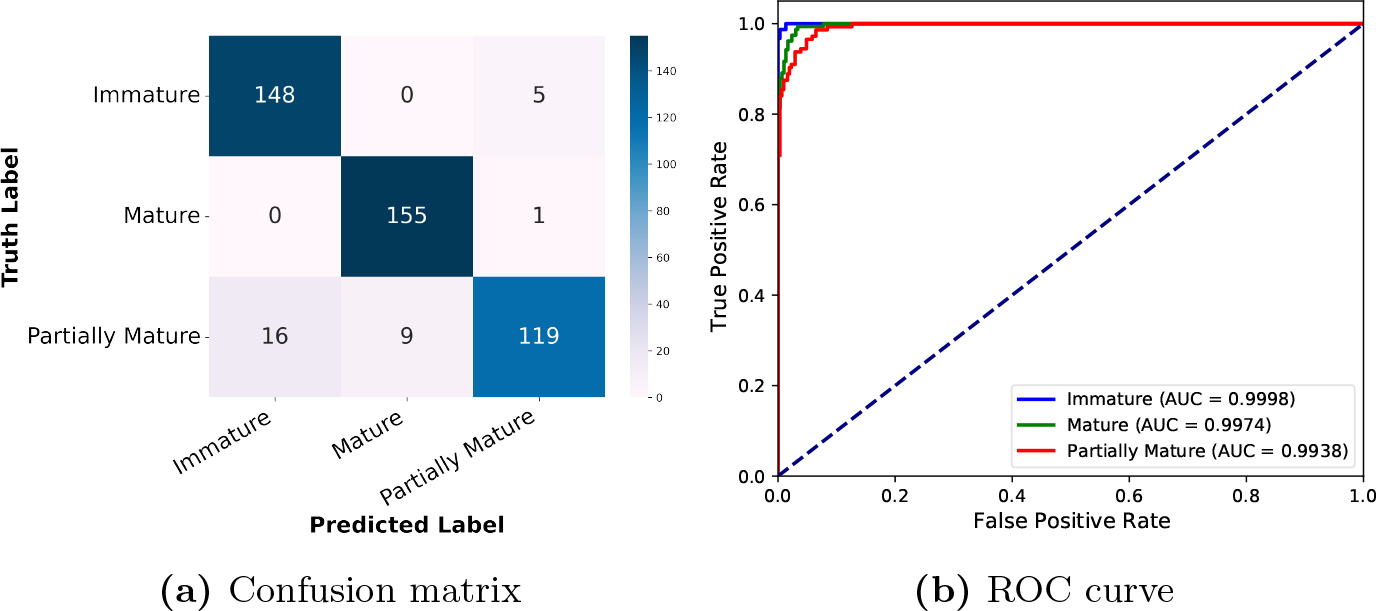
Confusion matrix and ROC curve of VGG16 model.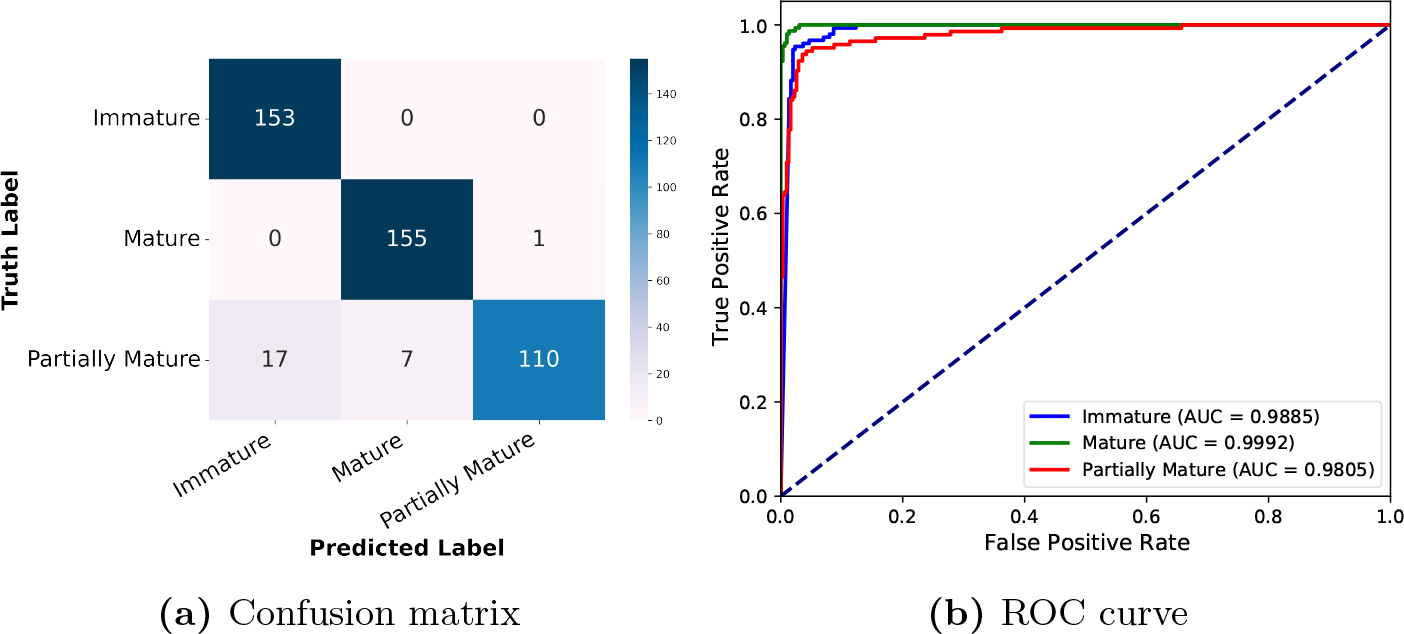
The confusion matrix (Fig. 12a) reflects classification results with strong diagonals and minimal off-diagonal errors. Meanwhile, ROC (Fig. 12b) analysis shows middling distinction, with AUCs all below top performers at 0.9998, 0.9974, and 0.9938 for immature, mature and partially mature, respectively. The ResNet50 model’s attainment of a 93.15% testing accuracy on the test dataset indicates promise in its ability to classify the maturity levels within a tomato dataset.
The training process of the VGG16 model was unpredictable and showed a lot of ups and downs. Initially, the model’s accuracy (Fig. 6a) started low at 0.726 but saw a significant improvement around epoch 10 with 0.954, eventually reaching an accuracy of 0.998. However, the journey was not smooth. The loss (Fig. 6b) started at 3.35, the highest among all losses but experienced sharp changes within five epochs with 0.69, ending at 0.18 after 50 epochs. The validation process (Fig. 7), which tests the model on new data, was even more unstable. Both accuracy and loss had significant fluctuations throughout the training and validation. Accuracy (Fig. 7a) began at 0.89, dipped, recovered, and then dropped again before reaching 0.94. The loss (Fig. 7b) was erratic and ended at a slightly disappointing 0.46. These fluctuations suggest that the model’s learning was not steady and was affected by random factors that made its performance vary significantly at different times. Despite these challenges, the model managed to achieve a decent testing accuracy of 92.27%.
The model handles three-class classification (Fig. 13a) separating Immature, Mature, and Partially Mature examples. The performance peaks identify the Mature class with an exceptional AUROC (Fig. 13b) of 0.9992, reflecting a near-flawless true positive rate with minimal false positives. The classifier also reliably distinguishes Immature items as shown through a strong 0.9885 AUC. However, decision boundaries between Immature and Partially Mature groups display some overlap, evident through a comparatively moderate 0.9805 AUC for Partially Mature.
Performance of deep learning models on test data.
Performance of deep learning models on test data.
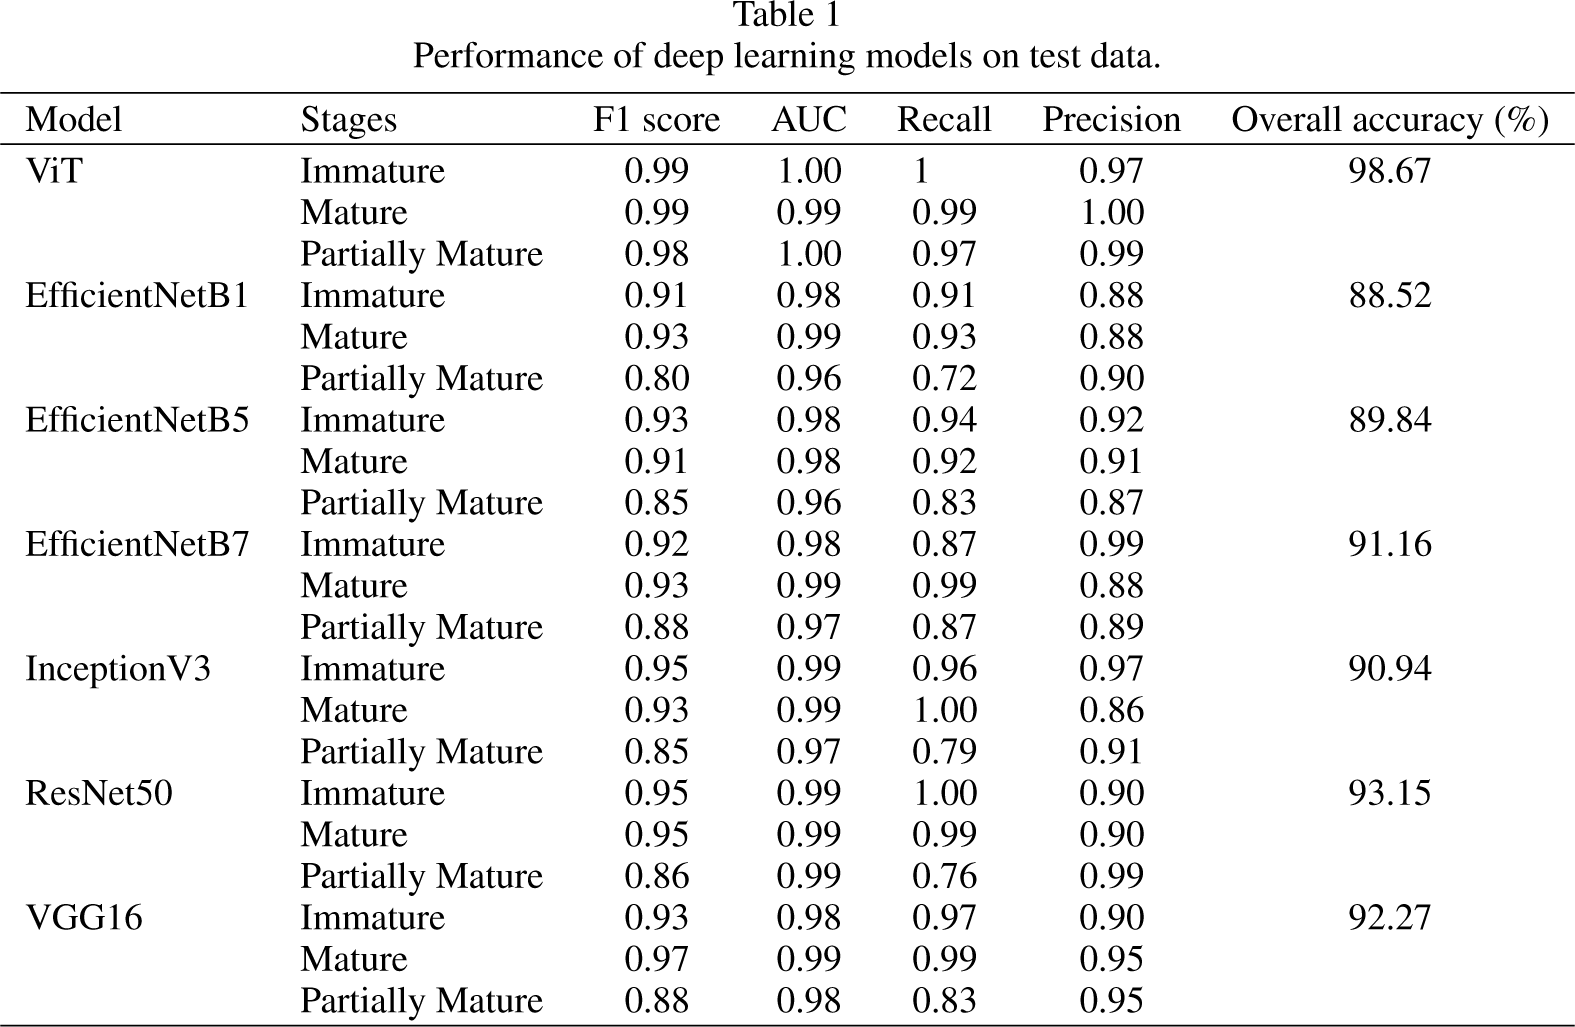
ViT model and CNN architectures were examined, including EfficientNetB1, EfficientNetB5, EfficientNetB7, InceptionV3, ResNet50, and VGG16. The quantitative analysis revealed strong model performance for non-invasive tomato maturity evaluation. The ViT architecture outperformed CNN models and achieved 98.67% testing accuracy in classifying the three ripeness stages. Additionally, other metrics are considered in the Table 1 for model evaluation, such as F1 score, AUC, precision, and recall, ViT presents an attractive solution for agricultural industry applications balancing accuracy and efficiency.
This study proposes a ViT model for the non-invasive evaluation of tomato ripeness stages surpassing CNNs. The ViT model achieved a testing accuracy of 98.67% and compared with CNN architectures, such as EfficientNetB1 (88.52%), EfficientNetB5 (89.84%), EfficientNetB7 (91.16%), InceptionV3 (90.94%), ResNet50 (93.15%), and VGG16 (92.27%). The top performer from all CNN models, ResNet50, attained 93.15% accuracy, which was 5% less than that of the ViT model. This remarkable high accuracy and strong performance of the ViT model was achieved due to its self-attention mechanism, which captures long-range dependencies and global relationships within the image more effectively than CNNs and highlights the importance of a transformer-based model for tomato maturity assessment. Combining the advantages of transformer models in modelling long-range dependencies in image data with transfer learning from large-scale pre-trained models, the ViT model could learn different stages of ripeness classification from the limited training data. Revolutionising crop management, the transformer-based ripening stage classifier emerges as a game-changer in precision agriculture. The integration of the transformer-based ripening stage classifier into various technological platforms, such as mobile applications, computer systems, and embedded devices, opens up a wide range of possibilities for monitoring crop maturity throughout the entire agricultural supply chain. This could lead to significant reductions in food waste, higher profits, and improved decision-making by optimising harvesting time, which leads to an efficient and sustainable agricultural system that benefits all producers.