
Abstract
Financial analysts constitute an important element of financial decision-making in stock exchanges throughout the world. By leveraging on argumentative reasoning, we develop a method to predict financial analysts’ recommendations in earnings conference calls (ECCs), an important type of financial communication. We elaborate an analysis to select those reliable arguments in the Questions & Answers (Q&A) part of ECCs that analysts evaluate to estimate their recommendation. The observation date of stock recommendation update may variate during the next quarter: it can be either the day after the ECC or it can take weeks. Our objective is to anticipate analysts’ recommendations by predicting their judgment with the help of abstract argumentation. In this paper, we devise our approach to the analysis of ECCs, by designing a general processing framework which combines natural language processing along with abstract argumentation evaluation techniques to produce a final scoring function, representing the analysts’ prediction about the company’s trend. Then, we evaluate the performance of our approach by specifying a strategy to predict analysts recommendations starting from the evaluation of the argumentation graph properly instantiated from an ECC transcript. We also provide the experimental setting in which we perform the predictions of recommendations as a machine learning classification task. The method is shown to outperform approaches based only on sentiment analysis.
Introduction
Earnings conference calls are one of the most important types of financial communication. As soon as their periodic results are announced (typically quarterly earnings reports), publicly-listed corporations organise a teleconference, or webcast, in which the financial results are presented to and discussed with financial analysts. The main participants to this regular communicative event are the corporate executive managers (the Chief Executive Officer and the Chief Financial Officer in particular) and financial analysts, whose institutional role is that of scrutinising corporate statements and formulate recommendations for investors who own or may wish to buy the shares of the company. ECCs follow the release of the company’s quarterly earnings announcements and are divided in two main parts [1]: first, corporate executives present the period results with analysts put in a listen-only mode (presentation part); subsequently, analysts take the line and ask questions to which corporate representatives reply immediately. Often, a question turn includes several questions which are dealt with by different corporate executives. Follow-up questions are possible. An independent operator manages the call.
As [2, 3] explain, the participation in an ECC is motivated by both informative and rhetorical objectives. Analysts are interested in getting valuable information that can help them construct reliable recommendations, which in turn help investors in making more accurate investment decisions (buy, hold or sell shares). At the same time, companies have an interest in releasing information and clarifying matters because a better informed market leads to a lower cost of capital for them. ECCs are in fact forms of voluntary, not compulsory, disclosure which by definition are motivated by strategic objectives rather than compliance duties. Obviously, corporate managers strive to persuade analysts to positively evaluate the firm results and, by linking results to managerial actions, to induce a positive impression about their image and reputation. This makes ECC an inherently rhetorical genre where a variety of communicative strategies can support managerial objectives.
The linguistic content of ECC has been studied in financial accounting studies and, in more recent years, by scholars in communication disciplines, such as linguistics, argumentation and rhetoric (for a systematic literature review, see [4]). The former have been particularly interested in determining the informative value of these disclosure events, with some evidence of the Questions & Answers (Q&A) part being incrementally informative over the presentation part and the presentation part being incrementally informative over the earnings announcement preceding the call [5]. However, less evidence exists on the actual causes and sources of such informativeness. Taking a discourse-analytics perspective, [2] hypothesises that the presence of argumentation acts as a relevant factor making the content of ECC informationally useful and price sensitive. While their analysis is limited to the Q&A part without examining the possible impacts on market events (e.g. stock prices, volatility, volumes, analyst recommendations), numerous argumentative patterns are brought to light which suggest argumentation plays a decisive role in this context.
We are interested in the argumentative and dialogical patterns arising in ECCs, and the present paper could be broadly placed within the recent body of research in Argument Mining (see [6] for an excellent introduction), and in particular related to works such as [7–10], or to opinionated claim mining [11]. This paper addresses however the less explored issue of the evaluation of arguments, in terms of their persuasive effect, recognised as a challenge by many [12]. In this sense, this paper is in the spirit of works such as [13–15], though it provides a more operational and pragmatic evaluation measure, derived from the context we explore.
Related to our approach is also work aiming at providing high-level representations of debate interaction such as [16] or [17], which developed and studied graph-theoretic representations of parliamentary debates in the Netherlands and, respectively, the UK. Inasmuch as our work bridges computational abstract models of argument, and argumentation in real world domains, it contributes to a wider on-going research effort aiming at making argumentation technology significant for applications (cf. [18]).
In this paper we propose a novel approach to the analysis of ECC, especially during their Q&A component, which is grounded in computational argumentation. We focus on the type of interaction between analysts and corporate representatives (essentially, who talks to whom and with what tone, cf. [16, 17]) and are interested in studying whether, and if so how, this interaction has an effect on analysts’ recommendations. We collected ECC transcripts concerning 10 major companies in the 2007-12 period. In line with [19], to model the argumentative interaction occurring in the Q&A of these ECC we used bipolar weighted argumentation frameworks (BWAF, [20]) where we considered as basic units of analysis—or, ‘arguments’—each intervention by an analyst or corporate representative, and provided specific NLP-based metrics to recognise relations of attack or support among these interventions. Once an ECC has been modeled as a BWAF we single out ‘strong’ arguments in the ECC using a novel ranking-based semantics specifically developed for the analysis of ECCs. Our hypothesis is that such ‘strong’ arguments carry more weight in influencing the analysts’ perception of the ECC. The obtained BWAFs, their analysis, together with data on analysts’ recommendations, as well as financial performance indicators for the relevant companies have then been used to create a novel dataset amalgamating argumentative and financial information. To the best of our knowledge, this is the first data set of its kind in the computational argumentation literature, covering financial as well as argumentative features. With this data set, using off-the-shelf machine learning techniques, we show that incorporating argumentative features in the learning task improves prediction of analysts’ recommendation over techniques using only sentiment analysis (e.g., [21]). This finding corroborates the hypotheses put forth in [2] that argumentative structure carries informational value for analysts in ECCs, and in [22] that an abstract model of the local sentiment flow captures the overall argumentation regarding global sentiment.
The paper is organised as follows. Next section recalls the background and basic concepts on abstract argumentation theory useful for our analysis, Section 3 develops the method as a general processing framework divided into four phases: natural language processing model, bipolar weighted graph instantiation, semantics evaluation and tone-based evaluation. Section 4 performs the experimental setting to validate our approach. Finally, Section 5 concludes the paper.
Background
The section introduces the toolbox from abstract argumentation theory that will be later used in our analysis of ECCs.
Bipolar weighted argumentation frameworks
Dung’s Argumentation Frameworks [23] (in short, AF) play a special role in the representation of argument interaction: arguments are nodes in a directed graph, edges in such graphs represent attack relations among arguments, and graph-theoretic notions (e.g., stable sets or kernels) acquire natural argumentative interpretations as ‘reasonable’—with respect to different intuitive standards—sets of arguments. An argumentation semantics is the formal definition of a method ruling the argument evaluation process. The most basic concepts shared by all argumentation semantics in the literature are conflict-freeness (i.e., an attacking and an attacked argument can not stay together) and defense (i.e., replying to every attack with a counterattack). In this way, an attacker a of an argument b is an argument at the beginning of an odd-length path, while a defender a of b is an argument at the beginning of an even-length path. Dung’s original formalism for abstract argumentation has been extended along many lines giving rise to a large and thriving literature in AI (see [24, 25] for an overview). The extensions that are relevant for the purpose of this paper are two: bipolar argumentation frameworks, and weighted argumentation frameworks.
A Bipolar AF (BAF) [26] is an extension of Dung’s AF in which two kinds of interactions between arguments are possible: the attack relation and the support relation. A BAF can be represented by a directed graph in which two kinds of edges are used, in order to differentiate between the two relations. In BAFs, new kinds of attack emerge from the interaction between the direct attacks and the supports: there is a supported attack for an argument b by an argument a iff there is a sequence of supports followed by one attack, while, there is an indirect attack for an argument b by an argument a iff there is an attack followed by a sequence of supports. In particular, we assume to say that a supports b if there is a sequence of direct supports from a to b. Taking into account sequences (i.e., paths) of supports and attacks it is possible to revise Dung’s definitions of acceptability applying to sets of arguments.
A Weighted AF (WAF) [27] is another extension of Dung’s AF in which attacks between arguments are associated with a weight, indicating the relative strength of the attack. Note that allowing 0-weight attacks is counter-intuitive since it can be interpreted as absence of attack relation. In this framework, some inconsistencies are tolerated in subsets S of arguments, provided that the sum of the weights of attacks between arguments of S does not exceed a given inconsistency budget
A Bipolar Weighted AF (BWAF) [28] incorporates both above generalizations of Dung-style AFs. The idea behind it is to allow not only weighted attack relations between abstract arguments, but also weighted support relations. This is achieved by assigning to each relation a weight which can be positive or negative.
Given two arguments abw-defendsb if the product of weights abw-attacksb if the product of weights
As you can see in Fig. 1, a BWAF can be represented as a directed graph whose nodes represent arguments, relations represent attacks (with normal arcs) and supports (with dashed arcs), and weights represent the relative strength of relations. In what follows we will often abuse our notations and use G to denote the whole BWAF or its underlying directed graph. BWAFs introduce a generalised notion of defense based on the concept of transitivity of a multiplication rule in which: (i) it is loose the basic Dung’s notion in which even-length paths of attacks means a defense (i.e., the attack of an attack is a defense); (ii) BAF’s notions of indirect attack and supported attack are both covered by a single definition.
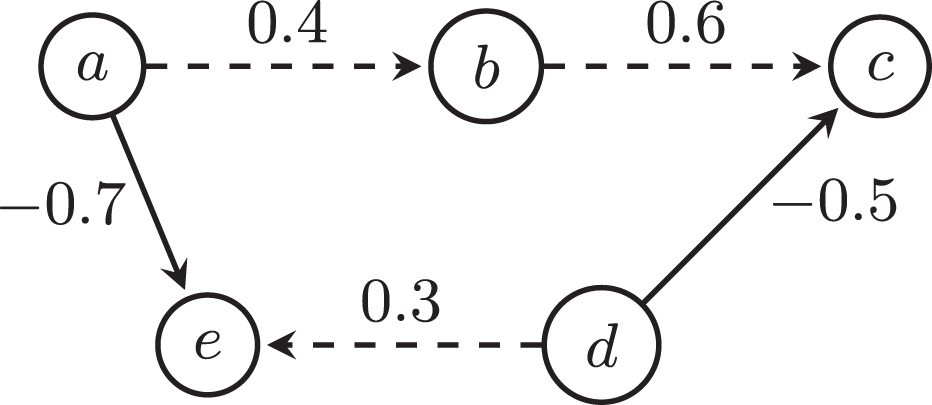
G1: Example to illustrate BWAF.
such that
BWAFs will be used in this paper as an abstract representation of argumentative interaction in the Q&A of an ECC. So once an ECC is represented as a BWAF, we need a computationally feasible method to automatically analyze the BWAF in order to single out ‘influential’ interactions—or ‘strong’ arguments—in the framework. This calls naturally for the application, to BWAFs, of ranking-based semantics [29] methods. Intuitively, a ranking-based semantics determines, for any framework—in our case BWAFs—a ranking of the available arguments in the form of a pre-order (reflexive and transitive relation). In our case, given that BWAFs will be extracted from real data, we want the ranking process to be computationally viable. This rules out the application of existing ranking-based semantics for BWAFs, the so-called sp-semantics [20]. In fact, we may exploit this semantics due to its ability to deal with weighted cycles by exploring all the possible paths (with eventually cycles and sub-cycles) between any pair of nodes in the graph, but for large graphs this may result computationally expensive [30].
Instead, for the purpose of this paper, we leverage matrix algebra methods, recently addressed in [31], to exploit a particular approach to argument ranking in BWAFs, which we refer to as Laplacian Ranking semantics. We do not claim this semantics to be of general applicability for the analysis of argumentation, but rather to be an effective tool for the analysis of the specific form of argumentation which is the focus of this paper.
Laplacian semantics
Spectral graph theory provides techniques that apply the theory of linear maps (in particular, eigenvalues and eigenvectors) to matrices that do not represent geometric transformations, but rather some kind of relationship between entities. It studies the properties of graphs via the eigenvalues and eigenvectors of their associated graph matrices: the adjacency matrix and the graph Laplacian and its variants. In the following we consider the possible benefits of adopting spectral linear algebra methods as a tool for analyzing argumentation structures. Mathematically speaking, studies in Abstract Argumentation semantics are concerned with the properties of numerical measures on directed graphs. Matrix theory is an important field of Linear Algebra used in particular for representing and handling graphs. Given a directed graph G on n nodes, the adjacency matrix of G is an n × n matrix
Critically, an alternative matrix representation of a BWAF makes it possible to obtain explicit numerical information about the effect of an argument i over an argument j, through defense or attack paths. Such representation is called the Justification Matrix (of the underlying BWAF G). Let
Notice that for an arbitrary BWAF G,
In general, for any n × n matrix
In BWAFs that contain cycles
1
the power series computation of
Intuitively, the degree matrix of a BWAF is a diagonal matrix which contains information about the sum of weights of the edges connected to a node.
3
In yet other words, the degree matrix
So we assign an ‘acceptability’ degree to each argument in a BWAF G, which equals its degree in
A key objective of our analysis of ECCs consists in being able to automatically recognise which arguments are likely to be the most relevant in a given ECC transcript. To this aim we design a general processing framework, which is divided in four fundamental phases: natural language processing model, bipolar weighted graph instantiation, semantics evaluation and tone-based evaluation. The natural language processing (NLP) model is carried out to analyze the text of the ECC transcript and the graph building procedure to perform a mining task of both recognizing arguments and identifying relations between them, jointly modeling an argumentation structure that is, in this case, the BWAF.
Given an ECC to be analysed (see for instance Fig. 2), we apply a processing procedure that progressively splits the Q&A part of the ECC transcript into arguments, and analyzes the sentiment of each argument. After that, we build the relations between arguments that are exploited to generate a BWAF. Each relation is a couple 〈question, answer〉 or 〈answer, question〉 whose weight represents the degree of attack/support between them. The resulting BWAF is exploited to generate a ranking of acceptability for arguments in which they can be evaluated as either accepted or rejected with a different degree. Finally, we design a procedure to evaluate the final trend of the ECC with a scoring value. Such aggregation measure, derived from the evaluation of the BWAF, will be used to predict the recommendation rating of the analysts involved.

Seeking Alpha web page of the ECC transcript (Q&A part only) of Microsoft Corp. in the 3rd quarter of 2012.
Each paragraph in the transcript is assumed to be a single (abstract) argument. The NLP Model is in charge of extracting the sentiment of each argument. To quantify sentiment, we initially need to determine which arguments are positive or negative. This is accomplished by exploiting a dictionary of words. The Stanford CoreNLP toolkit [34] provides a set of natural language analysis tools, including the sentiment analysis (SentimentAnnotator) and various programs which support it. Such a model can be used to analyze text as part of StanfordCoreNLP by adding “sentiment” to the list of annotators.
Stanford CoreNLP (SC for short) is therefore exploited to extract sentiment from arguments. There is a drawback however: its sentiment dictionary uses only a standard English dictionary to classify words as negative or positive. This is not fully exploitable when the text to be analysed is finance-related. For instance, if an argument exposed in an ECC transcript contains a disproportionate number of terms like “shortfall” and “decline” then it is reasonable to think that its sentiment is negative. To solve this problem we use a financial dictionary [35] (LM for short) with customised lists of negative and positive words specific to the accounting and financial domain. LM provides a clear demonstration that applying a general sentiment word list to accounting and finance topics can lead to a high rate of misclassification. For example, words like “mine”, “cancer”, “tire” or “capital” are often used to refer to a specific industry segment. These words are not predictive of the tone of documents or of financial news and simply add noise to the measurement of sentiment and attenuate its predictive value. 4
For the above reasons, the overall tone of each argument is computed by averaging the tone coming from both the SC and LM dictionaries. The combination of SC and LM dictionaries is exploited and then combined to accomplish the positive and negative word frequencies into the sentiment, or tone, of the arguments. The mean between SC and LM is required to capture both the general discourse made in English (by SC) and "adjusted" by LM to better remark the sentiment for words coming from financial vocabulary. To assess tone, we collect the number of positive words (# pw), and the number of negative words (# nw), so that, given a sentence s, we can simply define its tone as:
Bipolar weighted graph instantiation
The BWAF instantiation task from the Q&A section of an ECC can be divided into two steps: definition of abstract arguments, and definition of relations between them.
tone (q i ) = mean (SC (q i ) , LM (q i ))
add an attack 〈q
i
, a
j
〉 in
add a support 〈q
i
, a
j
〉 in
tone (a j ) = mean (SC (a j ) , LM (a j ))
add an attack 〈a
j
, q
i
〉 in
add a support 〈a
j
, q
i
〉 in
Step (1) splits the Q&A part of the ECC transcript into arguments, each of which is associated to a participant of the conference call. To the extent of representing the rightful flow of arguments and counterarguments in the exchange of questions and answers, the set of arguments is partitioned into two subsets: arguments put forward by analysts (i.e., questions), and those put forward by executives (i.e., answers). The arguments are gathered from the ECC transcript considering each paragraph as a single abstract argument. In this step, interventions of the operator, who is in charge of managing the discussion, are neglected. Once all the arguments are collected, we have to connect them through a weighted relation of attack or support. For a given argument, one can infer its sentiment, which is typically described as the degree to which the argument reflects positively or negatively to the company.
Step (2) relates arguments to one another according to a specific criterion. In the Q&A part of an ECC, this task is not trivial as for each question one or more answers may follow. These interactions result in an attack or a support between the question and an answer, and vice versa. Since questions by different analysts never refer to previous questions, there is no relation between questions, or between the next analyst’s question and the previous answers. Also, executives’ answers are not related to each other, since they respond specifically to a question and cannot bridge to the next question by asking them a question. The algorithm for edge building in BWAF instantiation is provided in Algorithm 1, and can be summarised as follows: for each analyst’s question q
i
, add an attack/support relation starting from it towards all the answers a
j
before the next question qi+1; for each executive’s answer a
j
, add an attack/support relation starting from it towards the question q
i
before the next question qi+1.
The resulting instantiated BWAF has then a particular structure: since questions do not relate to each other, and neither do answers, the graph structure is bipartite, and it is composed by a collection of all complete sub-graphs representing the exchange of arguments between the analyst’ questions and the executives’ answers in response to it. As an example Fig. 3 depicts the BWAF instantiated from the Q&A section of the ECC of Microsoft Corp. in the third quarter of 2012. It is important to note that when the tone of an argument is totally neutral, and hence equal to 0, the assumption is to assign an attack of strength null.

G2: BWAF representation of the ECC Q&A part of Microsoft Corp. in the 3rd quarter of 2012.
Once the BWAF has been instantiated, we exploit the Laplacian ranking-based semantics introduced in Section 2. It should be stressed that such a ranking-based semantics is particularly suited to the analysis of bipartite BWAFs 5 instantiated from ECCs given that their structure consists of various fully connected sub-graphs, and given that ECC transcript may be large, the fact that the Laplacian semantics builds on established and computationally well-behaved 6 techniques from matrix algebra make it a good fit for our purposes in this work. We are interested in evaluating the analysts’ confidence in the trend of the company, based on the ECC. Therefore, from the Laplacian ranking of arguments in the Q&A, we initially filter only the accepted arguments, i.e., those ones with a ranking greater than or equal to 0. Then, we establish a ranking of winning questions, i.e. the ranking of accepted analysts’ questions only. We focus on winning questions because questions (and how they are replied to) is what would sway an analyst’s opinion.
Let us illustrate the above process through an example:
deg(a3) =0.75, deg(q5) =0.75, deg(q42) =0.56, deg(q11) =0.47, deg(q45) =0.37, deg(a29) =0.33, deg(a6) =0.32, deg(a26) =0.17, deg(a51) =0.15, deg(a34) =0.08.
We can then identify the winning questions: W Q = {q5, q42, q11, q45}, which are, specifically, the following ones:
q5 = “I was just wondering, Peter, a few years ago, and you might not have been CFO at the time, you guys had talked about online and what your goals were 5 years out, and talking about 20% organic market share and that could get you to breakeven. I mean, given what we’re seeing in terms of RPS, although you’re doing a very good job on the OpEx side, how would you say you’re thinking about that today?”
q42 = “I was having a forward-looking question on the gross margin. Remember in the last few quarters where you had a slight negative mix effect there. As I look into the new product launches into the next year, is there anything – they’re all kind of high gross margin areas. Is there anything that stops that feeding through in the P&L? Or should it be a straightforward one?”
q11 = “And will Skype be a big benefit to that division going forward?”
q45 = “This past quarter, both Gartner and IDC saw a better-than-expected PC uptick in the European corporate market. And your reported Windows revenues certainly support that. I know broadly speaking the business refresh was healthy. Just was wondering if there’s anything you would add that might have contributed to an uptick in Europe PC growth.”
Tone-based evaluation
For a given Q&A section of an ECC, we need to determine a relevance value in order to predict analysts recommendations with a significant positive or negative tone. The working hypothesis is that analysts must be updating their beliefs using argumentative information obtained during these calls. For this reason, [36] studied how analysts revise their beliefs in response to new information depending on the tone of the ECC. Starting from this assumption, we combine tone-based textual analysis and the solution inferred through the BWAF semantics in order to generate a relevance value.
We therefore aggregate Laplacian-based acceptability degrees (Definition 3), which are determined by exploiting the tone of each argument, among the selected ones and from them we determine a final scoring value. For this task, we devise three different scoring functions: Global Average Tone represents the average tone of the whole Q&A without distinguishing between executives and analysts. Intuitively, investors may simply follow managers’ tone in financial disclosures, even though their tone may not exactly represent the underlying fundamentals of the firm. Formally, ∀α
i
∈ A s . t . |A| = n, i = 1, …, n:
Analysts Majority Tone represents the average tone of winning questions rankings. Formally, ∀q
i
∈ Q s . t . |Q| = k and deg(q
i
) >0, i = 1, …, k:
Weighted Analysts Majority Tone represents the average tone of winning questions rankings, mediated by the number of answers each question receives. Formally,
Global Average Tone: -0.0297 Analysts Majority Tone: 0.266 Weighted Analysts Majority Tone: 0.011784
Experiments
We now study to what extent the framework detailed in the previous section can help predicting analysts’ recommendation in buying, holding or selling company’s stocks. In what follows, we describe the procedures adopted for: gathering the data, executing the general processing framework of the NLP sentiment model, BWAF instantiation, Laplacian-ranking semantics evaluation, and final tone-based scoring value, learning the machine learning classification model.
Dataset construction and framework processing
Given the novelty of the study, we needed to build an original dataset. We gathered first the data on historical analysts’ recommendations. Zacks encompasses the full range of investment information required to effectively manage individual and institutional US equity investment processes. Zacks Data 7 can be used to empirically analyze analysts’ forecasts and their revisions, price targets and recommendations. This is a proprietary data set, whose historical analyst recommendations data we could access through a free trial for the Wharton Research Data Services (WRDS) 8 , which is a data research platform providing access to U.S. equity investment data, market data systems and data from Zacks. We gathered analysts recommendations from 10 companies, from 2007 to 2012. Table 1 reports the list of companies involved in the experiments and their corresponding sector.
Companies in Stock Market NYSE and NASDAQ
Companies in Stock Market NYSE and NASDAQ
The data required to retrieve ECC transcripts came from Seeking Alpha 9 , a well-known platform for investment research, with broad coverage of stocks, asset classes, ETFs and investment strategy. This website contains publicly available conference call transcripts for US stocks and ADRs (American Depositary Receipt). We can have free access to the texts online on Seeking Alpha. As there are so many transcripts, getting them manually is very inefficient. With the help of web scraping techniques in Python, and regular expressions, we captured all transcripts automatically. Three main Python libraries were used to scrape the data: BeautifulSoup4, Urllib2 and Requests.
An ECC transcript on Seeking Alpha is made up of four parts: list of executives (E); list of analysts (A); Corporate Presentation Session (CP); Question & Answers Session (Q&A).
Each conference call transcript was then split into three parts, neglecting information about CP, since it is focused only on the message transmitted by the executives team, with no analysts’ participation. The Q&A Session part was cleaned by the operator’s interventions, and we assigned to each argument, i.e., paragraph in the transcript, the corresponding participant (either an analyst or an executive). Sometimes transcripts may report an unidentified analyst, so we adjusted the assignment to a generic participant qualified as analyst. API for SC and LM dictionary were available in Python and exploited to assess tone, and NetworkX was used to build the BWAF. Then, Laplacian-ranking semantics was developed with Numpy and Scipy. Finally, the three tone-based evaluations were assessed for each ECC transcript. Not all the transcripts were available on Seeking Alpha, especially the oldest ones. Then, by collecting all the available data from WRDS, Seeking Alpha, and Yahoo Finance (for contextual information about companies), the dataset was finally ready for the prediction analysis. The gathered data consisted of 153 entries, and is the first dataset of this kind for financial analysis ever built
10
.
In order to predict analysts recommendations, the next step was to generate relevant features. The features are really important because these are what we were suggesting is predictive of the target variable. Our target variable is the recommendation, i.e. a class of the following type: Strong buy; Buy; Hold; Sell; Strong Sell.
In this phase we compare our performance results with a baseline. For this task, our baseline is the overall tone of the whole ECC, i.e. the average sentiment coming from the analysis of the entire transcript, considering both CP and Q&A sessions. For the baseline, this sentiment score associated to each ECC will be the only feature to train our model, since this is the approach currently considered state-of-the-art in financial research on ECCs [37]. Instead, for our argumentation-based approach, the features of our model are the three tone-base evaluation scores, aiming at proving that the underlying rationale of argumentation can better explain the informational relevance of the Q&A part of an ECC.
No recommendation for class 5 (Strong Sell) were present in the dataset. Therefore, we dealt with a Machine Learning problem of multi-class classification with 4 classes to be predicted. Since there is not perfect machine learning algorithm for a particular application, we decided to test several machine learning algorithms before a particular algorithm is selected. This is done mainly for the following reasons: Evaluate the prediction performance differences between the baseline and our approach; Evaluate which machine learning algorithm better fits this kind of financial and sentiment data; Discuss on which “argumentative features” and machine learning algorithm may have a preferential choice and a higher impact when facing with the inferential task of using abstract argumentation to classify an object.
Therefore, we chose to run the following machine learning algorithms:
Python libraries Pandas and scikit-learn [48] were exploited for this task. The data was randomly split into testing (20%) and training (80%) sets, and each model was trained and tested. The performance measure to validate the test set was accuracy. In multi-class classification, this corresponds to subset accuracy, which is a harsh metric since it is required for each sample that each label set is correctly predicted. To avoid overfitting, we performed also a 5-fold cross validation. It is common practice when performing a (supervised) machine learning experiment to hold out part of the available data as a test set. The training set was split into 5 smaller sets. A model is trained using 4 of the folds as training data and the resulting model is validated on the remaining part of the data (i.e., it is used as a test set to compute the accuracy performance measure). Then, the activity of splitting the data, fitting the model and computing the score is repeated 5 consecutive times (with different splits each time). The performance measure reported by 5-fold cross-validation is then the average of the values computed in the loop. We hence collect the overall accuracy score, the accuracy of each fold of the cross validation and the related mean score together with the confidence interval of the score estimate.
We report in Table 2 the results obtained for all the machine learning algorithms with the baseline dataset. While in Table 3 are reported the results obtained for all the machine learning algorithms with our argumentative features dataset. We highlight in Table 4 the comparison between our approach and the baseline performances. For all the tables, entries are ordered by decreasing mean accuracy score, giving an immediate overview of which algorithms achieved better performances (and which ones performed worse).
Baseline Performances
Baseline Performances
Argumentation-based Performances
Cross Validation Mean Accuracy Comparison
Regarding the Baseline performances, we note that SVM, MLP, LR, GPC, and RC achieved all the same results, with a mean score accuracy of 51.68%. NB, RF, DT, GBC, and KNN (with K = 3) performed worse, instead. Actually, all baseline performances show bad accuracy scores, thus showing to be not highly predictive. Taking into account our argumentation-based approach, we note that SVM, MLP, and RF achieved higher performances, with a mean score accuracy of 77.27%. LR, GPC, and RC performed quite the same, with 76, 6% mean score accuracy. KNN (with K = 3), GBC, DT performed a bit worse, while NB achieved the worst performances. The likely reason behind the achievement of the exactly same result for most classifiers lies in the composition, sampling number, and splitting methods of the dataset, since training machine learning models with only 122 training data (with 80-20% train-test splitting) is sometimes not sufficient to fit a good generalised model. Anyway, by looking in particular to Table 4, 9 machine learning classifiers out of 10 performed better with our argumentation-based approach. This gives to our approach a clear value, certifying that machine learning algorithms perform better when argumentation-augmented features have been exploited.
Another insight discovered from our experimental approach regards the choice of a particular machine learning algorithm with better classification performances. We note that SVM and MLP achieved better accuracy scores in both baseline and argumentation-based approaches. In general, the “No Free Lunch” theorem applied to classifiers states that there exists no optimal classifier [49]. This means that one could always find a case where a classifier is outperformed by another. In other words, it is not guaranteed that a particular classifier will perform better than all others. This is the main assumption that encouraged us to run several machine learning algorithms. As general rules of thumb about what to expect from the outcomes we have that, on the one hand, since SVM is obtained by minimizing the structural risk, it is expected to do better than other classifiers. On the other hand, since MLP has the ability to discover the non-linear relationship in the input data set without a priori assumption of knowledge of relation between the input and the output, it is expected to achieve good performances, in particular with financial data, given that the existence of the non-linearity and volatility is propounded by many financial analysts. Because of the nature of our fresh dataset, the obtained results may therefore witness that on tone-based financial data, SVM and MLP achieve better performances. This may give a hint for data scientists when facing tone-based financial data.
The paper reported on an application of computational argumentation techniques to the analysis of an important form of financial communication: earnings conference calls (ECCs). Our approach shows that incorporating suitably processed argumentative information in the analysis of ECCs leads to strong predictions of analysts’ recommendation, suggesting that argumentative and dialogical features present in ECCs carry informational value for analysts. In doing this we also contributed a novel data set incorporating both argumentative and financial features, as well as a fresh ranking-based semantics for BWAF based on insights from matrix algebra. We put in evidence that computational argumentation can help to improve performances in a classification task due to the fact that the reasoning over conflicting information (which in this case are features of a predictive task) strengthen the informational power of the starting features.
This work represents a first step towards the deployment of computational argumentation techniques in the domain of financial communication. The model built is likely to be improved by including data about more companies and over a longer period of time. We plan to build a wider dataset, that we previously could not do but that our work shows is worth doing. Furthermore, our argumentation-based approach, which focused on analysts’ recommendations, may be tested against other forms of financial estimations, such as Earnings Per Share (EPS), Surprise and Estimates prediction, stock returns, and stock prices.
Footnotes
The BWAFs we will be studying will mostly be of this type.
In fact for each a
i
and a
j
both 〈a
i
, a
j
〉 and 〈a
j
, a
i
〉 belong to
The name ‘Laplacian semantics’ derives from the fact that, in graph theory, the Laplacian matrix of a graph G is given by the difference
Although not relevant for our study, the LM dictionary has the additional benefit of covering dimensions of interest beyond the traditional dichotomy positive/negative. Worth mentioning are the Uncertainty word list that attempts to measure the general notion of imprecision (without an explicit reference to risks), and the Litigiousness word list that may be used to identify potential legal problem situations.
A further advantage of exploiting the Laplacian matrix of BWAFs for ECCs is that the Laplacian matrix has only nonnegative eigenvalues (it is positive-semidefinite), and its eigenvectors can be used for grouping the nodes of the graph into clusters, and hence enhanced analysis may be run on clusters of questions, or answers, or even better, on sentences from a particular analyst or executive.
Notice in particular that the diameter of the instantiated graphs is always 2.