
Abstract
Click fraud is the sort of deception in which traffic figures for online ads are intentionally inflated. For businesses that advertise online, click fraud may occur often, resulting in erroneous click statistics and lost funds. That is why many businesses are hesitant to advertise their products on websites and mobile apps. To market their products safely, businesses need a reliable technique for detecting click fraud. In this paper we present a stacking algorithm as a solution to this problem. The proposed method’s premise is to combine multiple learners to achieve an optimal result. The Synthetic Minority Oversampling Technique (SMOTE) with a combination of undersampling are chosen to handle the unbalanced dataset. In the first-level learners, there are four supervised Machine Learning algorithms, which are AdaBoost, Random Forest, Decision Tree and Logistic Regression. Moreover, Logistic Regression is used again as a the second-level learner. To verify the efficacy of the suggested approach, comparative tests are carried out on the public dataset available on Kaggle from China’s largest independent big data service platform TalkingData. Multiple indicators, such as Accuracy, F1 Score, ROC curve, Loss Log and AUC Score, are utilized to analyze the prediction outcomes. The findings reveal that the stacking method improves forecast accuracy while also maintaining a high level of stability.
Introduction
Online digital advertising has become the most visible and successful type of marketing in the last decade for many organizations [2]. Naturally, content creators transform traffic into an income stream by providing ads to their visitors and having them click on those ads. This business model is currently a dominant force on the Internet, with the market size in 2021 projected to be 189.6 billion dollars [4].
Unfortunately, in addition to unparalleled benefits and opportunities, the advent of digital advertising has brought with it an abundance of problems. The most serious of which is advertising fraud, i.e. deceit through manipulation of views, clicks, and web pages [2]. The real harm caused by advertising fraud is difficult to calculate, however it has been estimated that the global loss is in the billions of dollars. In fact, Juniper Research estimated that publicity fraud cost advertisers more than 19 billion dollars in 2018 [1], representing about 9% of total digital advertising spent. Furthermore, the World Federation of Advertisers estimates that by 2025, ad fraud would cost advertisers over 50 billion dollars every year [21].
Advertisers and publishers both employ the Pay-Per-Click (PPC) business model. The PPC works so that advertisers are paid on a regular basis as a user clicks on the advertisement. Click fraud, which is the focus of this paper, can result in one of two outcomes: either third-party websites receive an increase in their income or the advertiser’s budget decreases without any corresponding business results. According to Xu et al. [14], click fraud occurs when a fraudster sends an HTTP request to the destination URL of the displayed advertisement. Said click fraud is conducted both by human clickers and click bots.
Motivated by the aforementioned statistics and the work mentioned in the next section, the aim of this paper is to find a sensible solution to detect click fraud. The proposed methodology targets the prediction of fraudulent clicks through Machine Learning. The main contributions of this paper are summarized as follows: The train/test split is designed to test our approach as closely as possible to a real environment. We pay particular interest and make use of the preprocessing on the whole dataset. From which we engineer seven new features. The use of undersampling and the SMOTE algorithm to handle the unbalanced dataset. Utilizing the Boruta algorithm to identify the importance of engineered and selected features and remove unnecessary variables. A click fraud classification approach based on stacking is proposed and found to outperform several other Machine Learning algorithms. Lastly we perform several test to demonstrate the stability of the proposed algorithm.
The remainder of this paper is arranged in the following manner: in Section 2, we give an overview of related works. The Stacking classification algorithm, the SMOTE (synthetic minority oversampling technique) algorithm, the Boruta algorithm, and many indices are all discussed in Section 3. Furthermore, the section covers data sources, preparation procedures, research methodologies and ideas employed in this work. Section 4 delves into comparative studies and analyzes the prediction outcomes in depth using Accuracy, F1 Score, ROC (Receiver Operating Characteristic) curve, and AUC (Area Under the Curve) and LogLoss. Furthermore, we also compare our approach to previously established methods and explain why ours is a more viable solution in a real environment. To conclude, findings and outcomes of this study are addressed in Section 5.
Related works
This section summarizes the current state of art research on click fraud detection. The fight against advertising fraud and, more specifically, click fraud on the Internet has been ongoing, and there are multiple works that focus on it. To defend against click fraud, Kantardzic et al. [18] presented a multi-modal real-time detection and prevention system. The suggested model is based on the Collaborative Click Fraud Detection and Prevention (CCFDP) system [5], involving client and server protocol communication. Kar et al. [16], on the other hand, developed a unique ensemble-based learning approach for click fraud detection.
Iqbal et al. [17] proposed a unique approach for combating click fraud on the user side called FCFraud. This approach is incorporated into the operating system (OS). According to [17], proper security at the operating system level can save marketers billions of dollars. Additionally, Thejas et al. [12] provided a broad time series model with several scales for predicting click fraud behavior in minutes and hours.
To improve the forecast outcome, most researchers employ various Machine Learning methods to train the same datasets and compare evaluation indexes [10]. Furthermore, as Machine Learning technology advances, the number of algorithms available grows. Minastireanu and Mesnita [8] investigated the accuracy of one of the most current Machine Learning algorithms for detecting click fraud in the online environment. Their work used the same dataset as the one we use in this paper to study click patterns. They used experimental test for LightGBM in particular [9]. They demonstrated that the suggested model outperformed XGBoost and SGB in terms of computational performance and memory use. However, it is worthy to mention that the model could only use 19 attributes/features, and that the model was only trained on a fraction of dataset due to a lack of resources.
Thejas et al. [11] presented the CFXGB (Cascaded Forest and XGBoost) model to solve the problem of click fraud. The CFXGB is a feature transformation and classification model that combines two learning algorithms. The three steps of the model include pre-processing, feature transformation based on Cascaded Forest, and XGBoost model classification.
Click-through problem is quite similar to fraud detection as the data is extremely unbalanced and it switches the problem from detecting fraudulent clicks to just determining clicks from non clicks. Qui et al. [24] proposed an ETCF model that predicts click-through rates. Gradient Boosting is used to alter the features, while GcForest is used to classify the data.
The aforementioned research works provide a valid solution to click fraud. We are particularly interested in Machine Learning. Most of them get one ideal model through model comparison, while the other models are discarded, resulting in a waste of computational power. Besides, advertising datasets are large and flexible, and algorithm stability is critical for real-world applications. However, most research, particularly those using innovative algorithms, failed to include algorithm stability. Thus, in this work, we create a click fraud prediction classification model based on Stacking and perform tests to demonstrate stacking’s stability.
Methodology
In this section we present the different parts of the proposed method, and how they all fit together.
Data source
In this work, the data is collected from the TalkingData dataset from kaggle [3]. It is an AdTracking Fraud dataset which has records of 200 million clicks with eight features over four days. TalkingData is China’s largest independent big data service platform, and it serves more than 70 percent of active mobile devices in the country. They handle 3 billion clicks every day, 90 percent of which are possibly false.
Unbalanced data
Unbalanced datasets are typically a challenge in classification tasks with Machine Learning. This is due to the number of samples belonging to one category in the dataset being considerably higher than the number of samples belonging to other categories. When training unbalanced datasets, to enhance accuracy most classification algorithms tend to classify minority class data samples as majority class data samples. Although such a classifier can attain a certain level of accuracy, it might not produce the wanted outcome [13]. Click fraud datasets are typically extremely unbalanced, practically in the data used in this study less than 1% of clicks achieving the desired result from the ad, more precisely, 498 click to 1 desired click (498:1).
To cope with unbalanced datasets, oversampling and undersampling are extensively used strategies [6]. The primary goal of these two techniques is to reassemble the sample size. Oversampling achieved balance by increasing the minority of samples, whereas undersampling achieved balance by reducing the majority of samples.
The SMOTE algorithm, a KNN-based oversampling technology, is used to handle the unbalanced datasets in this research [19]. It improves on the simple random oversampling approach, which involves randomly duplicating a few samples to expand the sample size, avoiding overfitting and improving the model’s generalization ability. The SMOTE algorithm’s basic process is as follows: The Euclidean distance between each minority sample x and the other minority sample is determined. The sampling rate is determined by the difference between the minority and majority sample sizes, and k nearest neighbors of sample x of a minority class are selected at random. According to the sampling rate defined in step (2), a new sample x
n
may be computed between a few samples x and x
i
using the formula:
It is important to note that even before applying the SMOTE algorithm, we have downsampled the data to take in all the legitimate clicks in a way that they will represent 10% of the data used for training our models. While for testing, we use a test set from the original raw data as given in TalkingData to simulate the real environment as closely as possible.
One of the basic elements of Machine Learning is feature selection, which seeks to minimize redundant information, increase model accuracy, and shorten operation time. Filter, Wrapper, and Embedded are three often used feature selection approaches [20]. The Boruta algorithm is used to pick features in this study. Boruta algorithm is a Random Forest-based encapsulated feature selection technique that evaluates whether a feature should be kept, in addition to determining the relevance of each characteristic to the dependent variable. The Boruta algorithm’s core process is as follows: Create a shadow feature by randomly shuffling the original features to create a shadow feature matrix, then concatenating the shadow feature matrix with the original feature matrix to create the new feature matrix. For training, the new feature matrix is fed through a Random Forest classifier, which outputs the relevance of features v. The original feature and shadow feature’s z scores are computed, and the formula is as follows:
The maximum z
score
, indicated as Z
max
, is searched in the shadow feature. If the z
score
of the original feature is larger than Z
max
, the feature is classified as “important.” If the original feature’s z
score
is less than Z
max
, on the other hand, the feature will be classed as “unimportant” and removed. Repeat steps 1–5 until all of the features have been noted.
Stacking was first introduced by Wolpert [7] and may be thought of as a more advanced variant of cross-validation, utilizing an approach more complicated than crude cross-validation’s winner-take-all strategy for merging individual learners. It is inspired from the concept of ensemble learning, which is based on the combinations of learners. The first-level stacking learner consists of numerous basics learners selected for training the same datasets, and the projected outputs create a new dataset to be transported into the second-level stacking learner [7]. When the first-level learner is the training model, cross-validation may be used to avoid over-fitting. In this study, we apply the k-fold cross-validation approach [15]. Figure 1 depicts the process of stacking techniques.
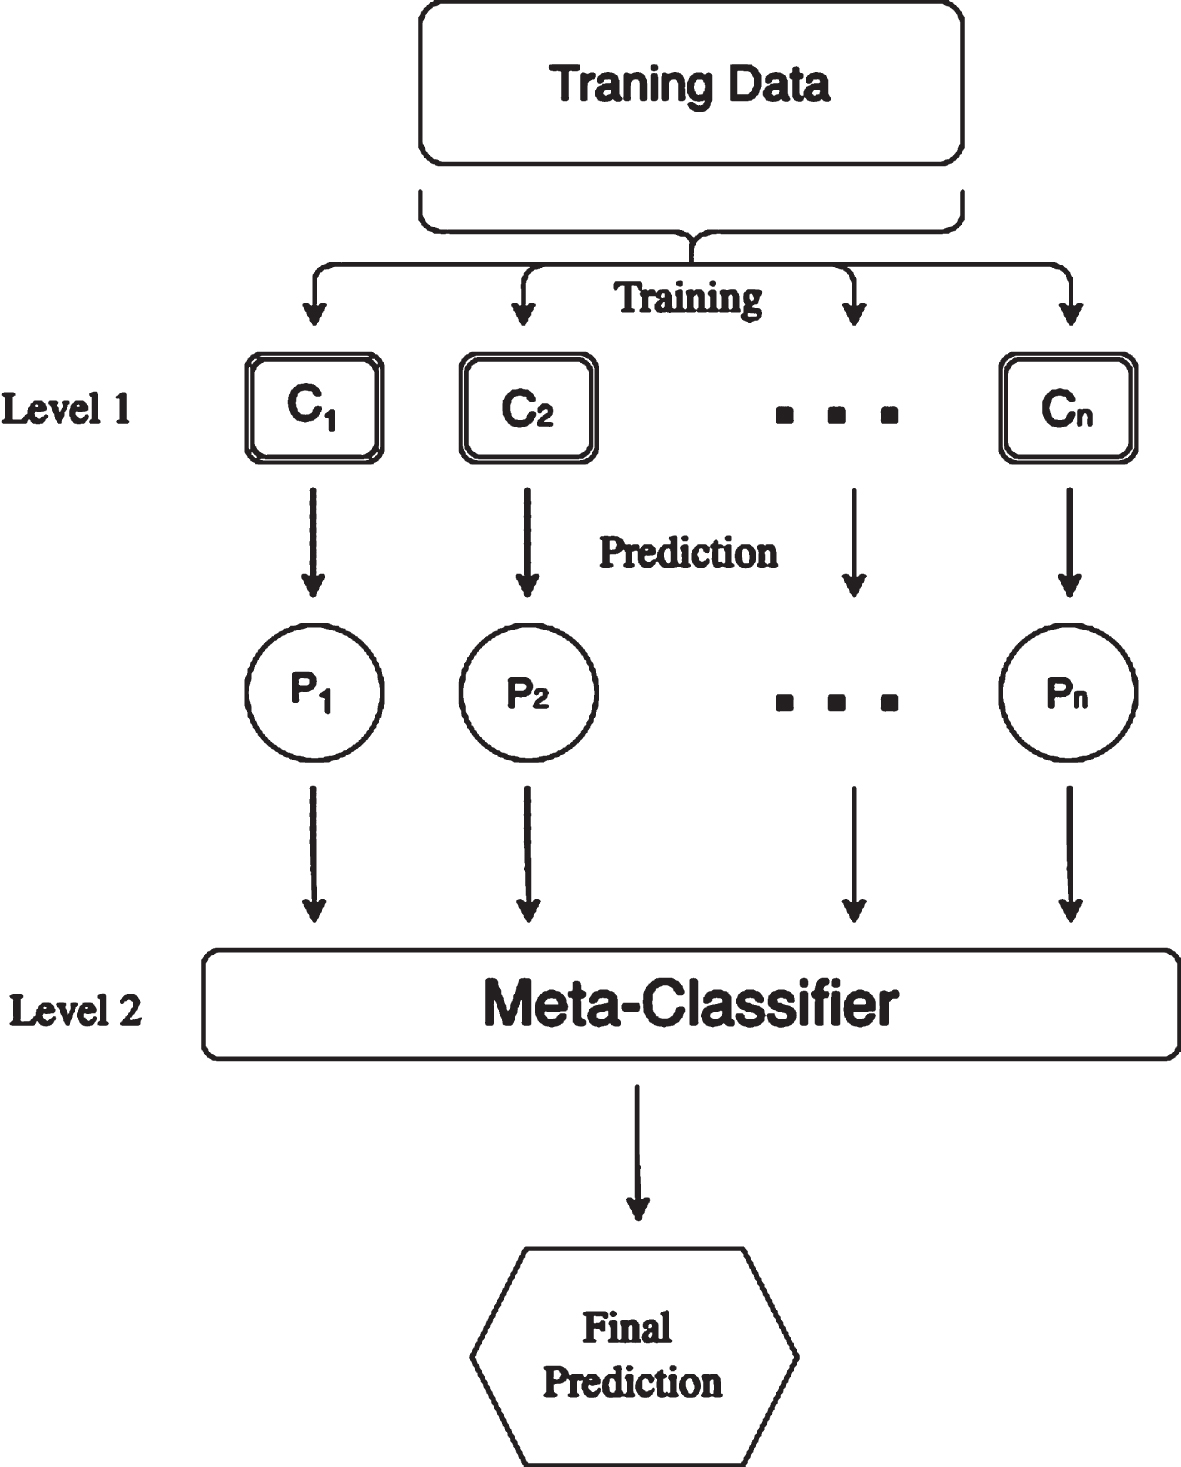
Stacked methods scheme.
For our specific use we implement a stacking model that uses logistic regression, decision tree, random forest, and AdaBoost as base learners, each of these algorithms would be trained on the data independently and would make predictions based on their own models. These predictions would then be combined by a second-level learner, which in this case is logistic regression, to make a final prediction.
The choice of base learners in a stacking model is often guided by the specific characteristics of the data and the desired performance of the final model. Logistic Regression is a simple and fast linear model that is often used for binary classification tasks, making it a popular choice as a base learner. Decision Trees are also a popular choice for classification tasks and are relatively easy to understand and interpret. Random Forest is an ensemble method that can handle complex relationships between features and is generally more robust and accurate than a single decision tree. AdaBoost is another ensemble method that is known for achieving good performance on a wide range of tasks and is often used as a base learner in stacking models.
Overall, the use of logistic regression, decision tree, random forest, and AdaBoost as base learners in a stacking model allows for the combination of the predictions of multiple different models, potentially resulting in a more accurate and robust final model. The use of logistic regression as the second-level learner allows for the combination of the predictions of the base learners in a simple and interpretable way.
To assess the prediction outcomes, the output confusion matrix is used to calculate Accuracy, Precision, Recall, and F1 Score. Table 1 from [22] portrays a confusion matrix.
Confusion Matrix
Confusion Matrix
True Positive (TP) denotes that both the true and expected values are positive, suggesting that the number of positive samples was successfully anticipated. False Positive (FP) denotes a situation in which the real value is negative but the expected value is positive, i.e. the number of negative samples is incorrectly predicted to be positive. True Negative (TN) indicates that both the true and predicted values are negative, i.e. the number of properly predicted negative samples. FN stands for False Negative, which means the real value is positive but the predicted value is negative, i.e. the number of positive samples that are incorrectly predicted to be negative.
The ratio of accurately predicted samples to the total number of samples is known as Accuracy, and the method for calculating it is as follows:
One of the most commonly used assessment measures in classification is accuracy. Because the click data sample is an unbalanced dataset, real clicks have a substantially greater sample size than fraudulent clicks. The model prefers to identify minority samples as the majority in order to enhance accuracy, and while the model can achieve better accuracy, the prediction of fraudulent samples is nearly futile. As a result, in the classification issue, Precision, Recall, and F1 Score are more indicative to assess the projected outcomes.
The fraction of valid predictions in the sample with a positive projected value is known as Precision. The formula for calculating it is as follows:
The fraction of correct predictions in a sample with a positive real value is called Recall. The following is the calculating formula:
In this study, Precision is a measure of the proportion of the model’s predicted fraudulent clicks that are actually fraudulent, whereas Recalla measure of the proportion of the actual fraudulent clicks that are correctly identified by the model. Further, F1 Score, which is the harmonic average of Precision and Recall, can take both into account. Consequently, we will use F1 Score as one of the four main metrics to evaluate this work. The formula for calculating the F1 Score is as follows:
LogLoss (cross entropy) is the training goal function, and it may be computed as follows:
AUC, or Area Under the Curve, is a metric used to evaluate the performance of a binary classifier [23]. It is the area under the receiver operating characteristic (ROC) curve, which is a plot of the true positive rate against the false positive rate at different classification thresholds. The AUC ranges from 0 to 1, where a higher AUC value indicates better classification performance.
The purpose of normalization is to convert the values of numeric columns in the dataset to a common scale while preserving disparities in value ranges. This is only important when the ranges of the features differ. The benefit of data normalization is that many Machine Learning algorithms tend to perform better and it speeds up the training in some cases.
The data in this research is normalized to eliminate the influence of dimensionless disparities across features in the dataset. The goal is to set the data mean to 1 and the variance to 0. The following is the calculating formula to normalize a certain feature X:
In this section we present the results of our experiments. All methodologies and models have been tested on an Amazon Web Services(AWS) SageMaker instance with 8 vCPUs and 16GB RAM. Implementation is done using 2 programming languages; Python 3.9.11 and its packages such as pandas, numpy, sklearn. To determine the feature importance, we mainly used the Boruta package from R v4.2.0.
Feature engineering
Feature engineering or feature extraction is the process of leveraging domain expertise to extract features (characteristics, properties, attributes) from raw data. To improve the dataset’s properties, we engineered new features. Because IP was the major feature for categorization, it was combined with one or two other attributes. This resulted in a dataset with more characteristics.
The features available in the dataset can be seen in Table 2. The “attributed_time” column was dropped. “Click time” was separated into separate columns, i.e., day and hour. Additional columns were created based on the repetition mean and variance of unique IPs in combination with other features from the given data such as device, App, OS and channel. We can see the engineered features in Table 3.
Engineered features description
Engineered features description
Features description
The Boruta algorithm is utilized to select features for our dataset, and the results are shown in Fig. 2. Blue boxplots correspond to minimal, average and maximum Z score of a shadow attribute, as previously explained, these shadow attributes are generated by adding randomness to the given data set by creating shuffled copies of all features. shadow features importance should be as we can observe quite minimal compared to the rest of the authentic features. The Boruta algorithm outputs one of three outcomes for each feature: accepted (shown in green in the boxplot), inconclusive (shown in yellow). or rejected (shown in red). As it is evident from the figure all features are marked as important. However, the IP feature is the most important of the original features. The features importance is shown in Table 4.
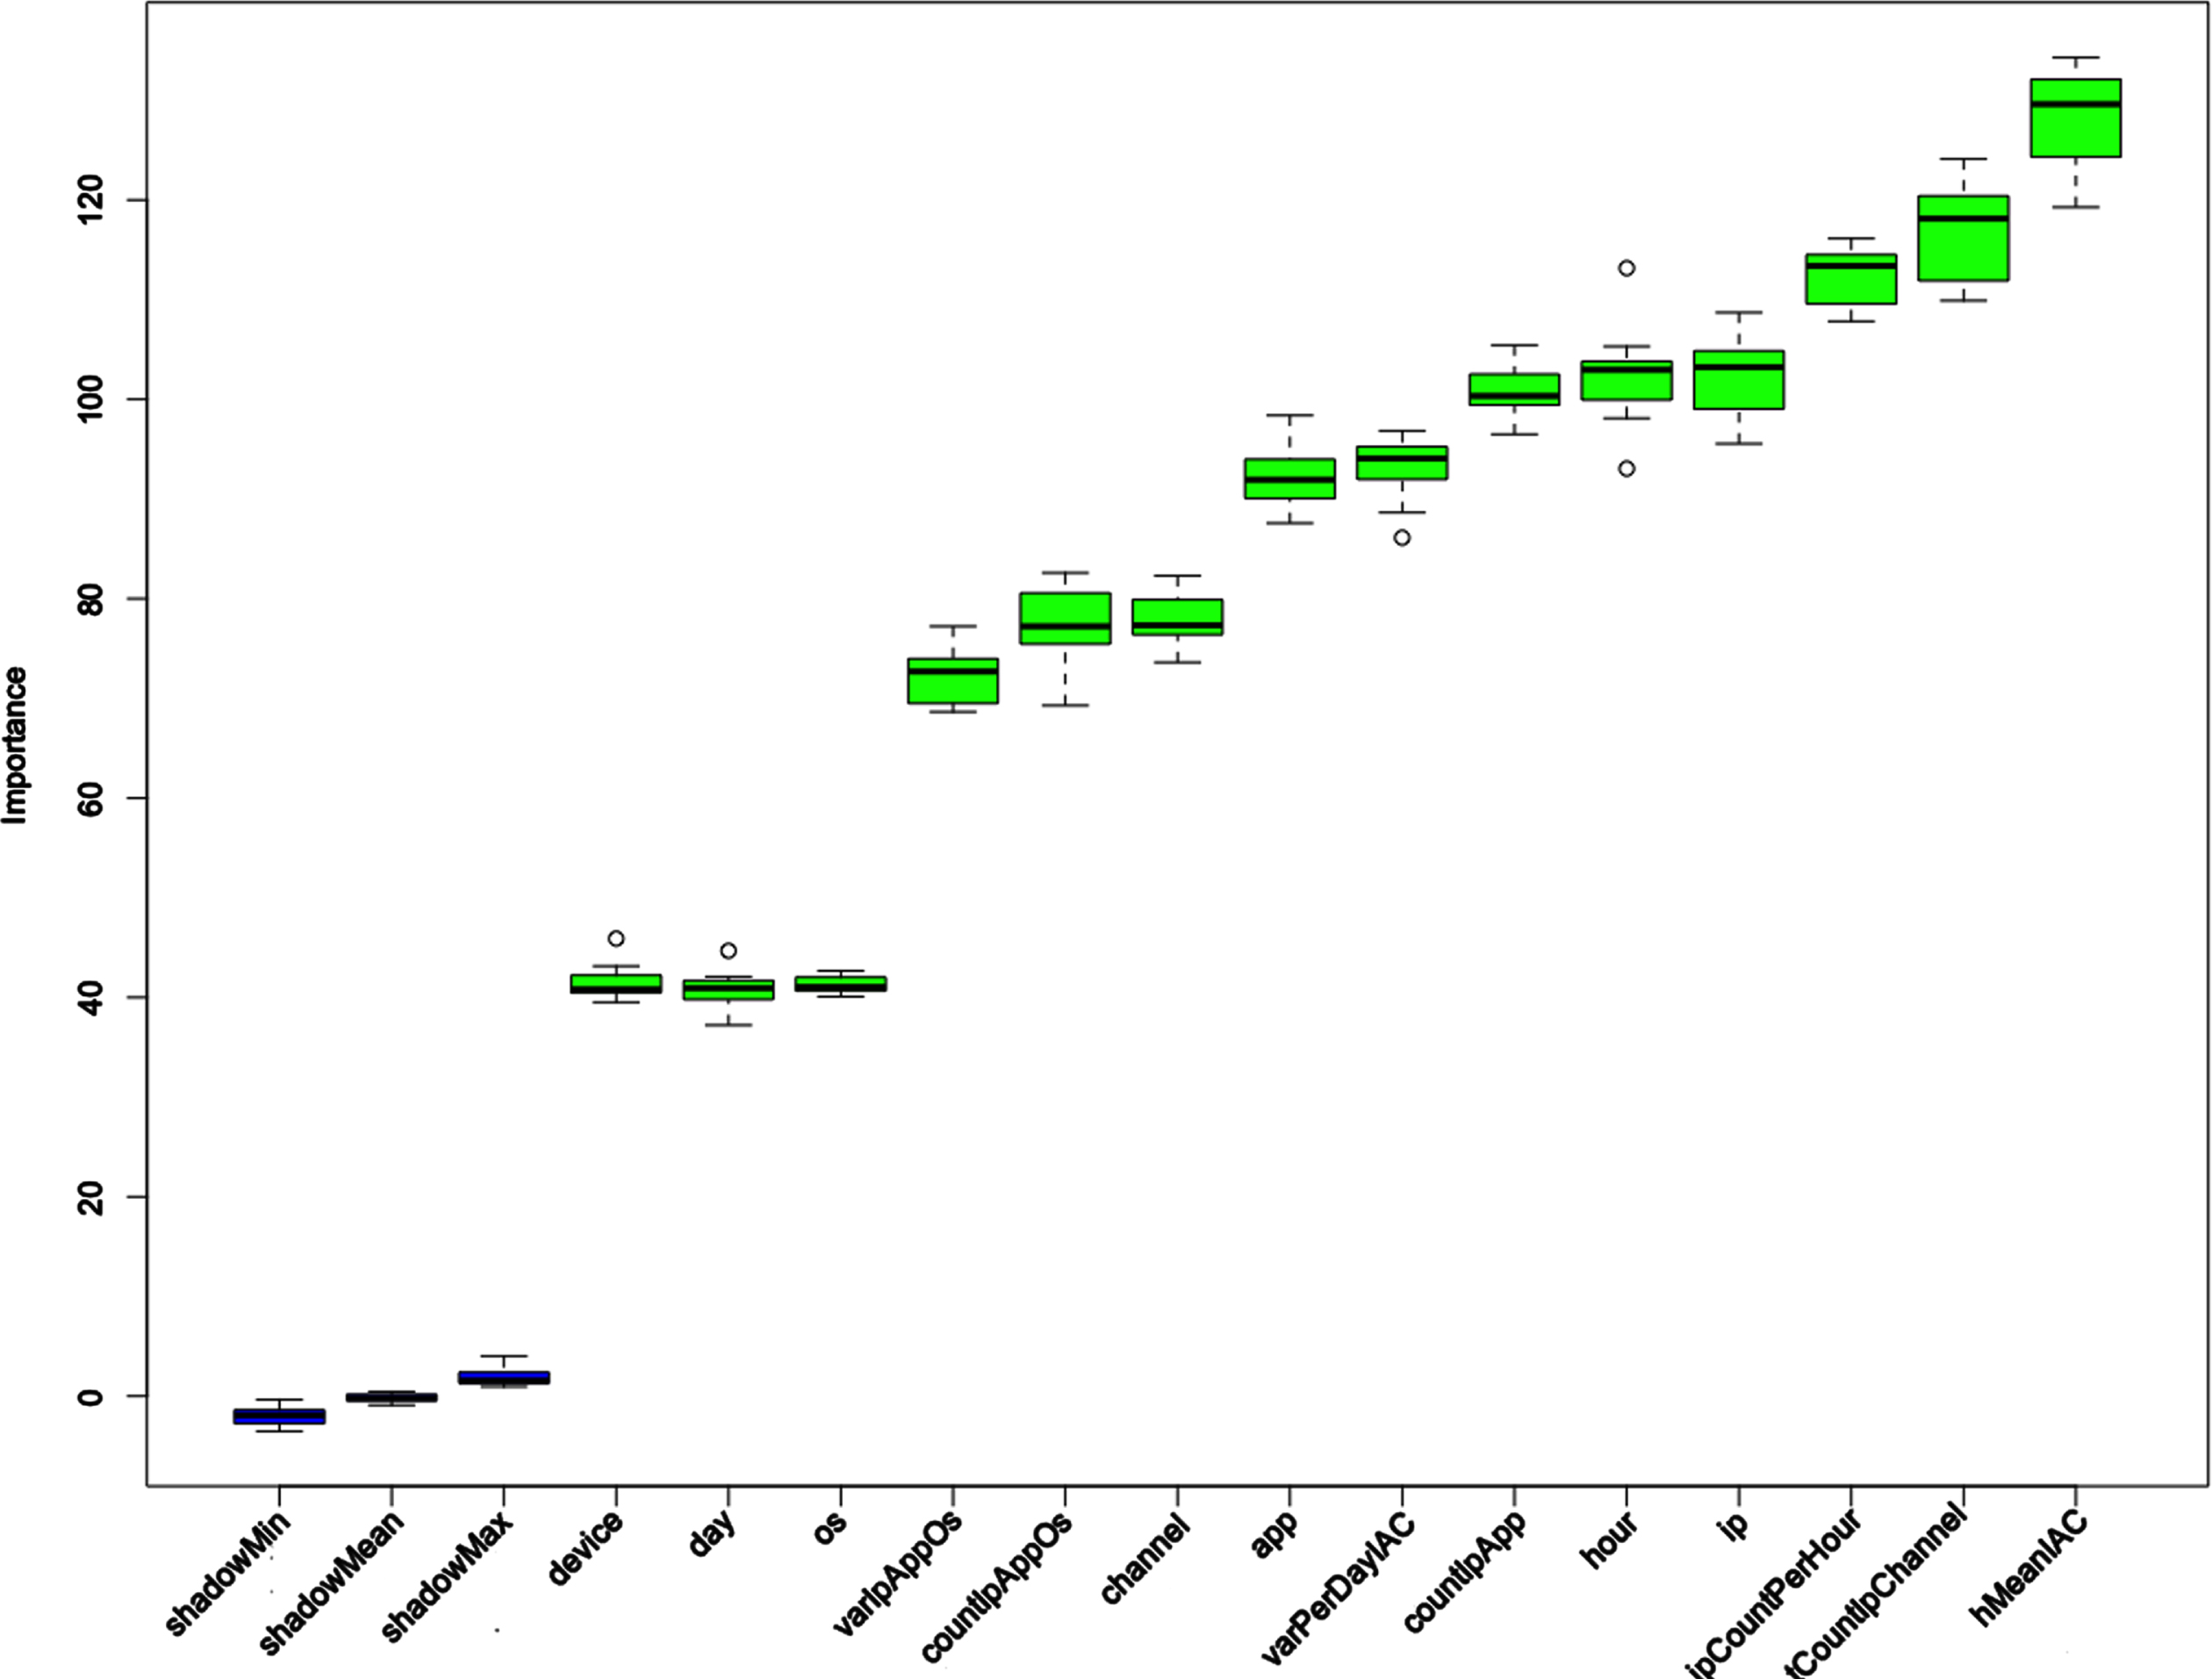
Feature selection outcomes.
Features important
Algorithm comparison
There is no “one size fits all” algorithm in Machine Learning, so it is necessary to try multiple algorithms. In this section, we compare the Stacking algorithm using different metrics, first with the base learners and then with previously established algorithms.
In this research, we selected four algorithms: Logistic Regression, Decision Tree, Random Forest, and AdaBoost, in addition to the Stacking algorithm used, to train the same dataset, respectively. The experiment results are shown in Table 5. Other than Stacking, Random Forest also showed great prediction results, as its evaluation indexes were the closest to the Stacking algorithm. Logistic Regression and Decision Tree models had the lowest AUC and Accuracy. On the other hand AdaBoost performed poorly, comparatively, in terms of LogLoss and had the second-lowest F1 Score.
The prediction results of different algorithms
The prediction results of different algorithms
The ROC curve can measure an algorithm’s ability to generalize. The closer the AUC is to 1, the better the algorithm will be. We plotted the ROC curve for each algorithm and calculated the AUC Score, and the results are shown in Fig. 3. We find that stacking reaches 0.972. The outcome of Random Forest is the closest to that of Stacking. This suggests that Random Forest contributes more to Stacking than the other algorithms.
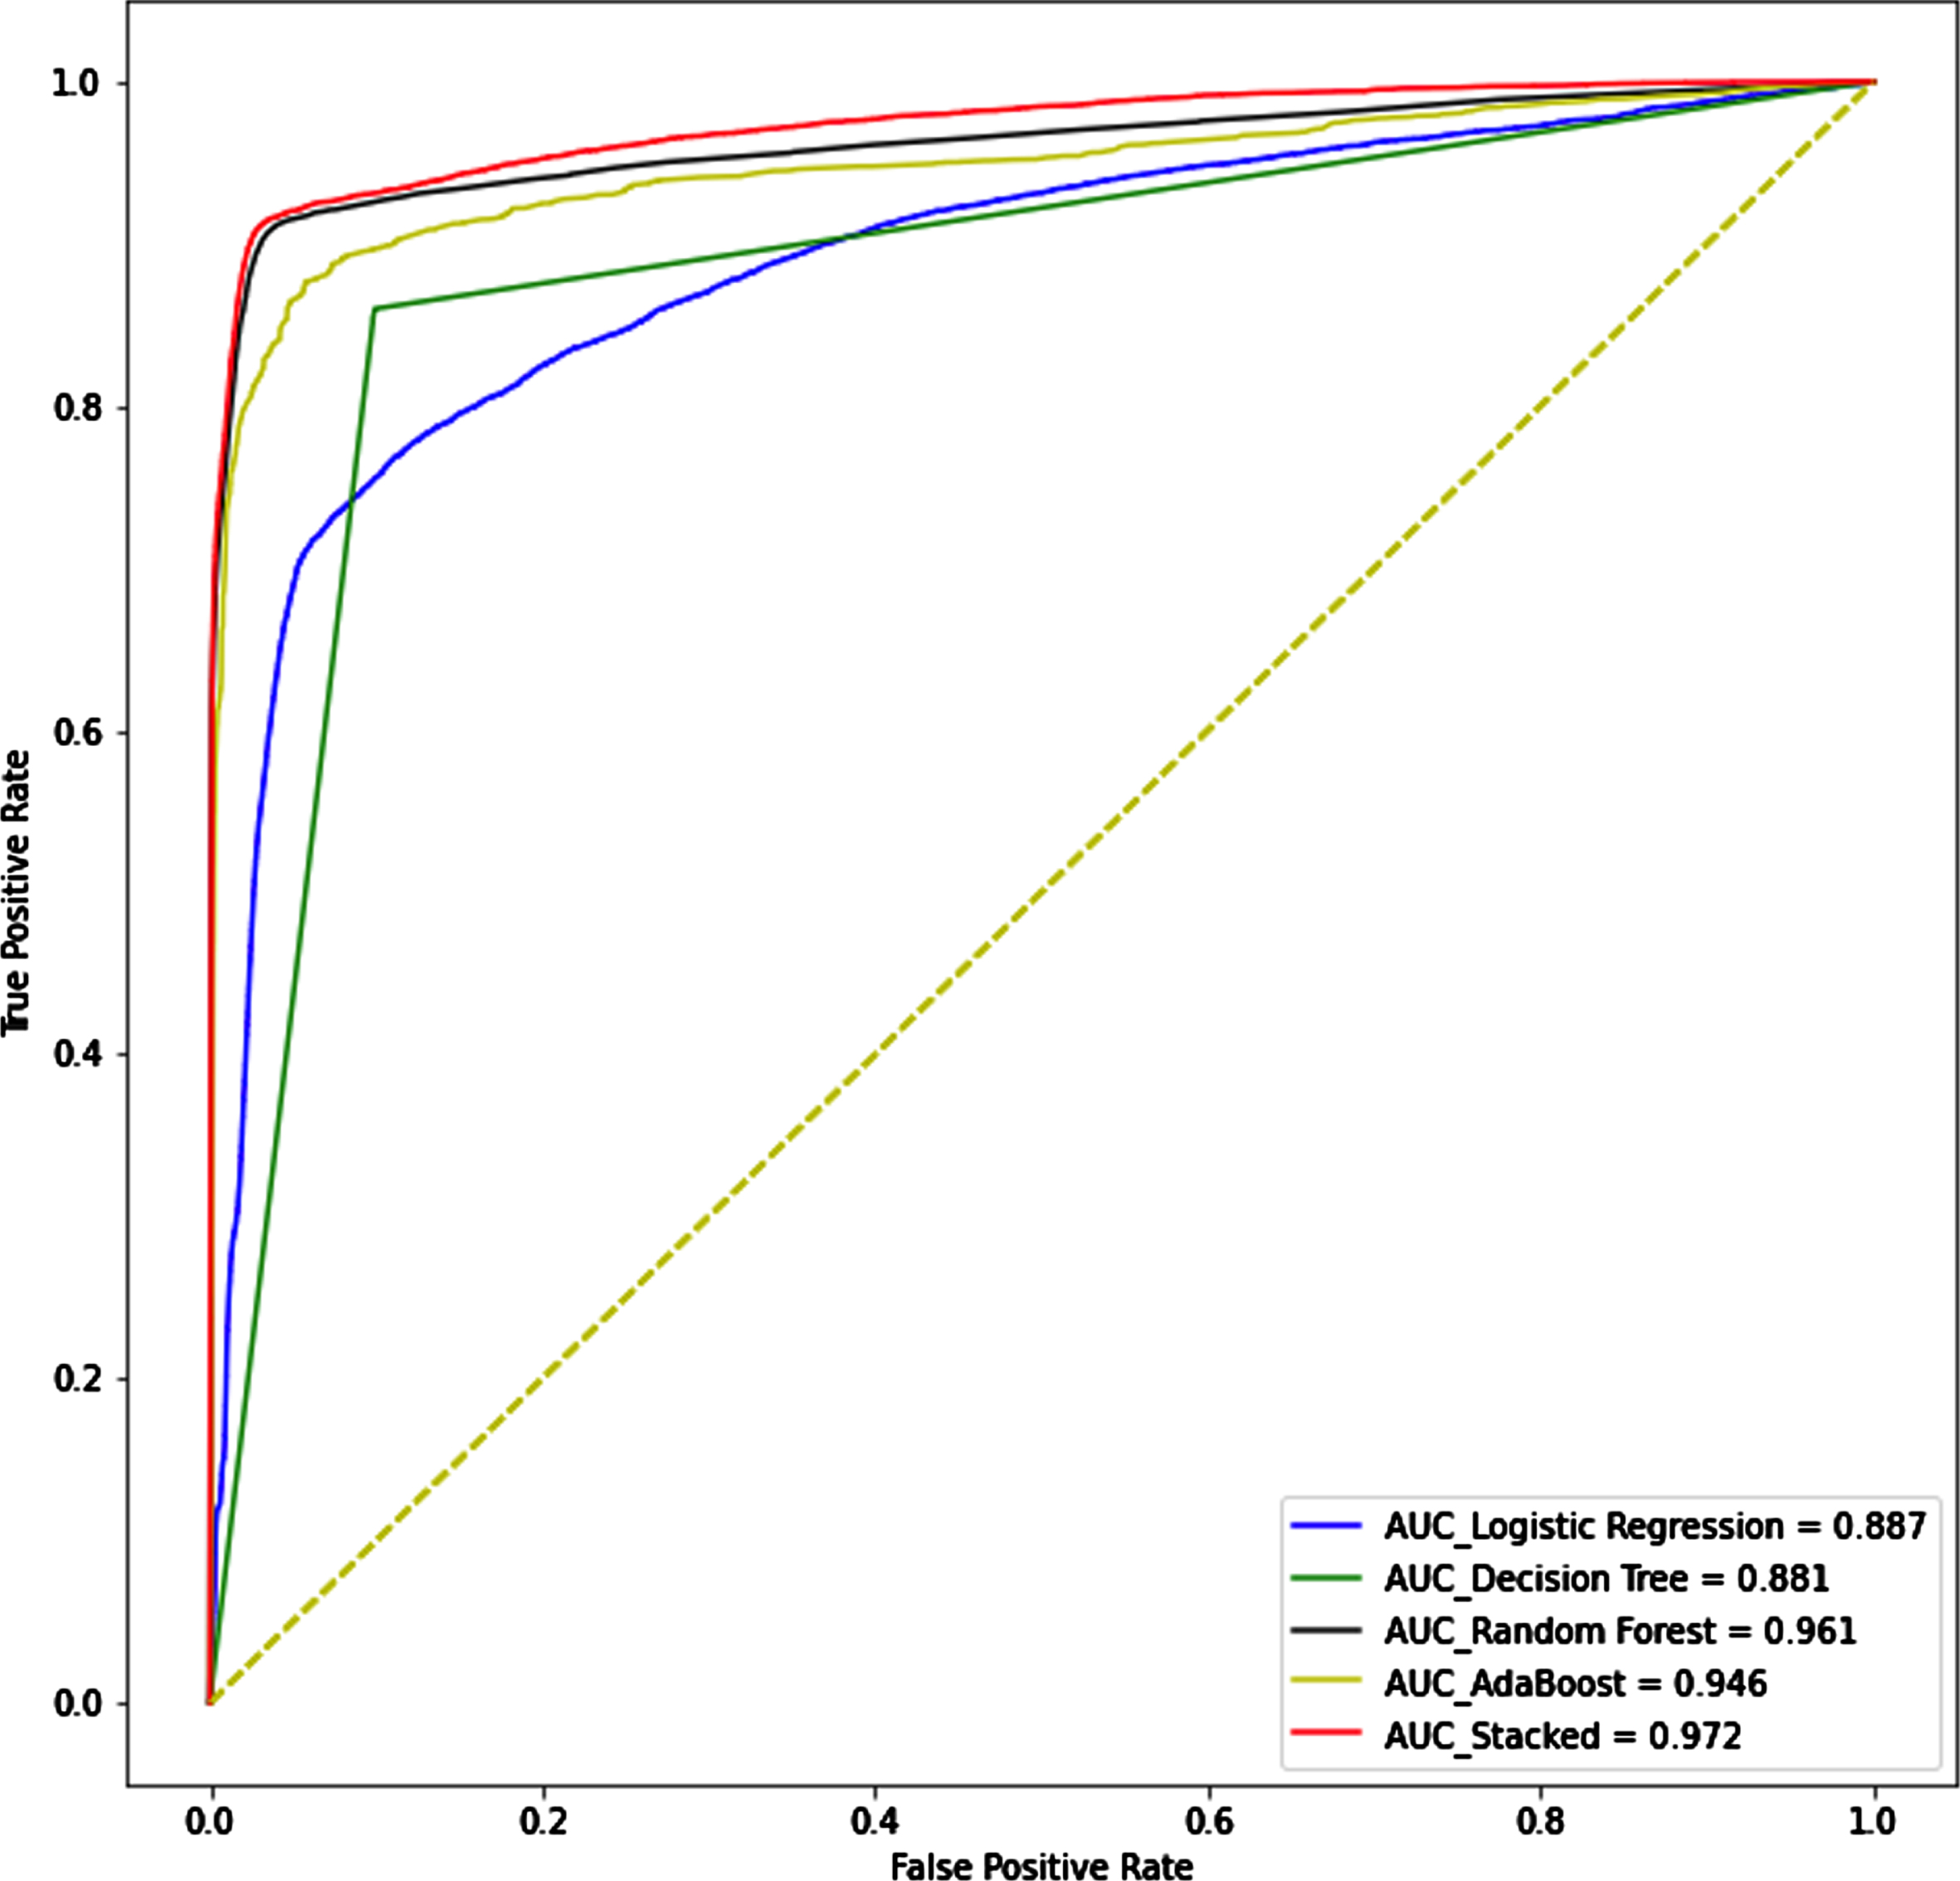
Receiver operating characteristic curve.
Table 6 presents a metrics comparison to some of the previous related work. The metrics used AUC and the F1score given that they’re the ones most available.
AUC Comparison To Previous Work
From Table 5, it is clear that our model compared to the rest of the base learners performs better in all aspects. While just from a 1st look to Table 6, it is clear that the proposed work does not perform as well as the CFXGB model in terms of AUC.
This difference in results is mainly due to the preprocessing step. In this work we carefully ensure that our test set emulates a real environment. While in the previous work there was data leakage as they preprocessed the data and generated new variables based on the entire dataset, and then performed the train/test split.The distribution of real clicks and fraudulent clicks in the test set did not match the distribution in the original data. Also the test data rows are randomly selected from their upsampled/downsampled data instead of being the last rows of the original data.
Logistic Regression, Decision Tree, Random Forest, and AdaBoost are all classic machine learning algorithms that are used as base learners in our stacking ensemble. These algorithms are chosen for this particular work, because they have a proven track record of achieving good performance on a wide range of tasks.
From Table 5, it is clear that Random Forest outperforms Logistic Regression and Decision Tree. In the final part of our experiment, we removed one algorithm at a time to see how strong or weak algorithms alter Stacking prediction outcomes. The findings are provided in Table 7 where LR, DT RF and AB refers respectively to Linear Regression, Decision Tree, Random Forest and AdaBoost. Overall, there is no statistically significant difference between the different groups of first-level learners. The four assessment indices are comparable throughout the different situations. It is possible to infer that the Stacking algorithm not only ensures forecast accuracy but also maintains high stability. Although Random Forest performs well, the model still performs well when Random Forest is removed from the first-level learner. We can conclude from this part that the Stacking algorithm might be a wonderful approach for dealing with method selection, especially for large and complicated datasets like click fraud datasets.
The prediction results of base level learner combinations
The prediction results of base level learner combinations
In this discussion section, we will delve deeper into the results of our study on predicting click fraud using a stacking algorithm. We will begin by explaining our approach to feature selection and how the Boruta algorithm was utilized to identify the most important features for the model. We will then discuss the performance of the proposed stacking model compared to the individual base learners and previous work in the field.
The practicality of the Boruta algorithm
One important aspect of our study was feature selection, as the success of a machine learning model can often depend on the quality and relevance of the input features. In order to identify the most useful features for our click fraud prediction model, we used the Boruta algorithm, which is a feature selection method that operates by iteratively adding and removing features from the model and comparing the performance with and without each feature.
Given that we had many engineered features in our dataset, the use of the Boruta algorithm was particularly useful in helping us to identify the features that were most important for the model. However, it’s worth noting that in our case, the Boruta algorithm did not remove any features from the model. This suggests that all of the features in our dataset were relevant and contributed to the model’s performance.
Overall, the use of the Boruta algorithm was beneficial in helping us to select the most useful features for our click fraud prediction model. This, in turn, helped to improve the performance of the model and allowed us to achieve more accurate predictions.
Evaluation of stacking algorithm against the base learners
In this study, we evaluated the performance of five machine learning algorithms for predicting click fraud: Logistic Regression, Decision Tree, Random Forest, AdaBoost, and a Stacking model, which combines the predictions of the individual algorithms.
The results showed that all of the algorithms had high accuracy scores, ranging from 0.902 for Decision Tree to 0.975 for the Stacking model. However, the F1 scores were much lower, with the exception of the Random Forest and Stacking models, which had F1 scores of 0.534 and 0.552, respectively. This suggests that the algorithms may be better at accurately classifying the majority class (non-fraudulent clicks) than the minority class (fraudulent clicks). Of all the algorithms, the Stacking model appears to be the most adept at detecting fraudulent clicks, as demonstrated by its higher F1 score compared to the other algorithms.
In an extremely unbalanced dataset like ours, the AUC and log loss are often more indicative of the model’s performance than the accuracy score. The AUC measures the model’s ability to distinguish between the positive and negative classes, with a score of 1 indicating perfect discrimination and a score of 0.5 indicating no discrimination. The log loss measures the model’s confidence in its predictions, with a lower score indicating higher confidence.
The results showed that the Stacking model had the highest AUC score of 0.972, followed by AdaBoost with a score of 0.946, Random Forest with a score of 0.961, Logistic Regression with a score of 0.887, and Decision Tree with a score of 0.881. In terms of log loss, the Stacking model also had the lowest score of 0.075, followed by Random Forest with a score of 0.144, AdaBoost with a score of 0.67, Logistic Regression with a score of 0.273, and Decision Tree with a score of 0.460.
Overall, the Stacking model outperformed the individual algorithms in terms of both AUC and log loss. One possible reason for this is that the Stacking model is able to combine the strengths of the individual algorithms and make more accurate predictions as a result. Additionally, the use of the second-level learner in the Stacking model may have helped to improve the model’s performance by weighting the predictions of the base learners differently.
It’s worth noting that the Stacking model does come with an extra computational cost compared to the individual algorithms. However, the improvement in performance demonstrated by the Stacking model suggests that this extra cost might be worth it, especially in cases where accurate prediction is particularly important, such as in the detection of fraudulent clicks.
Evaluation of stacking algorithm against previous work
In comparing our results to previous work, it’s worth noting that the AUC scores for the SVM, ETCF, and CFXGB models were 0.932, 0.960, and 0.989, respectively. the score for CFXGB is slightly higher than the AUC score of 0.972 that we obtained for the Stacking model. However, it’s important to consider that previous studies may have suffered from data leakage, which can artificially inflate the performance of the model. The claim of data leakage can be verified by examining the data processing and description steps and the train/test splits in the study.
In order to ensure that our results were as reliable as possible, we took extra care to eliminate data leakage in the test environment for the Stacking model. Data leakage occurs when information from the test set leaks into the training set, leading to overly optimistic results. By carefully controlling the test environment and eliminating data leakage, we were able to obtain more accurate and realistic results.
Overall, our results suggest that the Stacking model is a promising approach for predicting click fraud, particularly in an extremely unbalanced dataset. While the AUC score for the Stacking model was slightly lower than the one obtained in [11], the extra care we took to eliminate data leakage means that our results are likely to be more reliable and reflective of the model’s true performance in a real-world setting.
Limitations
One limitation of this research is the limited availability of real-life data for testing fraud detection algorithms. While the dataset used in this study is a large and publicly available dataset, it may not fully reflect the complexities and nuances of detecting fraud in a real-world setting. Using click-through rate (CTR) datasets for fraud detection may be a viable option due to similarities between the two types of datasets. However, it is important to carefully consider the differences and similarities between CTR and fraud datasets in order to accurately apply and interpret the results.
Another limitation to consider is the additional computational resources required for the stacking algorithm compared to some of the base learners. While the improved performance of the stacking algorithm may justify the additional computational cost, it is important to weigh the trade-off between performance and efficiency in practical applications.
Overall, these limitations should be taken into account when interpreting and applying the results of this study. Further research and testing with more diverse and realistic datasets may provide valuable insights and improve the robustness of the proposed method.
Conclusion
We have presented a click fraud prediction classification approach based on the Stacking algorithm in this study. To handle unbalanced datasets, under-sampling and the SMOTE method are introduced, and the Boruta algorithm is used to pick input features. TalkingData dataset is used for a comparative study. The following are the key contributions: Feature engineering and preprocessing are essential steps for maximizing the usefulness of available data. Therefore, we engineered nine additional features from the existing data that play a major role in the prediction algorithm, as indicated by the feature selection results. To select features, we used the Boruta algorithm. Feature selection is critical when using machine learning technology. As shown in Section 4.1, the comparative experimental findings are consistent with the feature selection results obtained using the Boruta algorithm, demonstrating its effectiveness. Using the Random Forest classifier, we obtained the importance values of 14 features, and conducted experiments by inputting different combinations of these features into the model in order of their importance values. We verified all features in the dataset and found that many of the engineered features were among the most important. This paper proposes a click fraud prediction classification approach based on Stacking. We used Random Forest, Logistic Regression, Decision Tree, and AdaBoost as base learners, and Logistic Regression as the second-level learner. To assess the individual contributions of the four first-level learners, we trained the same dataset using each learner individually. The results suggest that Stacking outperforms all the other learners, with Random Forest being the closest in terms of performance.
In future research, it would be interesting to explore the use of other machine learning technologies for click fraud prediction. Additionally, it may be useful to consider the impact of laws such as GDPR on the detection of fraudulent clicks. Another potential area of study is optimizing data curation to balance the positive and negative categories. An alternative approach could be to focus on improving the quality of the data rather than solely improving the performance of the predictors.
Conflict of interest statement
To the best knowledge of the author, this work has no conflicts of interest to be considered.