
Abstract
This paper shows the capabilities offered by an integrated neural-logic multi-agent system (MAS). Our case study encompasses logical agents and a deep learning (DL) component, to devise a system specialised in monitoring flood events for civil protection purposes. More precisely, we describe a prototypical framework consisting of a set of intelligent agents, which perform various tasks and communicate with each other to efficiently generate alerts during flood crisis events. Alerts are only delivered when at least two separates sources agree on an event on the same zone, i.e. aerial images and severe weather reports. Images are segmented by a neural network trained over eight classes of topographical entities. The resulting mask is analysed by a Logic Image Descriptor (LID) which then submit the perception to a logical agent.
Introduction
The increasing severity of weather events, particularly storms and heavy rainfall, has caused significant damage worldwide and has contributed to the growing problem of global flooding [11, 23]. One of the major challenges in addressing these disasters is the ability to quickly and accurately identify and respond to them. Traditional methods of monitoring and analysis, such as manual observation and evaluation of meteorological data, are often not sufficient for this task [25]. To address this challenge, many organisations and governments are turning to advanced technology, such as deep learning (DL), to assist with the identification and analysis of flood events [13].
DL approaches use complex algorithms and large datasets to enable the precise extraction and classification of visual characteristics in images and other data. This can be useful for identifying patterns and trends in weather data, as well as for monitoring changes in real-time (see for example the UN Global Pulse project 1 , or the Extreme Earth project 2 ). However, the increasing severity of weather events, particularly those related to flooding, has highlighted the need for advanced, specialised systems for the identification, the monitoring, and analysis of these disasters. One reason is that the performance of DL systems can be affected by overfitting, limited training data, and the presence of similar but distinct classes in the training data. In the context of weather disasters, the images used for training and classification can be limited, and the circumstances present in the images can be highly variable, making it challenging for a DL system to achieve high levels of accuracy. In addition, natural disasters frequently necessitate more in-depth analyses, such as determining the extent of flooding or the potential impact on infrastructure and communities. Moreover, human operators alone are not able to cope in real- time with the very many alerts that arrive daily if not hourly. Hybrid systems, which combine the capabilities of multiple technologies, i.e. those of DL algorithms with those of intelligent logical agents, may offer a solution to this challenge, providing more accurate and comprehensive models for the detection and reporting of flood events.
Accordingly, in this paper we propose extensions to our previous work illustrated in [18]. In particular, we have developed a preliminar prototype (reference in [19]) in which a multi-agent system (MAS) is able to autonomously collect weather alerts, activate a DL module to categorise the related images, filter the results, and alert human operators only if there is a reasonable confidence that a risky situation is in effect arising. To do this, we implemented a system using a combination of logical agents and a DL component. The system uses aerial images and weather reports as information sources. The neural network (NN) is trained on eight classes of topographic entities to segment the images. Once the images have been segmented, a logical image descriptor (LID) is used to generate a logical description of the predicates for the segmented mask. This description is then submitted to a logical agent, which performs the reasoning. We adopted, for our system, computational-logic-based agents endowed with a logical semantics. This because a logic basis provides (at least potentially) verifiability and explainability, and thus trustworthiness [7] 3 . In our system, reasoning is performed using a perception-fusion approach instead of a data-fusion one. In a perception-fusion approach, the agents in the MAS use their own perceptions to reason about the environment and make decisions collectively. This means that each agent independently processes the raw sensor data it receives from its environment and shares its conclusions with the other agents, which are then combined to form a collective understanding of the environment. In contrast, in a data-fusion approach, the agents rely on a centralized data processing unit to collect and process data from all the agents before making decisions.
In summary, our system is designed with the primary goal of providing accurate and reliable alerts or pre-alerts for severe weather situations. To achieve this, we have employed a perception-fusion approach that integrates logical agents and a deep learning component to enable effective reasoning with various forms of information. our system represents a significant step towards our long-term objective of developing an advanced version capable of rapidly identifying flood events and alerting relevant authorities. This would facilitate the swift mobilization of rescue efforts and other essential resources. In conclusion, this system is a first example of a class of real-time applications where a stream of real-time data must be analyzed, filtered, evaluated, and provided to the user together with explanations, to enable prompt countermeasures.
Accordingly, the paper is structured as follows. Section 2 gives an outline of some systems for monitoring or detecting catastrophic events, both in the context of deep learning and MAS. Section 3 provides an overview of the system architecture, while detailed explanations of each MAS agent are provided in Sections 4, 5, 6, and 7. Section 4 describes the Neural agent and its components in details; this section illustrates the experiments performed for the analysis of aerial images using a NN and the implementation of a specific module called LID for generating logical descriptions of segmented images. Section 5 details the implementation of the Perceptor agent and provides some measures of the agent’s correctness in determining whether or not a region is flooded. Section 6 describes the Weather agent, which, as we will see, at the present stage is simulated (as at present, due to related costs, we do not have actual access to weather information). Section 7 provides an overview of the Alert agent, the agent in charge of notifying the proper authorities of any potential flood warnings. In Section 8 we report the discussion of our system and the possible future works. Finally, Section 9 summarises the final remarks and the contribution of our work.
Related works
The use of technology to mitigate the effects of natural disasters has been the focus of considerable research in recent years. In particular, the detection and monitoring of flood events has been a key area of interest, given the increasing frequency and severity of such disasters. In this section, we provide an overview of related work in this field, focussing on deep learning approaches, multi-agent systems and their potential combination.
Although DL-based approaches have shown promise in flood detection, these can be limited by the availability of training data and the highly variable features of the images, which make it difficult for a deep learning system to achieve high levels of accuracy. In addition, more in-depth analyses are often required in these situations, such as determining the extent of the flood and its potential impact on infrastructure and communities.
One such study, conducted in [1] proposed a MAS to simulate and estimate water levels in an urban catchment area. The system was designed to simulate water level saturation using the MAS approach instead of traditional hydrological modelling. This was achieved by a method that can simulate the uncertainties of the flow regime and calculate the depth of flow at any time, enabling the optimisation of reservoir storage capacity to allocate excess water. In [10] a MAS approach is developed to improve flood forecasting and warnings for a decision support system. This study seeks to provide technical support to the flood monitoring and warning authorities.
Among the work in this field, the work proposed in [17] is of relevance. In this work a flood disaster response simulator is introduced to be used as a benchmark for the coordination of autonomous agents in different MAS approaches.
Following this, in this paper we propose a specialised system that combines the capabilities of DL algorithms with those of intelligent logical agents to provide a comprehensive model for the detection and reporting of flood events.
Multi-Agent-System
DALI
The MAS employed in the present work has been implemented using DALI [4–6, 8], which is a programming language developed for constructing logical agents that can behave and make decisions similarly to humans. DALI is a superset of Prolog 4 , and thus any Prolog (logic) program can be seen as a DALI agent, devoid however of agent-oriented proper features. Agent-orientation in DALI agents comes from having events as first-class objects in the language, and from including two new kinds of rules: reactive rules—which are designed specifically to enable the agents to interact with and respond to their surroundings—, and proactive rules—by means of which an agent can take initiatives and initiate activities when deemed suitable by the agent itself.
Specifically, there are four types of events that are explicitly represented in the DALI syntax, and may occur in an agent’s code to trigger agent’s behavior: external events, internal events, present events, and past events. In this particular context, we only consider external and internal events. External events are designated by the postfix
Actions are the means by which DALI agents can affect their environment, potentially in response to an external or internal event. Actions can optionally have preconditions. If an action has preconditions, it is defined using an action rule, otherwise, it is simply an action atom denoted by the postfix
DALI also includes a communication architecture with three levels. The first level implements a FIPA-compliant communication protocol 5 . The second level allows agents to communicate with each other using messages, and the third level enables agents to communicate with other agents and external systems via the support of an external ontology.
FloodMAS architecture
The architecture of the system that we implemented in this proposal is shown in Fig. 1. Peculiarly,

FloodMAS architecture.
For the implementation of our architecture, we implemented the following agents:
The weather information provided by this agent is processed and then translated by the Alert agent—which is responsible for disseminating the alerts to relevant parties. This system allows for the efficient and effective communication of weather-related information and enables appropriate actions to be taken in response to potentially hazardous weather events.
The distinction between these two actions stems from the fact that if both agents – the Perceptor agent and the Alert agent – agree on the presence of flood events, then the situation is more likely to really occur, and the Alert agent must then urgently notify the appropriate authorities; if, on the other hand, only one of the two agents reports the presence of a disaster, the probability of flooding will be significantly lower, and the agent notifies the authorities, who will ultimately decide whether or not the phenomenon has occurred.
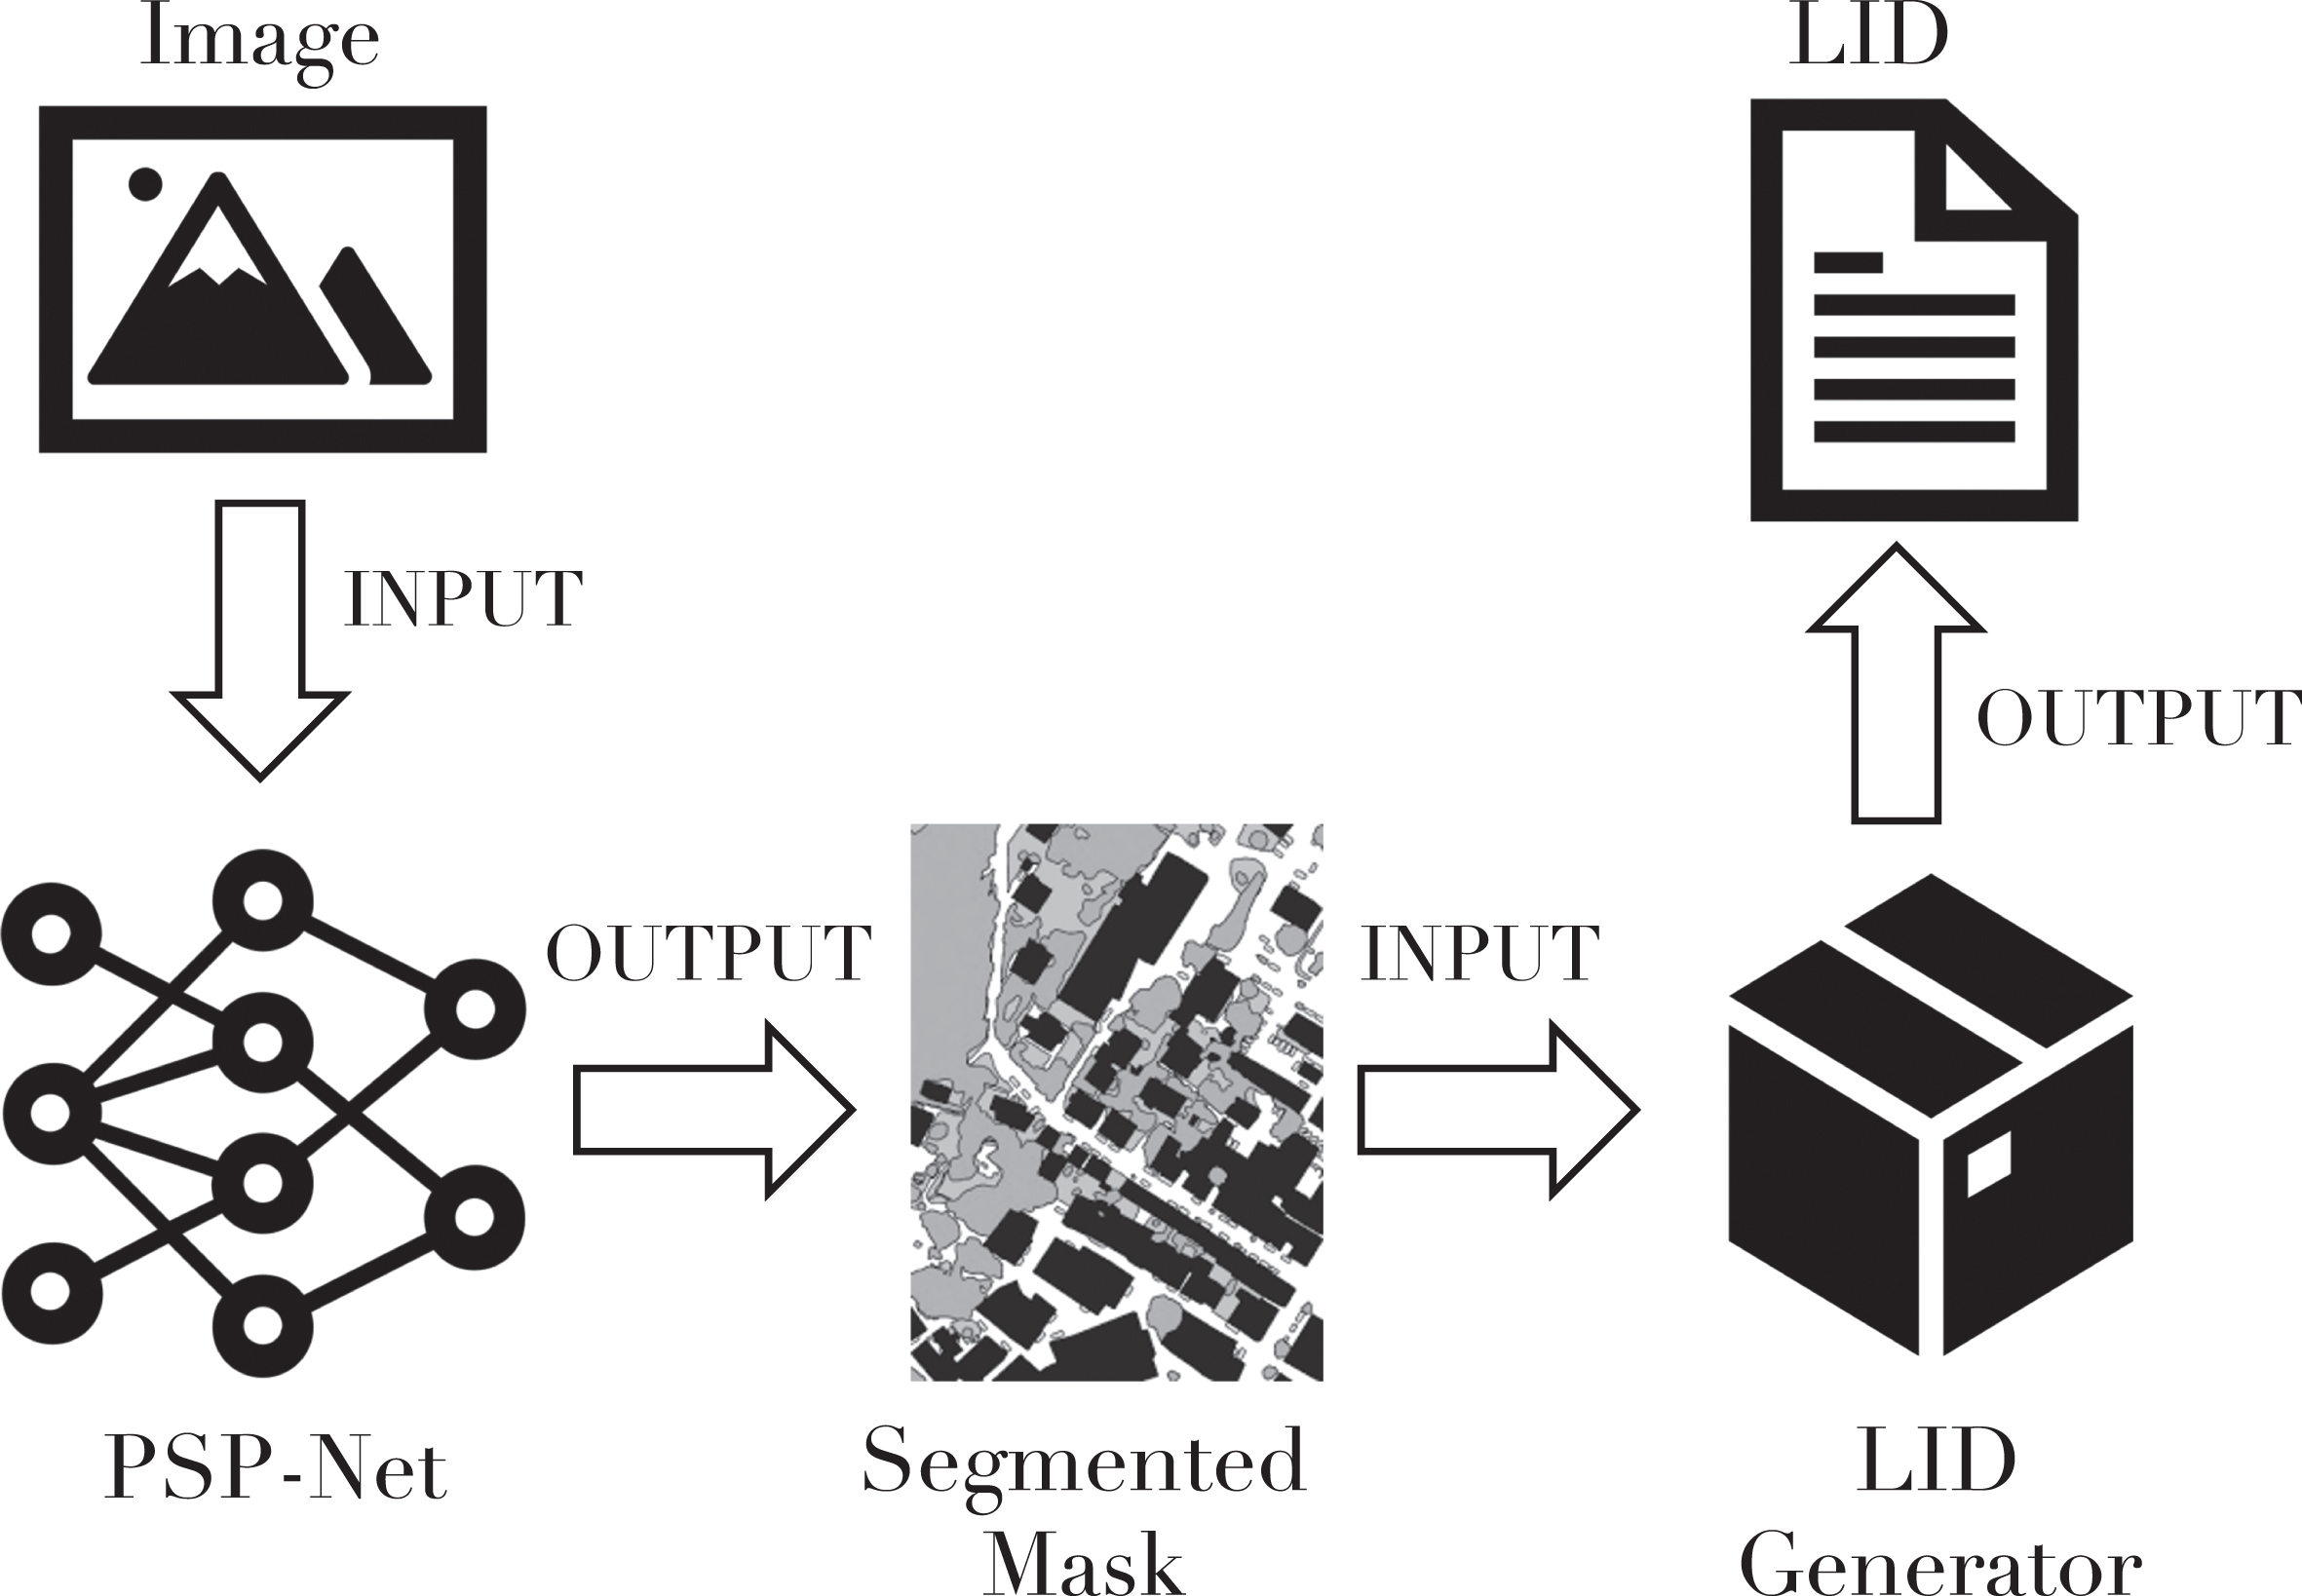
This section provides a detailed description of the two components that are part of the Neural agent (see Fig. 2). The first part of this section will describe the NN model used, as well as the training dataset and experiment results. In the second part, the morphological operations and calculations that are performed on the NN’s output will be described. These operations and calculations are used to obtain a description of the output in the form of DALI (i.e., Prolog) facts, which can then be provided to the MAS. As shown in Fig. 2, this module is identified as the Logic Image Description (LID) generator.
Neural agent.
In our work, as well as in [18], we utilised the PSP-Net model to conduct image segmentation on aerial images.
The PSP-Net model [29] is a powerful tool for image semantic segmentation, a process that allows a NN to identify and classify different objects in an image. This is achieved by organising the pixels in the image in a semantically meaningful way, grouping pixels that belong to the same object class together and assigning them a common color or gray level. This allows the NN to understand the content of the image and make predictions about the objects it contains.
The PSP-Net model is composed of two main components: an encoder and a decoder. The encoder is responsible for extracting features from the input image, using a CNN and a pyramide pooling module. The pyramide pooling module is a key component of the PSP-Net model, as it helps to capture the global context of the image by combining features at multiple scales. This is accomplished by pooling the feature map generated by the CNN into different dimensions and then up-sampling the pooled features to match the size of the original feature map. The resulting maps are then concatenated with the original feature map and passed to the decoder.
The decoder is an additional module that processes the concatenated feature maps to make predictions about the objects within the image. It uses the extracted features to generate the final segmented image, where each object is assigned a unique color or gray level. The decoder is therefore essential for turning the extracted features into meaningful predictions about the objects present in the image.
The use of this model, allow us to take advantage of the model’s ability to capture global context and make accurate predictions about the objects in an image.
PSP-Net experiment
As also reported in [27], the available datasets for semantic segmentation of very high resolution satellite and aerial images are limited. The main reason stems from licences that limit the redistribution of purchased imagery. Publicly available datasets include
For our experiment, we employed the
Floodnet data distribution
Floodnet data distribution
For our NN experiment, we decided to use the
In our experiment, the CNN was trained for 200 iterations with a batch size of 8. The loss function employed during training is a weighted sum of the Binary Cross Entropy (BCE) loss and the Dice loss [24]. In mathematical terms, the Dice loss is defined as:
where y
i
and
The Dice loss quantifies the overlap between the actual and expected segmentations; it is often used as a loss function in training DL models for semantic segmentation tasks, where the objective is to predict a pixel-by-pixel class label for each image in the dataset. This loss is computed by averaging the loss values for each batch. Given that it is differentiable, the Dice loss function is a valuable tool for training DL models via gradient descent. In addition, it is sensitive to the spatial overlap between predicted and ground-truth segmentations, a crucial factor for many semantic segmentation tasks. However, it is susceptible to class imbalance and does not account for false negatives and positives. Consequently, it is frequently combined with other loss functions to enhance model performance. In our case, we used the BCE loss, as it can be used to train a model to predict the class probabilities for each pixel in an image.
The BCE loss is calculated as the negative log likelihood of the predicted class probabilities, given the ground truth labels. It is defined as:
where y
i
and
As a result, the overall loss function is defined as:
where BCE is the binary cross-entropy loss, DiceLoss is the Dice loss, and α is a hyperparameter that controls the relative contribution of the BCE loss to the overall loss.
Fig. 3 depicts the loss function trends during NN training. In both the train and test sets, the loss decreases as the number of epochs increases. In the case of the test set, learning slows significantly after the 100th epoch compared to the train set, with slight overfitting observed between the 120th and 250th epochs.
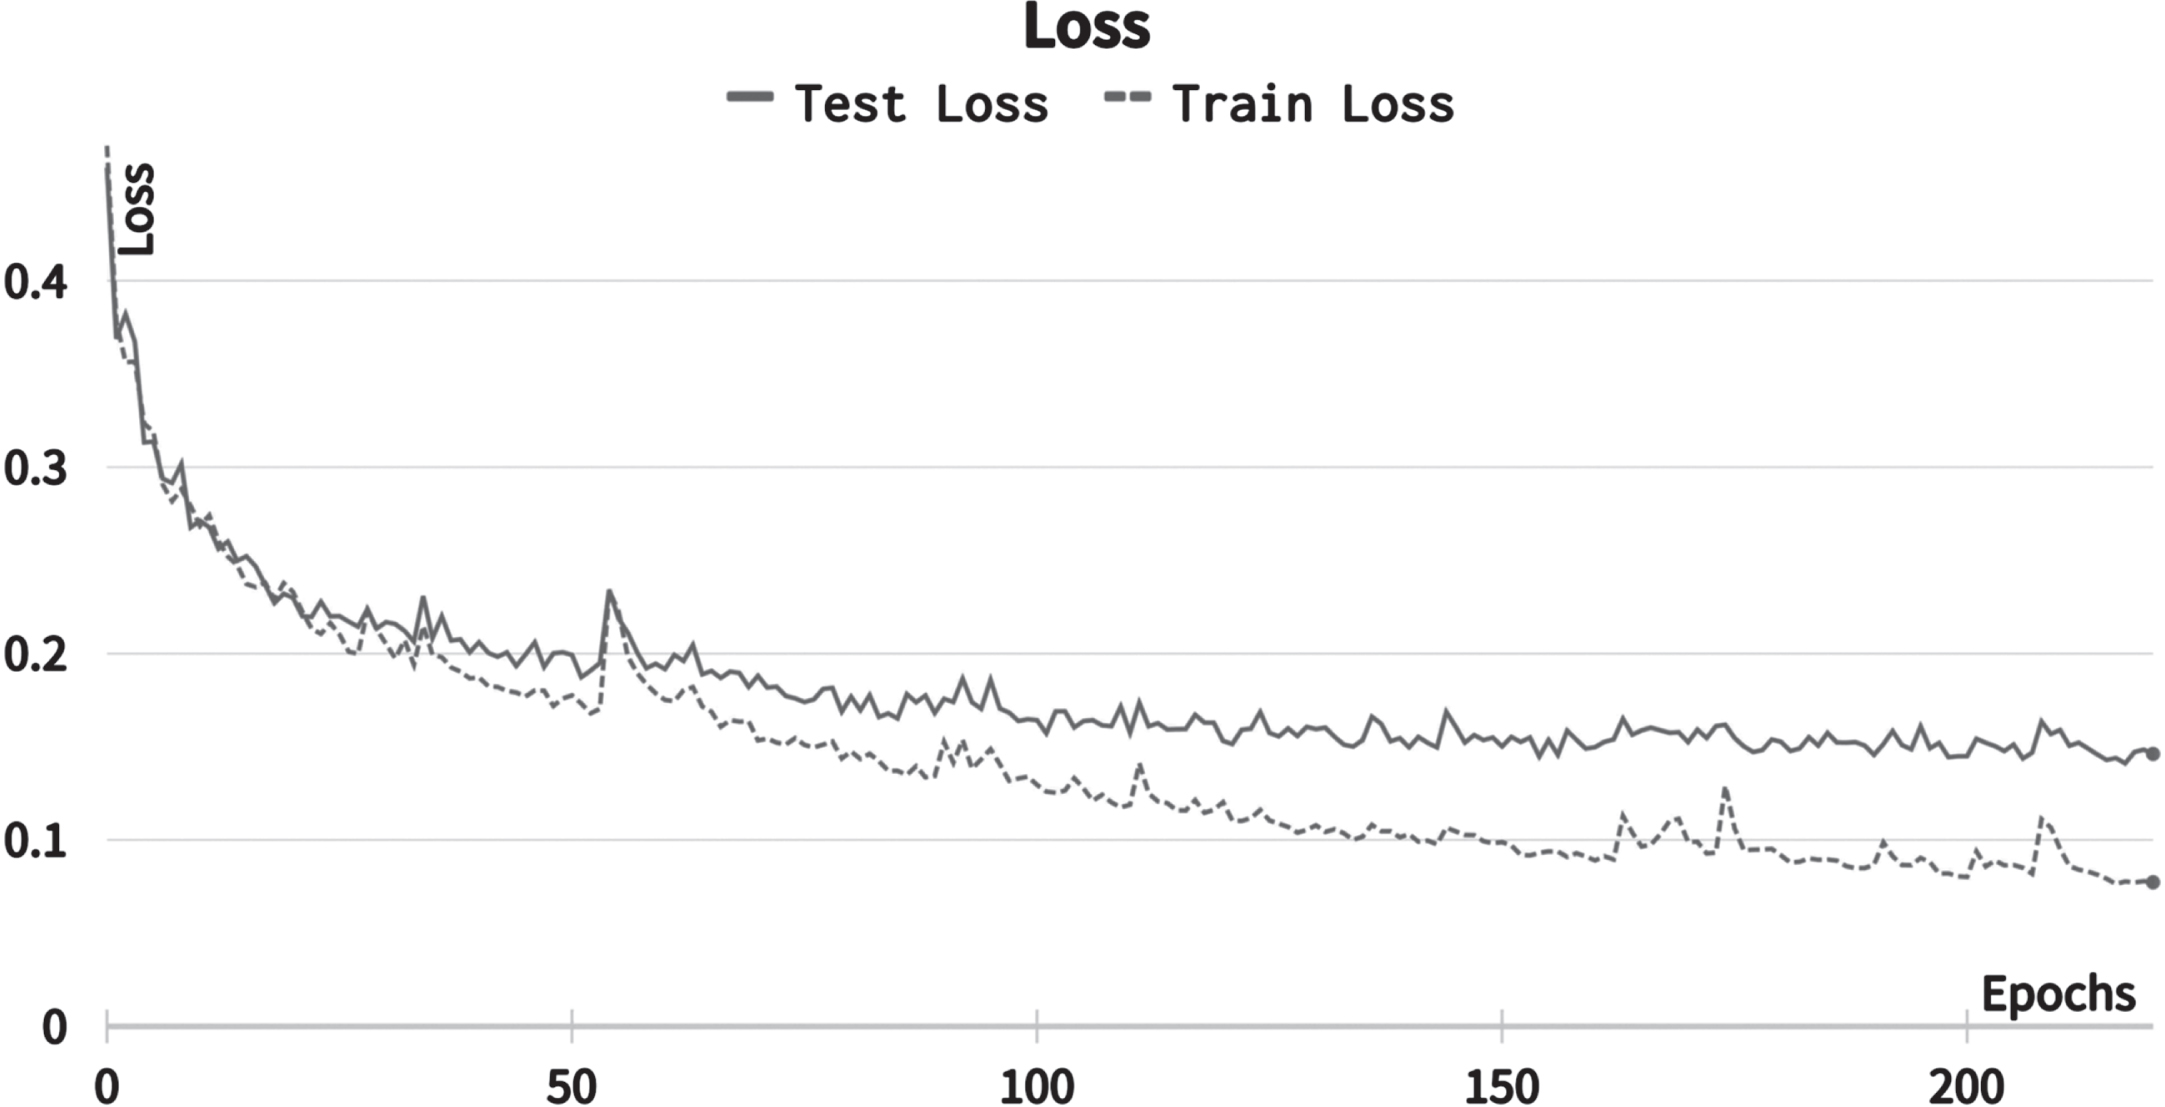
Loss trend during experiment.
We utilised two metrics to evaluate the performance of our model: accuracy and mean Intersection-over-Union (mIoU). Observe the pattern of the metrics by consulting Fig. 4 and Fig. 5.
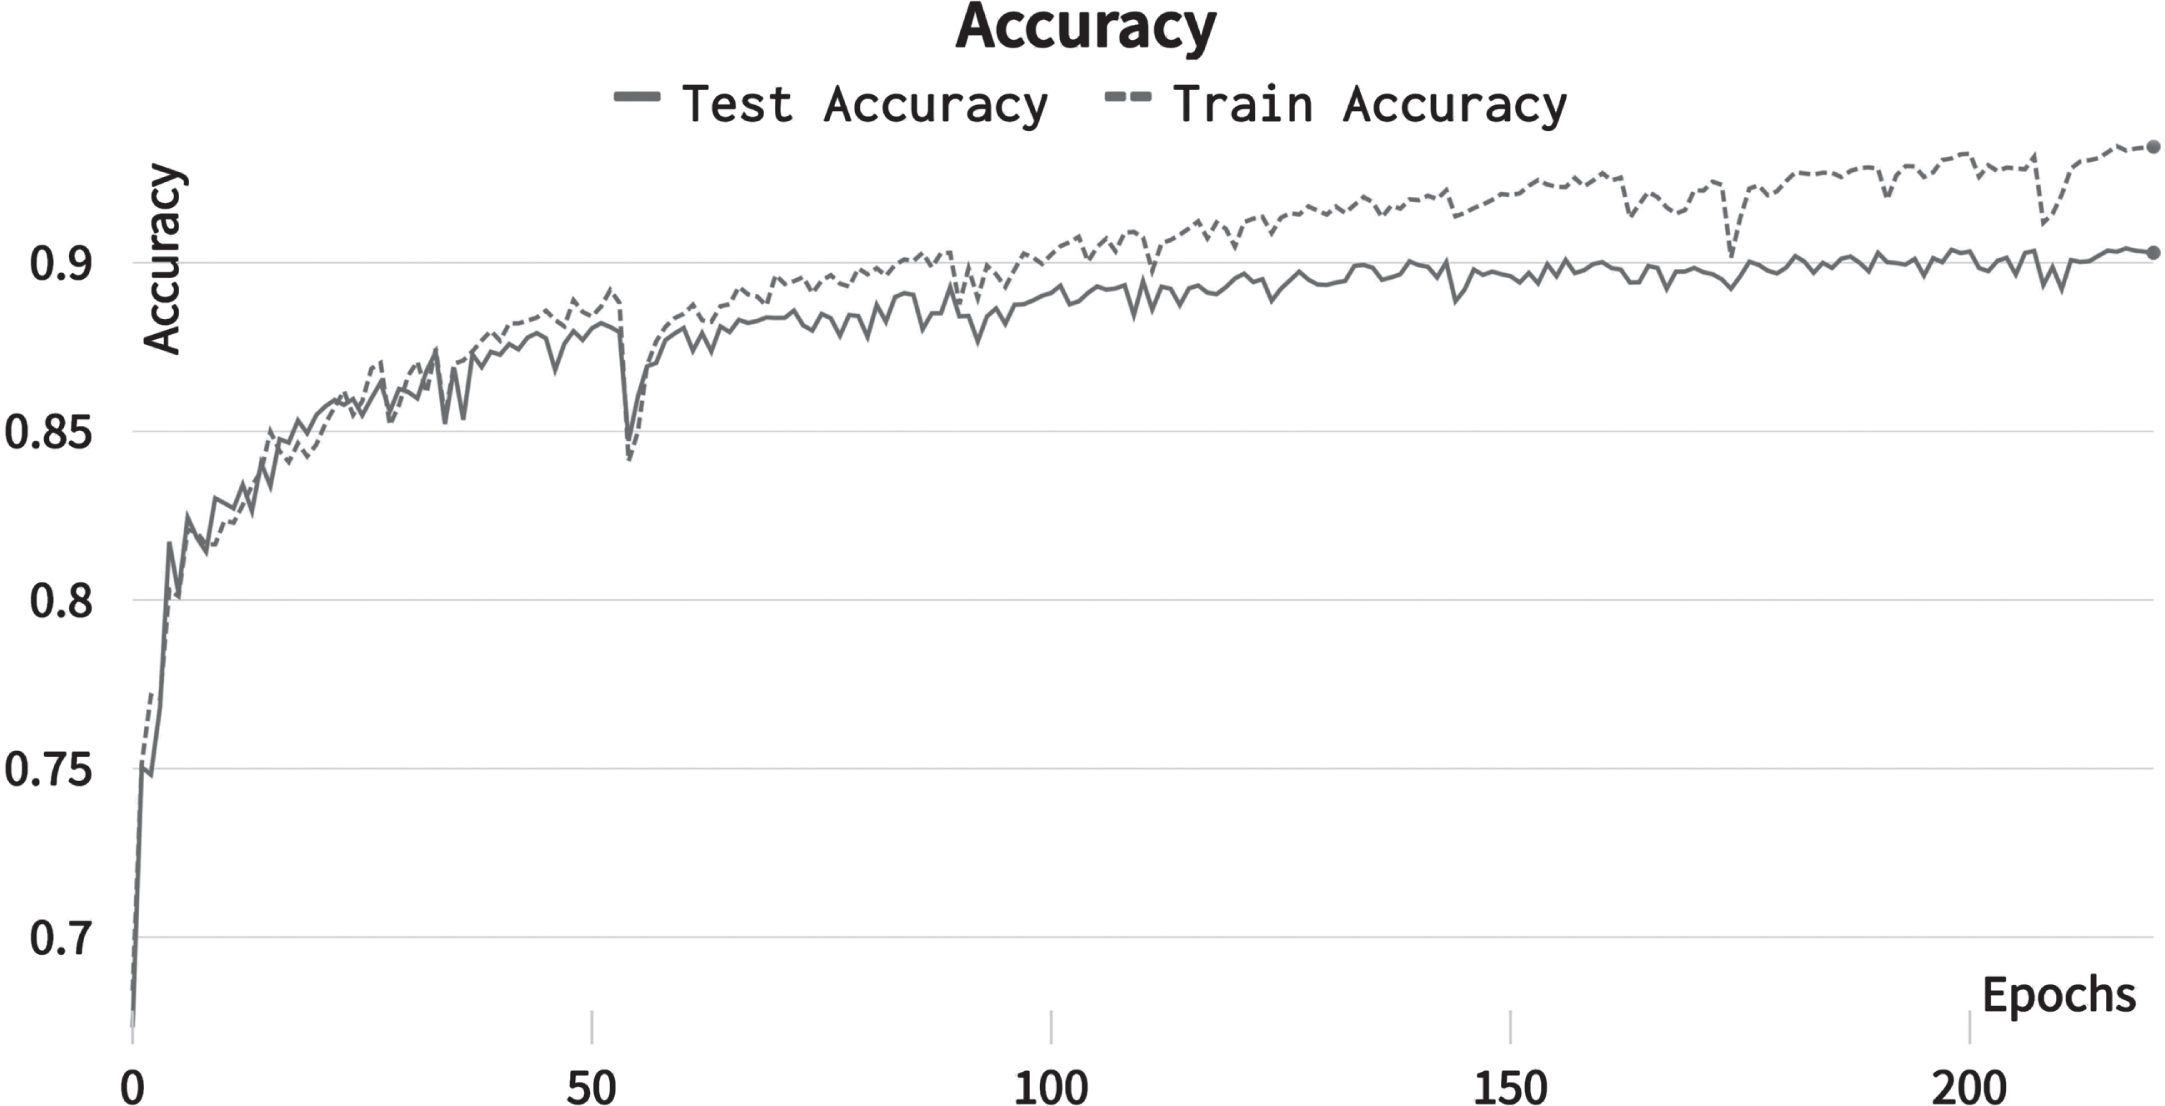
Accuracy trend during experiment.

mIoU trend during experiment.
The mIoU metric was chosen in addition to the accuracy metric since it is a commonly employed metric for evaluating the performance of semantic segmentation models. This metric measures the average overlap between predicted and ground-truth segmentations for each class in the dataset, as follows:
where n is the number of classes, TP i is the number of true positive pixels for class i, FP i is the number of false positive pixels for class i, and FN i is the number of false negative pixels for class i.
This formula calculates the IoU for each class and then takes the mean over all classes. The IoU for each class is calculated as the number of true positive pixels (correctly classified as belonging to the given class) divided by the sum of the true positive pixels, the false positive pixels (incorrectly classified as belonging to the given class), and the false negative pixels (incorrectly classified as not belonging to the given class). The mean IoU is then calculated as the mean of the IoUs for all classes. To calculate the IoU index, by similarity, we used the Jaccard index.
The Jaccard index is defined as the size of the intersection of two sets divided by the size of the union of the two sets. It can be used to calculate the IoU by treating the predicted segmentation and ground truth segmentation as sets of pixels, with each pixel represented as a binary value (i.e., a value of 0 or 1 indicating whether the pixel belongs to the set). Mathematically:
where y
i
and
If we examine Table 2, we can observe that the accuracy values are greater than mIoU values in all the train, the test, and validation scenarios. This could be due to the fact that the NN makes relatively few errors, but these errors tend to occur for larger regions. For instance, if the NN accurately labels the majority of pixels in an image but assigns a large region of pixels incorrectly, it could result in high accuracy but low mIoU. Another possible explanation is that the NN has difficulty distinguishing between certain classes. For instance, if there are two visually similar classes, the NN may have issues properly labelling pixels belonging to one of these classes, despite correctly labelling the majority of other pixels. This could result in a relatively low mIoU even with a high overall accuracy.
Experiment results
In the future, to enhance the mIoU, it may be necessary to experiment various techniques, such as adjusting the NN architecture, employing different loss functions, incorporating more training data, etc.
Figure 6 illustrates an example of the model’s output. It is noticeable that the model successfully classifies and segments images (see comparison of ground truth mask and predicted mask). However, the segmentation contours of the predicted mask appear smoother than those of the image’s ground truth mask, an aspect that can be enhanced in the future.

PSP-Net output.
As described at the beginning of this section, in this part we describe the various calculations and operations performed to transform the output of our NN into a set of descriptive facts. Notice that, simple as it is, our method represents a novelty in the literature, where at present no such method can be found.
First, the mask produced by the model is analysed using the
We use centroids and coordinates to determine the circumradius of each region. The circumradius can be identified by determining the greatest distance between the region’s centroid and any of its coordinates. This is done by subtracting the centroid coordinates from the coordinates of each point in the region, squaring the result, and summing it across all coordinates in the region. The maximum of these distances is then taken and the square root is calculated to obtain the circumradius of the region, as expressed in the following formula:
where r co i is the i-th coordinate of region r and r ce is the centroid of region r.
Once the circumradius of each image region has been calculated, we attempt to select adjacent regions based on their spatial relationships. However, before to determining adjacencies, we decide to eliminate the very small water regions that were sometimes observed in the images. The objective of this procedure is to remove water regions that are too small from the mask. To do so, we sum the areas of all water regions in the mask. If the total area is less than a threshold value, which is set to 1% of the total number of pixels in the mask, we remove these regions from the mask.
The area of a region is defined as the number of pixels in the region. To calculate the area of a region,
Once the excessively small water regions have been omitted, the adjacent regions are calculated. In this work, we use a method for finding adjacent regions using the centroids and circumradii of the regions (see Fig. 7). Our approach is also based on the observation that adjacent regions are typically spatially overlapping and proximate to each other. To capture these characteristics, we use two measures: the overlap of the bounding boxes of the regions and the proximity of their centroids. To determine the adjacency of regions, we first check if the bounding boxes of the regions overlap. This is done by comparing the minimum and maximum x and y coordinates of the bounding boxes. Specifically, let R be a region with bounding box defined by the coordinates (x1, y1, x2, y2), where (x1, y1) and (x2, y2) are the coordinates of the top-left and bottom-right corners of the bounding box, respectively. Let O be another region with bounding box defined by the coordinates

Adjacency representation. Circles 1,2, and 3 circumvent the polygons defined by the irregular shapes generated in the mask by the NN. r1, r2, r3 are their respective radii, centered in their respective centroids of the polygons. The adjacency condition between two polygons X and Y holds when the sum of the r x + r y is less than the distance between their centroids.
If all of the above conditions are satisfied, then the bounding boxes of R and O overlap. If any of the conditions is not satisfied, then the bounding boxes do not overlap.
If the bounding boxes of two regions overlap, we calculate the distance between their centroids using the Euclidean distance 9 formula. This distance, d, is calculated by finding the difference in the x-coordinates and y-coordinates of the two regions. Specifically, we use the following formula:
where r x 1 and r y 1 are the x-coordinate and y-coordinate of the centroid of the first region, and r x 2 and r y 2 are the x-coordinate and y-coordinate of the centroid of the second region.
Once we have calculated the distance d, we can determine whether the two regions are adjacent by comparing it to the sum of their circumradii (see Fig. 7). If the distance is less than this sum, then the regions are touching and are considered adjacent:
where r r 1 and r r 2 are the circumradii of the first and second region, respectively (see Eq. 6). If the condition is true, then the regions are adjacent.
At the end of this procedure, we obtain the LID output, which consists of two.PL files containing logical facts (see Fig. 8) and is sent to the Perceptor agent.

LID output: Prolog facts describing the geometrical relations of the mask regions. Each region reports the region ID, class ID, and pixel coordinates (x, y) of its centroid calcutated by the skimage Python library. Here is shown just an extraction from a typical LID file, only the first 10 regions, which may contain hundreds of regions, depending on the complexity of the original aerial image. At the end of the LID file the adjacency facts are listed, as result of the computational geometry algorithm.
Observing Fig. 8, it is evident that each region has distinct arguments. The first argument is a region identifier, the second is the region label, and the third and fourth are the centroids’ x and y coordinates of the image. The file containing the facts of adjacent regions, on the other hand, includes two arguments that are most likely the two identifiers of the regions found in the file containing the information of the regions. Thus, the Perceptor agent learns, for instance, that region 0 is adjacent to regions 5, and region 1 to 5 and 6. And so forth.
As described previously, the Perceptor agent receives information from the Neural agent and processes it to determine whether flooding is occurring in a given area (see Section 4).
To assess the presence of flooded or non-flooded areas, the following set of rules are implemented:
In practice, two predicates are employed:
The
Finally, the
Overall, these predicates provide a useful set of tools for the automated analysis of aerial images and the classification of water and flood events. However, this simple kind of inference is to be intended as a proof of concept of the fact that results returned by NN can be processed, filtered and reasoned about so as to elicit the desired information. Such information might sometimes be obtained via a larger NN, that would however be more difficult to train, assuming that a suitable dataset can be found.
During the implementation of this agent, several goodness-of-fit metrics were evaluated to determine the agent’s ability to distinguish between flooding and non-flooding situations. This was made possible by the availability of ground truth values for the label flooded or non-flooded. Specifically, True Positive (TP), False Positive (FP), and True Negative (TN), False Negative (FN) values were evaluated (see Table 3). Thanks to these values, it was possible to determine the following precision and recall values for our agent: Precision: 57% Recall: 83% Precision: 58% Recall: 73% Precision: 57% Recall: 77%
Confusion matrices for the Perceptor Agent
Confusion matrices for the Perceptor Agent
In general, it can be seen that in all the different datasets (train set, test set, and validation set), the results of precision and recall are close to each other, indicating that our logic program is stable to the change in data it is subjected to. In the train set, the classifier achieved a precision of 57%, meaning that out of all the instances predicted as flood events, 57% of them were actually flood events. It also achieved a recall of 83%, meaning that out of all the actual flood events, the classifier was able to identify 83% of them.
Similarly, in the test set, the classifier achieved a precision of 58% and a recall of 73%. In the validation set, it achieved a precision of 57% and a recall of 77%. These results suggest that the classifier is capable of identifying a good percentage of flood events (see high recall), but still generates a relatively high percentage of false positives—cases classified as flooding where a flood event does not occur (see low precision). False positives can be problematic in the context of flood monitoring, as they can lead to false alerts or, worse, the allocation of unnecessary resources. On the other hand, it is important to have a high recall, as we want to avoid missing any actual flood events. In this sense, a balancing between precision and recall is required.
In the case of this sort of classifier, the recall values are relatively high across all three data sets, but the precision values could be improved. One way to potentially achieve this in future work, is by collecting more training data or fine-tuning the logic program by introducing more sophisticated forms of NN results post-evaluation. With the use of more sophisticated forms of reasoning, in fact, in future versions the classifier performance should increase, reducing the number of false positives.
It was decided, for the purpose of implementing this agent, to simulate a future API-integrated weather service (to avoid paying for this expensive service for now). Therefore, the simulation involves a Python program that sends a random set of events to the Alert agent. The events provided by this agent are equivalent to those provided by the future API integration and include four alert levels: green, yellow, orange, and red. The purpose of these alert levels is to convey the severity and potential danger of weather events. Green indicates that no intense or dangerous events are anticipated. The yellow alert level indicates that potentially dangerous local events are anticipated. The orange alert level indicates that events are expected to be more intense than usual. Finally, the red alert level indicates that extreme events are anticipated and the situation is extremely dangerous.
Alert agent
As described in Section 3, this agent is in charge of alerting the relevant authorities in case of receiving warnings from Perceptor and Weather agent. In addition to performing alert andpre-alertactions, this agent also includes a mapping between the alert levels provided by the Weather agent and the corresponding hazard levels, with green, yellow, orange, and red levels corresponding to low, moderate, high, and severe hazard levels, respectively, via the very simple code shown below:
As said previously, pre-alert and alert refer to different stages in the process of detecting and responding to critical weather conditions. A pre-alert is triggered when one of the agents—Perceptor or Weather—detects a potential critical weather condition. In the code below, it is identified by the events
Discussion and future works
The proposed hybrid system is an innovative approach to disaster management and prevention. Its ability to assign specific tasks to specialised agents distinguishes it from other traditional systems. In this architecture, the Neural agent is responsible for perceptual and image analysis tasks, relying on its NN to process large amounts of data quickly and accurately. The Perceptor agent, on the other hand, is responsible for evaluating the contents of the images and identifying the presence of flooding. Although the potential of a hybrid system is clear, below are some limitations and possible future work to improve our prototype. One enhancement of the system is the ability to perform more sophisticated filtering and evaluation of results than the simple example presented in this article. By working closely with disaster management and mitigation experts, we can develop more advanced detection and prevention strategies that take into account the probability of flooding in a given area and/or historical data on such events. The system can also be improved through defeasible reasoning, which allows us to make assumptions and draw correct conclusions about the meaning of images or other data sources classified by the DL model. With these advanced techniques, the system can become even more accurate and effective in disaster prevention. The logical agent can also help disseminate warnings to areas at risk, preventing loss of life and minimising property damage.
Besides the improvement of the Perceptor agent, the Neural agent can also be enhanced. Indeed, the datasets available for training NNs on catastrophes unfortunately have limited geographical coverage. Potentially this can lead to a problem in training the NN model, in which the model itself learns territory-specific characteristics. The portability of the approach depends on the ability to generalise these features to other geographical areas. If we want to use the agent in a specific geographical area with different characteristics than the dataset on which it was trained, it might be necessary to retrain the agent or fine-tune its parameters to ensure optimal performance in the new environment. Although it is possible to train a single agent for reuse anywhere, this approach would likely require a large and diverse dataset that includes examples from a variety of countries and regions. Alternatively, multiple agents could be trained, each specialising in a particular geographical area, such as Europe, Asia or Africa.
Conclusion
In this paper, we unveil a novel approach to designing and executing a MAS that seamlessly blends neural and logic modules to amalgamate data originating from diverse physical sources. Our objective is to enhance the confidence of alerts relayed to civil protection authorities. To attain this goal, we propose a propose a novel approach that integrates multiple sources of information through a perception-fusion paradigm. Our framework entails the collaboration of several agents, each tasked with processing specific data streams, such as image and weather information. During the test phase of our proposed model, we were able to achieve good results while maintaining computational efficiency. Specifically, the average time taken for the system to acquire the necessary image and weather data and determine the presence of floods in the area of interest was found to be 50 seconds. This highlights the potential of our proposed methodology to be implemented in real-world scenarios, where rapid and accurate decision-making is of utmost importance. Moreover, the sort of hybrid architecture that we have introduced holds the potential to be utilized in diverse application domains. In particular, our approach can be instrumental in aiding human operators who need assistance from AI systems or in creating Human-AI teams that can achieve synergy between humans and machines. This type of intelligent system is becoming increasingly popular as it can be used for performing complex tasks, such as initiating and coordinating rescue operations.
Footnotes
Acknowledgments
We are grateful to Professor Denise Boncioli from the Department of Physical Sciences and Chemistry for allowing us to use computing time on their deep learning workstation, which was obtained through a grant for young researchers at the University of L’Aquila in 2022.