
Abstract
This research is intended to evaluate the suitability of a common-sense-based approach for providing causal explanations to power quality disturbances and, more specifically, to voltage-sage events, with the aim of improving the security and reliability of the electrical grid. Since voltage sags are one of the most common power-quality disturbance and may have a severe impact on sensitive loads and users, the case study presented is dedicated to find their causes as a prerequisite to prevent them. The main contribution presented in this work is in the knowledge management domain. However, the proposed architecture adopts a multi-layer approach that comprehensively faces all the necessary stages, comprising: measurement and data collection, filtering, distribution, homogenization, and integration up to the process of inference of the possible cause of the event. The architecture of the proposed system comprises three layers, namely: the information gathering, the information modeling and the information understanding layers. The proposed system has been evaluated using a synthetic dataset of simulated voltages sags. Information about weather conditions and different location features and environmental circumstances is aggregated to the electrical features of the voltage sag, in order to improve the inference of the external cause of the event. Even though a real-world dataset would be required to fully validate the proposed system and assess the benefits in a real scenario, the results obtained with the synthetic dataset are satisfactory and an overall accuracy above 90% of the cause identification is achieved.
Introduction
In the last decades, the world has experienced a very significant increase of energy consumption, the development of distributed generation (i.e. renewable generation, such as wind power) and an increasing presence of electronic loads with a non-linear behaviour. This is leading to a generalized concern about future energy problems and sustainability. For this reason, governments and the scientific community are addressing important efforts at enabling solutions for an efficient, reliable, and responsible use of energy, appealing to an optimized and more flexible conception of the electrical grid. This new paradigm, known as smart grid [19], integrates advanced control and information technology to monitor and manage power generation, transmission, distribution, storage and consumption.
Power quality is an important aspect of the power distribution. Problems derived from the power-quality aspects of the power grid are turning the monitoring and diagnosis tasks into an appealing field for researchers working in the electrical and power engineering fields. Providing highly reliable power grids is essential for the development of activities in the industrial [26] and domestic domains, preventing equipment failures or malfunctioning, production losses and associated risks. The diagnosis and prediction of faults in power grids is of high interest and should lead to a set of actions intended to prevent or mitigate its effects. Nevertheless, research efforts are mainly targeted at collecting data and identifying patterns, rather identifying causes, providing solutions, or anticipating power faults.
In order to wisely respond to power-quality faults the smart grid requires a mechanism for causally explaining the power-grid events. Knowing that a phase-to-phase fault event has been caused by a tree branch hitting the overhead power line can be easily managed by sending a maintenance team to cut that branch and prevent it from growing enough to reach the overhead lines in the future. Paying attention at the external causes that lead to these situations can have an important impact in the reliability of the electrical grid, avoiding substantial economic losses. Regarding voltage sags, for instance, the main concern is the effect caused on sensitive loads, such as personal computers, adjustable speed drives, programmable logic controllers and power electronic components, that have a growing presence both in the domestic and industrial contexts, and might be involved in critical processes. Their economic effect in terms of losses is particularly relevant in some production processes, such us the semiconductor industry [59, 27]. Nonetheless, providing causal explanations for power-quality events is a task that depends not only on the specific domain knowledge (low-level details about the electric event) but also in a more general knowledge, referred as common sense. When a human expert analyzes the details of a power-quality event trying to identify its cause, a combination of the expert knowledge with that other knowledge collected along years that explains how the world works is required. An intelligent system trying to resemble the human capability to provide causal explanations to events should be based in the ability to identify, recognize, or hypothesize about an ongoing situation based on the occurrence of a set of events.
Additionally, the replication of the human rationality quality requires from the intelligent system the capability to capture or sense the events that take place in the domain, the capability to model that information in such a way that can be handled by the intelligent system and, finally, the capability to understand or capture the meaning implicit in that information. This work is intended to fulfill these demands.
Overall, the comprehensive nature of this work entails contributions to different fields (knowledge modelling, knowledge reasoning, data fusion, etc.). This article is organized as follows. First, Section 2 reviews the most relevant approaches that, to date, have been proposed to manage the information generated in the smart grid. Section 3 describes, from a triple perspective, the different contributions of our work through the proposal of a system architecture. Section 4 presents an illustrative case study about voltage sags. This case is employed for validation purposes and metrics have been obtained to assess the performance of the system. Finally, Section 5 outlines the main conclusions and contributions of this work.
Background
The main challenge to be tackled in the smart grid comes from the vast amount of information involved in it. In contrast to traditional grids, in which only the consumption metering information retrieved monthly, or even estimated in some cases for billing purposes, smart grids present a new scenario in which all the interconnected nodes, including smart meters, are gathering information about many different aspects related to the operation of the grid, and not only consumption (i.e. real-time generation prices, peak loads [22], network status, power-quality issues, protection status, etc.) [51]. In this sense, one of the main challenges for computational intelligence is how to, in an intelligent manner, manage such an amount of information so that conclusions and inferences can be drawn to support the decision making process. The communication network also poses important challenges from the point of view of the delay in transmitting messages containing all that information. The work in [34] proposes a model for evaluating such aspects and providing, at the same time, a quantification of the network reliability. Moreover, the management of the vast amount of grid events has been addressed by means of Complex Event Processing (CEP) techniques [32].
CEP has been proved to be a well-suited technology to tackle key requirements of Smart Grids, such as flexibility, robustness, and efficiency. An event represents the notification of something that has occurred and is described as a piece of information. In Smart Grids systems, events may be generated from a potentially large number of sources and transmitted at variable frequencies; they are related to, for instance, power quality (e.g. frequency, voltage, power factor) and system fault detections (e.g. overloads and actuation of protection). To be able to take decisions in near real-time, CEP enables the continuous monitoring of these events in order to react and adjust to new events in the grid as soon as possible [57]. The decisions could be oriented to, for instance, forecast electricity demand, influence customer usage patterns, create demand response program, optimize unit commitment, and prevent power outages. The processing of events consists generally in applying patterns that enable the assert if a certain condition holds. Patterns can be expressed in different ways, for instance, by means of declarative languages (e.g. SQL-style) and formal methods (e.g. logic-based). This was the approach followed in [47] and implemented in the ENERGOS project [45], both works preceding this current research. The experimental validation carried out in those previous work brought into light that the use of these types of languages were not appropriate for the real-time information processing required in Smart Grid applications. The associated processing overload calls for more efficient mechanisms. In this work we propose the use of a knowledge-base system, inspired in the NETL machine [15], characterized by its proved efficiency in terms of search and inference mechanisms and scalability [16].
The work in [32] states that Relational Database Management Systems are not adequate for managing Smart Grids and proposes instead a Big Data processing system for Smart Grids. This system is based on Lambda Architecture, which is more suitable for handling massive quantities of data by taking advantage of both batch- and stream-processing methods to handle unstructured data and large number of events per second. The architecture proposed includes a CEP engine based on Spark Streaming to process in near real-time the incoming events by applying map-reduce style operations, such as windowing, transformation, aggregation/grouping, merging/union, filtering, among others. According to the authors, the processing of a dataset of more than 55 million records took less than 10 seconds. The work in [53] investigates a holistic framework for complex event processing in smart grid systems. The core of the framework is an event-driven publish-subscribe middleware and the CEP is based on distributed multi-agent systems that are dynamically deployed on the nodes. All the knowledge of the system (e.g. services, devices, agents) is represented by means of logic-based declarative sentences. In [57] the description of a Smart Grid multi-layer architecture based on Semantic Web technology is presented. The Data Representation Layer uses Resource Description Framework (RDF) for expressing structured data and designing the vocabulary of the system, Linked Data principles to integrate and relate data proceeding from different sources, and URIs for identifying the resources. On top of the Linked Smart Grid Data, a CEP engine with inference capabilities based on the ETALIS language for events [2] is proposed. However, the paper does not provide evidences of using the language in combination with the architecture proposed.
In recent years, much research work has been done with the specific goal of failure identification (and its localization) in smart grids. To this purpose, a great variety of techniques have been used in order to define an expert system able to emit a diagnosis, namely: rule-based decision support systems [24], Bayesian networks [9], fuzzy logic-based approaches [10] to deal with the uncertainties of the system, or Petri nets [7], among others. Only a small subset of them employ techniques based on reasoning. For instance, in [23] a reasoning engine is proposed working dynamically and in a reactive way to give a response against attacks and failures that occur in the smart grid. The authors defined a real case study including 250 nodes, 30 physical cables and 25000 consumption datasets per day to demonstrate the detection of malicious shutdown commands and the prediction of electric consumption. The work described in [54] is aimed at obtaining the solution for several optimizations problems in the domain of smart grids by means of case-based reasoning, i.e. searching
The ultimate goal of applying CEP techniques for Smart Grids is to support the event filtering tasks that, eventually, bring into light relevant patterns. To this end, the selected events need to be semantically enriched in some way that they can lead to an understanding of the ongoing situation [43]. CEP systems need to be complemented with more sophisticated techniques that support the understanding process. In this sense, one of the possible approaches is the use of Qualitative Reasoning. In [47] an example of this approach employs a qualitative behavioral model of the electrical grid, in which some power quality issues such as voltage sags are modeled in order to anticipate their possible evolution and negative effects. To do so, the proposed approach provides a characterization of the power quality problem, presenting a qualitative behavioral model of the grid dynamics. This model supports a multi-agent system in charge of anticipating and reacting to power faults and disturbances.This work evidences the need for more efficient mechanisms for data management due to the latency derived from the use of a SparQL knowledge base. The findings in [47] motivated the current work in looking for more efficient mechanisms that could lead to a real deployment, therefore capable of working on a realtime bases. In this sense, our approach has consisted in replacing the OWL-DL reasoner and the external tool GARP with a comprehensive approach based on Scone. Moreover, the multi-agent system architecture of [47] also introduced an overload addressed here by proposing a planning-based approach.
The work in [58] identifies the most relevant challenges that have to be addressed by smart grid tecnologies, specially from the point of view of the knowledge management aspect. In this sense, ontology-based approaches are one of the most extended solution for information modeling and reasoning. The work in [45, 44] proposes the use of ontologies to model the profile of a standard smart grid. The importance of having an ontology for Smart Grid is twofold. On the one hand, it unifies the vocabulary used to describe the domain knowledge by stating the type of objects that play an important role in the domain, their properties and relationships. On the other hand, providing an ontology allows that information modeled by means of this ontology can be automatically plugged into large bodies of knowledge, and therefore logically related. Despite the strengths derived from the use of ontologies (data standardization, semantically-enriched data, data consistency, etc.) the main drawback of ontology-based systems is that they have traditionally been used as though they were simple databases in which information is stored fulfilling a stated model. Moreover, ontological approaches are incapable of dealing with uncertainty mainly due to their inability to handle a-priori inconsistent knowledge. Our approach strongly depend on that capability to handle, simultaneously, different explanations for the same events until they can be disambiguated or a decision has to be taken on regard of what explanation is strongly believed. Related to this aspect, the term ontology reasoning is commonly used in the literature to refer to consistency checking operations. This therefore means that no new information (implicit information) is extracted from the knowledge base. Contrary to this limitations associated to the use of ontologies, our approach employs a more flexible mechanism for information modeling that can handle a priori inconsistent information, by using a mechanism known as context. Please refer to [17] for further details about the multiple-context mechanism employed here. Our approach is therefore capable of postponing decision making until enough information is available, or when it cannot be delayed any longer. Finally, these approaches tend to be dependent on an ontology management system (in many cases Protege1) and therefore, the opportunity to run a real-time solution dramatically drops in these cases.
Regarding power-quality monitoring and diagnosis, several have been the technologies used to address the problem. The work in [61] presents an on-line approach to monitor power quality through the Internet. In similar way, works in [30, 31] resort to a web-based interface to manage a database system in charge of storing power quality data. Despite the benefits claimed by the author of the previous works, [33, 12, 14] point out some shortcomings such as high network bandwidth requirements, large storage capabilities, and expensive computational cost. Nevertheless, none of them provides any sort of advanced capability to identify fault causes, prevent damages, or provide restoration capabilities.
Proposed system overview
Based on the challenges identified by [58], we propose a multilayer architecture, as depicted in Fig. 1, through which data progressively evolve from raw sensor data up to causal explanations of power-grid events.
Different technologies are involved at different levels. In this regard, the information gathering layer is in charge of the retrieval, filtering, aggregation and distribution of real-time data from the large-scale grid infrastructure. The information modeling layer entails the semantic enhancement of the retrieved data and, to do so, standardized information models are adopted. Finally, at the information understanding layer, data will be analyzed in the view of domain-specific and common-sense knowledge to make sense out of the information retrieved from the previous layers.
Layered architecture.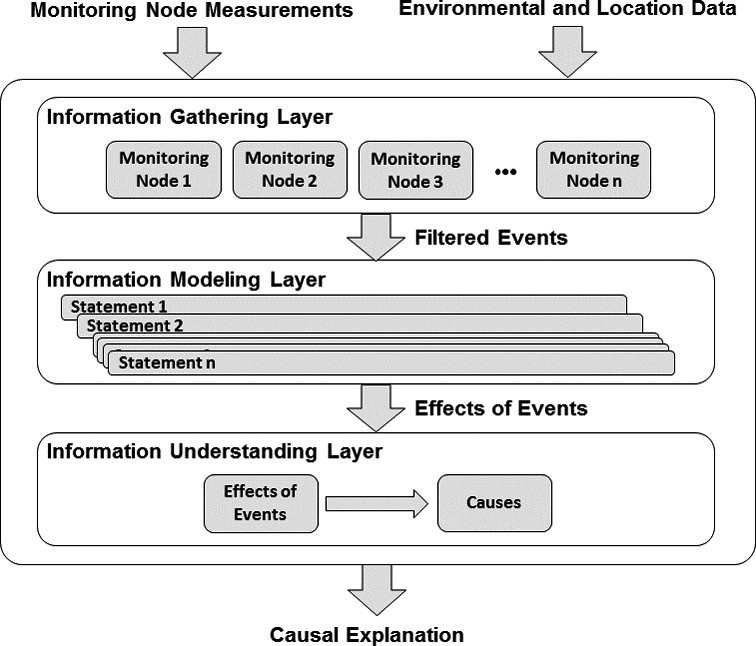
Due to the distributed nature of the electric grid, the process of information retrieval has to face, at a first place, the challenge of data gathering and distribution. To this end, we have resorted to the OMG standard for a Data Distribution Service (DDS) [42]. DDS is a publish/subscribe middleware specification that simplifies the process of real-time complex-event distribution. We have implemented a version of the OMG DDS standard over the commercial middleware ZeroC Ice.2
The platform implemented is an event-based open source middleware taking as starting point ZeroC Ice generic middleware. From horizontal mechanisms already implemented in ZeroC Ice (message broker, security issues, update management, etc.) we build over specific interfaces, as we’ll analyze later, a framework for smart grid information distribution following the OMG standard for a Data Distribution Service (DDS) [42]. DDS is a publish/subscribe middleware specification that simplifies the process of real-time complex-event distribution. We have implemented a version of the OMG DDS standard for the commercial middleware ZeroC Ice.3
ZeroC Ice also enables us to avoid “reinventing the wheel” effect and to provide a solution easy to port directly to the market. Scalability, secure communications (SSL), management tools, etc. are already proven mechanism in a multitude of projects so our proposal inherits its robustness and reliability.
An in-depth analysis of existent generic solutions as middleware base for our platform was done. The analysis and comparative are out of scope of this paper but we can summarize the key characteristics of the chosen ZeroC Ice as:
It is a flexible solution with support to main operating systems (Windows, Linux, Android, Mac, etc.), develop languages (C++, C#, Python, etc.) and deployment tools (e.g. docker). The horizontal services implemented enable us to focus in the smart grid solution. ZeroC Ice enable us to avoid “reinventing the wheel” effect and to provide a solution easy to port directly to the market.
Additionally, another of the main reasons was the protocol implemented under ZeroC Ice, Ice Protocol (IceP), which is a binary solution with short messages. A key element due the success of Low Power Wide Area Network (LPWAN) to solve the “last mile” problem in the IoT domain. Even with the current solution, mostly PLC based connection, the short messages used with binary protocols is a key feature.
There are a great variety of serialization formats available and several characteristics to be evaluated (size of messages, time of serialization/deserialization, flexibility, memory buffer size, etc.). The ENERGOS Project priorized the size of messages so other serialization alternatives, as XML or JSON, were discarded due to message size [35].
We propose a communication model in which a channel manager assumes the responsibility of creating and managing the different logical channels used for communicating publishers and subscribers. In ZeroC Ice, there is a service named IceStorm which is a communication broker so each of these channels defined has an associated IceStorm channel. All the management aspects are delegated to this ZeroC ICE middleware service. An IceStorm instance running in a monitoring node can be federated with other IceStorm instances so the distribution graph can be adapted to any grid configuration.
Additionally, the implemented communication model
also considers the possibility of creating communication channels where the data distribution is filtered according to certain criteria. This will help reducing the data traffic in a given channel which eventually impact the quality of service (QoS). The filtering mechanism we have implemented can also be used by publishers, determining the type of events they publish or discard, or by subscribers, in terms of the type of events they want to receive.
The upper layer module subscribes to filtered channels in such a way that, for instance, all the events published in the channel of a certain type of voltage sag correspond to the occurrence of that event type, at a given node of the power grid, in a given time and with certain characteristics. Further filtering can additionally be performed at the channel level. For example, we can split messages depending on the severity of the disturbance that is determined by the duration of the event and the depth of the voltage interruption.
Let’s see the key structures and interfaces designed and implemented.4 The most basic raw event is the MeasureMsg structure. This structure as been defined as general as possible in order to fit in any measure related with the smart grid. There are until four values with its quality associated, the unit of the measurement plus the period and/or season of the measurement. The timestamp denotes the time of the smart metering when the measurement had taken. The source of the event is inserted in the source field and the resourceId is a human-readable tag associated to the source. The most common source of this type of events are the smart metering devices distributed in the edge of the power grid.
struct MeasureMsg {
string source;
string resourceId;
long timestamp;
string measurementValueQuality1;
string measurementValueQuality2;
string measurementValueQuality3;
string measurementValueQuality4;
double analogValue1;
double analogValue2;
double analogValue3;
double analogValue4;
long measurementUnit;
long period;
long season;
};
The main interface of event transmission from smart grid edge upstream to the control center is implemented by the interface MeasureSink. The raw events, after processing will origin high level events (ControlMsg structure)
interface MeasureSink {
void activePower(MeasureMsg msg);
void reactivePower(MeasureMsg msg);
void voltage(MeasureMsg msg);
void Intensity(MeasureMsg msg);
void oilTemperature(MeasureMsg msg);
};
Information gathering example.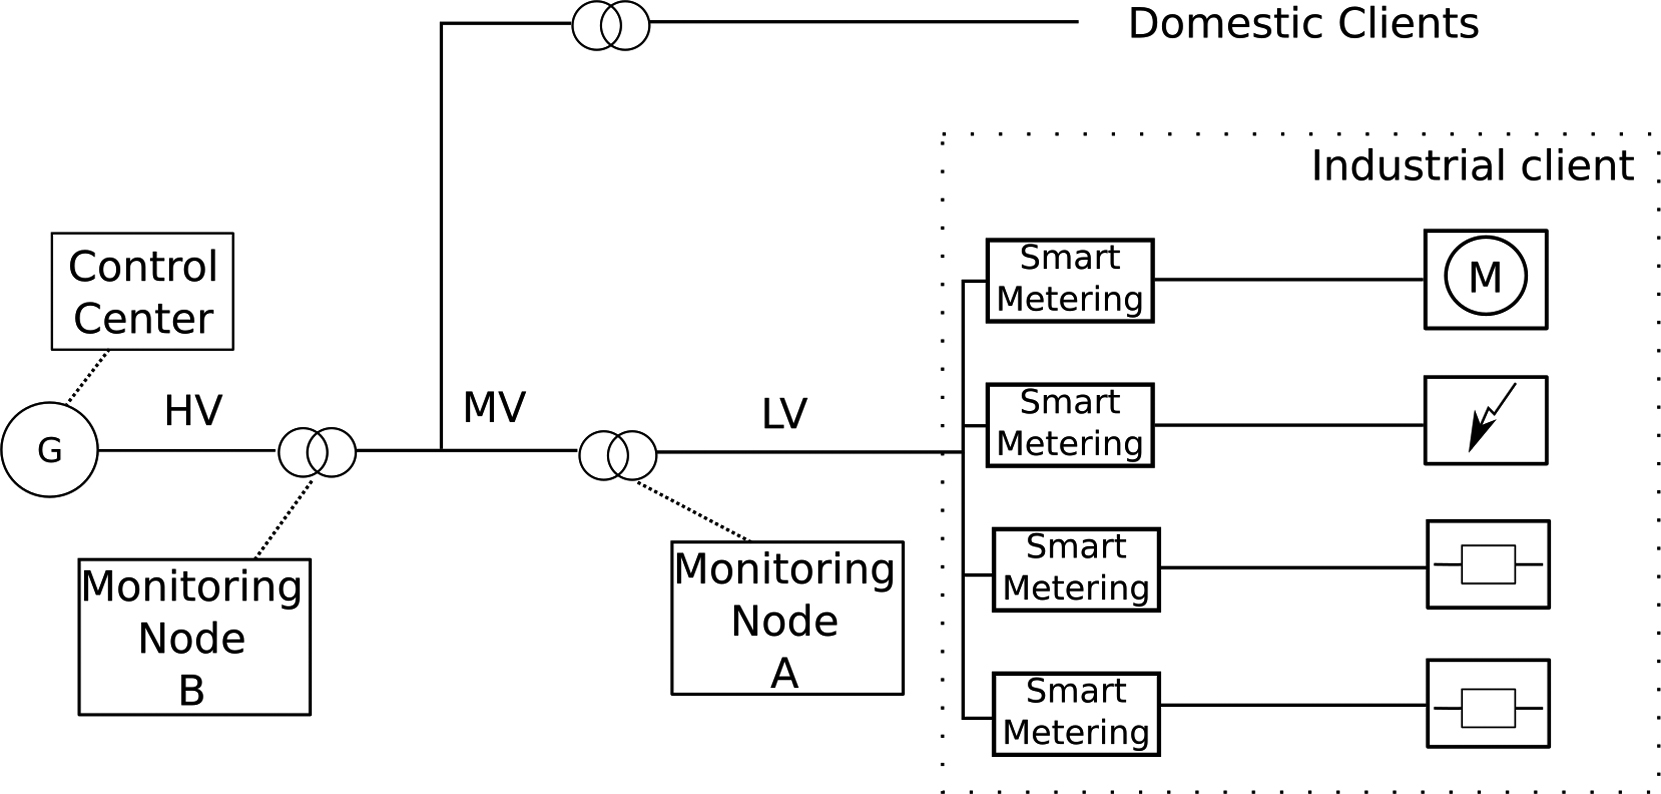
The interface of event transmission from smart grid edge upstream to the control center is implemented by the interface MeasureSink. The raw events, after processing will origin high level events (ControlMsg structure) through ControlSink interface. This last interface will be implemented in the control center. The ControlMsg structure can denote an high level event and/or the status. The source, resourceId and timestamp fields follow the same meaning than in MeasureMsg meanwhile eventType and svStatus indicate the type of high level type of event/status. In the case of event, the eventValueQuality field gives an idea about the reliability of the type of event inferred.
struct ControlMsg {
string source;
string resourceId;
long timestamp;
int eventType;
int svStatus;
string eventValueQuality;
};
interface ControlSink {
void event(ControlMsg msg);
void status(ControlMsg msg);
};
Finally, the structure devoted to distribute information about the quality of the service and anomalous events (e.g. a voltage gap) is the structure powerQualityResultMsg. In this structure we can see fields related with the duration of each even in each phase (elapsedTime fields), voltage gap amplitude (minVoltage field), overcharge current (maxCurrent field), location of the device which detect the event (resourceLatitude and resourceLongitude), an estimation of the location where the fault could be originated (latitudeFaultSource and longitudeFaultSource), etc.
struct powerQualityResultMsg {
string source;
string resourceId;
float resourceLatitude;
float resourceLongitude;
long timeStamp;
short sampleTime;
double elapsedTimeA;
double elapsedTimeB;
double elapsedTimeC;
double elapsedTimeMax;
float minVoltage;
float maxCurrent;
double faultImpedance;
short sourceLocation;
float faultSourceDistance;
float latitudeFaultSource;
float longitudeFaultSource;
float preFaultVoltage;
float preFaultCurrent;
};
In the Fig. 2 we have a basic example of node distribution. In a complex industrial client we can have several smart metering associated to different installations. Each smart metering device generates MeasureMsg events calling the appropriate methods of the MeasureSink interface. All he monitoring nodes implements the MeasureSink interface so usually, the smart metering device has configured the closest Monitoring node. The distribution of monitoring nodes is flexible enough to support several scenarios, from complex industrial clients who requires of dedicated monitoring node (e.g. Monitoring Node A in Fig. 2) to domestic clients where up to 4 k–6 k clients could report to the same monitoring node (e.g. Monitoring Node B in Fig. 2). By default, each smart metering device has set up at least two monitoring nodes for fault tolerance reasons.
The monitoring nodes aggregates information (for periodically information report) and analyze the information looking for anomalies and incidences. When an unusual event is detected (e.g. a voltage gap), an appropriate message is reported through ControlSink interface and by generating the infered powerQualityResultMsg event. As we mention before, the ControlSink is implemented in each control center.
The information gathering platform implemented is flexible enough to support several type of deployments leading with functional (grid fails, anomalous events, evolution reports, etc.) and non-functional issues (scalability, security, etc.).
Each host in the information gathering platform runs an instance of IceGrid node service and IceBox service, both of them enable to manage remotely the rest of services in that host. The services of our platform are dynamic libraries that can be distributed, updated and managed using IceBox and IceGrid administrative tools.
After this initial set up, we can remotely distribute our DDS implementation (with the filters associated) to the most suitable host according to the client needs. The service of causally explaining the detected events can be also distributed following the criteria of the client.
All the services distributed are logically connected through the event channel, which is properly configured according to scalability criteria. Our platform could support from a configuration where all raw events are sent to the control centre to a fully distributed monitoring configuration where the task of causally explaining is done in the monitoring hosts and only high-level events are sent to the control cent.
Information modeling
The use of a common semantic model, shared among the different modules involved in the proposed architecture, is essential due to the inherent distributivity and heterogeneity of the power grid. To this end, our knowledge model resorts to the standardization works previously done in electric sector standards such as the IEC 61970, IEC 61850 or IEC 61968 [45] and the harmonization work done in [38]. The semantic model proposed in [39] is used as the basis for our information model. Nonetheless, this model has not taken into account the purpose of providing causal explanations for power-grid events, and more particularly, for fault events. For this reason, the semantic model has to be extended to consider a broader notion of event.
Donald Davidson [13] considers the notion of event part of the common sense ontology. The Davidsonian view of what events are and how they can be individuated is supported by the knowledge about what caused the event to take place and what the effects of the event’s happening have been. Only by considering cause and effects can events be individuated in such a way that events
The notion of event and its effects is key to our system. The system capability to understand and causally explain fault events is grounded in the knowledge about how certain events can affect the world. However, the difficulty in modeling effects of events arises when additional considerations need to be taken into account, some of which cannot be definitely stated at the modeling stage and are therefore subject to the context. Abowd et al. [1] define context as:
“Context is any information that can be used to characterize the situation of an entity. An entity is a person, place, or object that is considered relevant to the interaction between a user and an application, including the user and applications themselves.”
Events cannot be considered in isolation but rather as a constituent part of the context in which they take place. The same sort of event might give rise to different effects if they are considered in different contexts. For example, given two contexts, one of which considers an utility pole nearby a busy road on a freezing nigh while the other one depicts the same scenario but in a forest area, the effects of a phase-to-ground fault are likely to have different causes. In the proximity of a busy road it is likely to be an accident of a car hitting the utility pole, whereas in the forest area it will likely be a tree branch contacting the power lines. This sort of effect, known as context-sensitive, need to be framed in a context in order to be determined.
The notion of context is therefore essential for our information model. It is here considered as a set of statements which, when used together, describe the knowledge about the world. There may be multiple contexts describing each of the different views of the world. The meaning or truth value of a statement is a function of the context in which it is being considered.
This information model has been captured in the Scone Knowledge Base.5 Scone is an open-source system that supports efficient and flexible mechanisms for common-sense reasoning [16]. Especially important is the Scone capability to manage a priori inconsistent knowledge. This is done by implementing a lightweight mechanism known as multiple context. A context is therefore considered an abstraction in which facts can be stated that are inconsistent with previous knowledge. This capability is key not only for the information understanding process carried out at the top layer but also for modeling events. Preconditions and effects of an event can be described in different contexts in such a way that only one of these contexts is going to be active at a time. The effects of an event are captured in the after context of the event, while the preconditions for an event to take place are described by the before context. Reasoning tasks can be carried out in isolation in each of the context without interfering between them.
At this point it is important to note that we use actions and events as two different concepts despite referring to the same reality, following the theory of actions proposed by Bach [4]:
“Actions are not events but instances of a certain relation, the relation of bringing about (or making happen), whose terms are agents and events.”
As for events, the same auhtor states the following assumption:
“I assume that events exist in space and time and that they enter into causal relations as causes and as effects.”
The information model we propose complies with this theory and makes this distinction by considering that actions are (in a is-a relation) events with an agent (in a has-a relation) and events can be related using a special type of inverse relationship that connect one event with a different one that causes it or vice versa.
This model is captured in the knowledge base in which the different actions and events are described in terms of the context before and after the action takes place. This approach lead us to relate the execution of an action with an event (or set of them) as prerequisites that should have occurred before the action can be accomplished. Furthermore, the execution of an action will lead to a new context in which several events might have been caused as result of the action execution.
Scone provides an excellent mechanism for reasoning about actions and events, the so-called episodic reasoning [18, 8]. Based on this capability, we have described a set of actions or events relevant for the context that involves the power quality aspects of the smart grid. For example, describing the event of phase-to-ground fault, in Scone, involves capturing the semantics that before the phase-to-ground fault event takes place the cable lines are not in direct contact to the ground whereas in the after context of the event, they are.
The use of Scone contexts allows to state that a propositional statement is true in a given context, like the fact that the lines are in contact with the ground in the after context of a phase-to-ground fault while stating the opposite in the before context (see code Listing 1). The fact that only one context is active at a time saves from the inconveniences of dealing with contexts holding, a priori, inconsistent knowledge.
Listing 1: Scone definition for the phase-to-ground event
(in-context {phase-to-ground BC})
(new-not-statement {line}
{is in contact with} {ground})
(in-context {phase-to-ground AC})
(new-statement {line}
{is in contact with} {ground})
Code Listing 1 describes the world before the phase-to-ground fault event takes place and afterward. These two descriptions are inconsistent by definition because the world changes as a result of the occurrence of such event. To handle this inconsistency we have defined two different contexts, as known: the phase-to-ground BC context that captures the world before the event takes place and the phase-to-ground AC that captures the world after. The inconsistency is therefore handled by having only one context active at a time. The reasoning processes carried out at the knowledge base will have to determine the specific context that it is being considered and therefore, the knowledge taken into consideration.
Information understanding
Whereas the previous layers deal with the problem of filtering, managing and turning vast amount of raw data into high-level power-quality events, this layer has the task of causally explaining the fault events and, more specifically, voltage sag events for the case study considered. According to Woodaward [60], a causal explanation accounts for an outcome based on how it depends on other variables or factors. There might be several causal explanations for a phase-to-ground fault, such as bad weather, insulation failure, animals or birds [41, 28, 40], among some of the most common ones, but if windstorms have been reported in the same grid segment where a phase-to-ground event occurs, it makes sense to conclude that the most reasonable explanation for such an event is the weather conditions.
This section describes the different elements we propose to support the understanding of the information provided by the previous layers and, eventually, conclude the cause that might explain that event. The next subsections analyzes the different approaches we propose to address the challenges involved in the task of information understanding.
Exploring the causes of an event
Under uncertain circumstances and, based only on available information, it is not always possible to pinpoint a single causal explanation. Sometimes it is not even possible to deduce a reduced set of plausible causes. It is therefore of great importance for the understanding module to be provided with the appropriate mechanisms to deal with those events whose explanations depend on additional and future information. One of these mechanisms should support the system capability to handle, in parallel, inconsistent explanations for the same event. Eventually, either further information will be available to bring into light the real cause or the human system supervisor might be able to provide the cause. Either case, the system should be capable of tracking down different courses of events under uncertain or ambiguous scenarios.
The most common approaches for knowledge management (databases or ontologies) are unable to hold inconsistent knowledge in the same knowledge base. In fact, ontology reasoners (Pellet, RACER, FACT++, etc.) depend on the knowledge consistency for correctly undertaking their reasoning processes. Our proposal consists in implementing inconsistent courses of events using the multiple-context mechanism [17] offered by Scone. The notion of multiple contexts is closely related to that of possible worlds [46] and it refers to the mechanism used to concurrently handle the possible-world semantics at the knowledge-base level. Our system is capable of simultaneously handling scenarios that are, inconsistent, between them, by constraining them into different contexts, as shown in code Listing 1.
Similarly to the example shown in code Listing 1, a context is defined for every causal explanation that is being considered, in parallel, for a given event. However, this mechanism is simply the tool to address the uncertainty that characterize real scenarios in which sensors might malfunction or be offline, and in which it is not possible to consider all the different circumstances that might surround an event. The understanding module requires an additional mechanism to deduce the causal explanation that may explain the occurrence of a detected fault event.
To this end, our approach to information understanding is inspired in the abductive planning [25] technique. It consists in inferring the cause or explanation for an event, given its detected effects and the context knowledge (location of the event, timestamp, weather conditions, etc.). As in a planning problem, we can identify the state space
Due to the fact that describing states in terms of sensor measures leads to an unmanageable number of states we shift to an information space, coincident with the state space, but in which states are defined by the filtered events distributed by the information gathering layer. A given state
States can be affected by the effects of events from the event space
The transition between two particular states is defined by the state transition function
Addressing the problem of information understanding as an abduction problem implies that, given the current observation of state
In Scone, the causes relation is described as a propositional statement involving two events, one causing the other, as listed underneath:
Listing 2: Propositional statements describing causes of events
(new-relation {causes}
:a-inst-of {event}
:b-inst-of {event})
(new-statement {short circuit} {causes}
{voltage sag})
(new-statement {phase-to-phase} {causes}
{short circuit})
(new-statement {hitting branch} {causes}
{phase-to-phase})
Code Listing 2 shows how a particular circumstance is modeled in the knowledge base. In this case, we model how a tree branch hitting the overhead power lines causes a phase-to-phase fault event which, by the way, has been described as a cause for short-circuit event, which at the same time has been described as the cause for voltage sag. These relations of causality among two events is used to work out the causal explanation for a fault event. To this end, given a fault event, we propose Algorithm 3.4.2 to conclude the cause or set of causes that causally explain it.
The after context of the event space
Managing uncertainty
An essential element of the proposed algorithm is the function getCausesOf in charge of providing the causes of an event. As mentioned at the beginning of this section, the understanding module has to be capable of dealing not only with those events (or effects of events) that can be directly mapped to a certain cause but also to those that require further processing.
CausalExplanationFor(
Most of the power quality disturbances are caused by events that can be categorized as internal and external events [28, 50], depending on wether their occurrence are motivated by equipment failures or external events (animal contact, accidents, maintenance works, etc.). These causes can be easily characterized to be provided as inputs for machine learning algorithms or expert systems [55, 49]. Nonetheless, the performance of these approaches depends on the degree of certainty of the data inputs as well as in having all the required information at the moment of constructing the feature vector that characterize the event. These approaches do not support the reevaluation of an event in the light of new information. Think of a phase-to-phase event that, at the moment of its occurrence, cannot be categorized as being caused by a tree branch hitting the overhead power lines because there is not enough evidence for that event to be concluded. This, however, can be easily pinpointed after the meteorologist agency report strong winds in the same area. This type of information, normally provided by third parties, is not immediate but of a great importance. For this reason, although traditional mechanisms perform well assuming that data are certain and available on time (when needed), their performance is limited under uncertain circumstances.
To address this limitation we propose a novel approach for information understanding based on the use of Construction Grammars [20]. This approach is gaining much attention from the field of Natural Language Understanding as a very promising tool for enabling more intelligent language technologies [56]. Construction grammars provides a very useful mechanism for modeling natural language, emulating the human comprehension process. This techniques exploits the human ability to understand human sentences despite being grammatically incorrect, having missing elements or even with spurious words. Similarly to the problem of Natural Language Understanding, finding causal explanation to power quality disturbances can benefit from the ability to deal with uncertain or missing pieces of information.
The proposed construction grammar engine (CxE), inspired in [21, 37], implements a simplified version that specifically focuses in identifying the cause or causes that comply with a given list of events. Whereas in the field of Natural Language every construction of a construction grammar has an associated meaning in our case, every construction has an associated cause. In our proposal, the problem is therefore reformulated to elaborate constructions capturing the patterns of the most common power grid events. More specifically, our implementation has focused in modeling the external causes of voltage sags.
The proposed CxE is built in Phython 3 with a direct connection to the Scone Knowledge Base. All works related to the production management has been built in Python whereas the knowledge reasoning and inference tasks are delegated to the Scone Knowledge Base. The connection of both elements is delegated to the middleware.
Constructions are the essential elements of the proposed construction grammar approach. A construction is modeled as a set of variables that, depending on the associated values, would have a specific meaning. We propose the use of constructions to account for the causes of a given voltage sag event. These causes refer to the external causes identified as part of the expert knowledge, and gathered from state-of-the-art works [28, 50]. For example, the construction that explains a phase-to-ground fault event due to a bird hitting the overhead power lines is characterized by having normal or low wind conditions, since birds do not fly during strong winds, and a temperature that is not low, for the aforementioned reason. Then, the construction considers also the area in which the event takes place. If the area can be identified as a special bird protection area then, this cause will be preferred (or rewarded usin the CxE terms) over others.
This construction is formalized as follows:
This cause, labeled as cause 1, is determined by having
In appearance, what distinguishes this construction from a rule of rule-based system is our capability to handle uncertain, vagueness, and historic knowledge. For example, a special bird protection area might cover thousand of square miles. Obviously this is something that can be easily quantified given the exact boundaries of the area, but practice tells us that birds are unaware of those administrative limits. Common sense tells us that those locations, in the proximity of the special bird protection area, that match the circumstances of cause 1 would likely be caused by birds, even though the location is not administratively part of that area. For the same reason, common sense tells us that just after gusts of wind we do not expect flying birds. Some time is required for the birds to consider it safe to fly.
As it can be observed in the previous paragraph we use vague terms, such as proximity or some time. This is what distinguishes us (human beings) from computers, as it is our capability to handle this type of concepts. Nonetheless, this has been the focus of the qualitative reasoning discipline. Scone, through its multiple-context mechanism offers us a perfect tool for supporting qualitative reasoning works. Think that talking about a low temperature in the context of winter in Alaska is not the same as in California. This same mechanism can be employed for modeling the probability based on previous knowledge. If we consider an area in which few events have been considered (imagine that only ten events have been reported in the last year), having five of them due to the same cause can leads to talk about a high probability. However, having four of them means that it is less probable? As mentioned before, this cannot be modeled quantitatively but rather using qualitative means.
Along with contexts, the other mechanism we propose to enhance our system with qualitative reasoning capabilities is the use of fluents. This concept was first stated as part of the Situation Calculus theory of McCarthy and Hayes [36]. Fluents are those functions that, subject to situations, denote the effects of actions or event. A situation, from the Situation Calculus, is what we refer here as context. Propositional fluents are those functions whose application domain is (true, false), whereas the situational fluent domain is that of the situation set itself. For example, the fluent rain(x,s) asserts the fact that it is raining in place x in the situation (or context) s.
Listing 3: Using fluents for modeling a bending branch event
(new-event-type {bend until tree branch breaks} ’({event} {bend})
:roles
((:indv {bentBranch} {branch})
(:type {branchBendingRadious} {measure}))
:throughout
((defvar force)
(defvar branchRadious)
(defvar t_s)
(new-indv {instant-T0} {time point})
(new-indv {instant-T1} {time point})
(new-indv {instant-T2} {time point})
(new-statement {instant-T0} {before} {instant-T1})
(new-statement {instant-T1} {before} {instant-T2})
(defvar bbr (lookup-element {branchBendingRadious}))
(push-element-fluent bbr
:BendingMoment ’(/ force (* bbr
(/ (*3.14 (expt branchRadious
4)) 4)))))
:before
((in-context (new-context {bend until tree branch breaks bc} {general}))
(setq *current-time-point* {bending tree branch T0})
(new-statement {bentBranch} {status} {unbent})
(fluent-hold-at-time bbr :BendingMoment {instant-T0} ’unbent))
:after
((in-context (new-context {bend until tree branch breaks ac} {general}))
(setq *current-time-point* {instant-T1})
(fluent-released bbr :BendingMoment ’(/ force (* bbr
(/ (*3.14 (expt branchRadious
4)) 4))){instant-T1})
(fluent-hold-at-time (lookup-element {branchBendingRadious})
:BendingMoment {instant-T2} ’broken t)))
The code Listing 3 shows the use of fluents for modeling events such as that of a bending tree branch. This event captures the change suffered by a tree branch due to an external force. The bending moment is modeled as a fluent. This fluent releases when the branch breaks.
The approach we propose to characterize the circumstances that explain a given event therefore combines common sense and qualitative (through the use of fluents) reasoning. Both strategies have to be implemented at the knowledge base level.7
The causal explanatory module
The causal explanatory module we propose here is inspired in the construction grammar approach followed in [37]. First, the events provided by the information modeling layer has to be parsed as events in the knowledge base. Since this type of information is structured it can be easily parsed. Every event is labeled with information about its type (phase-to-phase, phase-to-ground, or balanced sag, for the voltage sag case study), the timestamp when it was detected and the grid segment in which it has been identified.
Every event is afterwards contextualized, meaning that a new context is created to analyze that event along with the knowledge about the location, weather, time, etc.
Algorithm 3.4.2 is run in order to identify the cause or list of causes for that event. The getCausesOf function will run the CxE for those events that do not have a direct cause. Balanced dips, for example, are caused by the connection of large loads. This type of event is directly mapped to its cause but other type of events, such as the phase-to-phase or phase-to-ground faults can have more than one cause and therefore further analysis is required.
The CxE supports a set of mechanisms to identify the most plausible cause among those that may explain the event. These mechanisms include support for scoring as a mean to promote on construction over others when there is more than one matching. This scoring mechanism considers different punctuation for those constructions that satisfy certain type of variables that are considered optional. Every optional element is assigned a punctuation, depending on the importance that the expert has granted to it. It is also possible that all optional values are assigned the same weight. One of the construction that considers the ice as the cause of a phase-to-ground fault event apart from the low temperature variable, takes as optional variables the humidity and wind. If there is high humidity and strong winds, ice is more likely to appear and this to be the cause of the event. These two optional variables are weighted, with the humidity variable having a greater weight than the wind.
The evaluation of the different constructions yields a weighted list of the causes or the cause (it may only be one) that comply with the information available in the context. If the cause if only one, this is yielded as the explanation provided by the system. If there is more than one cause, the one with higher weight is selected as the cause provided by the system. Then, the other causes are modeled as parallel dimensions providing a different explanation for the same event. These dimensions (modeled as Scone contexts) are kept alive for some time in case further evidences appear that may favor one of these parallel dimensions over the one initially selected. This mechanism is also employed for those situations in which none of the constructions matches the variables. The engine waits for further events (temperature, humidity, wind measures, maintenance-work reported, etc.) to take place in case some of them may lead to a plausible cause.
Prototype for the voltage sag case study.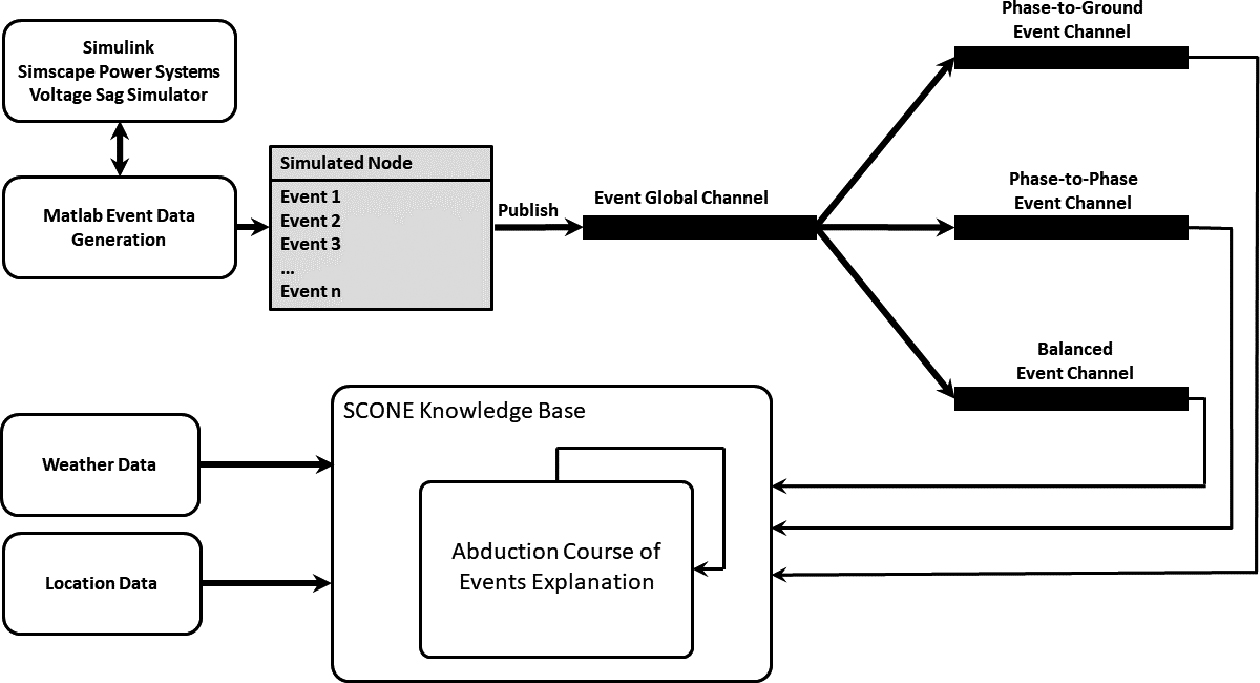
Simulation simplified diagram.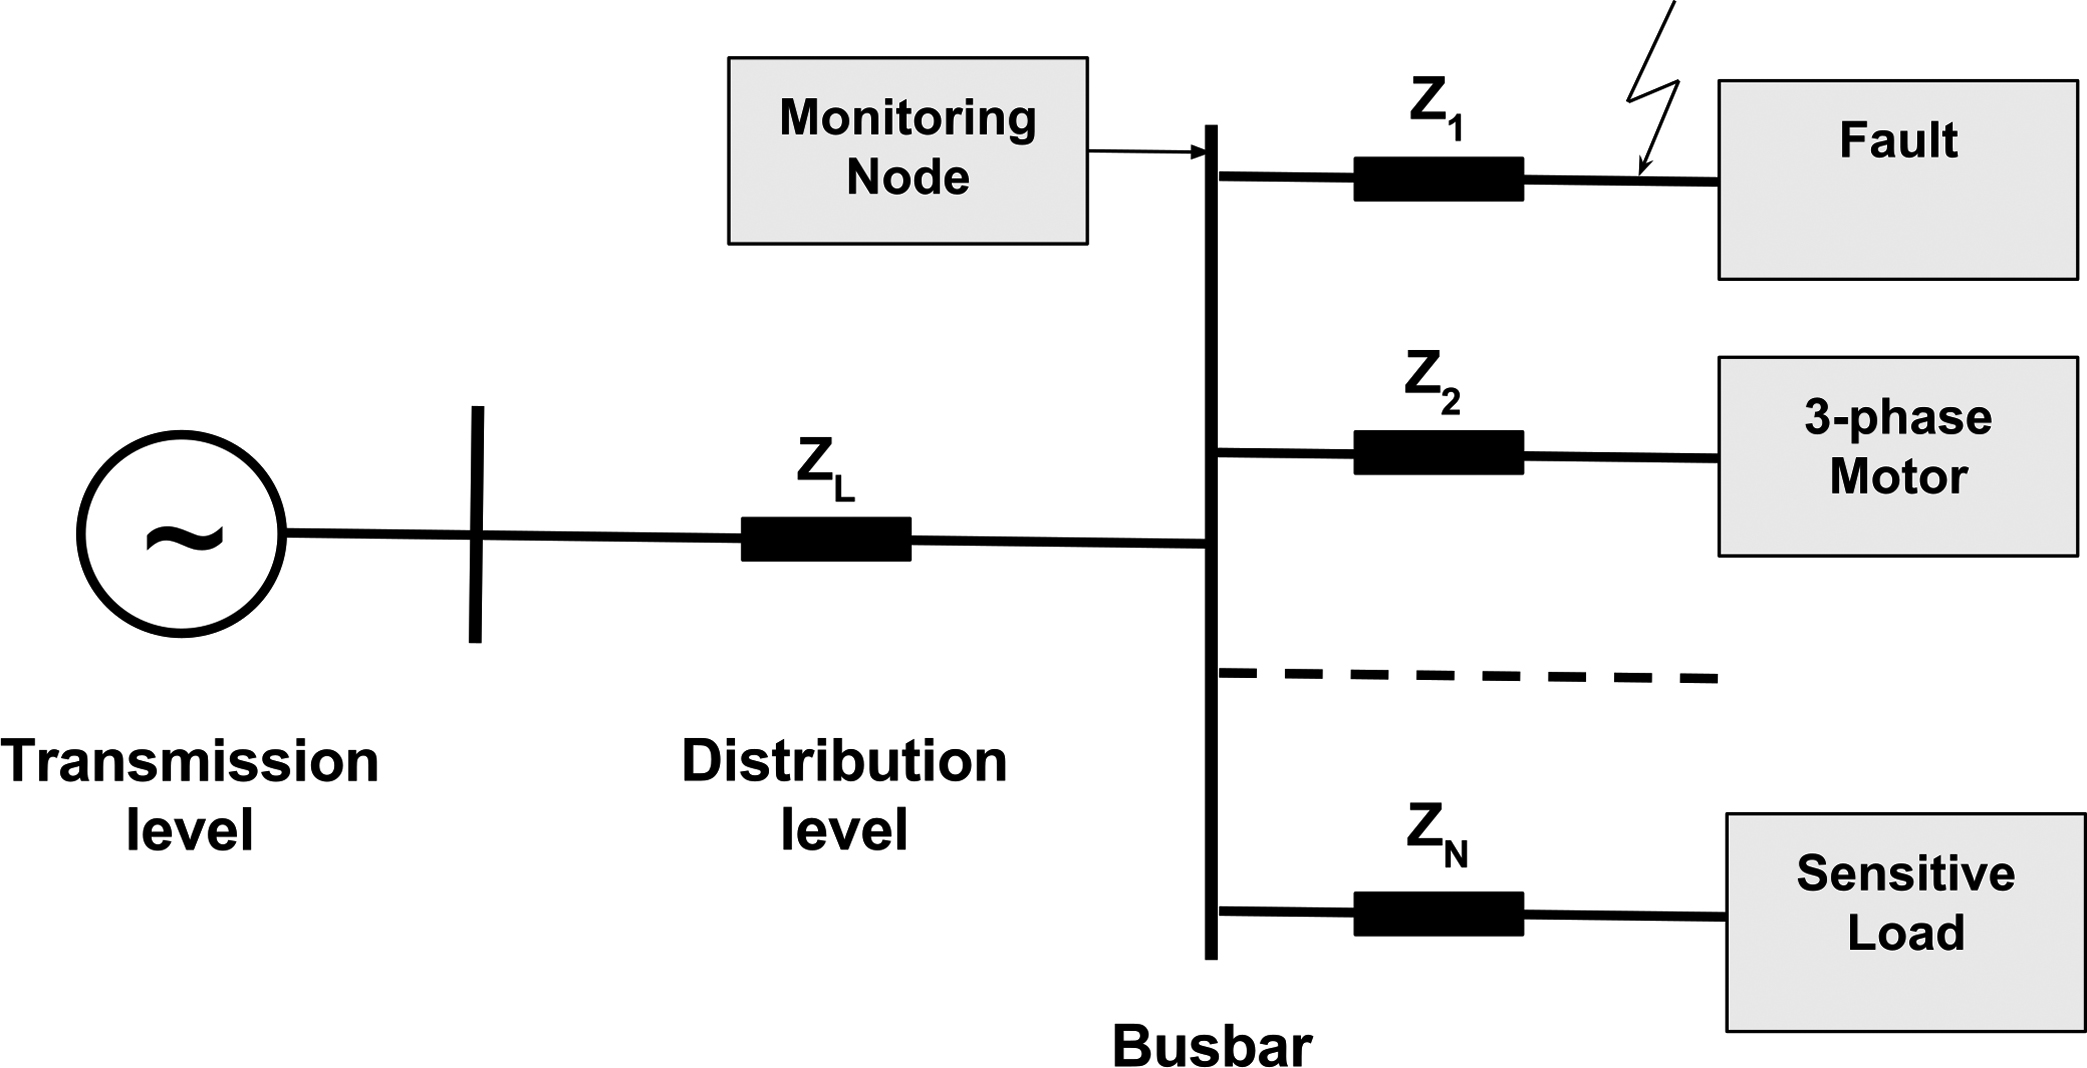
Voltage sags: Definition, causes and classification
A case study based on the monitoring and diagnosis of voltage sags has been considered to illustrate the functioning of the proposed method and for validation purposes.
According to the IEEE Std 1159-2009 [52], a voltage sag is defined as “a decrease in rms voltage to between 0.1 pu and 0.9 pu for durations from 0.5 cycles to 1 min”. Voltage sags are expressed as a percentage of the nominal voltages that remain (i.e. a 25% sag in a 230 V network means that the remaining voltage during the sag is 57.5 V). Nowadays, due to the reliability of modern electrical networks, and the reduced occurrence of long interruption (i.e. blackouts), the focus regarding power quality has moved to other types of disturbances such as voltage sags, due to their high frequency of occurrence and effects.
Simulated C-type sag. Duration 0.205 s, retained voltage 46% (0.46 pu). Short circuit between phases a and c.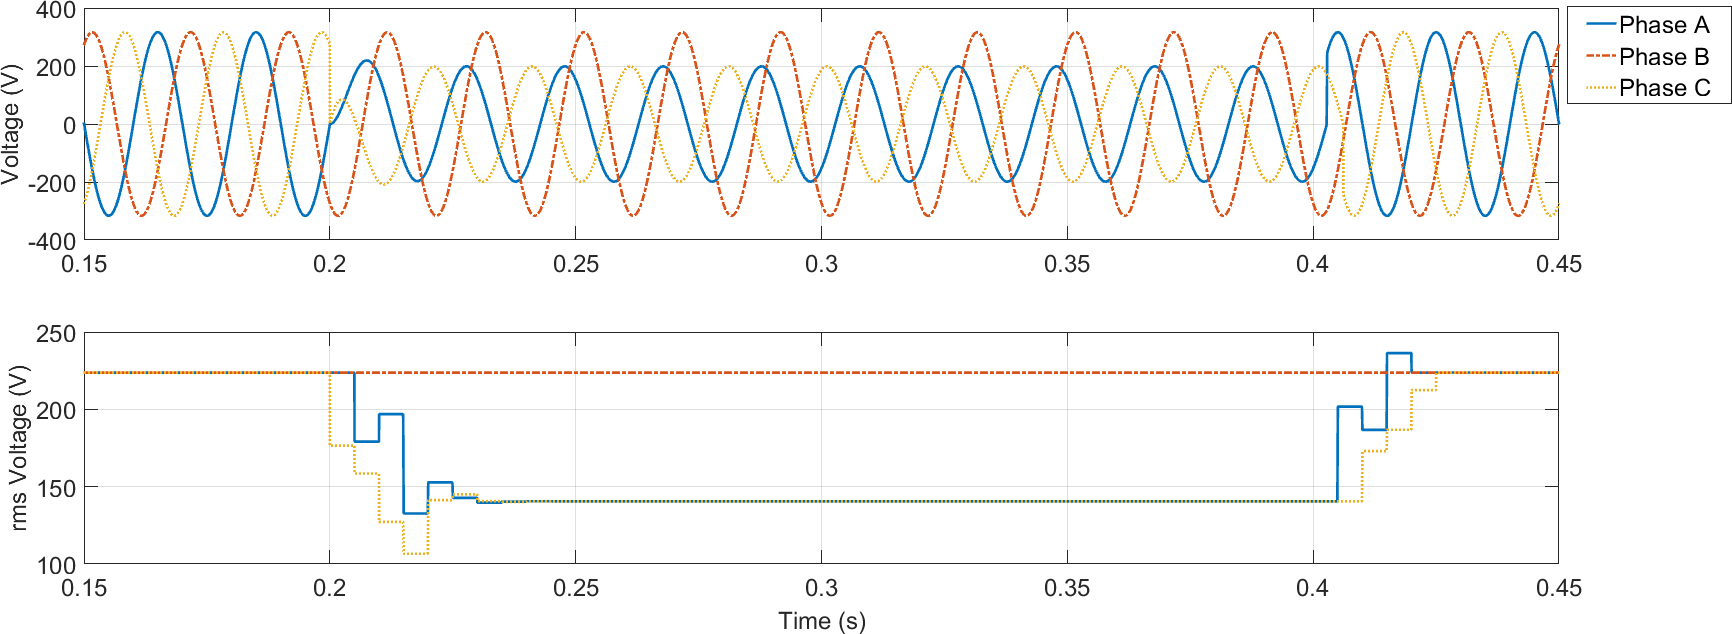
Simulated A-type sag. Duration 0.133 s, retained voltage 61% (0.61 pu).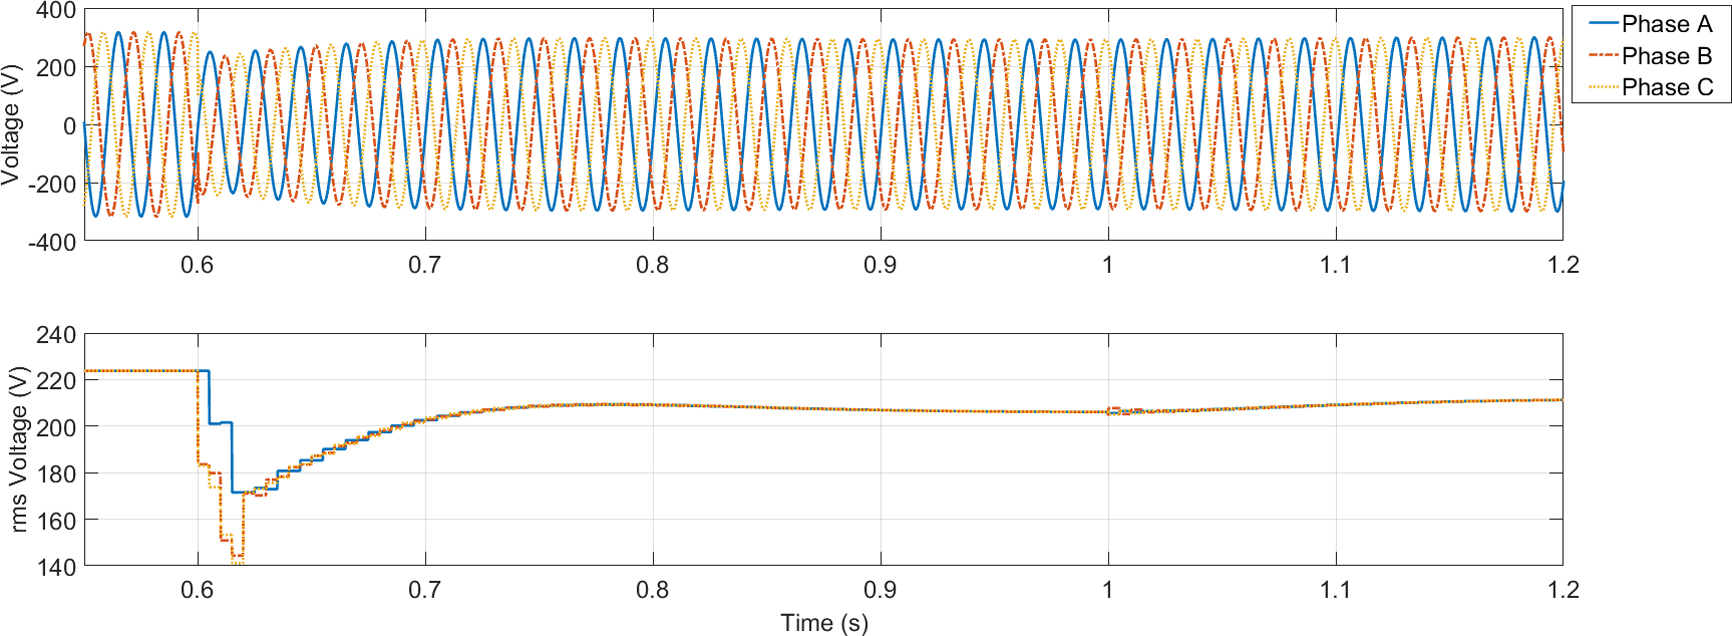
Voltage sags are caused by a short-duration increase in current in a power line. Their short duration is due to the activation of protections, typically of few cycles. This increase in current causes a voltage drop in the line impedance that is experienced by other loads connected to the same point of common coupling (PCC). The main causes for this increase in current are: short circuits and earth faults, starting of large induction motors and energizing of transformers. Short circuits and earth faults are the most common causes and they are generally caused by one of the following situation [28, 50]:
Bad weather condition such as rain, thunderstorms and lightning strikes, or high winds that might cause tree branches to hit power lines. Additionally, snow and ice might build-up on power line insulators. Certain environments, such as coastal areas, might cause salt spray to build up on power line insulators over time. Similarly, in inland dry areas dust might cause a similar effect. Underground lines might also experience faults due moisture and the degradation of insulation materials. Certain animals, snakes and birds might also cause short circuits either phase to phase or phase to ground, when accidentally contact power lines. Vehicles occasionally collide with utility poles causing similar effects. Construction activity might damage underground power lines. Industrial plants in which large electrical motors are started either individually or in groups, causing large inrush currents that may also cause voltage sags.
Voltage sags are characterized by their residual voltage and duration. Their severity results for the combination of both variables. They can be classified according to the magnitude and phase of the three phase voltages during the event. There are two main classifications methods: the so-called ABC classification, which is a sag-specific characterization method, and the symmetrical components classification, which is a more general characterization method for three-phase systems [6]. The sag type depends on certain factors:
The fault type: Single-phase-to-ground fault,phase-to-phase fault, double-line-to-ground fault, and three-phase fault. The location in the power system (i.e. transmission or distribution level) and the transformer type and associated propagation. Load connection (Wye or Delta).
The prototype used for the case study is depicted in Fig. 3. In this prototype, events are generated for every voltage sag occurrence. These events are synthetically generated using a Matlab script. This script starts a simulation model of a simplified power grid (see Fig. 4) implemented in Simulink using the Simscape Power Systems toolbox.8 The following information is then generated and retrieved from the sag measured voltages:
Node ID. Timestamp of the event. Retained voltage (i.e. minimum one-cycle rms voltage value among phases during the sag). Duration (i.e. time during which rms voltages are below the 0.9 pu threshold). Type of sag according to the ABC classification [11].
Examples of two different voltage sags are illustrated in Figs 5 and 6, corresponding to a single-phase-to-ground fault and the starting of an induction motor (i.e. a balanced voltage sag), respectively. These two faults illustrate the type of events generated by our simplified grid model.
A test-driven development (TDD) [5] approach has been used for the implementation of the information gathering and modeling layers, implying that both modules are tested as they are being developed. A test plan was developed9 for validating the data distribution carried out by the information gathering module. Tests were designed to validate aspects such as the subscription and publishing without filters, with filters at channel level, filters at publishing level, at subscriptors level, or modifications of the subscriptor filter.
Similarly, domain-specific and common-sense knowl-
edge has been encoded following a TDD apprach. To this end, the Lisp-Unit10 library has been employed. Tests are devoted to validate the statements of the before and after contexts of events.
Finally, validating the information understanding layer supposes the validation of the whole system. To this end, the Matlab/Simulink model can be run to generate different types of voltage sags with different severity levels, following random patterns or statistical distributions related to voltage sag occurrence. These data are afterward provided to the global event channel. From there, depending on the type of sag, filters will be applied and statements about the sag occurrence will be asserted to the knowledge-base. Once in the knowledge base, the understanding module will engage in determining the cause of the event.
To the best of our knowledge we have not found a public dataset to evaluate the proposed system. Only very few publications deal with diagnosing external causes [3]. Moreover, as stated in [29] the use of synthetic data of power quality disturbances are advantageous for evaluation purposes and therefore widely used. For this reason and due to the lack of real labeled data, a synthetic dataset has been created for validation purposes.
The work in [3] refers to a private dataset compiled along five years using 63 Power Quality Monitors in a given distribution network. This work presents the following distribution of causes: 27% of the detected faults are due to animals, 18% due to lightning or storms, 41% due to trees and 20% due to cable faults. As the authors note, this distribution of causes is highly dependent on the location and grid configuration, and, hence, it is not possible to generalize the presented values.
In the synthetic dataset generated for our case study, 1000 voltage sag events have been created using the Matlab/Simulink model. These sags are grouped into three different types, namely: phase-to-phase faults, phase-to-ground faults, and balanced sags.
In order to enrich the input data that might lead to causal explanations, we have aggregated meteorological information and location-related data. For the meteorological data synthesis, we have considered humidity, temperature, wind, and the frequency of storms. These variables are simulated following real historical data extracted for the city of Ciudad Real (Spain) from Aemet.11 Matlab has been used to generate these data, employing a Normally Distributed Random Number generator, using the mean and variance values for the temperature, humidity, wind, and storms for that area. Additionally, we have considered 100 monitoring nodes. The following location characteristics have been generated for the monitoring nodes:
Coast area. Forest area. Bird special protection area. Area with roads nearby. Accident blackspot.
Every feature has been modeled as a boolean category such that a monitoring node may or may not fall into it with a certain probability.
Synthetic dataset for the phase-to-ground fault voltage sag causes
According to the aforementioned setup, the dataset comprises 1000 voltage sag events, with the following distribution: 319 phase-to-phase faults, 340 phase-to ground faults and 341 balanced sags.
Phase-to-ground fault confusion matrix
Phase-to-ground fault confusion table metrics for each cause
Phase-to-ground fault confusion table rates for each cause
Due to the lack of a real labeled dataset with the causes of each event, we have resorted to manually assigning the most probable cause based on our knowledge among the possible causes of faults: birds (or other animals), cars due to accidents, maintenance works, salt grown in insulator in coastal areas, storms with lightnings, or strong winds causing impacts of tree branches. In case of high uncertainty the cause may remain as unspecified.
The causes given by the manually labeled dataset have been compared to the causal explanation provided by the proposed system. The results have been obtained for the phase-to-ground faults, that are the most common and might be due to a larger number of causes in comparison to phase-to-phase faults. Balanced sags due to the connection of large electrical loads are easy to identify and have not been considered in the study case.
The frequency of occurrence of each cause in the generated phase-to-ground fault synthetic dataset is shown in Table 1 for a total number of 340 events. It reveals a rather unbalanced distribution of causes, where the birds are by far the main cause. We can also highlight the large number of unspecified cases that reveals a high degree of uncertainty and will require the aggregation of more relevant data to the event in order to be able to discriminate those cases.
Bar chart representing the confusion matrix for the phase-to-ground fault cases (1: Birds; 2: Car; 3: Maintenance; 4: Salt; 5: Storm; 6: Unspecified; 7: Wind).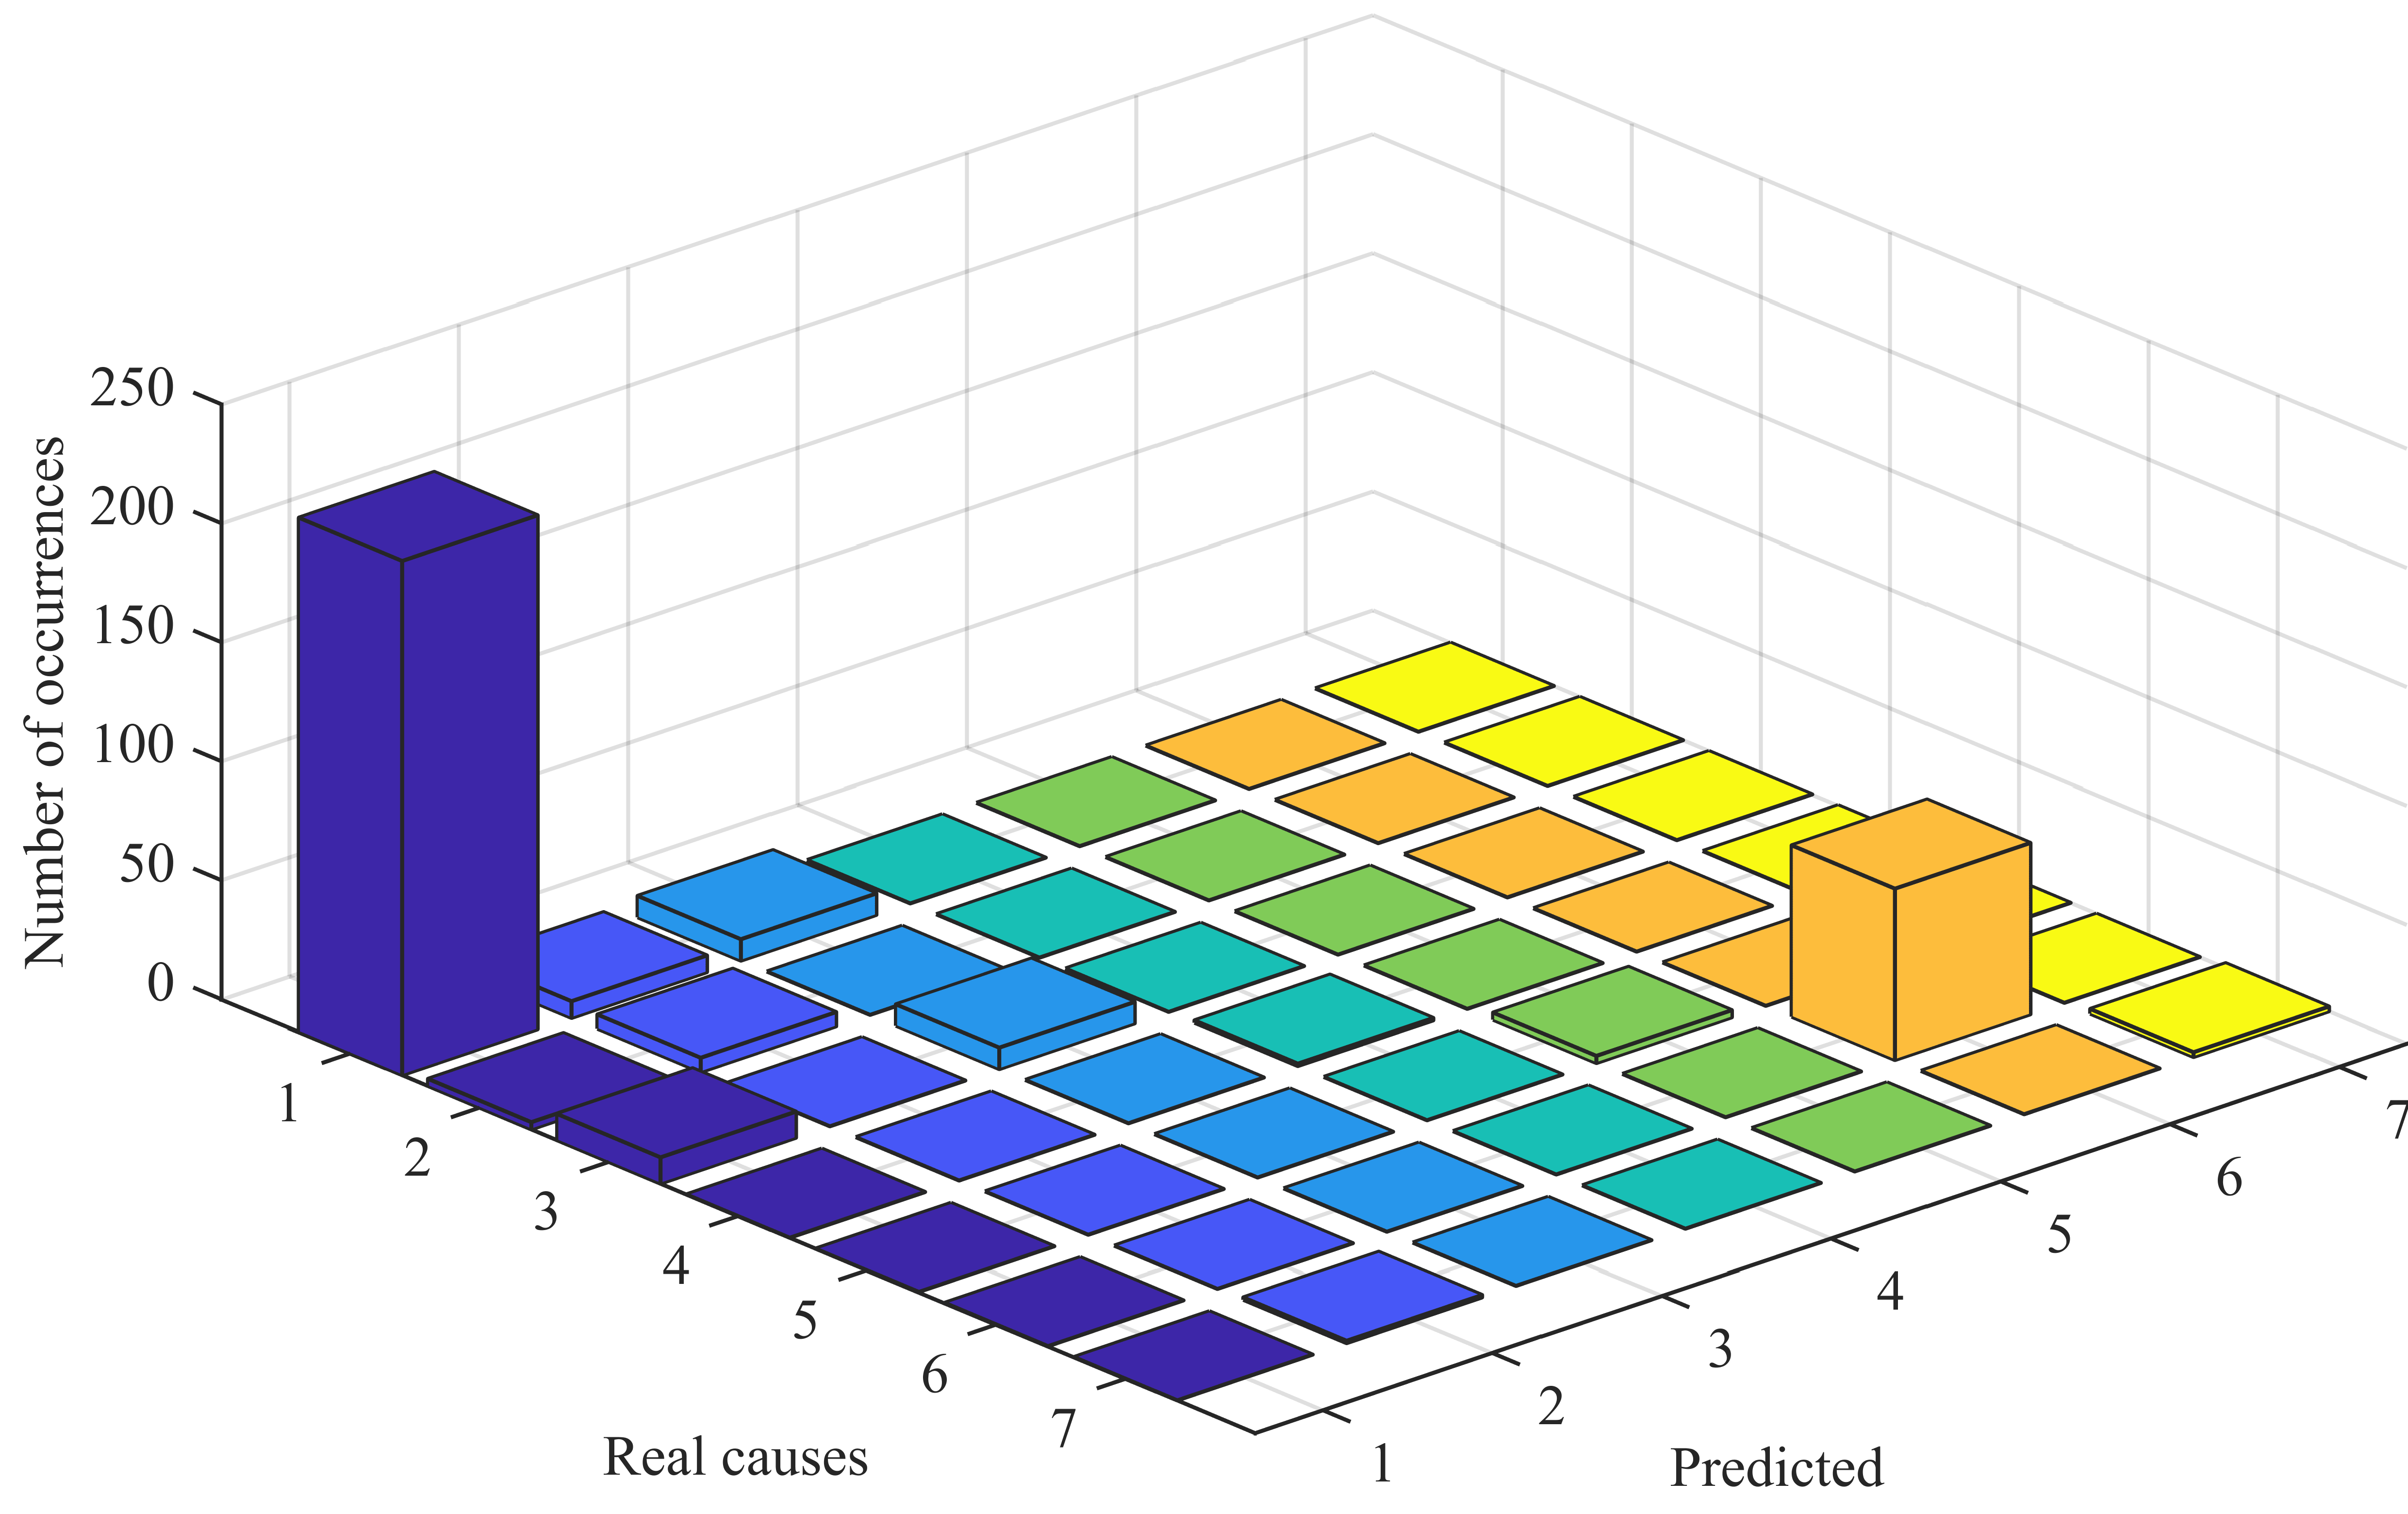
After running the generated dataset a comparison of the causal explanation (prediction) provided by our proposed system and the causes labeled in the synthetic dataset yields the confusion matrix presented in Table 2.
This confusion matrix is graphically shown in Fig. 7. One can visually confirm the aforementioned unbalance of causes in the cases comprised in the synthetic dataset, which is particularly remarkable for the birds and unspecified causes. Moreover, the higher bars of the plot are located in the diagonal that contains the true positive and true negative cases, as desired, except in the case of the maintenance cause.
The metrics associated to the previous confusion matrix are presented in Table 3, showing the positive and negative cases, together with the number of true positives and negatives, and false positives and negatives for each of the considered causes.
From the previous metrics, the rates of true positives and negatives, and false positives and negatives are obtained and presented in Table 4 to evaluate the accuracy of the predictions.
It can be observed that the worst case is the determination of the maintenance cause. For the rest of causes, the true positive and negative rates are very high for the birds, salt, storm and unspecified causes; and moderate for the car and wind causes. For those causes where the number of occurrences in the dataset is low the significance of the results is lower.
Finally, the resulting overall accuracy for the prediction of the cause in phase-to-ground fault voltage sags is 0.9088.
Nowadays, state-of-the-art technologies and signal processing tools can solve most of the smart grid issues related to data gathering and information extraction. Nevertheless, the next step, which remains as an open issue, is the development of understanding tools that support decision-making systems.
Our work is intended to provide a multi-layer architecture, specially devoted to support causal explanations to smart grid events. The case study presented in this paper is based on one of the most common type of power-quality event as it is the occurrence of voltage sags, which entails a strong economical impact. Our work proposes an implementation of the OMG Data Distribution Service for enabling smart grid information distribution, assuring Quality of Service. An efficient mechanism for event filtering simplifies the process of knowledge modeling carried out at the second layer of the proposed architecture. In order to assure data consistency, a standardized information model has been adopted. Finally, a novel approach for causal explanation, based on abductive planning and the use of a common-sense knowledge-base known as Scone, has been proposed.
The system has been assessed, for validation purposes, using a synthetic dataset. Due to lack of existing data labeled with causes of voltage sags, it has been manually labeled on the basis of human expertise. The analysis of the results has been focused on the case of phase-to-ground faults. A comparison with the casual explanation given by the proposed system has been carried out obtaining high true positive and negative rates. The system however needs to be confronted with a real dataset for a complete validation and in order to be able to compare it with other existing solutions. The generated dataset includes environmental and location data to enrich the information provided with the voltage sag event. It is apparent that mechanism for predicting the external causes will highly depend on these information.
Future work should address the collection and validation of the system with real data of voltage sags properly labeled. It would be of great interest to obtain these data from locations with a broad variety of characteristics regarding climate and weather conditions, power network conditions, natural environment and human activity.
Footnotes
IceDDS source code repository available in
For readability, we reduce the description of interfaces and structures to the key ones and we remove exceptions and control/configuration procedures of the entities.
Further implementation details can be obtained from the source code repository at
Tests are available in
Acknowledgments
This work has been partly funded by the Spanish Ministry of Economy and Competitiveness under project PLATINO (TEC2017-86722-C04-04-R), the Univesity of Castilla-La Mancha R&D Plan under the access contracts to the Spanish system of science, technology and innovation call, which is partially funded by the European Social Fund (31/07/2014 Resolution, published in the DOCM on the 25 of August 2014) and by the Spanish Ministry of Economy and Competitiveness under project CitiSim Itea3 (TSI- 102107-2016-4).