
Abstract
The design of automated video surveillance systems often involves the detection of agents which exhibit anomalous or dangerous behavior in the scene under analysis. Models aimed to enhance the video pattern recognition abilities of the system are commonly integrated in order to increase its performance. Deep learning neural networks are found among the most popular models employed for this purpose. Nevertheless, the large computational demands of deep networks mean that exhaustive scans of the full video frame make the system perform rather poorly in terms of execution speed when implemented on low cost devices, due to the excessive computational load generated by the examination of multiple image windows. This work presents a video surveillance system aimed to detect moving objects with abnormal behavior for a panoramic 360
Introduction
Increasing public awareness about security issues is caused by the abundance of social conflicts appearing in the media. Research on video ssurveillance systems has attracted more interest as a consequence of this. Therefore, more reliable and accurate systems are sought. The source of the data for these video surveillance systems is often obtained from static and pan-tilt-zoom (PTZ) cameras. For example, In [1], a novel salient motion detection method for non-stationary footage supplied by PTZ cameras is developed. [2] presents a new background subtraction algorithm designed for PTZ cameras capable of performing this task without the need for explicit image registration, and [3] illustrates a novel method for detecting abnormal behavior in crowded video scenes. The successful operation of such systems depends on their capability to attain real time execution, such as in [4], where a faster patch-based version of Speed-Up Robust Features detector (SURF), named BLS, is introduced as a saliency detection method, or the work illustrated in [5], where a tracking-by-detection system that works under important computational power constraints is presented.
The employ of PTZ cameras is commonplace in computer vision systems. A good example is the work presented in [6], where a low-power, omnidirectional tracking system (LOTS) is described. Another good instance is the dynamic calibration of PTZ cameras for traffic monitoring that can be found in [7]. Other designs feature systems intended to be deployed in PTZ camera networks. In [8], several cooperative localization and tracking methods to be deployed in PTZ camera networks are presented. [9] presents an integrated analysis and control framework for a PTZ camera network using dynamic camera-to-target assignment and efficient feature acquisition to achieve a better scene understanding. There are also some proposals such as the one presented in [10] where optimization strategies, along with a distributed implementation, are proposed in order to decide to focus the attention of a PTZ camera network components on individuals or groups of them, aiming to properly understand scenes displaying people interaction. Some other research involving PTZ cameras focus on the background-foreground segmentation applied to images supplied by PTZ cameras [11]. One example can be found in [12], where a neural-based background subtraction approach to moving object detection using self-organized models, is presented. The work described in [13] goes along the same lines, as it describes a method for compensating the panning and tilting movements of a PTZ camera in order to perform the background segmentation of the scene.
There is no established and comprehensive theoretical framework that establishes the foundations to develop practical video surveillance systems. Moreover, conventional and PTZ surveillance cameras have significant limitations in their coverage due to their restricted field of view. Taking this into account, we have focused our attention on panoramic (360
Deep neural networks have been successfully applied to many different research areas [18]. One of the most important is medicine. For example, [19] proposes an ensemble deep-learning architecture for nonlinearly mapping scalp to intracranial electroencephalography (iEEG) data, intended to circumvent the unavailability of iEEG and the limitations of scalp electroencephalography (sEEG). In [20, 21], stacked autoencoders are used to compute functional brain connections in order to detect proficiency. Some deep convolutional network-based proposals are oriented to detect and diagnose several types of medical conditions: In [22], deep convolutional networks are used to detect and diagnose seizure in neonatal children, and [23] presents a method, using convolutional neural networks, for electroencephalography (EEG) signal analysis aimed to detect normal, preictal, and seizure classes. Finally, there are some other deep convolutional network-based applications to medicine such as the one described in [24], which presents a deep learning-based approach where deep convolutional networks are utilized to identify Parkinson disease in 3D nuclear imaging data.
Engineering is another relevant research field that can improve from deep neural network applications. More precisely, in civil engineering, we have works such as [25], where a novel method for concrete properties estimation, based on mixture proportions, is developed by using a deep restricted Boltzmann machine. In [26], a novel model for detecting damage in high-rise building structures, based in a restricted Boltzmann machine and a neural dynamics classification algorithm (NDC), is presented. In the same line, [27] describes a new methodology for assessing the local and global condition of structures, featuring synchrosqueezed wavelet transform, Fast Fourier Transform, and deep Boltzmann machines to extract features from the signals provided by the sensors. Finally, the work presented in [28] illustrates a construction cost estimation model using advanced deep learning concepts such as the combination of a deep Boltzmann machine approach along with a softmax layer and some regression models.
Of course, there are many other areas that benefit from deep neural network-based machine learning techniques. In the field of big data science, we can find works such as [29], where it can be found a deep learning based method focused on dealing with big data time series. In the field of applied economics, the research presented in [30] shows a model for estimating the price of new housing at the design phase by integrating a deep belief restricted Boltzmann machine and genetic algorithms. Deep neural networks are also a potent tool when it comes to computer vision. Thus, in [31] we can find a deep learning-based method for haze removal from a single input image, and in [32] a new algorithm, based in the well-known VGG-16 convolutional neural network, is designed aiming to detect splicing in digital images.
Object recognition and image classification stand as typical applications of deep neural networks. These sorts of activities involve complex computational tasks where many obstacles must be faced. Thus, in [33] we can find a review on different techniques and uses of convolutional neural networks to solve inverse problems in imaging such as denoising, deconvolution, superresolution, and medical image reconstruction. Also, [34] illustrates the problem supposed by the data classification in the presence of noise and possible strategies to tackle such a problem by utilizing convolutional neural networks. These techniques are especially useful in the field of automated video surveillance systems covering a wide variety of applications. Two important ones are the verification of civil engineering structure condition and human behavior monitoring. In the first category, we can find works like the one presented by [35], where a recurrent deep neural network is proposed for fully automated crack detection on 3D asphalt pavement surfaces. The research developed in [36] offers an image-based approach for reinforced concrete bridge inspection using convolutional neural networks. Also, inside the civil engineering structure condition monitoring area, we can find the work presented in [37], where the authors propose a pixel-level detection method for identifying road cracks using a deep convolutional encoder-decoder network. In the same field of study is the work presented in [38], where the authors offer a distress classification method for road structures featuring a new network architecture named “convolutional sparse coding deep random network” or CSDRN.
When it comes to deep neural networks-based human behavior monitoring systems, some relevant studies have been developed. The work performed by the authors of [39], proposes a hierarchical statistical method for recognizing the activities of workers in far-field surveillance videos. [40] presents a convolutional neural network based on multi-scale features for thermal infrared face identification. The research presented in [41] proposes a new network model utilizing stacked multicolumn convolutional neural networks (CNNs) for pedestrian counting. In [42], authors show how to improve the process of detection and classification of vehicles in traffic sequences by using ensembles of convolutional neural networks to overcome the limitations caused by the low resolution of the images supplied by surveillance cameras.
Deep learning based surveillance systems have heavy computational demands which are addressed with GPU acceleration. This incurs in large power consumption. Moreover, high performance computation is associated with expensive hardware. A possible solution to these inconveniences is the use of microcontroller boards, which can be deployed in motion detection systems, given their reduced energy requirements and affordable cost. In other words, microcontrollers constitute economic, small, and flexible hardware. However, these surveillance systems must be optimized to be deployed in such microcontrollers, which do not usually feature a high computing power. In this respect, essential works could be highlighted. In [43] the authors propose a low computation moving object detection method combined with a video encoder, and in [44], we can find the design and implementation of a computationally efficient system for detecting moving objects, ready to be deployed on small, lightweight, low-cost and power-efficient hardware. Some of the proposals in this area include the use of a specific hardware platform such as in [45], where a tracking pipeline designed for fixed smart cameras is presented. This system is able to handle occlusions between objects and can be successfully deployed in a Raspberry Pi board equipped with a RaspiCam camera. Other proposals include the implementation of deep back-propagation learning algorithms to be deployed in FPGAs, which are fast and extreme efficient hardware devices, but also more constrained from a programmer’s point of view. Such work is illustrated in [46].
Motion and proximity can be estimated by microcontrollers in several ways. Proper examples of this can be found in [47], were a novel class of flexible linear vision sensor dedicated to motion extraction and proximity estimation named “Vision Tape” is described; and in [48], where the authors present a compact and economic system for measuring cloud shadow motion vectors, constructed using an array of luminance sensors and a high-speed data acquisition system. Energy savings for street lights can be attained, which is relevant for smart cities [49]. Recently, Self-Organizing Maps (SOMs) were applied to build a motion detection procedure that was implemented on an Arduino DUE board [50]. A static, conventional camera was employed for motion detection in that SOM based video surveillance system.
In this paper, a new video surveillance system for the detection of moving anomalous objects is proposed. Its main difference with respect to the other state of the art systems relies on its probabilistic candidate window generation algorithm for potentially anomalous object detection that uses three new different mixture-based probability distributions. Besides, even though it incorporates a deep learning neural networks-based classifying system, it is still capable of being implemented with microcontrollers and 360
The remainder of the paper is organized as follows: the proposed detection methodology is defined in the next section, the architecture of the proposed system is presented in Section 3, the experimental results are provided in Section 4 complemented by a comparison with other important avant-garde detection method, and Section 5 concludes with some remarks and conclusions.
Methodology
For the kind of scenarios that have been described in the previous section, an object is understood to be anomalous if it is not associated to the commonly found object classes in the scene. Under these circumstances, an alarm should be triggered in the video surveillance system.
Next, an anomaly detection method is presented which aims to solve the above defined problem. The foundation of this model is a set comprised by the detections which are active. This set is associated to those objects which have been recently spotted by the surveillance device. A detection is defined as a four dimensional vector
A forgetting rate
In order to simplify the presentation of our method, let us note
where
Next a probabilistic model is proposed to capture the potential locations of the detected objects:
where
As it was pointed out in Section 1, in this work, three multivariate homoscedastic distributions are considered in order to implement the probabilistic window-based potential detection generator, namely Gaussian, Student-t and triangular, as given in Table 1, where
Gaussian, Student-t, and triangular multivariate homoscedastic distributions
The rationale behind this model is that the object search should be directed towards those areas of the incoming frame where detections have been recorded previously. This is managed by the multivariate homoscedastic distribution. However, the other regions of the frame must also be queried to look for objects, at a lower rate, which is managed by the uniform distribution.
In the light of the above, an algorithm can be defined so as to detect anomalous objects with the help of a panoramic camera. The algorithm is detailed as follows:
Initialize the set of current detected objects Load the next frame from the panoramic camera. Refresh the active detected objects applying the forgetting rate Randomly draw a set of Go to step 2.
In the next section, a proposal for a working implementation of the described methodology on a low cost, low energy consumption microcontroller system is detailed.
Detection and classification of foreground objects in digital images usually require the processing of large amounts of information in short periods. Under normal circumstances, these jobs would require the use of a high performance hardware architecture integrated by fast computers featuring powerful GPU devices so all the required calculations are performed in time so the system can carry out the jobs fast enough and as accurately as possible.
However, there are some occasions where the environmental conditions make it very difficult or just unfeasible to install an automatic video surveillance system that requires an expensive high performance hardware system such as the one described in the paragraph above. This led the authors of this work to explore the possibility of designing and implementing a system capable of performing detection and classification of foreground objects in digital images but at a small fraction of the price and electric power consumption traditional CNN-based systems do. This system would present an architecture integrating a potential detection generator based in a multivariate homoscedastic distribution and a CNN-based classification module conveniently optimized to locally1 achieve acceptable results when deployed in cheap and low power demanding microcontroller-based hardware devices.
Attending to the reduced computing power of the hardware it is going to be deployed in, this system should present a balance between speed and accuracy. In this respect, the choice of the CNN selected for implementing the classification module is critical, as this is the bottleneck of the system in terms of time consumption. After an extensive research process, the authors have considered the convolutional neural network designed by the Microsoft Embedded Learning Library (ELL) team whose architecture can be seen in Table 2. This CNN architecture is based in the VGG-16 network architecture [51] and was selected because it presented the best balance between speed and accuracy after performing a speed and accuracy test in a Raspberry Pi 3 Model B board to the fastest networks offered by the Microsoft ELL team.
The detection and classification system presented in this article consists of two main parts: the hardware platform and the software program that manages all the processes. Thus, both the hardware and the software architectures of the system are presented in the next two subsections.
Software architecture
The software architecture of the system is illustrated in Fig. 1. As can be seen, it consists of a program developed in C++ language composed of three different modules. The first one is a module that supplies a continuous stream of images shot by a Point Grey Ladybug 3 Spherical camera. It is important to remark that, in a regular basis, because of the reduced capabilities of the hardware device used for the project, the system is not capable of processing all the frames coming from the 360
Overview of the software architecture.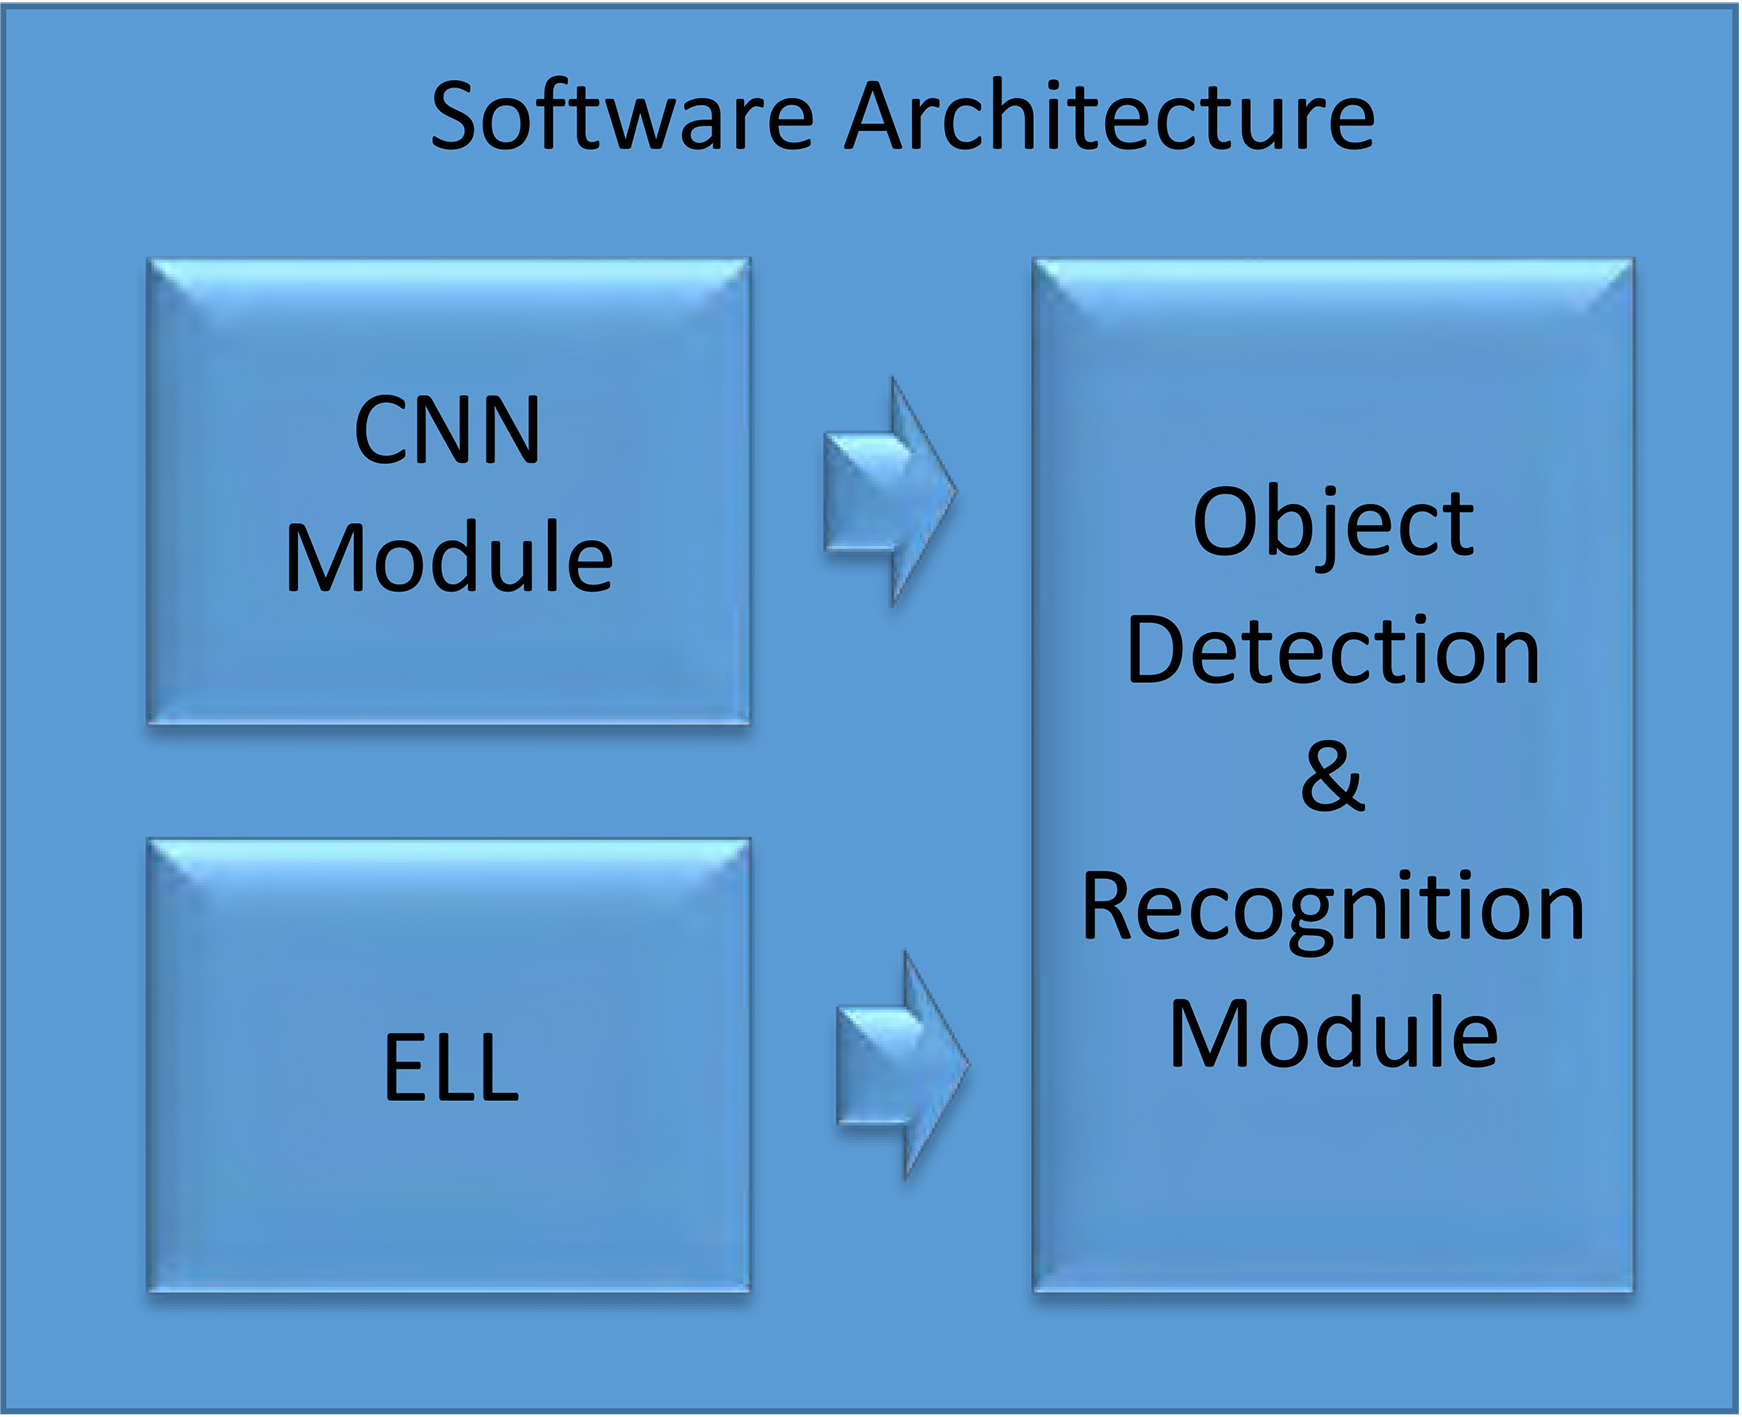
The second module is dedicated to identifying the potential anomalous objects that may appear in the scene watched by the 360
Working with CNNs can be problematic and inefficient unless they are implemented using a Deep Learning framework. At the same time, it is convenient to have in mind that we are operating with low computing power hardware, so an optimized library for deploying CNNs in microcontrollers is also very recommendable in order to get the maximum performance from the hardware. These reasons led us to select the Microsoft Cognitive Toolkit (CNTK) deep learning framework combined with the Embedded Learning Library (ELL) also developed by Microsoft. Microsoft CNTK is a framework intended for designing, training, and testing Convolutional Neural Networks, whilst the Microsoft Embedded Learning Library is a special library mainly used to pre-compile the code optimizing it so it can extract the highest performance rates of multi-core microcontroller-based hardware architectures.
The last part of the software architecture is the object detection module. This module is also the main program of the surveillance system and is in charge of interacting actively with the 360
As it is illustrated in Fig. 2, this program is designed to receive a video frame from the 360
Overview of the system operation flow.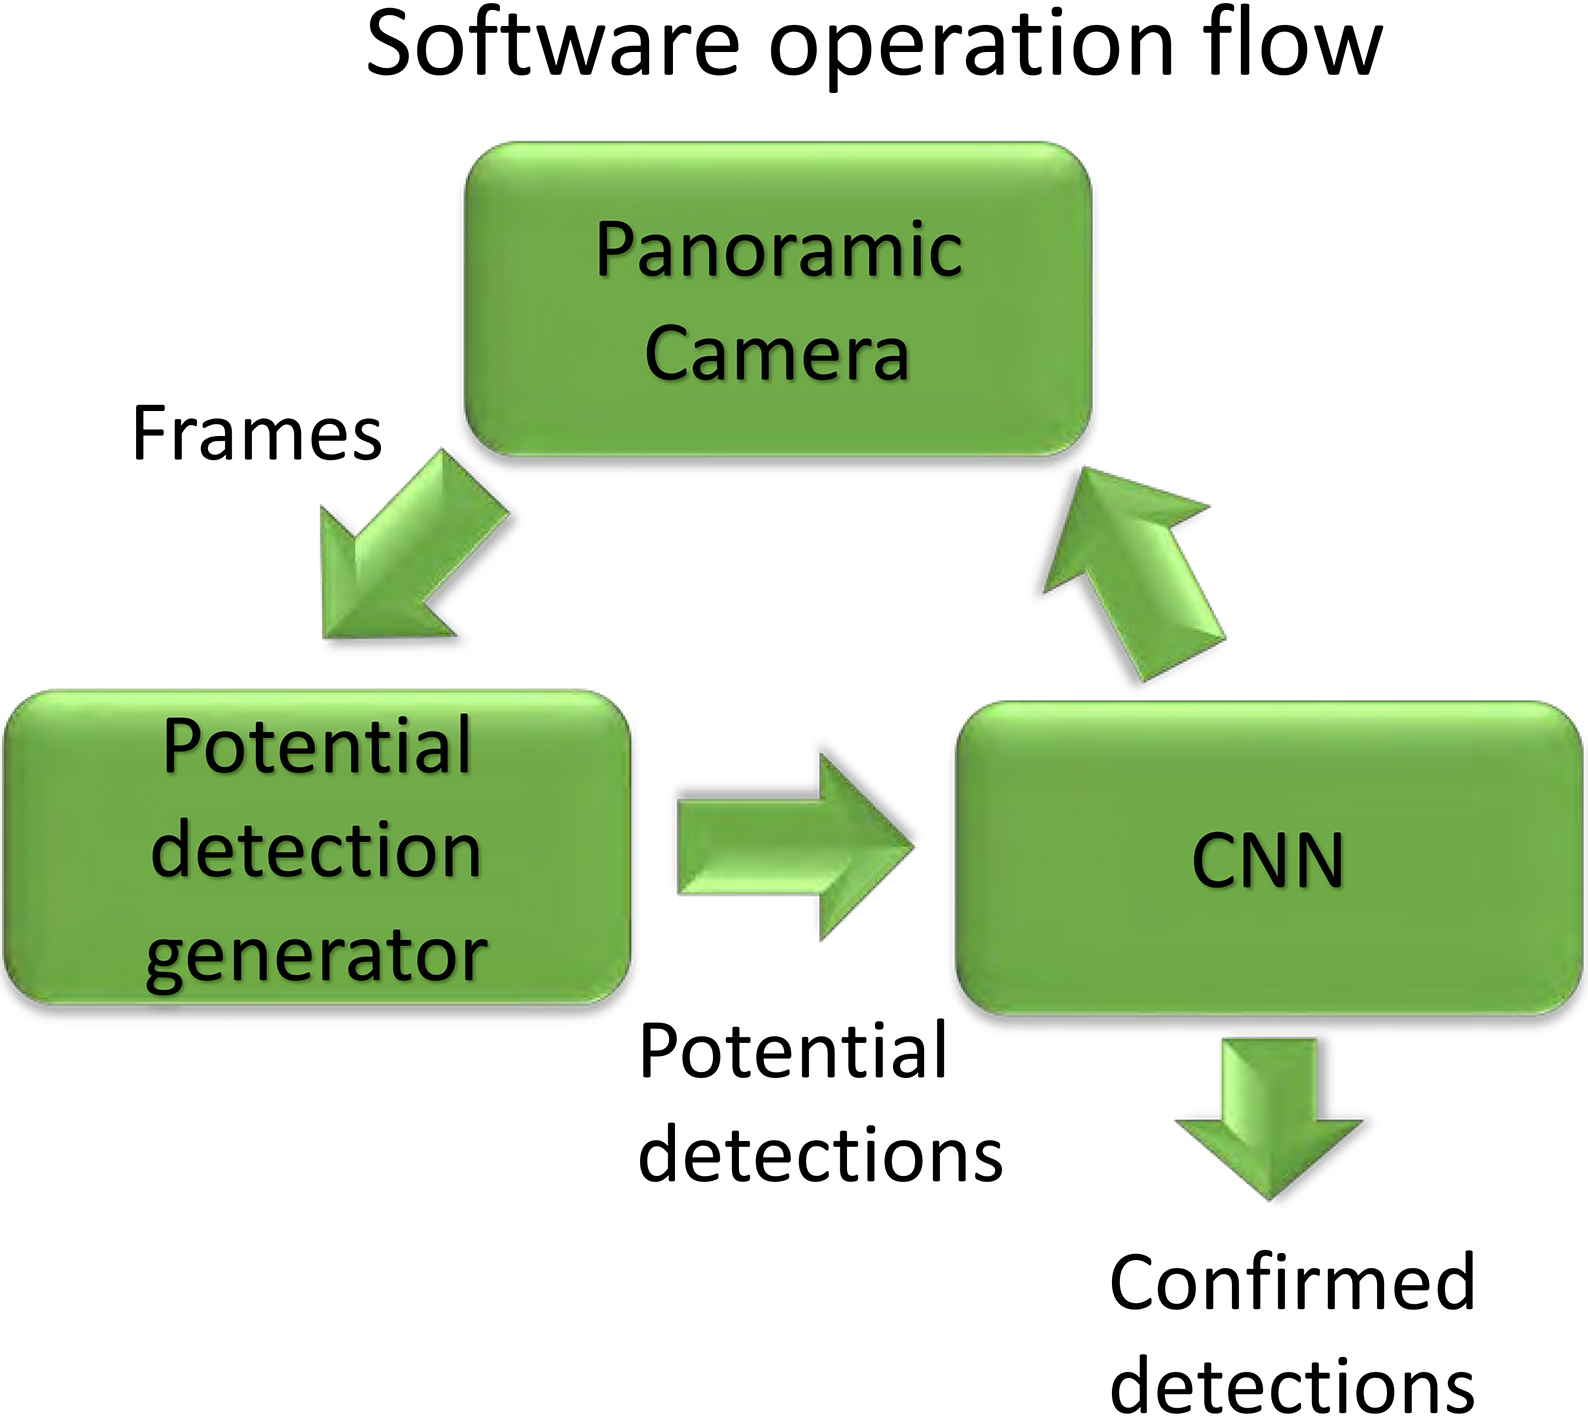
Architecture of the CNN
Hardware choice is a critical issue when it comes to Deep Learning applications powered by microcontrollers. This hardware should offer a good compromise between performance, energy consumption, and price. Moreover, in order to reduce the development time, it would be desirable that the chosen hardware counts on ample documentation that is easily accessible online.
Working diagram of the algorithm’s regular operation mode.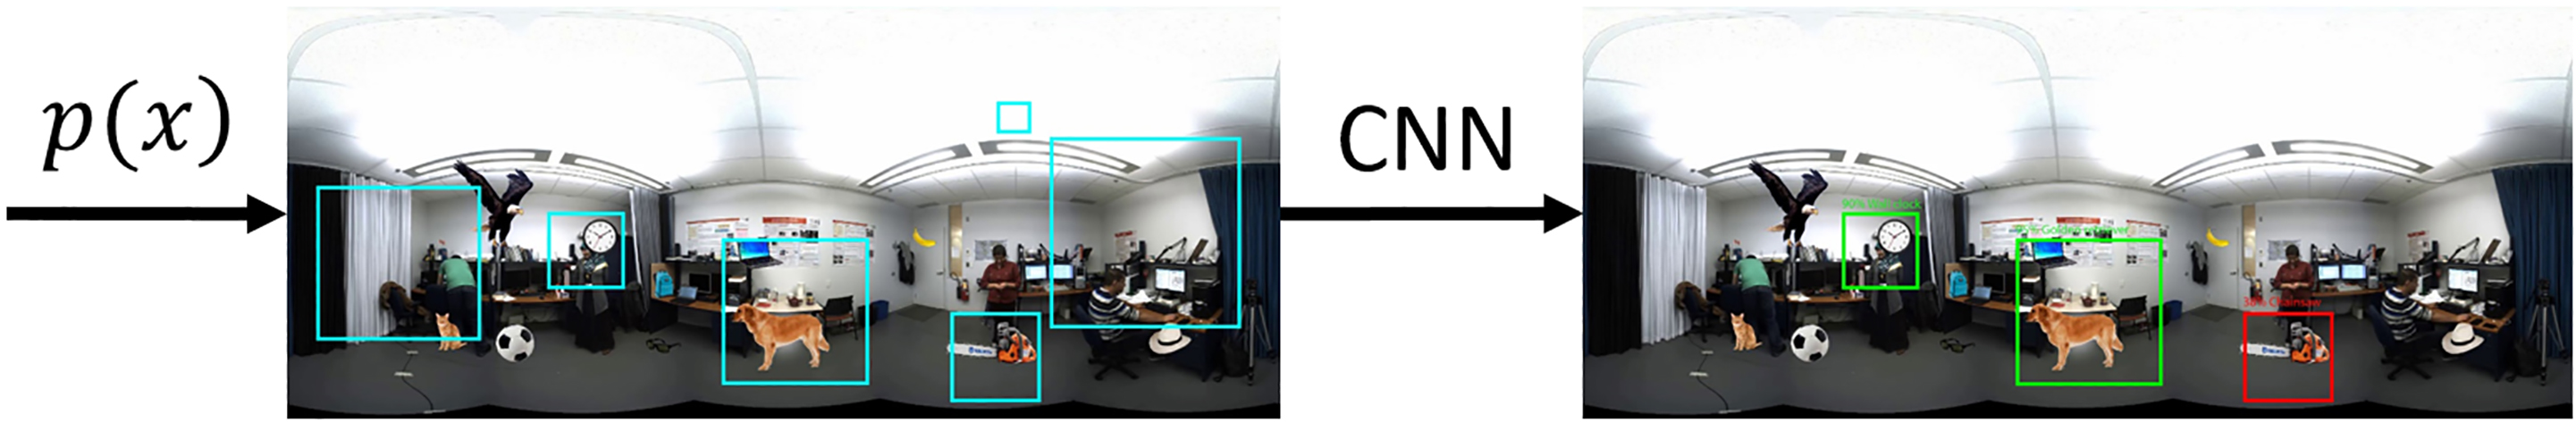
These reasons suggest the choice of a system-on-chip architecture-based system, such as Raspberry Pi-based boards, to be used in our project. More precisely, the platform used is a Raspberry Pi 3 Model B presenting a Broadcom BCM2837 microcontroller, featuring a CortexV8 Quad Core CPU running at 1200 Mhz from ARM, 1 GB of RAM memory and a microSD data storage card. It can be powered by a 5.1 V power source, and its max power consumption is up to 2.5 A approximately at max operating load using plenty of USB external devices. The reasons for using this hardware platform instead of other system-on-chip based ones are its trade-off between price and computing power and the large amount of information referring to Raspberry Pi online that brings efficiency to the developing process. Other systems feature a similar computing power just as Gumstix Pi or Orange Pi, but they feature more capabilities to the system that increase its price or their online support is not as profuse as the Raspberry Pi resulting in higher development times.
Briefly explained, the detection system detailed in this document is founded in an algorithm that is capable of detecting and identifying certain objects whose categories are considered anomalous for some reason in a particular environment by analyzing a video stream of it, supplied by a 360
Frames corresponding to each of the six videos used to perform the experiments.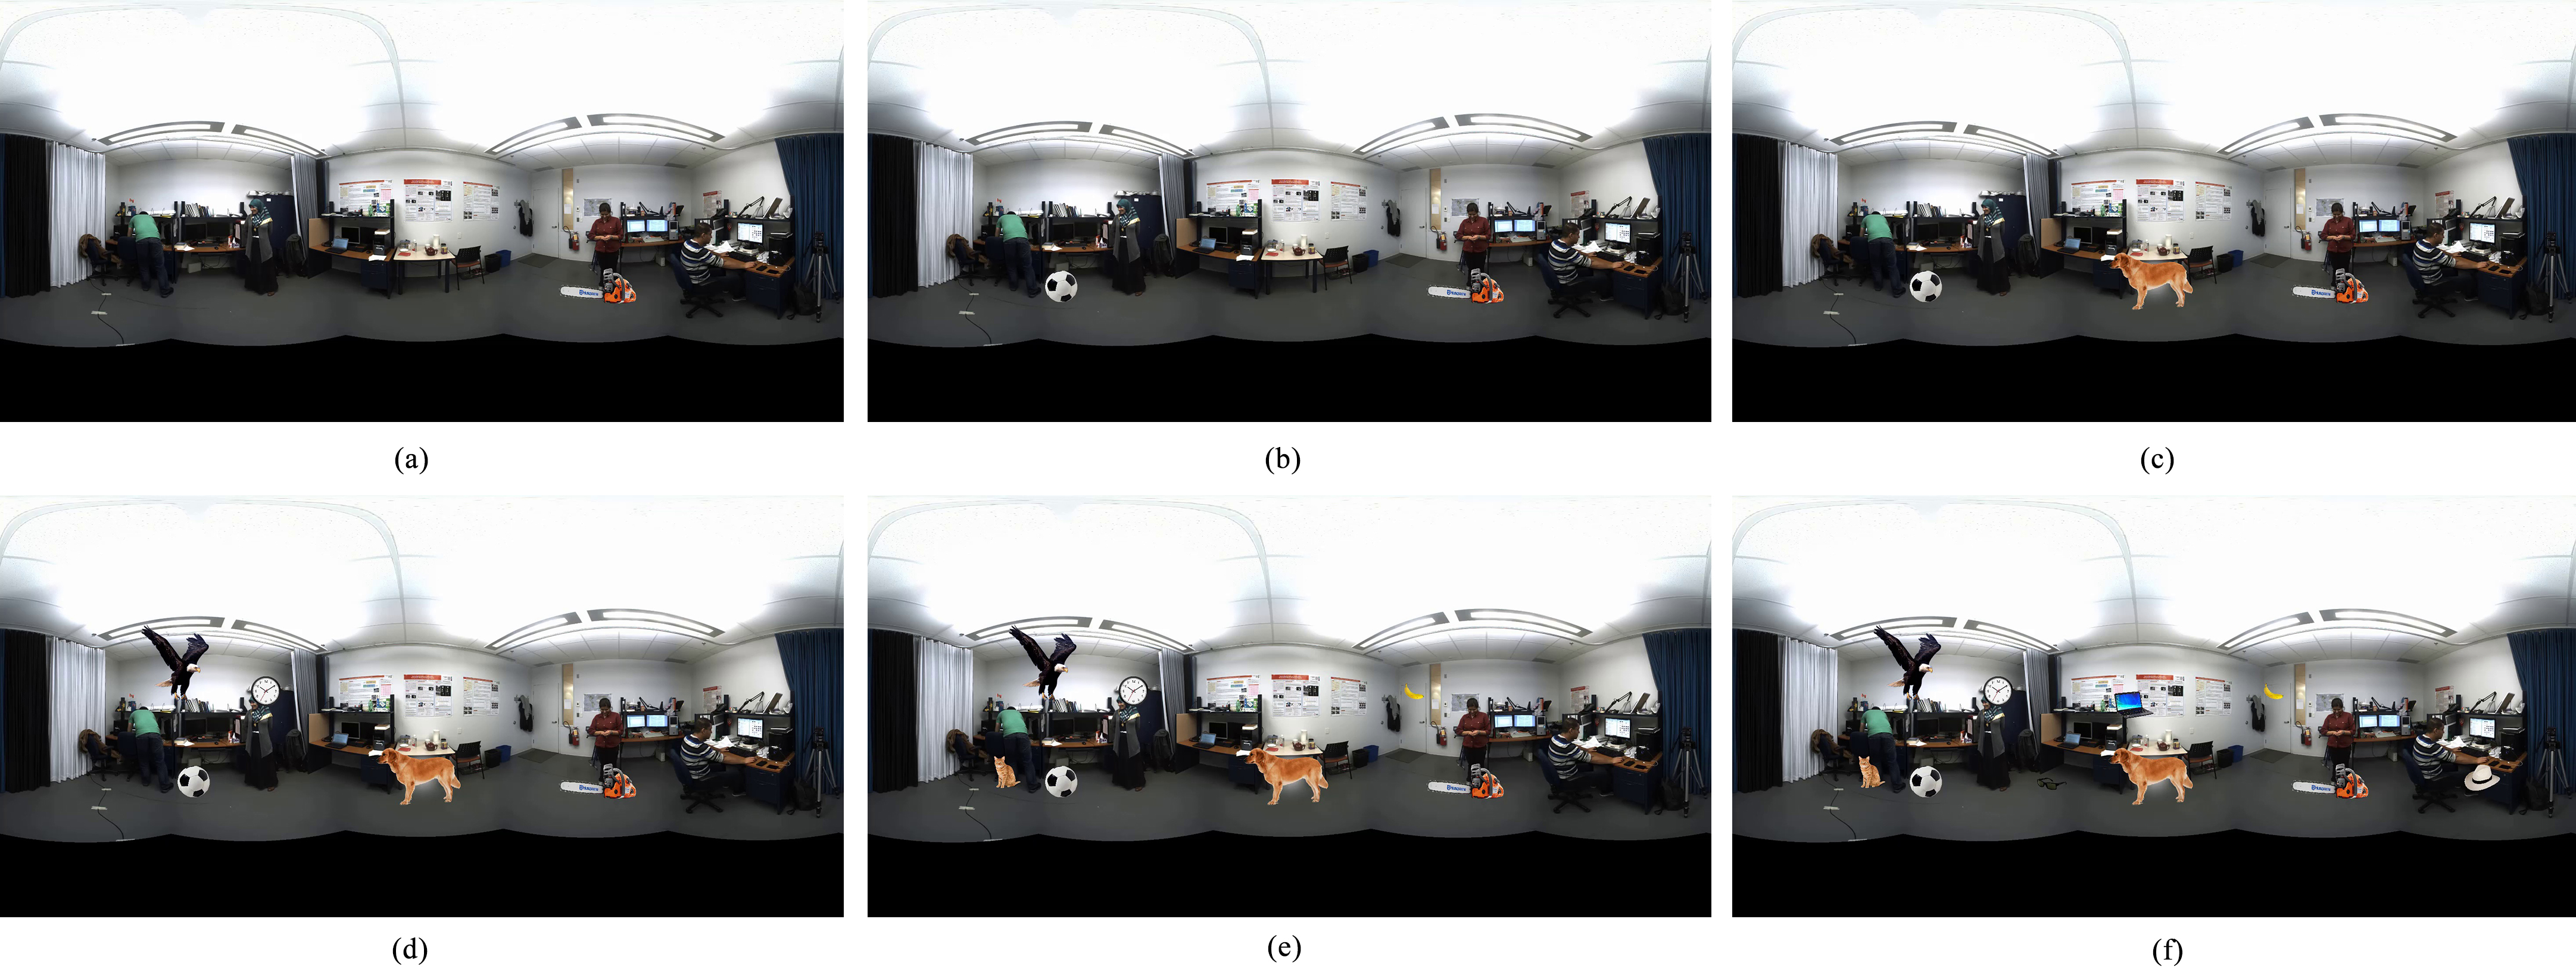
Because of its balance between accuracy and speed, for these experiments we have selected a CNN designed and trained using the convolutional neural networks implementation from Microsoft Cognitive Toolkit (Microsoft CNTK)2 combined with the Embedded Learning Library,3 also from Microsoft, whose mission is to optimize neural networks so they can fit properly in a microcontroller-based architecture such as the one presented by Raspberry Pi boards.
sIn order to set up the experiments, a test program that integrates all the system modules has been implemented. This program emulates the video stream incoming from the 360
According to it, first of all, a new frame is acquired from the 360
Then, the areas of the frame enclosed by each one of those possible detections are fed to the identification module where its pre-trained CNN will state whether the frame section delimited by certain window contains any of the objects appearing in the anomalous object category list. When the CNN finds some anomalous object in any of the potential detections, this detection will become a real detection of an anomalous object that will be added to the set of active detections, referenced in the model illustrated in Section 2 as
Finally, the user will be informed about the new anomalous object detection by drawing the window as a bounding box around the anomalous object that has been found in the original input image in different colors, using green for confidence value above 70%, yellow for a value between 40% and 70% and red for a value under 40% (Fig. 3).
In order to test the accuracy and performance of the system described, a series of experiments have been performed by using the four different probability distribution-based functions described in Section 2. Those will be used as the basis of the potential detection window generator. Aiming to make the experiments as rigorous as possible, it is very important to recreate the same conditions through all the tests. Thus, for all the experiments, it has been used a controlled scenario where a certain set of frames coming from a 360
Experiments consisted of counting the number of objects detected by the system by performing 10 recognition passes to 300 panoramic 1920
Video 1: Chainsaw Video 2: Chainsaw, soccer ball. Video 3: Chainsaw, soccer ball, golden retriever. Video 4: Chainsaw, soccer ball, golden retriever, bald eagle, clock. Video 5: Chainsaw, soccer ball, golden retriever, bald eagle, clock, banana, aegyptian cat. Video 6: Chainsaw, soccer ball, golden retriever, bald eagle, clock, banana, aegyptian cat, sunglasses, laptop, sombrero.
It is important to remark that the mentioned objects move randomly over the frame without any pose or scale changes. The reason for this is to obtain more complete statistics about the system performance with different amounts of objects having different behaviors but without restraining the response of the system and being careful that the number of experiments would not grow to unmanageable dimensions. Besides, all the tests were performed for a number of potential detection windows that goes from 1 to 10 and all these operations were performed for each potential detections generation methods considered in this document: A Gaussian-uniform mixture, a Student-t-uniform mixture, a triangular-uniform mixture and a pure uniform distribution that has been used as a control to demonstrate the performance of the mixture-based mathematical model.
When it comes to test execution, with the purpose of reducing the amount of the possible values that the variables can have, so the amount of cases to test is manageable, we have fixed some values from the mathematical model described in Section 2, leaning on an automatic empirical parameter adjusting process ad hoc. Therefore, the potential detections’ size will oscillate between 100
As for the dataset to train, validate and test the system performance levels, it has been used the Large Scale Visual Recognition Challenge 2012 (ILSVRC 2012) from ImageNet.5 It is important to remark that due to efficiency reasons, only the detection and classification stages are performed on-the-fly by the Raspberry Pi 3 Model B. The training of the network has been achieved offline using a NVIDIA TITAN X GPU.
Under the conditions exposed above, the mean number of objects detected by the system for scenes where 1, 2, 3, 5, 7 and 10 objects have been introduced, for each one of the three mixtures described in the mathematical model and the pure uniform distribution can be checked in the Fig. 5.
Mean number of actual anomalous object detections vs number of potential detections generated for each frame. 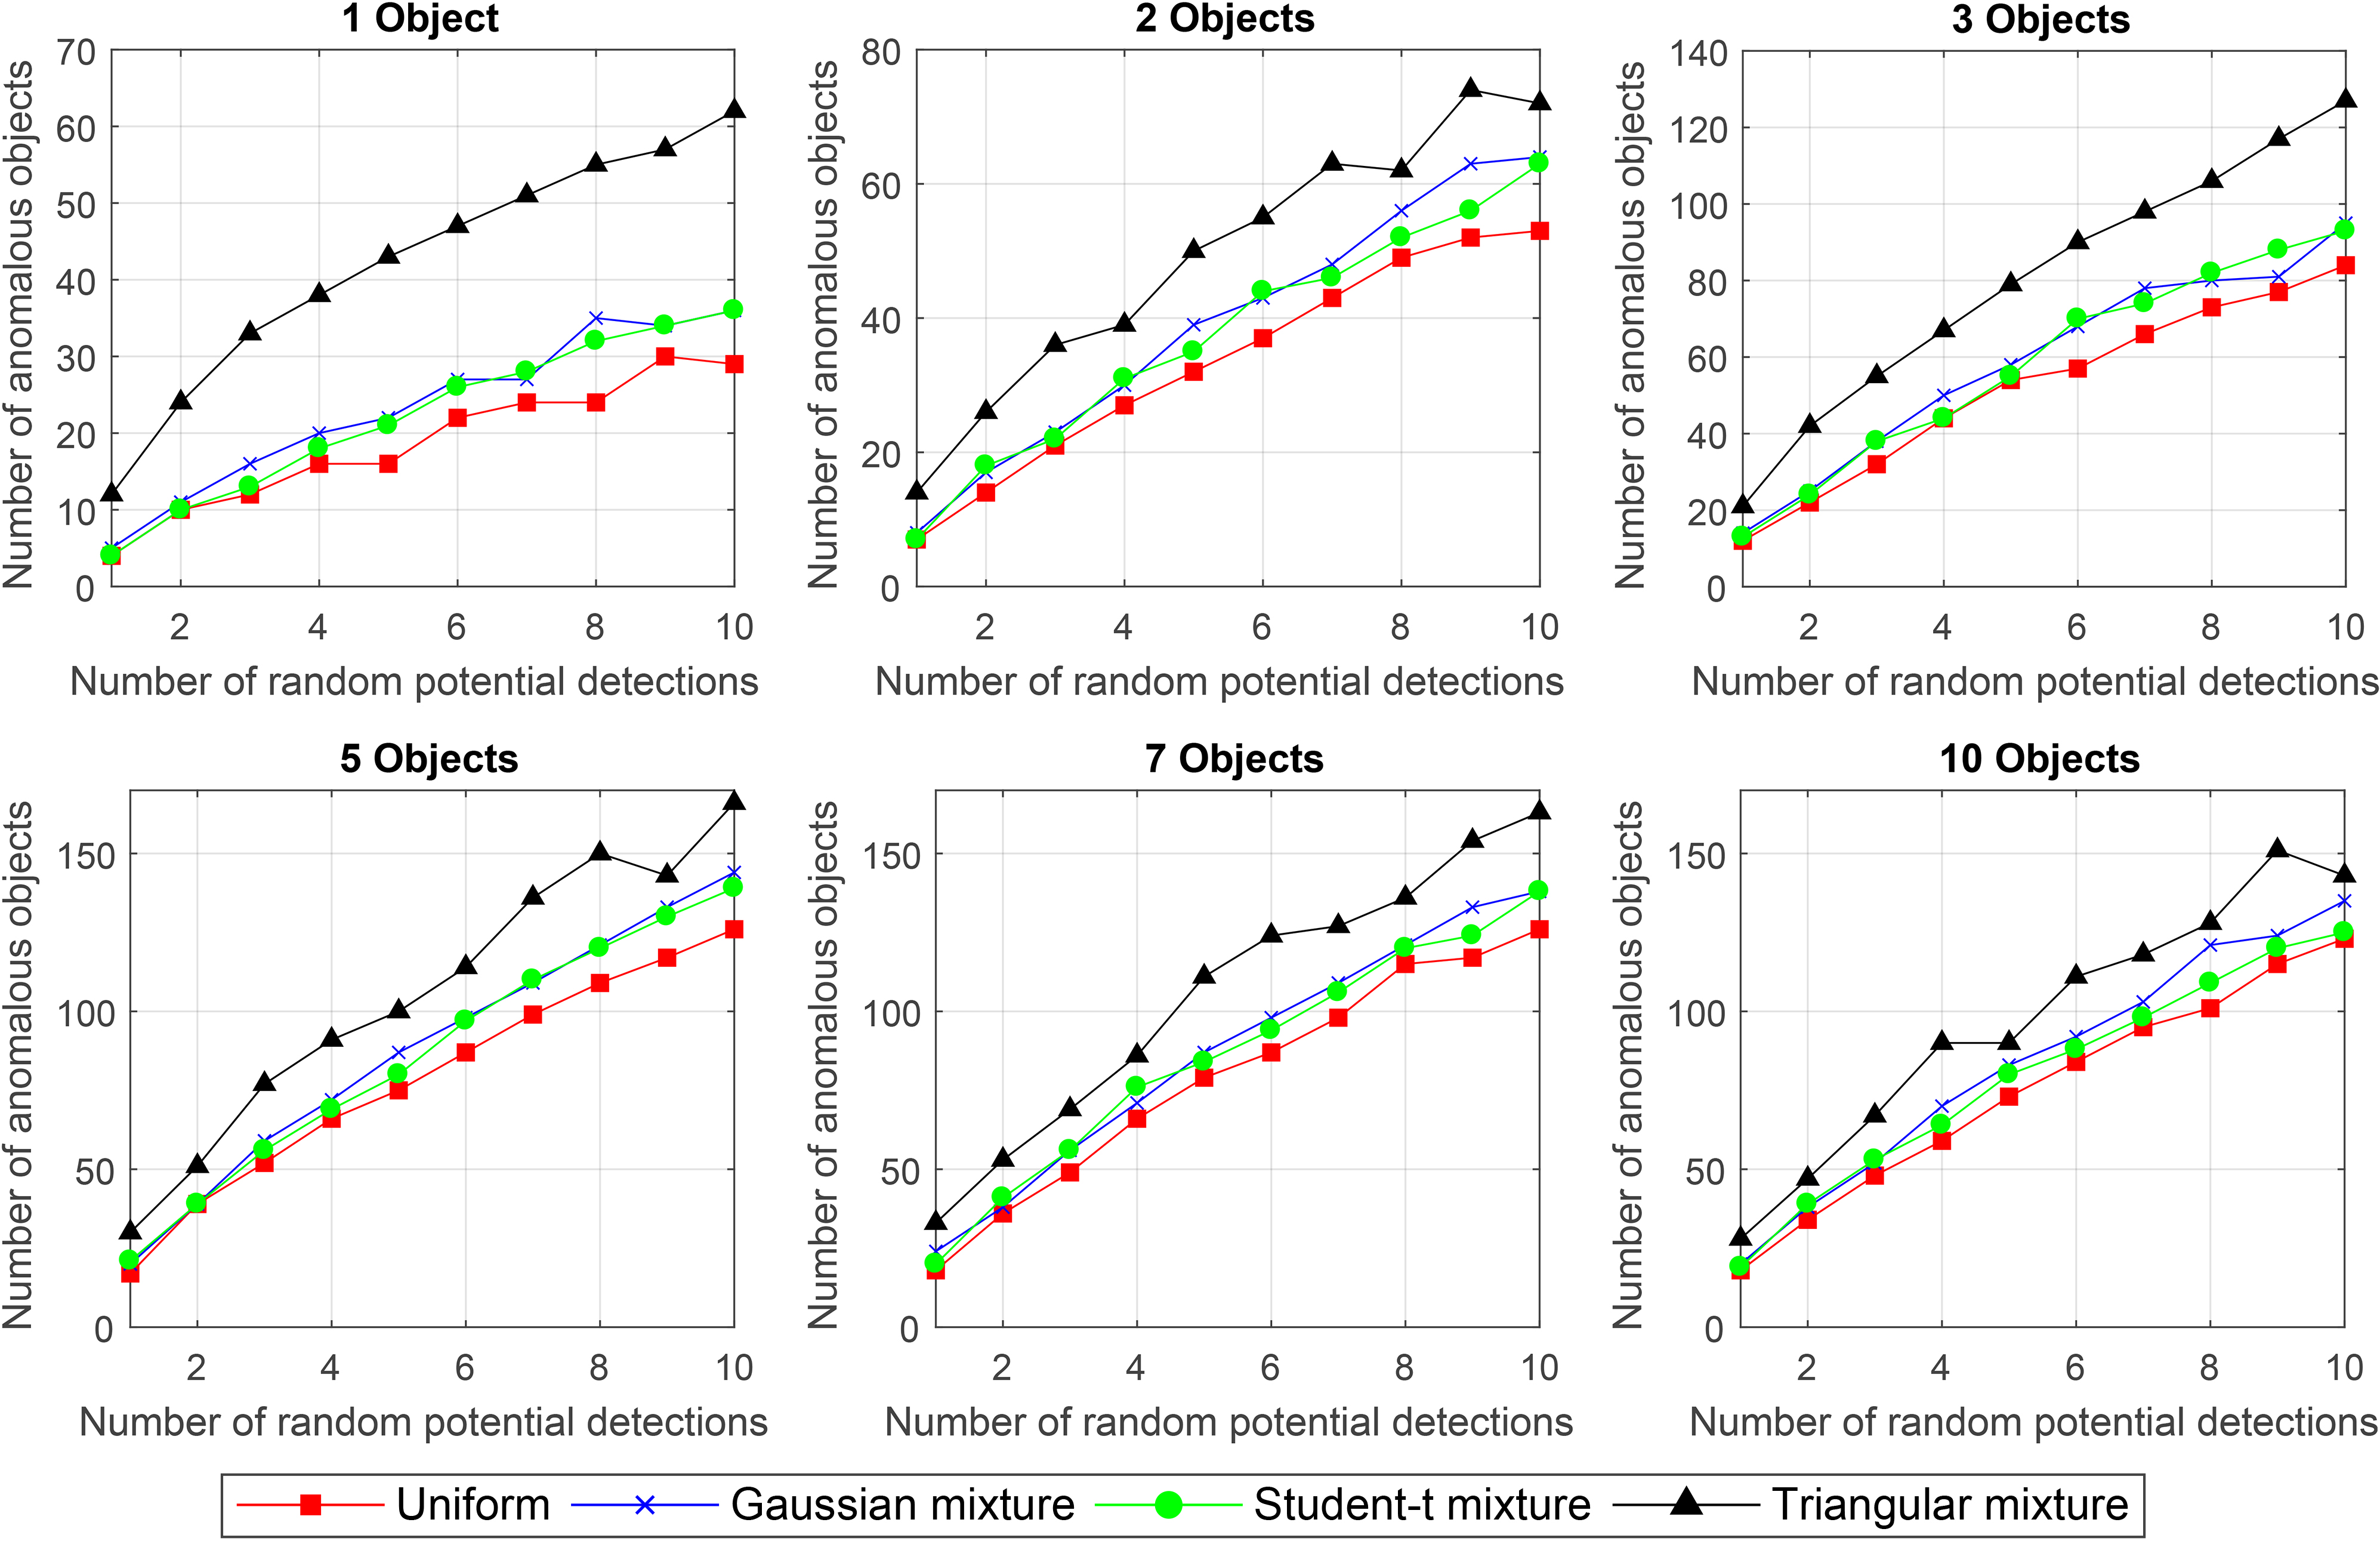
Globally, we can observe that for all amounts of objects in the experiments, the performance of the mixture based models is better than the pure uniform distribution. Besides, it is easy to observe that the triangular-uniform mixture model performs significantly better than any other of the models that have been tested in all the experiments. Below, a detailed analysis of each chart can be found.
For 1 object, the figure illustrates that even for a small number of potential detections generated by the system, the triangular-uniform mixture’s performance clearly outcomes all the others. It is followed by the Gaussian-uniform distribution based model that achieves slightly better results than the Student-t distribution based model. Both performances are very similar, though. The worst performance corresponds to the uniform distribution that we use as a control.
In the case of 2 objects we can observe that even though the triangular-uniform mixture model still outcomes every other model, the difference is not as important as in the 1-object chart. Near the 8 potential detections, we can observe an important oscillation of the triangular-uniform mixture performance. Based on empirical observations, it can be concluded that the reason behind this strong oscillation seems to be the particular distribution of some objects in the image that the network often finds it difficult to identify. However, a deeper statistic study may be required in order to find out the real causes of this phenomenon. Again, the Gaussian-uniform and Student-t-uniform mixture models offer a very similar behavior that gets reflected in a soft curve that for the maximum number of potential detections almost reaches the number of detections of the triangular-uniform mixture model.
In the case of the video featuring 3 anomalous objects, it can be noticed a very significant increase in the global number of detections. This can be explained because the third object introduced is from the “golden retriever” class which, attending to other experiments that have been performed and empirical observations, seems to be quite easy to be detected by the CNN. Thus, the increase in the number of detections. This chart illustrates once again that the triangular-uniform model outperforms the others. In this case, for a number of 9 potential detections, it can be noticed a slight drop in the number of detections for the Gaussian model that does not seem to be affecting the Student-t mixture based model performance.
The chart corresponding to the video with 5 anomalous objects indicates the higher amount of detections achieved in the whole experimentation process. This chart illustrates one more time how the triangular-uniform distribution performs better than the others, having a strong oscillation between the 8 and 9 windows. Here, the Gaussian and Student-t models describe a soft and stable ascending curve that is the expected behavior as the number of potential detections grows high. Just as in every chart we have already analyzed, the worst performance is achieved by the pure uniform distribution based model.
The chart presenting the detection and identification performance values for the video where 7 anomalous objects have been introduced, illustrates a very similar trend to the one presented by the chart generated for the 5 objects video. However, the number of detections is not higher than in the 5-object video, which might be something unexpected. One more time, it also can be checked that the best performance is executed by the triangular-uniform mixture model, corresponding the worst performance to the pure uniform distribution model.
System performance expressed in mean fps. vs number of potential detection generations for the three mixture models and uniform model
The last chart represents the number of object detections in the video where 10 objects have been introduced. Besides the fact that the triangular-uniform model again outcomes all the others, a non-expected phenomenon can be observed: The number of detections when generating 10 potential detections is lower than in the 7-object video. The reason for this is the overpopulation of objects in the scene. The potential detection generation engine is equipped with a routine that avoids the generation of potential detections in places where the percentage of occlusion with the real detections is too high. So, given the abundance of objects in this scene that are considered as real detections by the system, the possible places for generating potential detections by the potential detection generator are very reduced. The consequence is that from one point on, it will not be capable of generating new potential detections so it cannot detect more objects. Except for one important oscillation in the triangular-uniform model, the behavior of the rest of them is very similar to the charts we have already analyzed, with the pure uniform distribution again in the last place.
Time performance is a critical issue when facing the design of a deep learning-based in-motion object detection and categorization software, more especially when this software is going to be deployed in a low computing capability hardware such as the one described in Section 3. Hence, several time performance tests have been executed after deploying the described system in the Raspberry Pi 3 Model B board.
In the case of the Raspberry Pi, performing the same amount of tests as it was done to test the accuracy of the system would be impractical, as the execution of those tests would last too much. So, in order to test the time performance of the system in a Raspberry Pi 3 Model B, it has been designed a lighter version of the experiments explained above that, without loss of generality, will yield the time performance values for this hardware platform. All the parameters of the probability distribution models described in Section 2 will remain the same, and so will do the number of potential detections. Therefore, the experiments consisted of counting the number of objects detected by the system by performing 5 recognition passes to 10 360
Tiny-YoloV3 performance measured in the Raspberry Pi expressed in mean fps. vs number of anomalous objects introduced in the video
Tiny-YoloV3 performance measured in the Raspberry Pi expressed in mean fps. vs number of anomalous objects introduced in the video
In general, time statistics obtained reveal that all four detection models considered in this research have similar frame processing speeds which go approximately from 2 frames per second, in the case of generating just 1 potential detection per frame, to 0.2 frames per second, in the case of generating 10 potential detections per frame. Looking deeply into these results, slight differences can be observed in the frame processing time, depending on the model we choose for the potential detections generation. Thus, the information displayed in Table 3 indicates that the fastest model is the one based in the Student-t-uniform mixture whilst the slowest ones are the Gaussian-uniform mixture and the pure uniform models. On the other hand, the triangular-uniform mixture model presents an interesting balance between time performance and accuracy.
Results obtained from this experimentation process have three important consequences: The first one is that from all the window generation models presented in this research the triangular-uniform mixture arises as to the best in terms of time performance and detection accuracy because, even though its frame processing speed is not very different from the other models’, its performance in object detection is better under the parameters we have used for this study.
The second consequence is that all the new potential detection generation models described in Section 2 seem to perform better than a pure uniform distribution-based model.
The third consequence is that even though the video surveillance system described in this document is not capable of real-time object detection, it is actually capable of detecting foreground objects which are in motion in a non-controlled environment in half a second approximately when deployed in a Raspberry Pi 3 Model B. For these reasons we think our proposal is justified in terms of autonomy and price/performance relation, as it can be deployed in hardware that costs approximately 25$.
In order to highlight the performance of the system described in this article, it is important to compare it against some other detection and classification systems belonging to state of the art. In order to be considered as a valid competitor for the proposal presented in this article, the system must have the capabilities of detecting and classifying objects belonging to the ILSVRC2012 dataset in a frame supplied by a panoramic camera just as the system presented in this work does. Of course, it has to be capable of being deployed in a Raspberry Pi 3 Model B without any other computing hardware assistance. These reasons led the authors of this work to consider the Yolov3 detection and classifying system by Joseph Redmon and Ali Farhadi [52] as a fair competitor as it is one of the best in the state of the art when it comes to accuracy in detection and frame processing speed. From all the YoloV3-based networks designed by the Darknet team and other authors, the most powerful version of YoloV3 that it has been possible to be deployed in a Raspberry Pi 3 Model B is the Tiny-YoloV3 [53] which is a reduced version of YoloV3.
Aiming to perform a comparison as fair as possible with the system presented in this work, the Tiny-YoloV3 network also has been trained by following the instructions of the authors in [52] with the ILSVRC2012 dataset.
Even though the YoloV3 algorithm operating is notably different from the system described in this article, the experiments with the Tiny-YoloV3 have been designed to allow the reader to have a clear idea of the performance of both systems. Thus, the experiments consisted in testing our dataset against the Tiny-YoloV3 by performing 10 detection passes through each one of the 300-frame videos conforming the dataset, namely videos containing 1, 2, 3, 5, 7 and 10 in-motion objects that we have considered as anomalous in the environments represented in the cited videos.
Figure 6 illustrates individually the results obtained from the tests. In this figure it can be observed that the Tiny-YoloV3 performs a mean number of detections between 0 and 31 objects. In this figure also can be observed that the Tiny-YoloV3 seems to perform more detections in the videos with less amount of anomalous objects. This could look unexpected at first but considering that the objects are moving around the scene, the reason behind this behavior might be that there are some areas in the frame that are more convenient for the Tiny-YoloV3 for performing detections and the objects get detected as they enter those areas of the frame. It must also be remarked that the network has been trained with 160000 iterations because it was observed that beyond that point, it was not improving its average loss. At the same time, in order to allow the Tiny-YoloV3 to count as many anomalous object detections as possible, we have set the detection threshold to a confidence rate of 1% so whenever the network discovers any trace of the existence of an anomalous object in the scene, it will be counted immediately.
Mean number of actual anomalous object detections by the Tiny-YoloV3 model vs number of anomalous objects existing in the video file. 
Figure 7 illustrates the comparison for the number of anomalous objects detected by the Tiny-YoloV3 against the four detection probabilistic window generation models presented in this paper for 1, 2, 3, 6, 8 and 10 windows. It reveals how the system presented in this paper in any of its three versions outperforms, in any case, the Tiny-YoloV3-based system from 6 potential detection windows on. It also can be observed how the triangular distribution-based version of the system outperforms the Tiny-YoloV3 from 3 windows on.
Mean number of anomalous object detections vs number of objects inserted in the video for all the mathematical models in this work and the Tiny-YoloV3 detection system.
As this is a system that must be deployed in a System-On-Chip based system such as the Raspberry Pi, time performance is a critical issue in order for the system to be useful enough. Table 4 represents the mean test speed of the Tiny-YoloV3 in frames per second after performing 10 tests to a 300 frames video.
Results point out how the speed of this system does not depend on the number of anomalous objects in the frame, maintaining the test speed around 0.06 fps. The most important result that can be found in this table is the fact that the processing speed of the Tiny-YoloV3 in a Raspberry Pi 3 Model B is more than 3 times slower than the test speed presented by the probabilistic candidate window algorithm-based system presented in this paper. This fact has a notable relevance in order to illustrate the performance of the system presented in this work against one of the most popular detection systems from state of the art such as Tiny-YoloV3.
In this paper, a novel anomalous video surveillance system managed by microcontrollers and 360
Even though object detection and categorization are highly complex tasks that usually require large amounts of computing power and energy consumption, the proposal detailed in this document features a low energy, low cost system optimized for a Raspberry Pi 3 Model B microcontroller. Experimental results confirm the excellent performance of our proposal against other new detection systems from state of the art such as Tiny-YoloV3 achieving better results in both accuracy and time performance. These facts support the proposal described in this paper as a valid video surveillance system even considering the low cost and energy saving intrinsic nature of this entire project.
Regarding future work, the objective is to improve the system performance by achieving more accuracy in the detection, categorization, and tracking of anomalous objects, while maintaining the frame processing time within acceptable values. This will involve exhaustive research to find the correct parameter values for tuning the mathematical model so it can perform at its best.
Footnotes
Without any network connection that would supply the possibility of using any cloud computing services.
Acknowledgments
This work is partially supported by the Ministry of Economy and Competitiveness of Spain under grants TIN2016-75097-P and PPIT.UMA.B1.2017. It is also partially supported by the Ministry of Science, Innovation and Universities of Spain (grant number RTI2018-094645-B-I00), project name Automated detection with low cost hardware of unusual activities in video sequences. It is also partially supported by the Autonomous Government of Andalusia (Spain) under project MA18-FEDERJA-084, project name Detection of anomalous behavior agents by deep learning in low cost video surveillance intelligent systems. All of them include funds from the European Regional Development Fund (ERDF). The authors thankfully acknowledge the computer resources, technical expertise and assistance provided by the SCBI (Supercomputing and Bioinformatics) center of the University of Málaga. They have also been supported by the Biomedic Research Institute of Málaga (IBIMA).They also gratefully acknowledge the support of NVIDIA Corporation with the donation of two Titan X GPUs used for this research. The authors also thankfully acknowledge the grant of the Universidad de Málaga. Karl Thurnhofer-Hemsi (FPU15/06512) is funded by a PhD scholarship from the Spanish Ministry of Education, Culture and Sport under the FPU program. The authors acknowledge the funding from the following grants, which was used to develop the OASIS database by its creators: P50 AG05681, P01 AG03991, R01 AG021910, P50 MH071616, U24 RR021382, R01 MH56584.