
Abstract
Today’s deep learning architectures, if trained with proper dataset, can be used for object detection in marine search and rescue operations. In this paper a dataset for maritime search and rescue purposes is proposed. It contains aerial-drone videos with 40,000 hand-annotated persons and objects floating in the water, many of small size, which makes them difficult to detect. The second contribution is our proposed object detection method. It is an ensemble composed of a number of the deep convolutional neural networks, orchestrated by the fusion module with the nonlinearly optimized voting weights. The method achieves over 82% of average precision on the new aerial-drone floating objects dataset and outperforms each of the state-of-the-art deep neural networks, such as YOLOv3, -v4, Faster R-CNN, RetinaNet, and SSD300. The dataset is publicly available from the Internet.
Introduction
In 2017, the US Coast Guard took part in 15,951 search and rescue (SAR) operations [1], in which – despite great efforts and sacrifice – 618 people lost their lives. Unsurprisingly, one of the most difficult and expensive part of each SAR operation is localization of missing people and objects [2]. Recent technological advancements in the fields of unmanned aerial vehicles, artificial intelligence and computer vision can provide unprecedented help in such rescue missions. Helicopters and search drones are now equipped with cameras operating in various spectra, reflectors, marine automatic identification system (AIS) transponder receiver, tracking and navigation systems [3, 4], and even cell phones detectors. Much work is aimed at improving communication systems [5], as well as at better search path planning [6, 7]. However, object detection systems based on neural networks are not yet very popular in SAR applications, with only a few available publications [8, 9], mostly due to the lack of sufficiently large training datasets. To alleviate this problem, in this paper a novel aerial-drone floating objects (AFO) dataset is proposed. Created specifically for the problem of small objects detection in marine environment, AFO contains 3647 images with close to 40,000 labeled objects, as described in Section 3. To promote further research and to help other researchers AFO is publicly available for academic usage.1
We used AFO to train and evaluate a number of the newest deep neural architectures aimed at small objects detection. Based on observations of their performance and properties in this paper we propose a novel deep architecture formed as an ensemble of diverse deep neural classifiers orchestrated by the fusion module with nonlinearly optimized weights. The proposed method improves the AP@50 (Average Precision for Intersection over Union
The rest of this paper is organized as follows. Section 2 contains a short overview of related works on available aerial datasets and the state-of-the-art object detectors, as well as works devoted to the difficult task of small object detection. In Section 3 the structure and content of the novel AFO dataset are presented. In Section 5 our methodology is presented alongside with the experiments conducted with AFO and the state-of-the-art deep neural architectures as well as with our proposed ensemble method. The paper ends with the conclusions and possible future directions outlined in Section 6.
Related works
In this section the existing works aimed at creation of aerial datasets, object detection with the deep neural architectures, as well as specificity of small object detection are presented and briefly discussed.
Aerial datasets
Aerial datasets constitute a key component for training trained classifiers for numerous tasks such as land cover classification tasks [10, 11, 12], detection of large landmarks such as sports fields, bridges or ports [13, 14], car and pedestrian detection [13, 15] and many more. Various datasets can be further divided by the image acquisition method. Majority of images are acquired in the visible spectrum, although recently new datasets with mixed spectra show up [16]. Datasets with aerial images, which we are mostly interested in this work, come either from unmanned aerial vehicles (UAVs) equipped with regular cameras or satellite imaging systems. Such diversified capturing devices results in big difference in spatial resolution of gathered photos, ranging from 1 to 10 cm per pixel for drone-mounted cameras to even 30 m per pixel for satellites.
Satellite datasets with the lowest spatial resolution are most often prepared for the task of scene classification, e.g. EuroSAT [10] – land use and land cover classification (e.g. industrial, residential, river, forest, crop) BigEarthNet [11], as well as for multiclass classification (e.g. mixed forest, sea and ocean, construction sites etc.) Data with medium (1 m to 10 m) spatial resolution are used for more challangeing task of semantic segmentation. Examples of such datasets are: LandCoverNet [17] containing 7 land classes (e.g. water, snow, woody), LandCover.ai [18] with three classes of area allocations (building, woodland and water), as well as 95-Cloud ALCD Reference Cloud Masks aimed at semantic segmentation of clouds [19, 20, 21, 22].
The two largest datasets prepared for the task of object detection in satellite photos – xView [13] and DOTA [14] – have spatial resolution ranging from 20 cm to 40 cm. In both the smallest marked objects are passenger cars. xView includes 60 categories of artifical objects and over 1 million instances, all photos were taken from WorldView-3 satellites at 0.3 m per pixel resolution. DOTA includes 188,282 objects assigned to 15 categories, from “small vehicles” to storage tanks and different sport courts, photos have different spatial resolutions, with horizontal and oriented bounding boxes.
Moving to application-specific datasets using satellite images the Ship Detection Challenge Dataset [23] can be mentioned. It was created by Airbus company to assist SAR services from the satellite level in the search for missing ships and vessels. It consist of 131 thousands instances of ships annotated on 1.5 m resolution satellite images.
The main difference between drone datasets, apart from the fact that they usually have higher spatial resolutions, is different camera orientation, i.e. they have varying degree of pitch angle. In datasets composed of satellite images, the camera is always oriented vertically.
Vast majority of the drone acquired datasets are devoted to detection and tracking of people and cars. VisDrone [24] is a dataset containing 10,209 images and 263 video clips with close to 180 thousand frames. Composed of mainly urban photos, taken with mostly vertical and low oblique camera orientations, it contains more than 235,000 labeled objects, split into ten classes (e.g. pedestrian, car, bus, truck, bicycle). On the other hand, Stanford Drone Dataset [15] contains over 920 thousand video frames from more than 100 static scenes with 185281 labelled objects split into 6 classes (pedestrian, bicycle, skate, cart, car, bus). It was prepared mostly for tracking and trajectory forecasting in urban environment.
Drone datasets are also often created for a specific task [25, 26, 27, 28]. The AFO dataset, presented in this paper, is an example of such a dataset, i.e. the one prepared for a specific application. Due to specifics of SAR operations, e.g. object categories, environment, image resolution, already existing datasets are not very well suited for research in this field. Therefore, we created the first publicly available dataset for training computer vision models for marine SAR operations.
General purpose object detectors
In recent years, with the development of deep learning methods and their learning strategies [29], there are more and more applications using them for different purposes [30, 31, 32, 33]. Among them, the task of detecting objects is one of the most important areas that is dynamically expanding every year [34, 16, 35], which has led to the establishing of two main paradigms for their architecture. First one splits object detection pipeline into two steps: region proposal generation and bounding box regression combined with classification. This type of architecture is dubbed as two-stage detector. The other approach, called one-stage detector, has no intermediate task and implements object detection directly within a single network. This leads to simpler and overall faster model architecture at a cost of lower flexibility in other tasks, such as a mask prediction.
First widely known implementation of the two-stage object detector is the region-based convolutional neural network (R-CNN) proposed by Girshick et al. [36]. It employs a classic selective-search algorithm [37] for region proposal generation and the convolutional network for extracting fixed-length feature vectors from every proposed region. These are later classified using Support Vector Machines (SVMs). The same authors further refined this approach presenting Fast-RCNN [38]. Computational overhead of R-CNN was significantly reduced because feature maps are now shared between regions of interest (ROIs). Moreover, classification SVMs were replaced by the fully connected neural network employed to the combined tasks of object classification and bounding box regression. This also allowed to introduce an end-to-end network training.
Ren et al. in [39] presented two-stage detector called Faster RCNN capable of detection on up to 5 images per second. It adopts the detection module from the Fast R-CNN but with enhancements for both speed and detection performance. The selective search algorithm was replaced with the Region Proposal Network (RPN). Both RPN and detection head share their convolutional features. The entire network, i.e. the convolutional back-end network, RPN and the detection head, is trained in an end-to-end manner.
On the other hand, one-stage object detection architectures allow to achieve significantly higher runtime speed at the cost of lower detection performance. There are currently two widely known and used model architectures for this type of detectors: You-Only-Look-Once (YOLO) [40] and Single-Shot Detector (SSD) [41].
SSD performs object localization and classification tasks in a single forward pass of the network, eliminating proposal generation and subsequent feature resampling stage. A fixed-size collection of bounding boxes and scores is utilized for detecting presence of the object class instances. To produce final detections, non-maximum suppression step is used. SSD implements extra feature layers to make independent object detections from multiple feature maps. This approach is later improved by usage of a focal loss in the network called RetinaNet, as proposed by Lin [42]. Focal loss concentrates learning process on hard examples, vastly improving detection performance.
Redmon et al. proposed a series of improved versions of the YOLO architecture, i.e. YOLOv2 [40] and YOLOv3 [43]. Incorporating deeper convolutional backend network, along with several techniques, like residual skip connections, residual blocks and upsampling, it is still one of the fastest object detection techniques, while achieving very respectable accuracy.
Recently, a thorough refreshment of the YOLO architecture, named YOLOv4, was presented by Bochkovskiy et al. [44]. Improvements concern the training process, e.g. data augmentation scheme called CutMix, DropBlock regularization method, and class label smoothing, as well as changes in the network architecture; these include dense convolutional blocks in form of new backend network called CSPDarknet53, path aggregation network combined with spatial attention blocks, which replaces classic feature pyramid network as well as new activation layer called Mish. YOLOv4 claims to have state-of-the-art accuracy while maintaining a high processing frame rate.
Small objects detection
By definition derived from [45] for COCO (Common Objects In Context) dataset, small objects are classified by their surface area. Regions of interest with dimensions smaller or equal to 32 by 32 pixels are considered as small objects. However, it should be noted that this metric does not take into account the initial resolution of the input image. Current state-of-the-art models achieve very good results for medium and large sized objects, but detection of small objects is still a challenging task. This is directly due to the much smaller amount of information associated with the object, which results in difficulties with distinguishing the object from the background and from other categories. Also deep architectures attenuate small areas by the consecutive pooling layers, and finally, small regions are more affected by noise image distortions. In addition, both the number of possible locations of the object in the picture and requirements for precise localization are much higher. For these reasons many different ways of improving small objects detection have been proposed.
Kisantal et al. proposed data augmentation scheme that involves small objects oversampling by their multiple copying and pasting [46]. This allowed to increase the number of images in the dataset containing instances of small objects, thus resulting in much greater overlap between small ground-truth objects and the predicted anchors. Authors reported relative improvement of over 7% in their object detection task.
Singh et al. presented a modification of the network training process [47]. Images are fed to the network multiple times, with differing scale, and only objects with size within a specific range are compared with the ground truth. This effectively reduces the effect of gradient blurring that appears when objects of radically different scales are learned together. Further reduction of computational complexity of this learning scheme was presented by the same authors in [48].
On the other hand, some researchers propose modifications to network structures. Context-based feature fusion and attention mechanisms presented by Lim et al. use additional features from different layers as context for small, low-resolution objects that carry limited amount of information [49]. Different approaches were suggested by Li [50] and by Bai [51], both proposing generative adversarial networks (GAN) to increase feature-map resolution, in result increasing performance of further detection modules.
In our work, we prepared the AFO dataset in which over 99% of the objects have a surface area smaller than 1% of the entire image area. Our dataset also contains a lot of crowdy images - more than 30% of the images contain more than 20 instances of objects. Therefore AFO can be used for development and verification of small object detection methods, as described in the next section.
Aerial drone dataset of floating objects
In this section we present details of our proposed AFO dataset created to train models for SAR operations. AFO is free to use for academic purposes; the entire dataset can be downloaded from the website.2 Fifty video clips containing objects floating on the water surface, captured by the various drone-mounted cameras (from 1280
The recordings used to create the AFO dataset come from two sources. Some of the videos were recorded by us during organized experiments, on which people performed previously planned positions (swimming in different styles, drifting with the head in the water, drifting on the back, etc.) Other records have been granted by various photographers who wanted to support our project; they are listed in the acknowledgment of this paper.
Category selection
In order to create a dataset as universal as possible, we decided to prepare and test three types of partitions.
The first one contains six different categories, as follows: human, wind/sup-board, boat, buoy, sailboat, and kayak. It was prepared to check how accurately detectors can detect humans vs. other floating objects. Unfortunately, the problem here is a large data imbalance since the human class contains over 80% of all object instances.
Number of objects per category
Number of objects per category
Samples of annotated objects in the AFO dataset. Three samples per each category are shown.
Images from various camera orientations collected during data acquisiton for AFO dataset. A vertical orientation (left), a low oblique (center), a high oblique (right – rejected from the dataset).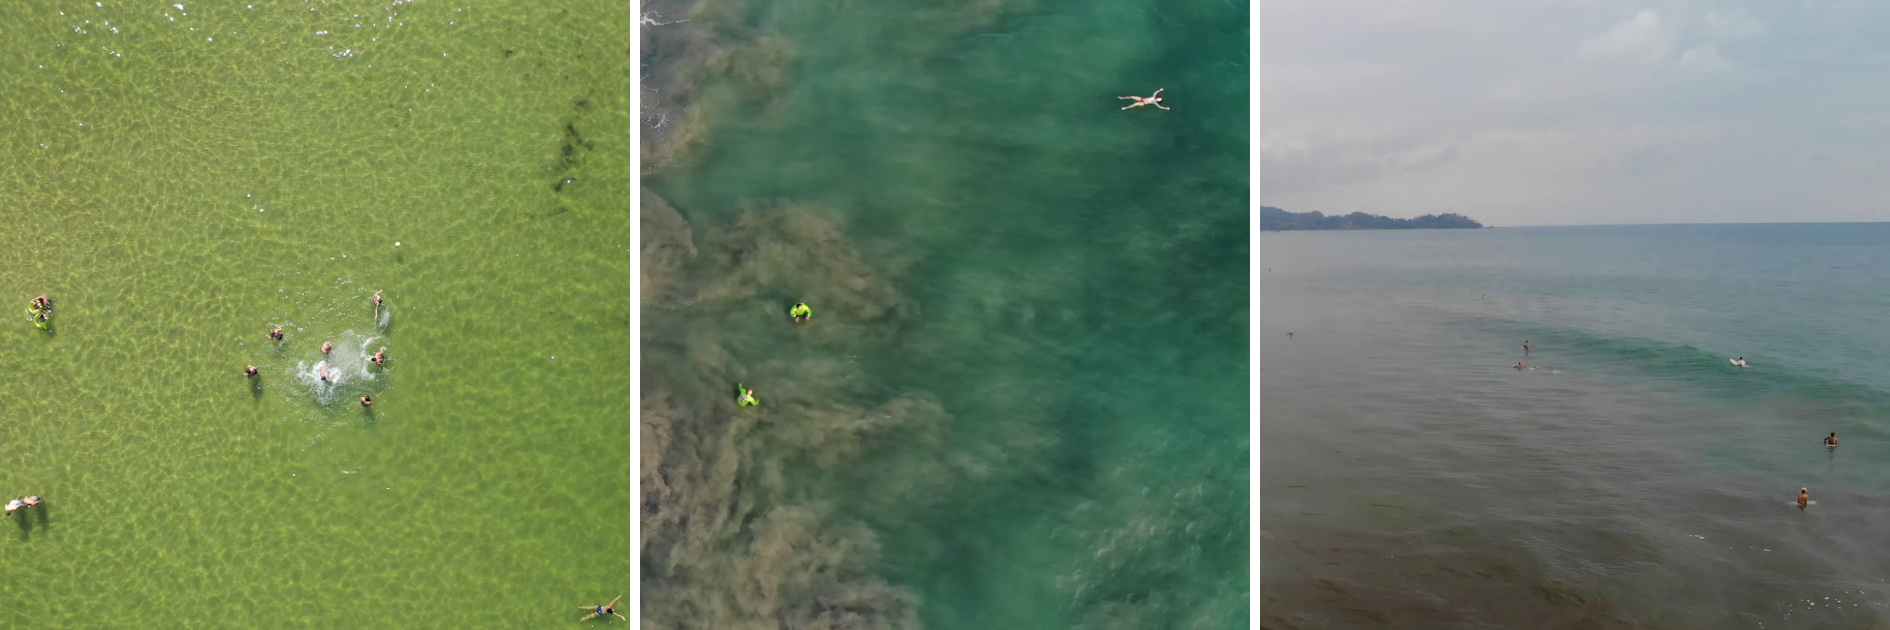
Images presenting various environmental condition present in AFO dataset (water color, wave conditions).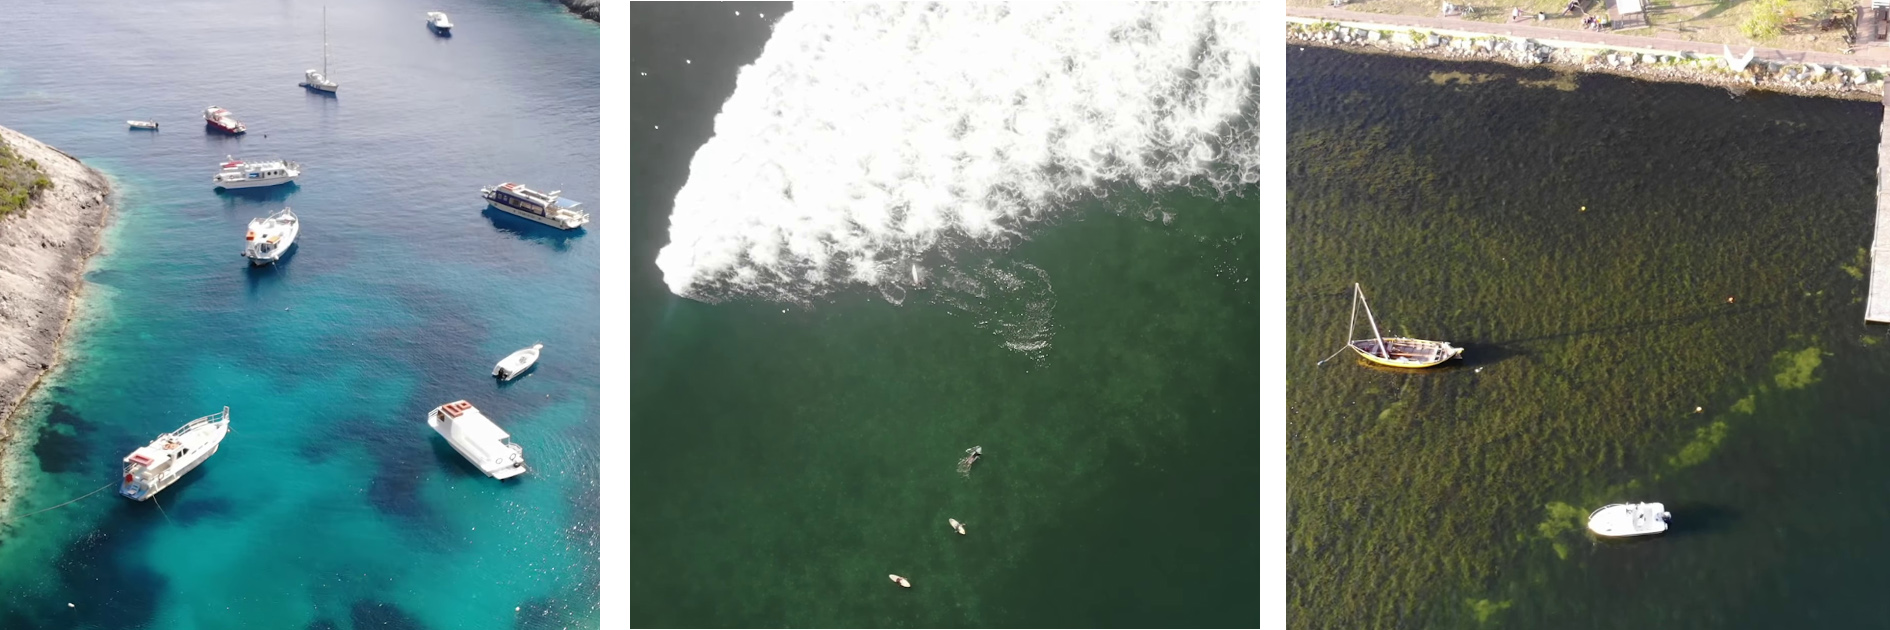
Based on the assumption that in most maritime SAR operations the detection of the object is more important than assigning it to a specific category, we decided to create a dataset version with only two classes. Therefore, we decided to combine the human and buoy categories into one “small objects” class, and all other classes (wind/sup-board, boat, sailboat, kayak) into the second “large objects” category. This made the dataset slightly more balanced, and also prepared it to train the models for most popular types of SAR actions, i.e. searching for missing people (small objects) and boats (large objects).
In the third version, we decided to assign all objects marked by us to one class. This was done to reflect the fact that usually during SAR operations at the sea, finding any object of a human origin can be significant. However, we expected that this could hinder the network learning process by depriving classes of their unique features and, consequently, worsen the results.
All of the objects were labelled manually and the description of their bounding boxes is saved in the format (class, xc, yc, w, h), where (xc, yc) is the center location, w, h are the width and height of the bounding box, respectively.
Limitations during data selection
In the data selection process, we developed two rules that defined whether or not a recording is suitable for our dataset. The first limitation concerned the altitude on which the video was taken. Based on the knowledge from the International Aeronautical and Maritime Search and Rescue Manual Volume II [2] and currently existing solutions we decide to collect only photos taken from a distance beetween 30 to 80 meters.
The second rule of data selection concerns the angle from which the video was taken. We decided to collect only recordings that were taken with a vertical or a low oblique camera position. Videos taken with camera set to a high oblique view (the ones with the visible horizon) were rejected from our dataset.
Distribution of objects dimenionson relative to image size. Please note different scale in X axis for two bottom images.
Videos to the dataset were selected to contain diversified environmental and weather conditions. Hence, the collected recordings come from thirty-five different places, located in six different countries. Each of these places has different environmental and weather conditions, as follows: water depth and color, shape of the shore, wave and sea conditions.
Most of the photos come from fairly calm conditions – up to 5 of the Beaufort scale. However, we do not think that this reduces value of this dataset since many of the SAR actions at sea take place under calm conditions [52]. Secondly, it is worth noting that, depending on a model of a helicopter, in low-altitudes they can be used up to 6–8 degrees of the Beaufort scale (to the wind speed of 30–40 knots) [53], so the object detector does not have to work in more difficult conditions. Using the drone, we were not able to get photos from more difficult conditions, but we believe that our dataset covers majority of SAR operations. However, as we hope that our work will spur up new developments in this research area, dataset could be improved in the future.
A collection of small and very small objects
The property that distinguishes our dataset from others is a huge number of small and very small objects. Over 99% of the objects in the AFO dataset have a surface area smaller than 1% of the picture area. For comparison, in the COCO dataset more than 30% of objects have areas greater than 10% of the entire image area [45]. This is mainly due to the fact that the photos collected in AFO dataset have large or very large resolutions between 1280
Detection of relatively small objects in high- resolution photos poses a big difficulty for the evaluated neural models because in most of them photos on the entrance of a network are scaled to lower resolutions, which can cause our objects to be too small to be correctly distinguished from each other, or recognize from the background. Therefore AFO can be considered as a representative dataset for training and verifying models designed for small object detection tasks.
Block diagram of ensemble inference.
The AFO dataset contains a lot of crowdy images – more than 30% of images in our dataset have more than 20 instances of objects, whereas the most crowded images have more than 50 instances of objects. This property makes AFO dataset good for testing solutions prepared for detecting very small objects in crowded areas in high-resolution pictures, which is today one of the biggest challenges for models [54].
Specific size distribution for each class
It is also worth mentioning that each of the categories selected and annotated by us is characterized by high uniqueness due to its size distribution. Figure 4 presents size histograms for each class.
This is an interesting and rare property of AFO, being a result of all photos taken from one altitude in the range of 30 to 80 meters. Hence, objects of the same category have similar sizes. In other datasets, such properties do not appear, because their photos are taken in a very big range of distances and angles. In the case of training a model that would operate at a different altitude, this property will be a disadvantage. However, we assume that detection systems for SAR purposes usually operate at similar altitudes. Therefore, such a feature should make it easier for neural networks to correctly detect objects and the AFO dataset is suitable for evaluating models that can take this into account.
Ensemble of classifiers
Following our previous experience with ensembles of classifiers [55, 56], as well as the experiments presented by Körez et al. [57], we decided to evaluate an ensemble model that uses multiple object detectors with diversified regions of competence, orchestrated by a fusion module with weighted majority voting. Our main goal was to further improve the AP and AP@50 results by combining already good performing models, as well as by computing optimized weights of the fusion modules that best reflect competence regions of the member classifiers. Overall architecture of the proposed ensemble architecture is presented in Fig. 5.
In the proposed model, detections from different sources are fed into the weighted refining block. The algorithm is repeated for every class of objects separately and operates as follows:
Let
Detections list
Set of ensemble weights for every model Sort all detections in Select detection with the highest confidence in Calculate refined detection by computing new confidence score
where Store refined detection If
Ensemble detection list
By adjusting weights and IoU threshold, different properties of selected models can be exploited, e.g. model that is better at regressing position can have more influence on final bounding box.
To find optimal parameters for selected combinations of the input models we used the Differential Evolution optimization algorithm, proposed by Storn and Price [58]. It is one of the most popular and efficient evolutionary algorithms for numerical optimization, that over the years proved to have many academic as well as real-world applications, with further improvements and developments presented by other researchers in recent years [59, 60]. As a goal function, we selected an average precision (AP) calculated for IoUs between 0.5 to 0.95, as defined in MS COCO [45], and measured on validation split of the AFO dataset. We enforced weights normalization, that is weights of all parameters have to sum up to 1.0.
For the quantitative evaluation a number of state-of-the-art deep neural detectors were selected, as follows: Faster R-CNN with Feature Pyramid Network and ResNet backbone (50 and 101 layers deep), RetinaNet with ResNet backbone (50 and 101 layers deep), SSD with MobileNet v2 backbone as well as YOLOv3 and YOLOv4. In most SAR maritime operations detection of an object is more important than assigning it to a specific category. Therefore, after initial tests, we have decided to present the performance on a two-categories version of the AFO dataset. Overall results are shown in Table 2, for evaluation metrics, we adopt the same AP calculation as for MS COCO [45].
Results of baseline models evaluated on the two-categories version of AFO dataset. Best results are presented in bold text
Results of baseline models evaluated on the two-categories version of AFO dataset. Best results are presented in bold text
For our tests we used three different machine learning frameworks: Darknet [61], Detectron2 [62] and TensorFlow [63]. In this section we present learning scheme and parameters for each of the tested models. In all cases we started with model pretrained on COCO dataset [45]. Images were resized to match network base resolution, both during training and evaluation phase.
Darknet framework (YOLO v3 and YOLO v4) Base network resolution was set to 544 by 544 pixels. We limited the number of iterations in our training to 20,000, with learning rate decrease by factor of 10 on steps 16,000 and 18,000. Batch size was set to 64, the momentum and learning rate were set to 0.9 and 0.001, respectively. The rest of parameters were set to their default values. Detectron2 framework (Faster R-CNN and RetinaNet) In both networks the base resolution was set to 1333 by 750 pixels. Similarily to Darknet framework, training iterations were limited to 20,000. The batch size was set to 4 images and the momentum and learning rate were set to 0.9 and 0.0125, respectively. TensorFlow framework (SSD) The backend network resolution was set to 300 by 300 pixels. Network was trained in 50 thousand iterations. The batch size was set to 24 images. Learning rate was set to 0.004 and momentum to 0.9, respectively.
Experimental results are presented in Table 2. The best results were achieved with models trained using Detectron2 framework – Faster R-CNN and RetinaNet. We observe that almost every metric has different best performing model. Models with the same detection head, but with deeper backbone networks, like ResNet101, have better detection performance for large objects than shallow architectures, like ResNet50. Also, their AP@50-95 score is better. On the other hand, AP@50 score is lower, probably due to vanishing features of small objects in deeper networks. It is worth noting, that the model with the best AP@50 does not have the best results when analyzing classes separately. For the “small object” category, the best performing model was RetinaNet with ResNet50 backend, while highest score for “large object” class was achieved by Faster R-CNN with ResNet101. This observation suggests that the use of the ensemble model composed of multiple models may bring even better results, as will be discussed later.
Another significant fact, that despite the smaller number of training examples of large objects in the training set, each model is significantly better at detecting them. This exemplifies how the detection of small objects is a much more difficult task, even for today’s state-of-the-art models.
The inferior performance of the SSD architecture requires further explanation. We argue that this can be attributed to the much lower input resolution of the selected MobileNet v2 backend. Accompanied by a lack of the feature aggregation techniques, it severely degrades detection performance of small objects. This hypothesis seems to be confirmed by the fact, that the RetinaNet architecture, which is based on SSD, but employs very powerful feature aggregation technique called Feature Pyramid Network, and often utilizes much bigger backbone networks, achieved overall best results in our study.
On the other hand, results of YOLOv3 and YOLOv4 show, that even with relatively small network, that can perform real-time inference on embedded platforms like nVidia Jetson AGX [64], it is possible to achieve good detection performance on relatively small input images, if presented with feature aggregation techniques (YOLOv3) and advanced training and architecture modifications (YOLOv4).
Samples of ensemble model detections where model detections (left) were better than the manually annotated ground truth bounding boxes (right).
Example of detections of Ensemble #3 model and its inputs from other models (Faster R-CNN and RetinaNet). Ground truth bounding boxes are placed in the last column.
Two types of ensemble models were tested in our study, i.e. two-model ensemble and three-model ensemble. For each experiment we selected best individual models. Even the worst performing ensemble improved AP and AP50 score over best individual model by 0.85 and 0.88 percentage points respectively. In the best case, we achieved 1.46 (AP) and 2.34 (AP50) percentage points. Moreover, it is interesting that different combinations of models achieve best results in each metric. This shows that despite identical training procedure, models are indeed specializing for distinctive tasks. Nonetheless, as seen by the results of Ensemble #5, models with greatly varying parameters lead to a decrease in accuracy.
As shown, combining individual models can improve detection results, but there is an obvious downside in a form of an additional computational load. However, this can be somehow mitigated, e.g. by sharing feature maps between detection heads with the same backbone network architecture. What we gain in exchange, besides increased performance, is a simplified training process, since each model is trained separately, as well as flexibility in the selection of the object detector, which can be replaced incurring only a simple weight optimization step.
To visually compare proposed ensemble model to individual models, we chose version #3, which was composed of Faster R-CNN (ResNet101
Reduction of False Negatives (FN) In the examples presented in rows R1, R3, and R6 it can be seen how the different parts of the Ensemble 3 model complement each other, resulting in increased recall. In R1 Faster R-CNN detected a human missed by RetinaNet, in R3 the opposite situation occurs, in both cases the detection was in the ensemble model output and is consistent with the ground truth (GT) information. Then, in the R6 we can see that Faster R-CNN has detected a windsurfer floating on the board, but RetinaNet missed it. The ensemble combined both outputs, matching GT. Reduction of False Positives (FP) Looking at the examples from rows R2 and R5, we can see that the ensemble does not always transfer all detections from a single model to its output. In the bottom part of the example R2, RetinaNet falsely predicted a small object, that was correctly removed by the ensemble using outputs from Faster-RCNN. Analogous situation is presented in R5, this time with the correct output from RetinNet and false-positive reported by Faster-RCNN. Elimination of the double detections Finally, in the example R4, it can be seen how, thanks to the ensemble model, double detection of the same object was deleted. The boat has been marked twice by RetinaNet, which was rectified by the ensemble model using the output from Faster-RCNN.
It should be also noted that the ensemble model detected a fairly large number of objects which, because of being partially visible in the image (location on the image borders) or being located too far in the background, were not marked in the ground truth data files by the human annotators. Three examples of such situations are presented in the Fig. 6. In image on the top, two surfers that are only partially visible were not marked during data labeling process, but ensemble model found both of them. In the middle image, two persons in the background of the image were omitted in the GT file, whereas the ensemble model found them and additionally marked the person on the jetski. Finally, in the bottom image, a boat was not marked in the GT file because it is only partially visible, but again, the ensemble model marked it correctly as a large object.
In our work, we investigated and conducted research into the relatively unexplored topic of computer-based detection of objects for maritime SAR purposes. Thanks to our AFO dataset, which is the first dataset in this domain, we were able to evaluate the state-of-the-art deep neural models in this specific task. We believe that release of the AFO dataset, which is available from the Internet, will result in development of applications that will help save human lives at sea as well as push the envelope of current research. The next scientific contribution presented in this paper is the proposed ensemble model that combines multiple best performing deep neural models, joined by the weighted majority voting fusion module. Thanks to the proposed nonlinear optimization of its weights the proposed ensemble method shows results that outperform each of the best state-of-the-art deep neural detector.
Our results can be further improved and in the future works we are going to work with the temporal convolutional neural networks that can incorporate several consecutive frames of a given video. We also plan to investigate object tracking systems for SAR operations. Also, an interesting field of future development is application of thermal images, as well as fusion of the visible and thermal spectra. This however requires yet another new dataset containing both thermal and visible recordings.
Further steps may involve creation of new specialized object detection models, as well as newer powerful machine learning/classification algorithms such as for instance the Enhanced Probabilistic Neural Network [65], the Neural Dynamic Classification (NDC) algorithm [66], and the Finite Element Machine for fast learning [67].
Based on our results, it can be clearly stated that the combined hybrid models, containing diversified detectors, can be successfully used for object recognition in the maritime SAR actions.
Footnotes
afo:download.
Acknowledgments
This work was supported by the Polish National Science Center under the grant no. 2016/21/B/ST6/01461.
We would also like to express our thanks to Agnieszka Malonik Taggart, Wojciech Sulewski, Dariusz Nawrocki, and Wojciech Kubiela – photographs who decided to support our project by sending us videos for the AFO dataset.