
Abstract
Training a model using batch learning requires uniform data storage in a repository. This approach is intrusive, as users have to expose their privacy and exchange sensitive data by sending them to central entities to be preprocessed. Unlike the aforementioned centralized approach, training of intelligent models via the federated learning (FEDL) mechanism can be carried out using decentralized data. This process ensures that privacy and protection of sensitive information can be managed by a user or an organization, employing a single universal model for all users. This model should apply average aggregation methods to the set of cooperative training data. This raises serious concerns for the effectiveness of this universal approach and, therefore, for the validity of FEDL architectures in general. Generally, it flattens the unique needs of individual users without considering the local events to be managed. This paper proposes an innovative hybrid explainable semi-personalized federated learning model, that utilizes Shapley Values and Lipschitz Constant techniques, in order to create personalized intelligent models. It is based on the needs and events that each individual user is required to address in a federated format. Explanations are the assortment of characteristics of the interpretable system, which, in the case of a specified illustration, helped to bring about a conclusion and provided the function of the model on both local and global levels. Retraining is suggested only for those features for which the degree of change is considered quite important for the evolution of its functionality.
Keywords
Introduction
The complete transformation of supply chain (SC) in a truly integrated and fully automated process assumes the continuous and endless collection of digital information from every stage of the production [1]. Following this idea, the history of services and products per stage of the supply chain, can be investigated. The emerging continuous need of connectivity, raises serious concerns for the protection of personal data and for digital security as a whole [2].
The blockchained adaptive federated auto meta-learning architecture.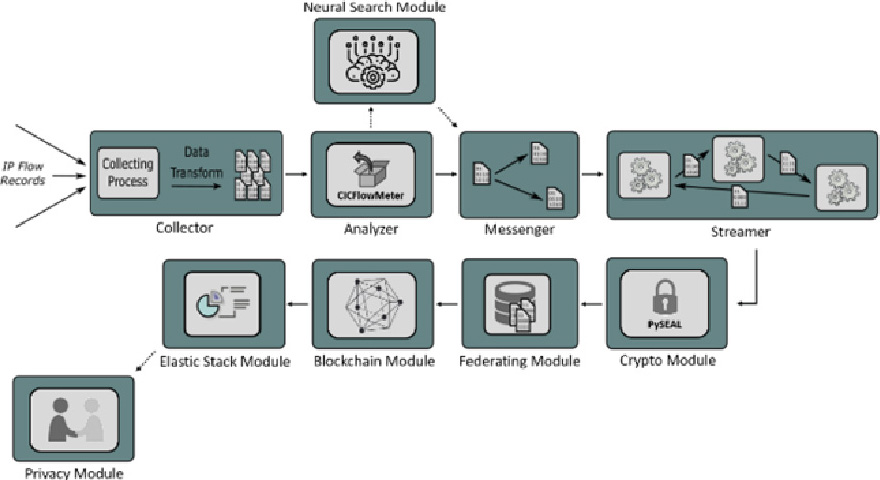
At the same time, the heterogeneity of the systems included in the supply chain as well as the non-conventional interoperability, in terms of hardware and software, results to even more serious concerns related to the security and protection of these systems [3, 4].
Recently, the authors developed and presented a specialized and technologically up-to-date framework for the protection of digital security, privacy and industrial confidentiality. Specifically, the developed framework is related to an advanced adaptive federated auto metalearning mechanism (AFAMM), which operates on a blockchain and applies advanced encryption techniques, to fully ensure privacy and industrial secrecy [5]. The security and privacy focused architecture of this framework, has three main characteristics, namely: a) no sensitive data is transmitted through communication channels b) the data is not stored in a central point of attack and c) the learning algorithms are constantly upgrading their predictability [2, 5].
An intelligent control mechanism has been developed to detect malfunctions in the processes of a communication network running under an Industry 4.0 environment [6]. This system is based on the analysis of network traffic and on the development of an automatic intelligent neural network for the control and detection of abnormalities. The training and updating of the model were performed using federated learning and the communication of all involved parts was done through blockchain methods. The modules of this architecture are illustrated in Fig. 1.
Under this framework, when a device wants to communicate with another, the proposed intelligent mechanism is activated, implementing a network traffic control to detect anomalies. In the first phase, the features of the network’s traffic are exported in order to form the input vectors to a Neural Network (NN) that is automatically developed following the Neural Architecture Search technique. The model is initially trained on the host server with some initial data, in order for the training process to begin. Then, it is encrypted with homomorphic encryption and it is sent via blockchain (BLCH) to nodes that will use it. The nodes in question receive the model and improve it by exploiting the data at their disposal [7, 8, 9]. The obtained enhanced version is encrypted and returned via blockchain to the host server. In this stage, the best models are aggregated, and the weighted average is selected using the Grid Search Weighted Average Ensemble method. The final model is returned back to the nodes using BLCH. If the traffic is characterized as normal, further communication is allowed. Otherwise, communication is forbidden and an alarm is sent to the control center, for further analysis of the transaction [10].
The federated module allows remote devices to download and run the original trained machine learning model that is developed by the neural search approach. This is populated with local data, improving its accuracy, and then it is sent back to the federated module, which summarizes the changes using the Dynamic Weighted Average technique. The updated version, is fed back to the network nodes, through the blockchain module [11, 12].
Based on this architecture, the initial experiments give the impression that there is a continuous improvement of the intelligent model, and that end users can have constant access to an ever-upgraded NN. After extensive observation, it was demonstrated that learning a single universal model by aggregating the best models and selecting the weighted average via Dynamic Weighted Average (DWA), could not satisfy the local needs of the users. This is due to the fact that the events they had to deal with, were significantly different in terms of the data threats they process. For example, mobile users face different threats than the Internet of Things’ (IoT) devices or SCADA industrial network terminals [10, 13].
While constant upgrade increases generalization, it raises serious concerns for its efficiency at local level. Figure 2 shows the noticeable decrease of the local model’s accuracy, compared to the global and to the original ones.
Local vs global models’ accuracy.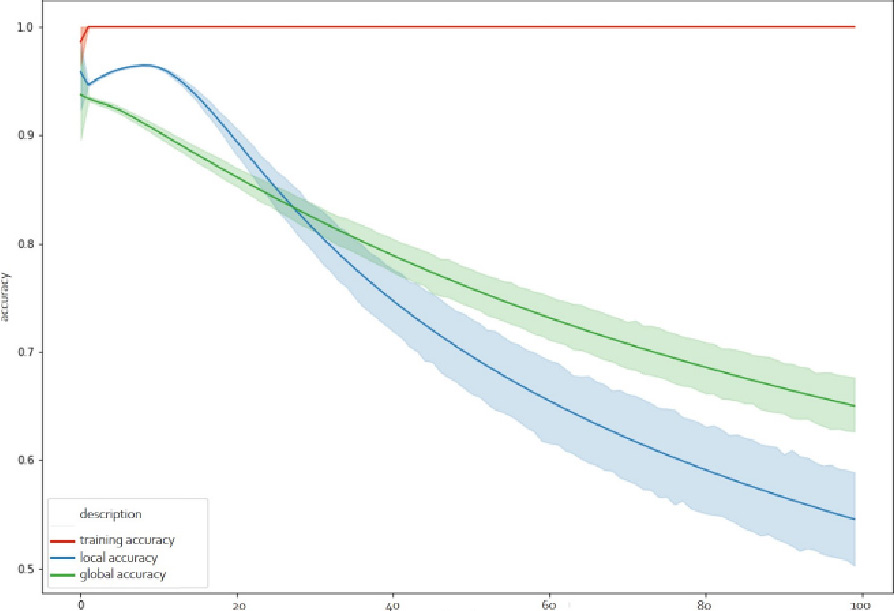
Drift data by classes.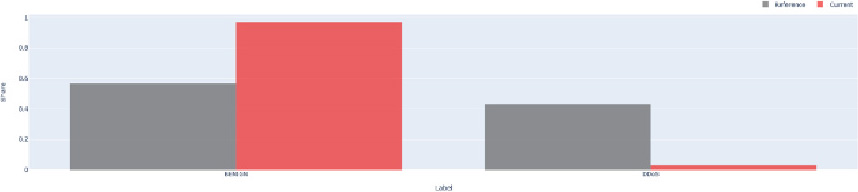
As it can be seen after the first 30 iterations, the local model has significantly higher accuracy than the global one. This is explained by the fundamental hypothesis related to the development of any supervised machine learning model (MLM), according to which, the data under considerarion, mimic real-world cases. No matter how accurate the MLM, the predictions are correct only if the used data is identical or statistically equivalent to the training vectors. Minor changes (drifts) that a realistic problem is capable of bringing to the data [14, 15], might result in a reduction of the classification accuracy, as it is shown in Fig. 2.
Drift data in BwdPacketLengthMax future.
Drift data in BwdPacketLengthMax future by classes.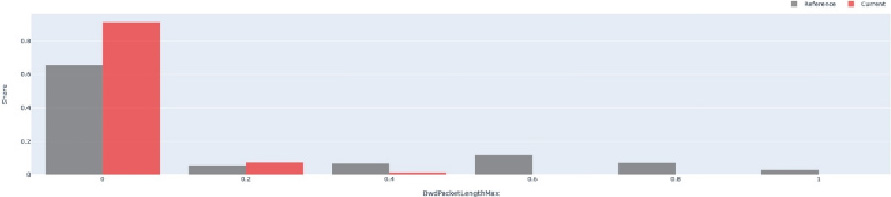
In this research paper, a drift analysis has been performed to identify the response of local models to changes in the data, and to estimate how they affect the properties of the classes that the learning system is trying to discover. In cases where changes occur (drift) a sensitivity analysis can provide accurate information about the quality of the universal model, produced by the federated learning system [16].
Initially,
where
A specific example of the BwdPacketLengthMax feature and its dispersion, appears in the following Figs 4 and 5.
From the above analysis it was concluded that there are three options that can be followed to effectively address the problem [3, 18, 19]:
The first is retraining the system. This approach is characterized by high computational costs that are considered unacceptable, while in practice, this methodology did not perform well. The second is the use of Adaptive Learning methods [20] that are capable to follow changes presented by the data stream. The methodology in question is first checked for the accuracy of the categorization it can produce. It also requires mechanisms that forget outdated examples and therefore address the problem of catastrophic forgetting. Finally, it develops requirements for the model to be reviewed on an ongoing basis, which creates serious computational costs, while its utilization would be preferable for data flow analysis. The third is detecting changes and retraining only those features of the model for which the degree of change is considered sufficiently significant. The methodology in question, requires strategies to detect and quantify potential changes in the data that modify their distribution over time. It also needs a reliable model for identifying those features of the model that require retraining.
This paper follows the third option as the preferable methodology, in order to explore the personalization potential of federated learning for each user. Thus, only the necessary characteristics of the model are retrained, based on the respective needs and the events that it is called to face.
The methodology of the federated learning technique, has been of great interest to the research community. In this section related work will be presented.
For example, in [11] it is presented a comprehensive study with an experimental analysis of federated deep learning approaches for cyber security in IoT applications. Specifically, it is provided an exploratory analysis of federated learning model with three deep learning approaches, namely, Recurrent Neural Network (RNN), Convolutional Neural Network (CNN), and Deep Feedforward Neural Network (DNN). For each deep learning model, the performance of centralized and federated learning under three real IoT traffic datasets is studied. Furthermore, the article aims to provide important information on federated deep learning approaches with emerging technologies for cyber security. In addition, it demonstrates that federated deep learning approaches outperform the classic/centralized versions of machine learning (non-federated learning) in assuring the privacy of IoT device data and providing higher accuracy in detecting attacks.
However, since adversaries can track and derive participants’ privacy from the shared gradients, federated learning is still exposed to various security and privacy threats. In [21], the authors consider two major issues in the training process over deep neural networks: 1) how to protect user’s privacy (i.e., local gradients) in the training process and 2) how to verify the integrity (or correctness) of the aggregated results returned from the server. Several approaches focusing on secure or privacy-preserving federated learning have been proposed and applied in diverse scenarios to solve the above problems. However, it is still an open problem enabling clients to verify whether the cloud server is operating correctly while guaranteeing users’ privacy in the training process. Therefore, a model named VerifyNet is proposed which is a privacy-preserving and verifiable federated learning framework. Specifically, the authors presented a double-masking protocol to guarantee the confidentiality of users’ local gradients during the federated learning. Then, a cloud server is required to provide proof about the correctness of its aggregated results to each user. Also, it is claimed that it is impossible that an adversary can deceive users by forging evidence unless it can solve the NP-hard problem adopted in their model. In addition, VerifyNet is also supportive of users dropping out during the training process. The extensive experiments conducted on real-world data also demonstrate the functional performance of the proposed scheme.
Due to lacking effective incentives and trust, data from different operators cannot be shared directly. In [22], the authors proposed an approach on blockchain-based federated learning for implementing asynchrono-us collaborative machine learning between distributed agents that own data. This method performs distributed machine learning without a trusted central server. The blockchain smart contract is used to realize the management of the entire federated learning. Using the historical data collected from real systems, the learning agent in the federated learning method adopts a support vector machine (SVM) based, intelligent control model. The authors optimize classic SVM, by assigning different penalty factors to the majority and minority classes to deal with the imbalanced data. The data sets are mapped to a high dimension using kernel functions to make it linearly separable. Also, they construct a mixing kernel function composed of polynomial and radial basis function (RBF) kernel functions, which uses a dynamic weight factor to improve the model accuracy. The simulation results demonstrate the efficiency and accuracy of their proposed intelligent control method.
On the other hand, because the outcomes of attack detection are critical to cybersecurity, every decision should be supported by compelling arguments. Deep learning methods can extract valuable features directly from original data. However, this model is complex and considered a “black box,” resulting in low model interpretability. As a result, interpretability has become a bottleneck for deep learning methods used in attack detection. The authors of [23] proposed a deep learning method that can be interpreted based on spatial domain attention. The model can detect and locate feature strings in packets, providing a meaningful semantic explanation for the detection results. The authors conducted qualitative and quantitative experiments on the following datasets DARPA1998, UNSW-NB15, and CIC-IDS-2017. The experimental results show that our method’s interpretability outperforms state-of-the-art interpretable models in quantifiable criteria while retaining comparable classification accuracy.
In addition, to balance Transient Stability Assessment (TSA) accuracy and transparency, this paper [24] proposes an interpretable DL-based TSA model. The proposed method combines a deep neural network’s strong nonlinear modeling capability with the interpretability of a Decision Tree (DT). The proposed interpretable DL-based TSA method can visually explain the TSA decision-making process by regularizing the DL-based model with the average DT path length during the training process. The simulation results show that the proposed method can produce highly accurate TSA results and interpretable TSA decision-making rules, which can be used to design preventive control actions.
Finally, the feed forward (FF) designed convolutional neural network (FF-CNN) is a network that can be interpreted. The model’s parameter training does not necessitate backpropagation (BP) or Stochastic Gradient Descent optimization algorithms (SGD). The entire network is built on the previous layer’s statistical data, and the current layer’s parameters are obtained in a single pass. Because FF design reduces network complexity compared to the BP algorithm, FF-CNN outperforms the BP training method in semi-supervised learning, ensemble learning, and continuous subspace learning. However, the FF-CNN training process or model release results in leakage of training data privacy. The authors of this paper [25] analyze and demonstrate that an attacker can obtain the private information of the original training data after mastering the FF-CNN training parameters and partial output responses. As a result, training in data privacy protection is critical. However, because of the unique characteristics of the FF-CNN,existing deep learning privacy protection technology is inapplicable. To protect the training data in FF-CNN, the authors are proposing a differential privacy subspace approximation technique with adjusted bias (DPSaab). They design the privacy budget allocation based on the ratio of the eigenvalues and allocate a larger privacy budget to the filter with a significant contribution, and vice versa, based on the different contributions of the model filters to the output response. Extensive experiments on MNIST, Fashion-MNIST and CIFAR-10 datasets show that the DPSaab algorithm outperforms existing privacy protection technologies in terms of utility.
Methodology
The proposed methodology uses Shapley Values [26, 27] to generate global and local interpretabilities capable of explaining why the model reaches a specific decision. Respectively, it can detect how the Lipschitz Constant [28, 29] evolves during the training of the individual characteristics of the intelligent model, in order to evaluate the methodology [30, 31].
Thus, by combining these two methods, a completely transparent model is realized, capable to reveal the following [32]:
a) the actual source of the data; b) the implemented training strategy; c) the type of the employed intelligent model; d) the hyperparameters used for the training and testing data sets; e) the features introduced to the model and the analysis of obvious and hidden existing correlations; f) the characteristics of the model with the highest predictability; g) the influence of each characteristic on the final prediction in both training and testing and in the accurate measurement of the model’s performance by evaluating unknown data [33, 34, 35].
Shapley values
A thorough approach using the Global and Local Interpretability methodology was performed to obtain a holistic picture of the network, in terms of how it makes decisions, what are its most important features, and what interactions are taking place between the features in this methodology [36].
Global interpretability provides an overview of the model, while Local interpretability focuses on explanations from a small data area, which analyzes a single instance of the data set and explains why the model has reached a specific decision. This is because in small areas of data, the prediction may depend only linearly or monotonously on certain features of the model, rather than having a more complex dependence on them. Thus, the global and local interpretabilities of the model’s features could be identified. Moreover, this could determine the parameters that would be part of the local or the global model [37].
Shapley values are a very effective way of generating explanations on how a model works. Its mathematical background comes from the Cooperative/Coalitional Game Theory, where the payoff/gain of a cooperative game’s players, is realized by a real function which gives values to sets of players [26].
Specifically, the problem of a neural network’s architectural structures is considered as a cooperative game, whose players are the characteristics of the data set, the profit function is the NN’ model under consideration, and the predictions are the corresponding winnings [38, 39].
In this content, the Shapley values show the contribution of each feature and therefore the explanation why the model made a specific decision.
More specifically, the Shapley value of a NN’ characteristic
where
More specifically:
The Shapley method uses the linear correlation of the independent and dependent variables which is measured by calculating the Pearson R correlation table. The proposed architecture, is considering the inability of the Pearson’s method to detect nonlinear correlations such as sinus wave, quadratic curve. It uses the Predictive Power Score (PPS) technique to summarize the predictive data between available forecasts [40]. More specifically, it explains how variable A informs variable B, more than variable B informs variable A. Technically, scoring is a measurement in the interval [0, 1] of a model’s success in predicting a variable target with the help of an off-sample variable prediction. This practically means that this method can increase the efficiency and transparency of finding hidden patterns in the data, and thus it can facilitate the selection of appropriate prediction variables [41]. The use of the PPS method also focuses on the fact that a local explanation of the model’s parameters must be obtained. As a result, this data should be ultimately capable of operating without retraining and of course without being reinforced in the second phase of training. For the calculation of PPS in numerical variables the metric of Mean Absolute Error (MAE) was used, which is the measure used for the quantification of the error between the estimated and the observed values. It is calculated by the following formula [17]:
where
Moreover, the
Lipschitz Constant (LIPC) [28] was used to evaluate and confirm the final efficiency of the local model, that was obtained by the application of the Shapley methodology. Using LIPC the behavior of the Scattering Transformation can be studied, when a set with similar inputs are entered as inputs. This transformation can approach the operation of a simple neural network architecture, allowing the study of how neural networks succeed in solving difficult problems that require multistage extraction of features [42, 43]. At the same time, the properties of this transformation can explain the way in which a neural network can achieve immutability in the displacement of the input, as well as in small deformations of the input, as in cases of elastic deformation [29].
Specifically, new inputs are generated, when we add at the input h a very small change
It turns out that the output for a new variable input is no different from the original input more than
This means, that the
As the Lipschitz constant determines the classifier’s ability to correspond to new inputs, it is proposed its use in order to detect how this constant evolves during the training of a neural network’s local parameters [32]. In particular, let the input of a Convolutional Neural Network (CNN) be in the form of a vector. Let
Let
where
Let
Let
The output
where
Using the above equations, the constant
The constant is defined recursively, as
Convolution layer:
Pooling layer:
ReLU function:
If the network has
Having developed the method for finding a ipschitz constant for the network, this research studied how it evolves during the training of a NN.
The following layers were included:
Embedding layer with hyperparameters that indicate the dimensions of the emerging integrations. Dropout layer with hyperparameters indicating the dropout rate. 1D Convolution layer with hyperparameters’ filters and kernel size that define the number of the output channels and the width of the 1D core respectively. bi-LSTM layer Dense layer with two outputs and Sigmoid activation function.
This network is characterized by its simplicity, as it uses 1D Convolution and a bi-LSTM layer that are stacked one after the other, in scalable depth. Overall, the hyperparameters of the model are presented below:
embedding_size dropout filters kernel_size pool_size lstm_output_size batch_size
The network comprises of 5 layers with two different outputs in the last layer, one for each class, namely: Distributed Denial of Service (DDoS), and Benign. The average value of the constants
Architectural modeling of the federated learning partners.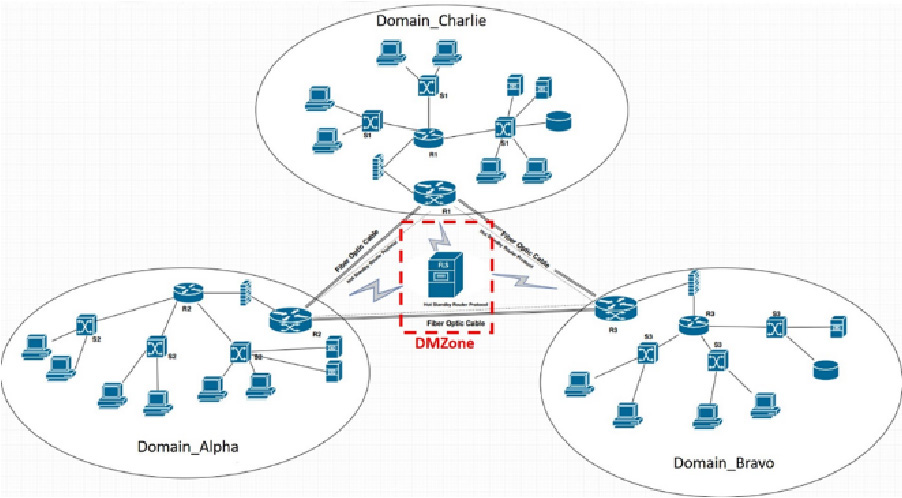
Following the experimental validation of the proposed method, the network was trained using 70% of the available data vectors [46, 47]. At the end of each training season, the constant
A collaborative network of three federated partners namely: domain_alpha, domain_bravo and domain_charlie that communicate with each other through optical fibers, was simulated in order to implement the Federated Learning (FEL) scenario. The FEL Server (FLS) is located in the Demilitarized Zone (DMZone).Its task is to initiate model’s training, with some initial data and to apply the algorithmic process of aggregating the optimal models and selecting the weighted average, via the Dynamic Weighted Average method [2, 5, 6, 9, 32]. The overall architecture is presented in Fig. 6.
The interconnected heterogeneous industrial systems of specialized mechanical equipment exchange huge amounts of data in the unit of time. The analysis, and classification of data traffic, is one of the most serious tasks for the monitoring of large-scale attacks, as well as for the study of cybercrime [13, 16].
The substantive evaluation of the proposed intelligent system was carried out on the CICDDoS2019 [50], which is one of the most comprehensive web traffic analysis datasets, developed under the supervision of the Canadian Institute for Cybersecurity, with an emphasis on DDoS attacks’ detection. The DDoS are very well-organized types of attacks in which the identity of the attacker, remains hidden using the legitimate component of a third party [51].
The set includes modern DDoS attacks, which have been detected in real incidents, and have been identified based on attack indicators. Specifically, the web traffic packages included in this dataset are sent to the reflector servers by intruders with source IP address set to target victim IP address, in order to crush the victim’s system with response packets.
A parallel coordinates plot developed in the training process (Appendix 1).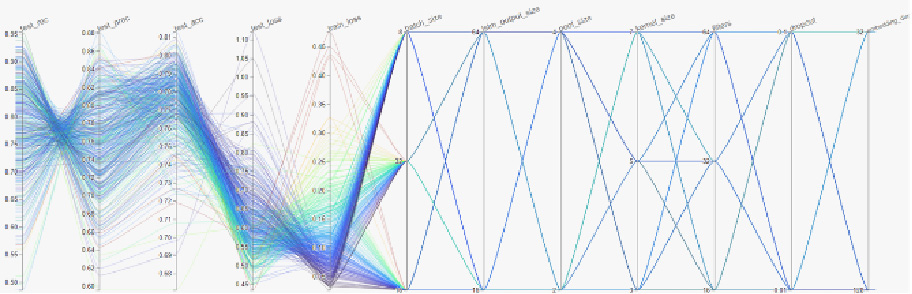
A parallel coordinates’ plot from global interpretabilities.
The attacks are performed through the application layer using transport layer protocols. The malware spectrum includes: TCP-based (Transfer Control Protocol) attacks such as MSSQL, SSDP, UDP-based (User Datagram Protocol) attacks such as CharGen, NTP, and TFTP, and more complex ones, that can be performed either with TCP or with UDP, such as DNS (Domain Name Server), LDAP (Lightweight Directory Access Protocol), NETBIOS (Network Basic Input/Output System) and SNMP (Simple Network Management Protocol). Moreover, there are TCP based attacks (e.g., MSSQL, SSDP) UDP based ones (e.g., CharGen, NTP and TFTP). More complicated attacks can be executed either via TCP or via UDP, e.g., DNS, LDAP, NETBIOS and SNMP.
There are also UDP flood attacks, where UDP packets are sent at a very high rate to random ports on the victim’s system, resulting in depleted network bandwidth, degraded performance, and system crashes.
SYN (short for Synchronization) flood attacks constitute a serious threat, where attackers are forcing the victim’s system to consume server resources continuously, until it malfunctions or crashes. This is achieved by sending repetitive SYN packets misusing the TCP-three-way handshake. Finally, the set includes UDP-Lag attacks that disrupt the connection between clients and servers using hardware resources or a software program that runs on the network and uses other users’ bandwidth. More details can be found at [51].
After data preprocessing, the dataset comprised of 66 features, 11,856,972 instances and 2 classes namely Distributed Denial of Service (DDoS) and Benign. Initially, during the training process an attempt was made to interpret the data in their original raw form. Specifically, the diagram of parallel coordinates was employed, to represent the dimensions of the features by parallel axes, one per dimension. Thus, each multivariate point is modeled as a polyline that connects the corresponding dimensions. At the same time, this diagram encodes the correlation between the data dimensions, so that the line intersections indicate inverse correlations. The following figure present a graph of parallel coordinates during training.
Summary beeswarm plot.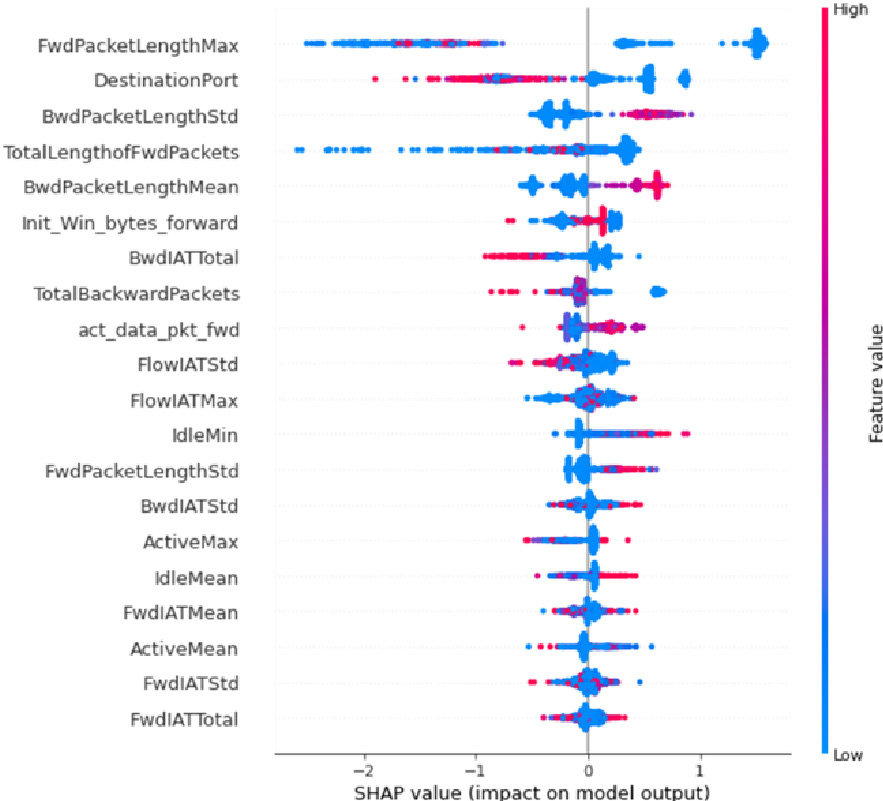
Extensive tests were performed with data batches, the size of which varied, to identify local interpretabilities. Local interpretabilities provide explanations that come from a small data area, which analyzes a relatively small batch of data and explains why the model made a specific decision for that particular batch [52]. This is due to the fact that in small areas of data, the prediction may depend only linearly or monotonously on certain features of the model, rather than having a more complex dependence on them [20]. Thus, in this way the global and local interpretabilities of the model’s characteristics can be identified. Also, the parameters of the local model can be distinguished from the ones of the global [53]. An example of a graph of parallel coordinates during the detection of global interpretabilities, is shown in the Fig. 8.
Unfortunately, there isn’t another comparable model to use as a benchmark. Consequently, to avoid bias or incorrect impressions, we present the performance of the proposed model without making any comparisons with any other alternative models. The evaluation of the values of the variables in the way they contribute to the prediction and the explanation of each decision of the global interpretabilities, were carried out, using the Shapley values. Figure 9 shows the classification of the records, used in a summary beeswarm plot which is a simple way to capture the relative effect of all the features on the whole data set. Attributes are sorted based on the sum of Shapley values in all samples in the set.
A parallel coordinates plot from local interpretabilities.
Explanation of a single prediction-10 evaluations.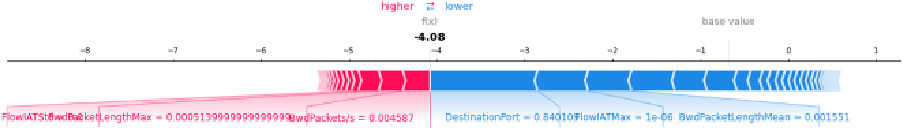
The most important features of the model are shown from top to bottom. Each attribute of the set is symbolized by dots, while the color of the dot symbolizes the value of the attribute (blue corresponds to a low value, while red to a high value). The position of the dot on the horizontal axis depends on its Shapley value.
Partial dependence plot.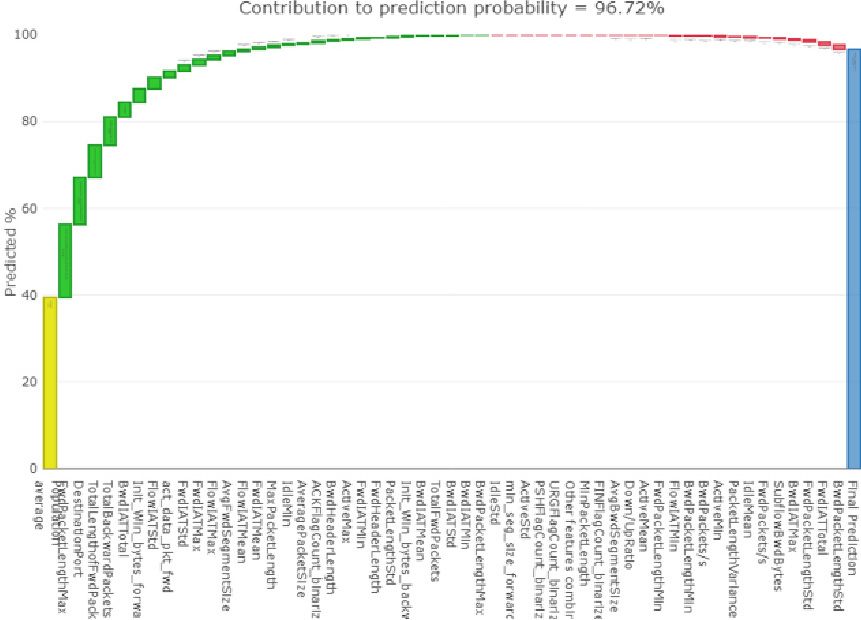

Performance evaluation of federated partner domain_charlie_I.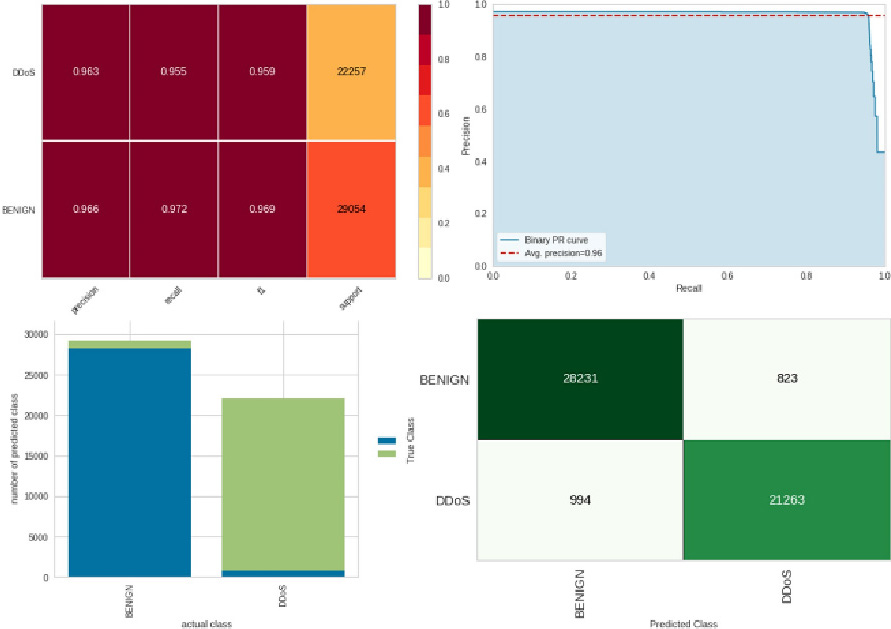
Performance evaluation of federated partner domain_charlie_II.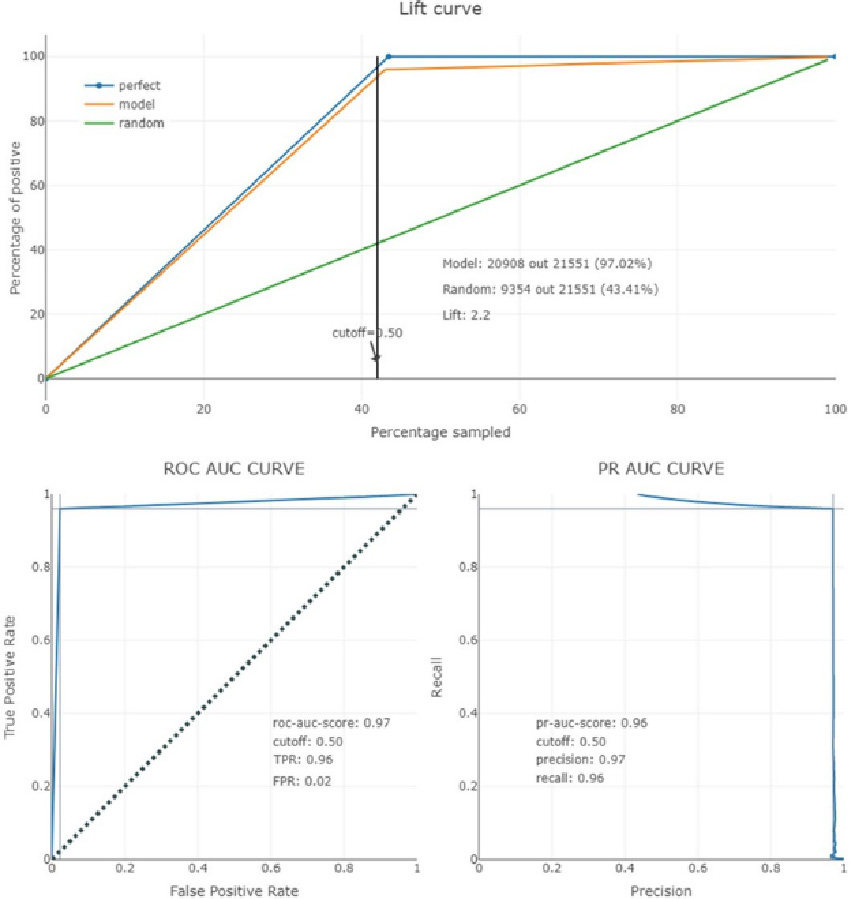
It is clear that the attribute FwdPacketLengthMax has the most important contribution for the determination of the model’s forecasts. The Shapley price is also high for its high values (red dots), so it has a great positive effect globally. In contrast, for low values (blue dots) the Shapley value is low, so it has a negative effect on the forecast, i.e. it increases the probability that the global model is not affected [54].
An example of a graph of parallel coordinates during local interpretability detection is shown in Fig. 10.
Figure 11, is using a chosen sample from the dataset, in order to represent the typical values of the attributes. Then, ten samples are used to estimate the Shapley values for a given prediction. This experiment, requires
This figure shows a local explanation, where the base_value refers to the average value of the model’s forecasts, (i.e., in this case the model predicts that the batch of data being analyzed does not affect the local model with a probability of 7%). For this package, the forecast price is 95.92%, so the Shapley prices show the change from the average forecast to the specific forecast. The red arrows push the prediction to the right, that is, they help to increase the probability that the local model will be affected in the specific batch of data, while the blue arrows push to the left, helping to reduce the corresponding probability.
The length of each arrow symbolizes the magnitude of the respective effect on the prediction.
After the global and local interpretabilities were identified, Partial Dependence Plots (PDPs) were used to confirm the process, showing the marginal effect that each characteristic has on the predicted result of the model. A typical example of the process is shown in Fig. 12.
The number of input features of interest must be limited (usually to one or two in order to accommodate the limitations of human perception); As a result, the input features of interest are typically selected among the essential features. Figure 13 depicts a one-way partial dependence plot for the dataset under consideration.
One-way dependence plots provide information about the interaction between the target response of a particular input and a feature of interest (e.g., linear, non-linear). The contribution to the prediction probability is depicted in the above figure. When the average prediction accuracy is 96.7%, we can see a linear relationship. In a similar manner, we could investigate the impact of various dataset parameters. As a result, these interpretations are marginal, considering each feature one at a time.
Finally, the results of
The
The
Respectively, the results of the federated partner of domain_charlie are presented in the Figs 14 and 15.
Each figure is a summary of prediction results on the classification problem. The correct and incorrect predictions are summarized with count values and they are broken down by each class.
Furthermore, the precision for each class is the number of true positives (i.e., the number of items correctly labeled as belonging to the positive class) divided by the total number of elements labeled as belonging to the positive class (i.e., the sum of true positives and false positives, which are items incorrectly labeled as belonging to the class). Furthermore, in this context, recall is defined as the number of true positives divided by the total number of elements that belong to the positive class (i.e., the sum of true positives and false negatives, which are items that were not labeled as belonging to the positive class but should have been).
In this work a novel hybrid explainable semi-personalized federated learning model was proposed, utilizing the Shapley Values and Lipschitz Constant techniques to create personalized intelligent local models. This is achieved based on the needs and events that each user is required to address locally. In particular, the system in question provides clear explanations as to why the model made a specific decision on locally handled data. Then, it detects how the training of the intelligent model evolves, by dictating the hyperparameters that should be trained locally. This results in a model that responds optimally to the local problems it is called to face.
This cutting-edge research proposal has never been proposed before in the relevant literature, and we believe that it has the potential to considerably extend the state-of-the-art in the field of explainable artificial intelligence.
As demonstrated experimentally with this technique, an understanding is gained of how the model makes decisions and what interactions are performed between the features used, in order to achieve correct or incorrect classification. The model provide information about the interaction between the target response of a particular input and a feature of interest. Respectively, it allows for the personalization of the federated learning model for each user, so that only the necessary characteristics of the model are retrained, based on the respective needs and the events that it is called to respond. Thus, it offers the ability to manage, control and explain how to handle multiple intermediate representations, as well as more advanced features that may be related to the hierarchical organization of a neural system.
The progressive classification and investigation of the intermediates of the input data along the levels of the hierarchical architecture, even if all the levels share the same weight values, creates clear indications – evidence of how the final decision is made. The combination of Lipschitz and Shapley clearly captures the transitions of internal representations of input signals, even for problems that require long internal memory intervals. The proposed system achieves a result with high accuracy with a white-box algorithm that is interpretable in itself. This is especially important in domains like medicine, defense, finance, and law where it is crucial to understand the decisions and build up trust in the algorithms.
This uniqueness methodology focuses mainly on the development of an automated optimization of the appropriate parameters, so that an even more efficient, accurate and faster explanation process is achieved, in a simple and robust way. Additionally, this paper proposes the utilization of the introduced hybrid technology [55] in recommendation systems, in a completely clear and transparent way. Finally, it would be important to study in the future, the expansion of this system for the implementation of a real-time data flow control framework.