
Abstract
The 3D point cloud deep neural network (3D DNN) has achieved remarkable success, but its black-box nature hinders its application in many safety-critical domains. The saliency map technique is a key method to look inside the black-box and determine where a 3D DNN focuses when recognizing a point cloud. Existing point-wise point cloud saliency methods are proposed to illustrate the point-wise saliency for a given 3D DNN. However, the above critical points are alternative and unreliable. The findings are grounded on our experimental results which show that a point becomes critical because it is responsible for representing one specific local structure. However, one local structure does not have to be represented by some specific points, conversely. As a result, discussing the saliency of the local structure (named patch-wise saliency) represented by critical points is more meaningful than discussing the saliency of some specific points. Based on the above motivations, this paper designs a black-box algorithm to generate patch-wise saliency map for point clouds. Our basic idea is to design the Mask Building-Dropping process, which adaptively matches the size of important/unimportant patches by clustering points with close saliency. Experimental results on several typical 3D DNNs show that our patch-wise saliency algorithm can provide better visual guidance, and can detect where a 3D DNN is focusing more efficiently than a point-wise saliency map. Finally, we apply our patch-wise saliency map to adversarial attacks and backdoor defenses. The results show that the improvement is significant.
Introduction
The rapid development of virtual reality (VR), augmented reality (AR) and self-driving all require the construction of 3D scenes [1, 2, 3, 4, 5, 6, 7]. Point clouds are the most efficient way to represent 3D data since they are close to the raw sensor data [8, 9, 10, 11, 12]. To process the point cloud efficiently, many industry domains try to understand point clouds using Deep Neural Network (DNN). However, the point cloud cannot be directly consumed by typical DNN designed for 2D images due to its unordered points. To compromise the data structure, point clouds were rasterized [13, 14, 15] or projected [16, 17, 18]. However, the data transformation will inevitably causes shape disturbances. PointNet [19] is the pioneering deep model to directly process point clouds. It learns a spatial encoding of each point and then aggregates all individual point features to a global point cloud signature. Following PointNet, many 3D DNNs were proposed successively including PointNet
Visualization of our proposed patch-wise saliency map, along with critical point set theory [19] and point-wise saliency map [20]. Red means the point is important, and blue means unimportant, for specific 3D DNN making its decision. The patch-wise saliency map guides people to learn which region the 3D DNN focuses on and gathers more importance/unimportance using the same number of points. 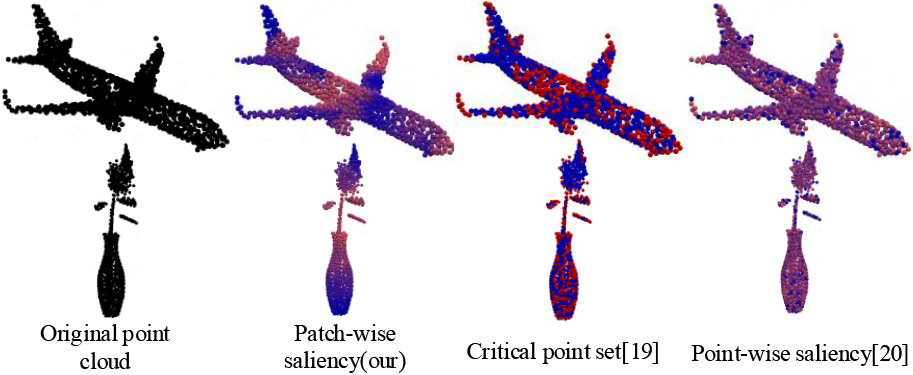
To discuss the reliability of the point-wise saliency map, we drop the detected critical points and find this makes some of the remaining non-critical points become critical. Meanwhile, the topological structure and 3D DNN output change slightly. Therefore, we argue that the 3D DNN judges a point cloud mainly according to its structure (represented by the critical points) instead of some specific points. The finding suggests that critical points are alternative (replaceable) and unreliable. As a result, we believe that it is more meaningful to discuss local structure-wise (named patch-wise) importance than point-wise importance. 
However, the black-box character of DNNs prevents them from being applied in many safety-critical domains such as self-driving, 3D face recognition and augmented reality [24, 25, 26, 27, 28, 29, 30, 31, 32, 33, 34]. The saliency map technique (shown as Fig. 1) is a remarkable way to explain the black-box. It aims to visualize the importance of an input data. The generated saliency map provides an efficient guidance for point cloud feature selection [35, 36] and compression [37, 38]. In the image domain, many saliency map algorithms have been proposed [39, 40, 41, 42, 43, 44]. In this way, people are able to understand how a DNN deals with an image to a great extent. However, due to the discrimination between images and point clouds, few saliency techniques designed for images can deal with point clouds. Therefore, it is urgent to exploit a new method to explain how 3D DNN consumes a point cloud.
We recall the critical point sets theory in PointNet [19], which describes that the output will change if and only if the critical points are moved. The theory suggests that one 3D DNN only focuses on a subset points of the point cloud when making its decision. Recently, a few works [45, 46, 20] have been proposed to refine the theory and assign importance to every point based on the gradient information. As a typical and representative work, Zheng et al. [20] obtains the saliency score of each point by calculating the gradient under spherical coordinate. We refer the method designed by Zheng et al. [20] as point-saliency in this paper. In sum, these works all aim to evaluate point-wise saliency.
To discuss the reliability of point-wise saliency, we drop the critical points and observe the change in the non-critical points. The result in Fig. 2 shows that once critical points are moved, the non-critical points adjacent to them will be exposed and replaced as the new critical points. Therefore, we argue that (Motivation:) a point becomes critical because it is responsible for representing one specific local structure. However, conversely, one local structure does not have to be represented by some specific points. Meanwhile, the non-critical points are not useless. They are just obscured by the critical points to express information (topological structure). Therefore, we argue that the local structure is more important than individual points for the 3D DNN recognizing a point cloud. In addition, the critical points indicated by point-wise saliency [19, 45, 46, 20] are alternative (replaceable) and unreliable. Furthermore, for solid evaluation, we randomly drop several points from the point cloud and observe the 3D DNN output. The results suggest that the probability change is less than 3% as long as the global structure is preserved.
In addition, in many 3D engineering tasks such as self-driving, objects are frequently blocked [47, 48, 49, 50, 51]. In this way, the obtained point clouds are usually incomplete and missing patches. Thus, it is critical to research the patch-wise importance of point clouds for 3D DNN applications.
Furthermore, existing point-wise point cloud saliency methods assign saliency score based on the structure of 3D DNNs. However, the specific information of 3D DNNs is usually hidden in most engineering senses. Therefore, designing a saliency method under the black-box setting is urgent.
The above several analyses suggest that (a) the critical points indicated by point-wise saliency are service for local structure, (b) 3D DNN recognizes a point cloud according to its local/global structure instead of some specific points, and (c) studying patch-wise saliency under the black-box setting is critical for 3D DNN applications. Therefore, we argue that it is more meaningful to discuss which patch of the topological structure is important rather than specific points.
Based on the above motivations, this paper aims to design a method to generate a patch-wise saliency map under the black-box setting. In detail, one way to evaluate the importance of points is to drop them, and observe the probability change. In this paper, we drop points in patches instead of individual points [45, 46, 20]. However, segmenting point clouds in patches is a tricky problem since important/unimportant patches usually have different sizes and we have no priori knowledge. Our idea is to design a Mask Building-Dropping process to adaptively match the patch size. In the experiment, we compare the patch-wise saliency algorithm with the point-wise saliency algorithm [20] on typical 3D DNNs. The experimental results suggest that our patch-wise saliency algorithm is able to find the important/unimportant regions more efficiently in most cases. Finally, we apply our patch-wise saliency map to adversarial attacks and backdoor defenses, and achieve significant improvement. In addition, from the aspect of resolution for sensitivity analysis, our patch-wise saliency map has a lower resolution than the point-wise saliency map. However, this has a slight impact on its performance, as shown in the experimental results.
In sum, we analyse the related works in Section 2. Then, the proposed patch-wise saliency map is illustrated in Section 3. The conducted experiments are exhibited in Section 4. Moreover, we apply the proposed method to adversarial attacks and backdoor defenses, as shown in Section 5. Finally, we conclude our work and provide suggestions for future works in Section 6. Our main contributions are as follows:
We reveal that critical points indicated by current point-wise saliency maps are mainly service for local structures. Therefore, discussing saliency of local structure (patch of point cloud) is more meaningful. A black-box algorithm for generating a patch-wise point cloud saliency map is proposed to help us determine where a 3D DNN mainly focuses when making its decision. Existing adversarial attacks and backdoor defenses are improved by combining the proposed saliency technique. Meanwhile, we find that the saliency patch provides key dimensions to cross the decision boundary. Our research is practical. The obtained point clouds in engineering scenarios are usually incomplete and missing patches. Therefore, determining the important/unimportant patches is meaningful for practical 3D DNNs application.
Image saliency map
In the image domain, a saliency map is used to characterize the contribution of each pixel value to the recognition result [52, 53]. According to different ways to process input images, saliency algorithms can be classified as CAM-based [40, 54, 55, 56, 57], back propagation-based [41, 58, 59] and perturbation-based [42, 60, 61, 62]. However, due to data restrictions, existing saliency map techniques cannot be directly used to analyse point clouds.
Point-wise point cloud saliency map
To date, a few works have been designed to build saliency map for point clouds, which all focus on point-wise saliency. According to the situation of DNN, they can be classified as DNN-specific [45, 46, 20] or DNN-agnostic [63, 64]. In detail, DNN-agnostic saliency methods explore the saliency of each point based on the point cloud geometric information. They cannot show the characteristics of DNNs and are not the area on which this paper focuses.
DNN-specific saliency techniques aim to explore which points the DNN focuses when making its decision. Zheng et al. [20] propose a representative method that obtains saliency scores by calculating gradients under spherical coordinates. Following it, Liang et al. [46] utilize the non-contributing factors to design point cloud saliency map. Without utilizing gradient information, Souai et al. [45] generate a point cloud saliency map by designing a deep learning model.
As the typical and representative work to obtain point-wise saliency, we introduce the work from Zheng et al. [20] in detail. The authors consider dropping a point to be similar to moving it to the centre of the point cloud. After that, the loss change is calculated by moving a point to the centre. Specifically, shifting a point towards the centre by a constant
where
Zheng et al. [20] regard the loss variation as a point’s score after dropping it by calculating the gradient under a spherical coordinate system, which imitates the method in the image field. It is the refinement of concept critical point sets from [19]. In this paper, we focus on characterizing the contribution of each patch instead of specified points.
The formal description of 3D DNN is as follows. A 3D point cloud
Then, we define the saliency map technique as follows. Given a point cloud
where
One way to evaluate the saliency of a point is to drop it, and observe the probability change. Therefore, we drop points in patches and record the probability change to evaluate the saliency score. However, there is a key issue of how to segment patches on point clouds. Since important/unimportant patches usually have different sizes, hard segmentation will separate them and fail to score them. Our idea is to newly build patch masks for various segmentation schemes in one evaluation. For one unique built patch mask, points are assigned different states in patch. Then, we drop each patch according to the built mask and assign the probability change to every point of it. After repeating Mask Building-Dropping for
The outline to generate patch-wise point cloud saliency map. The inputs include a original point cloud and a well-trained 3D DNN. The output is a patch-wise saliency map that indicate where the 3D DNN focuses on the point cloud. Specifically, different colour schemes of patch masks lead to different patch dropping schemes, which have no semantic information. By repeating Mask Building-Dropping for 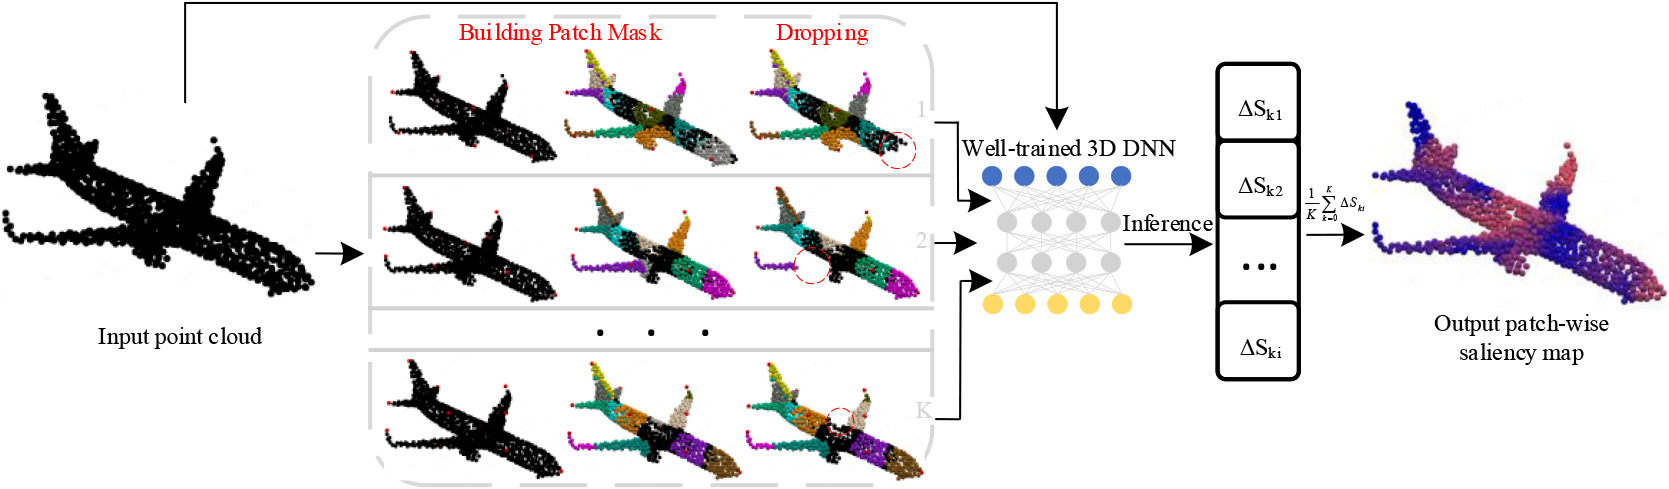
Building Patch Mask
Different from the previous binary mask
State variation
Aiming at assembling points in patch, we want the points with the same state to be as close as possible. Therefore, we allocate state
where
We have now assigned a value to patch mask
Dropping
We define the dropping process as
where
The point cloud after dropping the m-th patch is represented by
Here,
Note that the patches and their scores obtained here are not the final ones. Our method repeats the Mask Building-Dropping process
where
Otherwise, a points may be ignored by every patch or included by multiple patches in a built mask. We assign zero score to former and average score to latter.
We conduct experiments to verify the performance of our patch-wise saliency map quantitatively and qualitatively on several benchmarks.
Experimental setting
Datasets and 3D DNNs
We choose ModelNet40 [14] and 3D Mnist as the datasets. This is because they are standard datasets used to evaluate the performance of point cloud classification and segmentation, which is convenient for evaluating the saliency map techniques. In detail, ModelNet40 includes 12,311 objects from 40 categories, where 9,843 are used for training and the other 2,468 for testing. 3D Mnist includes 6000 3D handwritten digits from 10 categories, where 5,000 are used for training and 1,000 for testing. Similar to PointNet [19], we uniformly sample 1,024 points from the surface of each object and re-scale them into a unit cube. The selected 3D DNNs are PointNet [19], DGCNN [65] and RSCNN [23], which are typical models for point clouds. Many follow-up networks [66, 67, 22] are based on them. Therefore, the experimental results conducted on them are convincing.
Comparison Baseline
Although there are a few works [45, 46, 20] studying saliency maps of point clouds, they are similar and all focus on point-wise saliency using model gradients. We select the typical and representative work [20] as the compared baseline. Despite it is not the most recent method, its advantages over other algorithms [45, 46] include higher performance, higher citation number, and credibility. We call it [20] point-saliency for ease of reading.
Implementation Details
Our algorithm is implemented using the open source code of PointNet [19], DGCNN [65] and RSCNN [23]. The training and testing processes of each 3D DNN follow the default setting. As the baseline [20], we did not consider additional operations such as ’vote’ and ’additional features’, which are tricks that could improve accuracy by approximately 1%–2%. Meanwhile, the input format is changed to enable 3D DNNs to consume point clouds with different numbers of points. The results of the point-wise saliency map [20] are obtained by running its source code. The obtained results are insignificantly biased from the original due to the different parameters of the target 3D DNN. In addition, we set the state variation
[b]
Metrics
Quantitatively
Our way to evaluate the performance of a saliency algorithms is to drop
Accuracy variation caused by point dropping according to our patch-saliency map and point-saliency map [20]. The full line represents the positive-drop. Lower accuracy means better saliency algorithm. The dotted line represents the negative-drop. Higher accuracy means better saliency algorithm. Positive-drop-patch means the results of patch-saliency map by conducting the positive-drop. In addition, ‘positive-drop-point’ means the results of point-saliency map by conducting the positive-drop. For DGCNN, results show that our patch-saliency map outperforms the point-saliency map [20] with respect to the positive-drop and the negative-drop on both ModelNet40 and 3D Mnist. 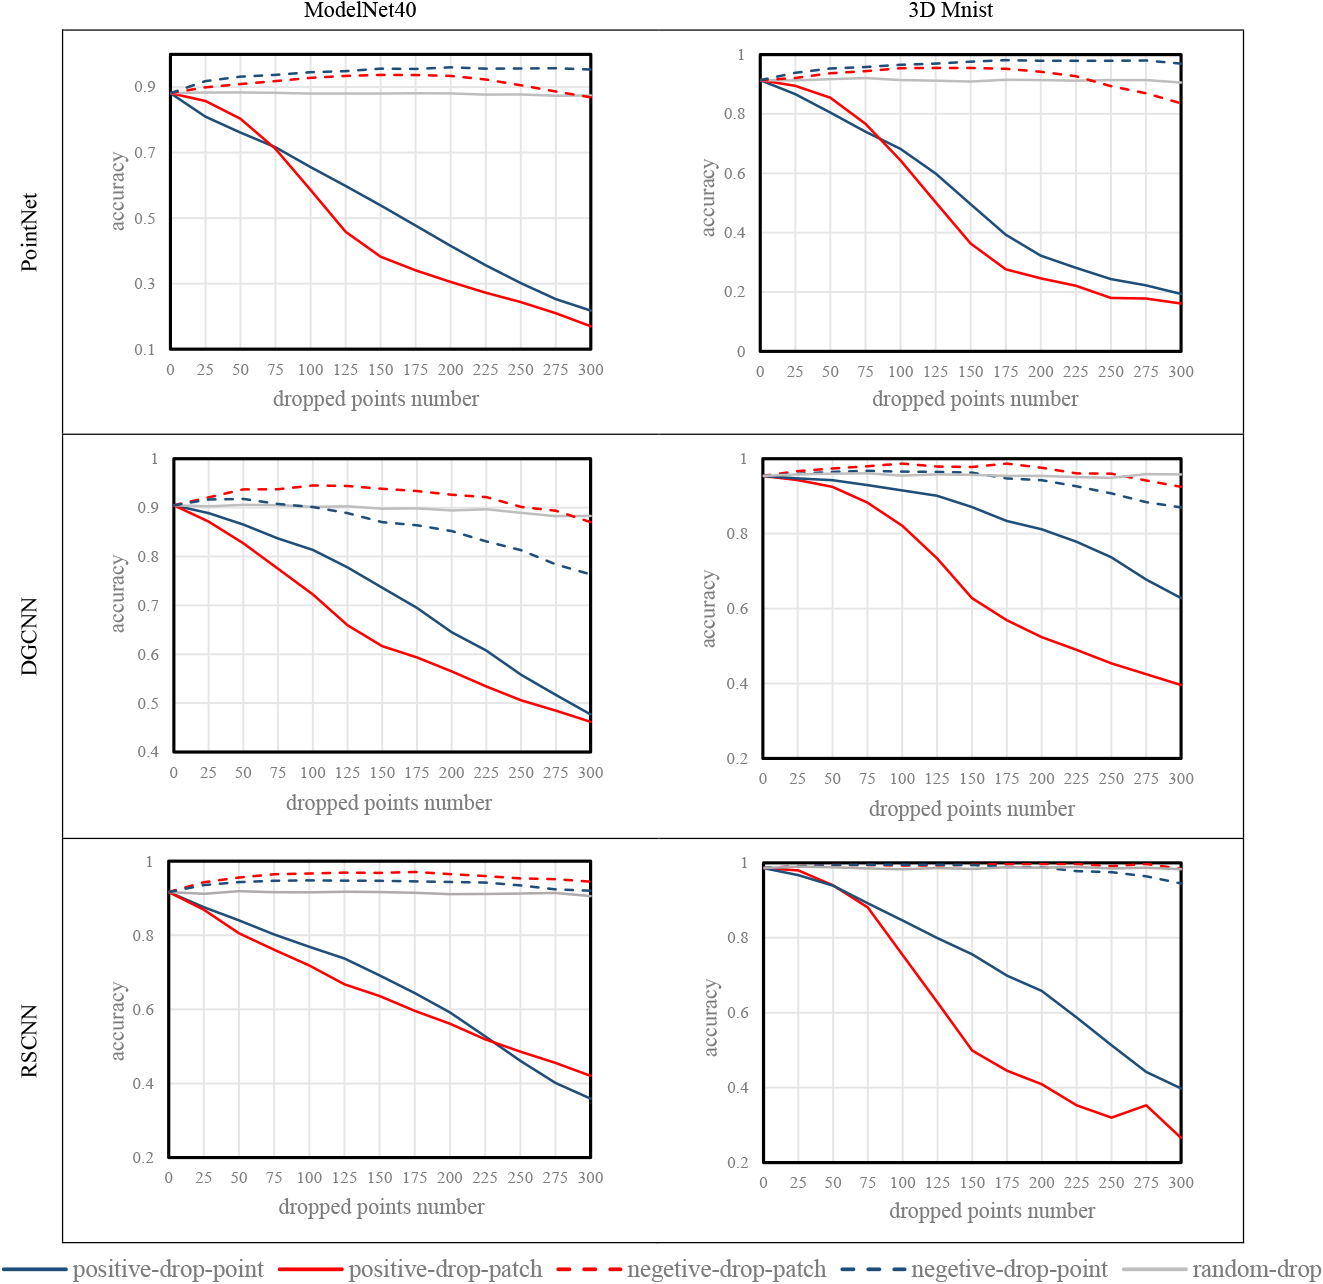
Qualitatively
Different from images, a point cloud does not have a visual background, which means that we cannot evaluate a point cloud saliency algorithm based on whether it is able to separate the object and background [41, 68]. However, each point cloud has a unique feature that is different from others. In our experiment, we qualitatively evaluate a saliency algorithm by the uniqueness it focuses.
Hyper-parameter studies of state variation 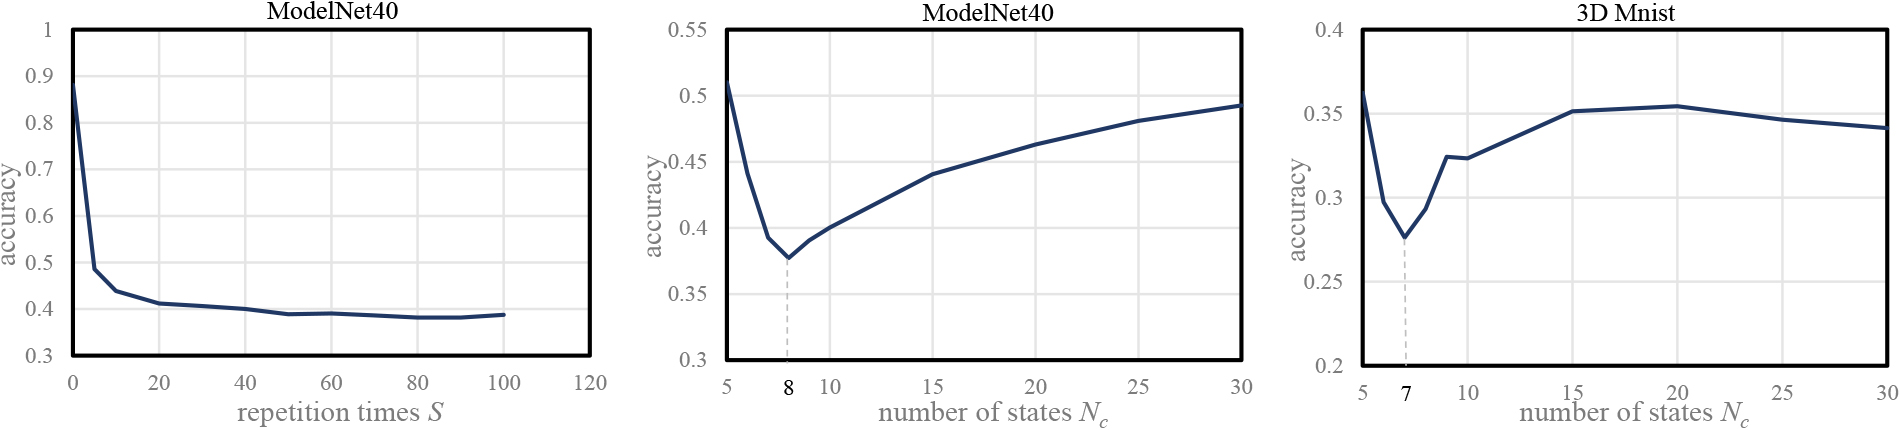
Accuracy variation
The accuracy variations of PointNet, DGCNN and RSCNN on ModelNet40 and 3D Mnist are shown in Fig. 4. We first find that the random-drop slightly reduces (approximately 1%–2%) the accuracy of the three test 3D DNNs. The reason is that the remaining points after the random-drop are still able to express the global topological structure. We then analyse the influence of positive-drop and negative-drop. Note that larger accuracy decrease caused by positive-drop and larger accuracy increase caused by negative-drop indicate a better saliency algorithm, under the same number of dropped points.
For DGCNN, our patch-saliency map always outperforms the point-saliency map with respect to the positive-drop and negative-drop regardless of whether ModelNet40 or 3D Mnist is used. For PointNet, the patch-saliency map shows better results under the positive-drop by varying the number of dropped points from 75 to 300 on the two datasets. In contrast, the point-saliency map achieves higher accuracy under the negative-drop, showing that the point-saliency map is able to detect unimportant points more efficiently on PointNet. For RSCNN under the negative-drop, the patch-saliency map is able to detect more unimportant points than the point-saliency map does at all time. In addition, under the positive-drop, patch-saliency map is the better one to illustrate which points are important when the number of dropped points varies between 25 to 225 on ModelNet40 and 50 to 300 on 3D Mnist. We suggest that the performance difference is mainly due to the structure of the 3D DNN and the built patch mask. Actually, the size of the built patch mask can be adjusted to adaptively detect point cloud features. In summary, our patch-wise saliency map is the better method to detect where a 3D DNNs does and does not focus. We argue that the reasons are as follow. Unlike point-wise saliency map, which calculates the saliency score depending on individual point, our patch-wise saliency map calculates the saliency score considering each point and its neighbors. This consideration exploits the fact that a 3D DNN recognizes one point cloud not only according to the global structure but also the local structure. Hence, our patch-wise saliency map can collect more information than the point-wise saliency map.
Hyper-Parameter Study
There are two hyper-parameters in our patch-saliency algorithm: state variation
State variation
Visualization of the patch-saliency map and point-saliency map. Our patch-wise saliency is able to guide people where the 3D DNN focuses more obviously. In detail, for easy comparison, we normalize the score. Therefore, blue points do not mean that they contribute nothing. 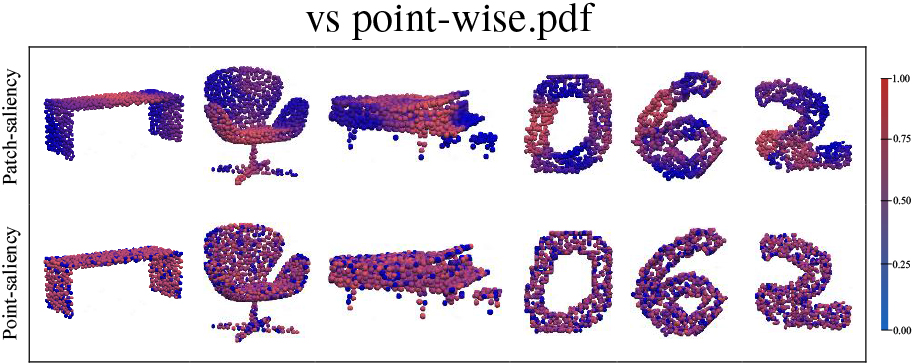
Positive-drop guides the 3D DNN to make incorrect decisions. Top are the original point clouds that the 3D DNN classifies correctly. Bottom are the point clouds after dropping high score patches that 3D DNN classifies incorrectly. 
Negative-drop guides 3D DNN to make right decision. Top are the original point clouds that 3D DNN classifies them incorrectly. Bottom are the point clouds after dropping low score patches that 3D DNN classifies them correctly. 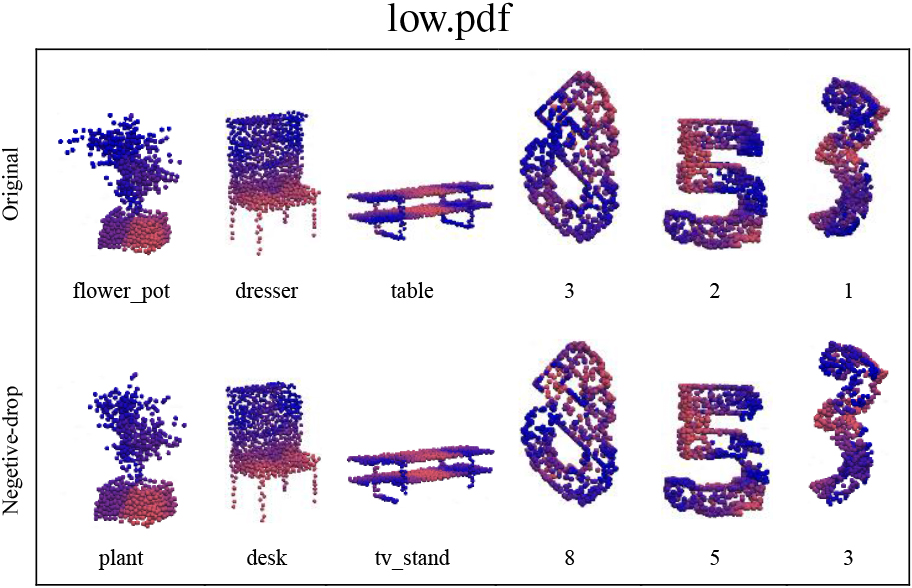
Saliency maps for different 3D DNNs. Our patch-wise saliency map highlights the disparity between different 3D DNNs more conspicuously. Specifically, our patch-wise saliency map highlights the regions (with red) that different 3D DNNs focus. In contrast, the only information expressed by point-saliency is that each 3D DNN cares about the global structure. 
Visualization
Visual guidance is an important function of the saliency map, which means that a good saliency map can directly tell people where the 3D DNN focuses. Figure 6 exhibits several point cloud saliency maps generated by patch-saliency and point-saliency algorithms. The selected 3D DNN is PointNet trained on ModelNet40. The results suggest that the information expressed by the point-wise saliency map is limited. It only shows that PointNet focuses on the global structure, since high score points scatter on the point cloud. In contrast, the information expressed by our patch-saliency is abundant. It can novelly highlight the patches that PointNet focuses. Specifically, for the object piano, we can observe that PointNet focuses more on the body rather than the chair part, which shows that the chair part is not the unique feature of piano. Once the body part (coloured red) is dropped, PointNet cannot recognize it as the piano class. In contrast, dropping the chair part only slightly influence the output of PointNet. We argue that the advantages of our patch-saliency are due to it masking various regions of the point cloud. Therefore, the points with similar saliency scores can be highlighted. In addition, the size of the final segmented patches is different, which shows that the Mask Building-Dropping process is able to resize patches adaptively.
The point clouds dropped by positive-drop and negative-drop are shown in Figs 7 and 8. The results show that dropping some high/low-score patches will change the appearance slightly, but will guide the 3D DNN to change its decision.
Saliency Maps for Different 3D DNNs
It is reasonable to say that different 3D DNNs focus on different regions of a certain point cloud. Here, we visualize the saliency maps of different 3D DNNs according to patch-saliency and point-saliency in Fig. 9. The results show that our patch-saliency is able to better reveal the disparity between different 3D DNNs. Specifically, DGCNN pays more attention to the back of the chair than PointNet. RSCNN focuses more on the body of the bottle. In contrast, DGCNN tends to care about the bottleneck. Furthermore, we find that the interested regions of RSCNN are more scattered, which means that RSCNN is likely to care about global structures rather than specific partial structures. It is an important factor that helps RSCNN achieve promising performance (93.6%) on the ModelNet40 dataset. For point-wise saliency, the information acquired is limited since the generated saliency maps from different 3D DNNs are visually similar.
Attacked test accuracy of baseline adversarial attacks and corresponding PS based adversarial attacks (lower accuracy means better attack).
Validity of Patch-wise Saliency Map
The priori knowledge is that 3D DNNs always recognize a point cloud by its global structure. Previous works [19, 20] have attempted to explain how 3D DNNs manipulate a single point. Their visual results (in Fig. 6) follow a uniform distribution on the point cloud, which is limited to the existing conclusion (uniform distribution means that 3D DNNs focus on global structure). By comparison, our patch-wise saliency map mainly explores which local regions of the global structure are important/unimportant. The results uncover the relationship between different points and the influence of local structure. This is a higher level explanation of 3D DNNs rather than contradiction between point-wise methods. Moreover, the local region we focused on has no semantic information since 3D DNNs will not segment ‘backrest’ when recognizing ‘chair’.
According to the evaluation results, the proposed patch-wise saliency map is an effective tool for looking inside a 3D DNN. This result allows us to utilize the patch-wise saliency map to promote the performance of adversarial attacks [70, 71, 72, 73, 74, 75] and backdoor defenses [76, 77, 78] which require an understanding of the well-trained networks. Here, we only exhibit the
Adversarial attack
The adversarial attack baselines include gradient-based attack (FGSM) [79], point detach based attack (PDA) [79] and point perturbation-based attack (PPA) [80]. The corresponding improved attacks are called as PS-FGSM (
FGSM and PS-FGSM
The attack performance of FGSM and PS-FGSM shown in Table 1 (up) suggests that PS-FGSM outperforms FGSM at all times. In detail, PS-FGSM achieves 22.99% attacked accuracy which is better than the 61.23% attacked accuracy of FGSM at a perturbation of 0.04 chamfer pseudo distance. Although the attacked accuracy of FGSM decreases with increasing distance, the decline is smaller than that of our PS-FGSM. In addition, Fig. 10 shows the attacked point clouds generated by FGSM and PS-FGSM, with a approximate 20% attacked accuracy. This suggests that PS-FGSM achieves better stealthiness than FGSM.
The point clouds attacked by FGSM and PS-FGSM with a approximately 20% attacked accuracy. It is obvious that PS-FGSM introduces less disturbance than FGSM. 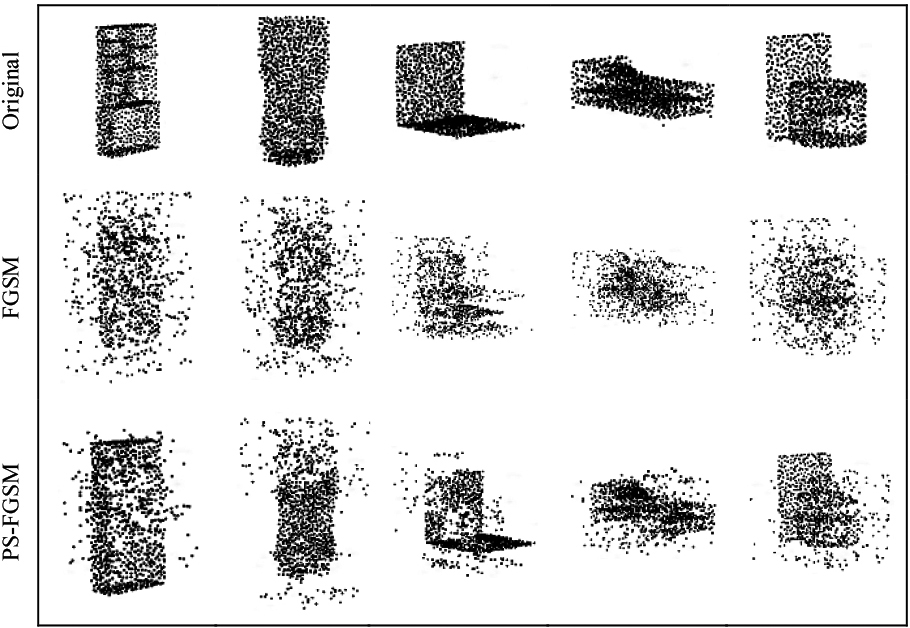
Critical patches (of one point cloud) provide better dimensions to cross the decision boundary. Left: A set of two-dimensional data that can be separated with a piece-wise linear classifier. Middle: Adding perturbations (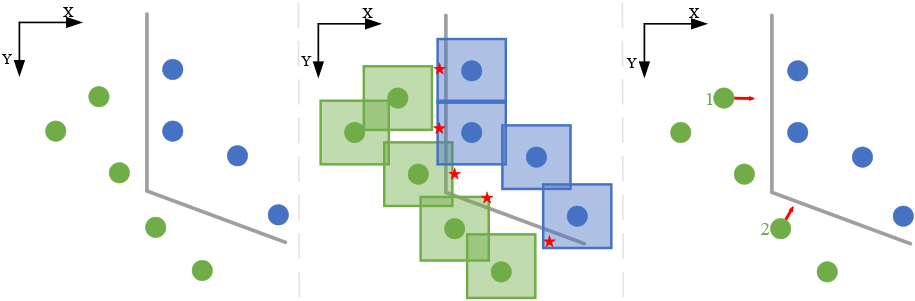
CP-PDA and PS-PDA
Table 1 (bottom) suggests that there is a small attack performance gap between CP-PDA and PS-PDA, with a detached point number
PPA and PS-PPA
PPA [80] achieves the best result (0% attacked accuracy) in their original experiments. For further improvement, our PS-PPA aims to reduce the introduced point perturbation with the same attacked accuracy. The experimental results suggest that the average
In sum, the improvement of the PS based adversarial attacks is significant, regardless of whether the baseline is the gradient-based method, point detach-based method or point perturbation-based method. This advantage is benefit from that our patch-wise saliency map can locate where the 3D DNN focuses more accurately. Therefore, it can be regarded as a pluggable tool to improve the performance of adversarial attacks that based on the critical points theory.
Discussion
Based on the attack results, we provide an argument: critical patches guide the adversarial point clouds to cross the decision boundary. Adversarial samples are usually generated by adding perturbations to the clean samples. However, the search space of perturbations is very large (for example,
Furthermore, for adversarial point clouds, we suggest that finding critical patches is a better way to locate the optimal dimensions to cross the decision boundary, as shown in Fig. 11. On the optimal dimensions, one can achieve a higher attack success rate by introducing relatively less disturbance.
Backdoor defense by point-defender and patch-defender. The backdoor patterns are detected as a whole by the patch-defender. In contrast, the point-defender only detects a part. 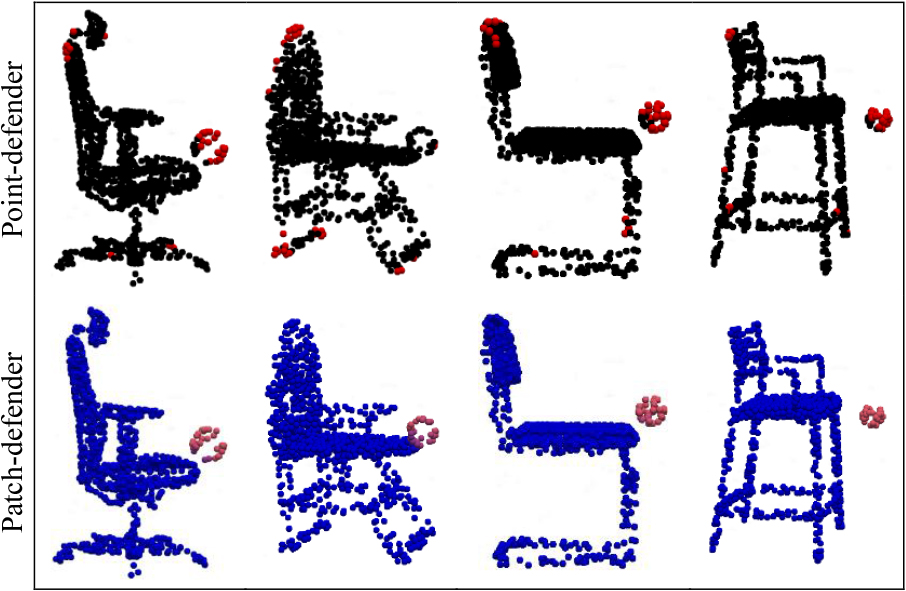
To date, there are few baselines specifically designed for defending against backdoor attacks on point clouds [89, 77]. Recently, Fan et al. [90] follow the popular defense method in the image domain [91, 92] and extended it to point clouds. These works search for critical regions from input towards each class and then locate the backdoor pattern by the saliency map technique.
The critical issue for extending them to point clouds is how to build a point cloud saliency map. Here, the point-wise saliency map [20, 90] and our patch-wise saliency map are utilized to design two point cloud backdoor defense methods, which are called point-defender and patch-defender respectively. The point-defender process includes: 1) calculating the saliency score
We utilize PointNet and ModelNet40 as the victim model and dataset respectively. PointBA_X [93] is chosen as the benchmark backdoor attack method for evaluation. More implementation details are shown in the Supplemental Material. The experimental results show that patch-defender decreases the ASR (Attack Success Rate) of PointBA_X from 82% to
Conclusions and future works
To determine where a 3D DNN focuses when making its decision, this paper generates a point cloud saliency map from a patch-wise perspective. In detail, the Mask Building-Dropping process is designed to adaptively match the size of important/unimportant patches, and to assign saliency scores to them. The experimental results suggest that our patch-wise saliency map achieves better performance than the point-wise saliency map. In addition, the patch-wise saliency map can better locate the important/unimportant regions for various 3D DNNs. Otherwise, the disparity between different 3D DNNs can be highlighted by the patch-wise saliency map. Finally, we apply our patch-wise saliency map to adversarial attacks and backdoor defenses. The comparison results suggest that the improvements are significant. Although our patch-wise saliency map achieves guaranteed performance, the repetition process inevitably causes high computational cost. Considering that time efficiency is a key requirement of the saliency map technique, future works could focus on decreasing the computational cost.
Footnotes
Acknowledgments
This work was supported by the National Natural Science Foundation of China under Grant 62072348 and China Yunnan province major science and technology special plan project No. 202202AF080004. The numerical calculations in this paper have been done on the supercomputing system in the Supercomputing Center of Wuhan University.