
Abstract
Content-based image retrieval (CBIR) technique is increasingly gaining research attention as a Computer Aided Diagnosis (CAD) approach for breast cancer diagnosis. This work discusses a novel feature modeling technique for CBIR systems based on classifier scores and standard statistical calculations on the same. Established textural and geometric features are initially used to represent medical characteristics, before being used to generate secondary features through classifier scoring using the Support Vector Machine and Quadratic Discriminant Analysis classifiers. The model is validated through a range of benchmarks, and is shown to perform competitively in comparison to similar works.
Introduction
Breast cancer is the uncontrolled growth and spread of abnormal cells originating in the breast; it is the most commonly diagnosed cancer among women globally with 1.7 million cases reported in 2012 alone, accounting for 25% of new cancer cases [5]. It can be fatal if not attended to, but yields a good prognosis if detected early. Mammography currently provides the best approach for early detection of the disease, with trials estimating its reduction of fatality rates by up to 40%; this is besides enabling a wider array of treatment options, including less-intensive surgery procedures [6].
Content-based image retrieval (CBIR) systems can provide a support structure to radiologists during breast cancer diagnosis by availing pathologically similar past mammogram cases with known diagnosis, which improves the confidence of the current diagnosis [12, 16]. An essential distinction between CBIR systems and traditional text-based query systems is that in the former, comparison considers visual features derived from the images and a corresponding method of similarity measurement instead textual annotations, as is the case in the latter. Indeed, the efficiency and efficacy of medical CBIR systems – also called Content-based Medical Image Retrieval (CBMIR) systems – strongly relies in part on the features selected for representing the salient high level medical characteristics of the image [24]. Additionally, the choice of a corresponding similarity measurement method for the resulting visual features is crucial to reducing the semantic gap, defined as the difference in high-level interpretation of images by humans as contrasted to the low-level understanding of the same by algorithmic models. The efficiency and efficacy of pathology-based CBIR systems in providing accurate results to radiologists is a critical factor in their acceptance in regular medical routines [11]. In this paper, a CBIR model is presented, that demonstrates improved retrieval performance of mammograms based on microcalcifications as the pathology. Microcalcifications, besides breast masses, are the most important lesions in the diagnosis of breast cancer. The main contribution of this study is,
The parallel combination of scores from both the SVM and Quadratic Discriminant Analysis (QDA) classifiers for feature characterization Further extraction of the ultimate feature set from the scores, rather than the direct application of the scores to the retrieval engine
Within the last two decades, research activity has focused on various CBIR models for breast cancer diagnosis support based on diverse high-level features such as calcifications, the breast parenchyma, masses, etc.; these are extensively discussed in the survey study by Zheng [37]. For instance, a CBIR model is presented for the retrieval of mammograms based on breast density [12]. It extracts Singular Value Decomposition (SVD) and histogram features, which are used to train a Support Vector Machine (SVM) model. The model is measured on the sole benchmark of average precision, attaining therewith the best score of 82.14% using the polynomial kernel. The authors note that the model can be improved by considering other crucial information such as features related to lesions as well as appropriate weighting of features. The importance of extracting features related to lesions (e.g. masses and calcifications) for CBIR systems is also acknowledged by Kinoshita et al. [20]. For similarity measurement, a significant number of studies [34, 17, 19] use the Euclidean distance metric.
The extraction of lesion information as features for CBIR algorithms has received significant attention in the literature [37]. Notably, the pivotal concept of user similarity perception modeling with regards to lesions and more specifically, microcalcifications, is presented by El-Naqa et al. [13] as further work on a model presented in their earlier seminal work. In their study, the authors encode perceptual similarity of mammograms by radiologists using the neural network (NN) and SVM classifiers, based on nine microcalcification cluster (MCC) shape features extracted from regions of interest (ROIs). The authors posit that classifiers capture similarity as perceived by human observers more accurately than simple distance metrics. The ROIs forming the image dataset were sourced from a public database and scored by radiological experts specifically for that study. Experimental results reported a significant improvement in the matching fraction (76.7%) of their learned model against the Euclidean distance metric, even surpassing that of the human observers (66.7%). In a largely similar experimental setup, they expand on the results of their study by incorporating individual microcalcification features, with the objective of comparing supervised learning (modeled using the SVM classifier with a Gaussian kernel) against unsupervised learning (using Discriminant Adaptive Nearest Neighbor (DANN)) [35]. The results reported a superior matching fraction score for the supervised technique at 72.5% against approximately 64.5% for DANN.
Having demonstrated the viability of classifiers in encoding domain-specific information as briefly discussed in the preceding paragraphs, researchers have also looked at extending/modifying the structure of classifiers in order to customize them to specific problems. This can be seen in the study by Nishikawa et al. [34, 17] where a so-called case-adaptive approach is employed to improve the retrieval performance of their computer-aided diagnosis (CADx) system. Their approach involved retrieving similar mammogram cases for a particular query as a preliminary step using a regular classifier and using the retrieved cases to further modify the decision boundary of classifier. Effectively, the classifier is trained with the new set of retrieved cases in conjunction with the original training set. The computational cost associated with this approach was deemed an issue, which Jing et al. [19] addressed by replacing the decision function of the first classifier (called baseline classifier) with a regularization prior. Apart from achieving a high score according to the Area under the Curve (AUC), the regularized classifier approach [19] resulted in a tenfold reduction in computational complexity.
More recent work on adaptation of the SVM decision function was presented by Tsochatzidis et al. [33], where three SVMs are trained using 90 image ROIs from the DDSM database with the task to distinguish breast masses based on three BI-RADS categories. For any given image sample, the authors use the value of the SVMs’ decision function rather than its sign as input to a function that calculates what they call the participation value. The three participation values constitute the members of a three-dimensional feature vector that is used for similarity calculations by the Euclidean metric. Their model outscored a state-of-the-art conventional Euclidean-based similarity measurement model by 5.7% based on the mean average precision metric. In a subsequent study, their scheme was adapted to microcalcifications covering four BI-RADS categories. Seven shape features and three textural features were extracted to characterize the lesions, with the latter calculated over Contourlet subbands. Eighty-seven ROIs extracted from the DDSM database were used for model training and performance benchmarking with the model scoring 60% compared to 52% by the unsupervised CBIR (Euclidean-based model) based on mean average precision.
Efficient feature characterization is critical to CBIR CAD-based systems [11, 9] and is still an active research area. Much work is still needed on the characterization of features in order to improve the accuracy of CBIR systems [11]. Similarity modeling using classifiers has demonstrated its viability over simple distance measures as has been discussed in the preceding paragraphs. However, to the best of our knowledge, none of the previous work has considered using statistical descriptors based on the classifiers’ decision functions. This work aims to further explore this idea by deriving statistical features from classifier scores as a means of improving the accuracy of CBIR-based CAD systems in the domain of breast cancer diagnosis.
The remainder of this paper is structured as follows: the proposed methodology is presented in the next section followed by a presentation and discussion of the proposed model’s performance and thereafter the conclusion.
Materials and methods
The proposed methodology is illustrated in Fig. 1. The model takes as input a binary image containing probable calcification objects as the foreground and its original gray level version. The term “calcification” or “calcification object”, especially in the early sections of this paper, is loosely used to refer to the foreground pixel regions in the binary region of interest and does not necessarily mean that the object has been established as a true calcification. The subsequent processes are discussed in the following subsections.
Functional diagram of the proposed method.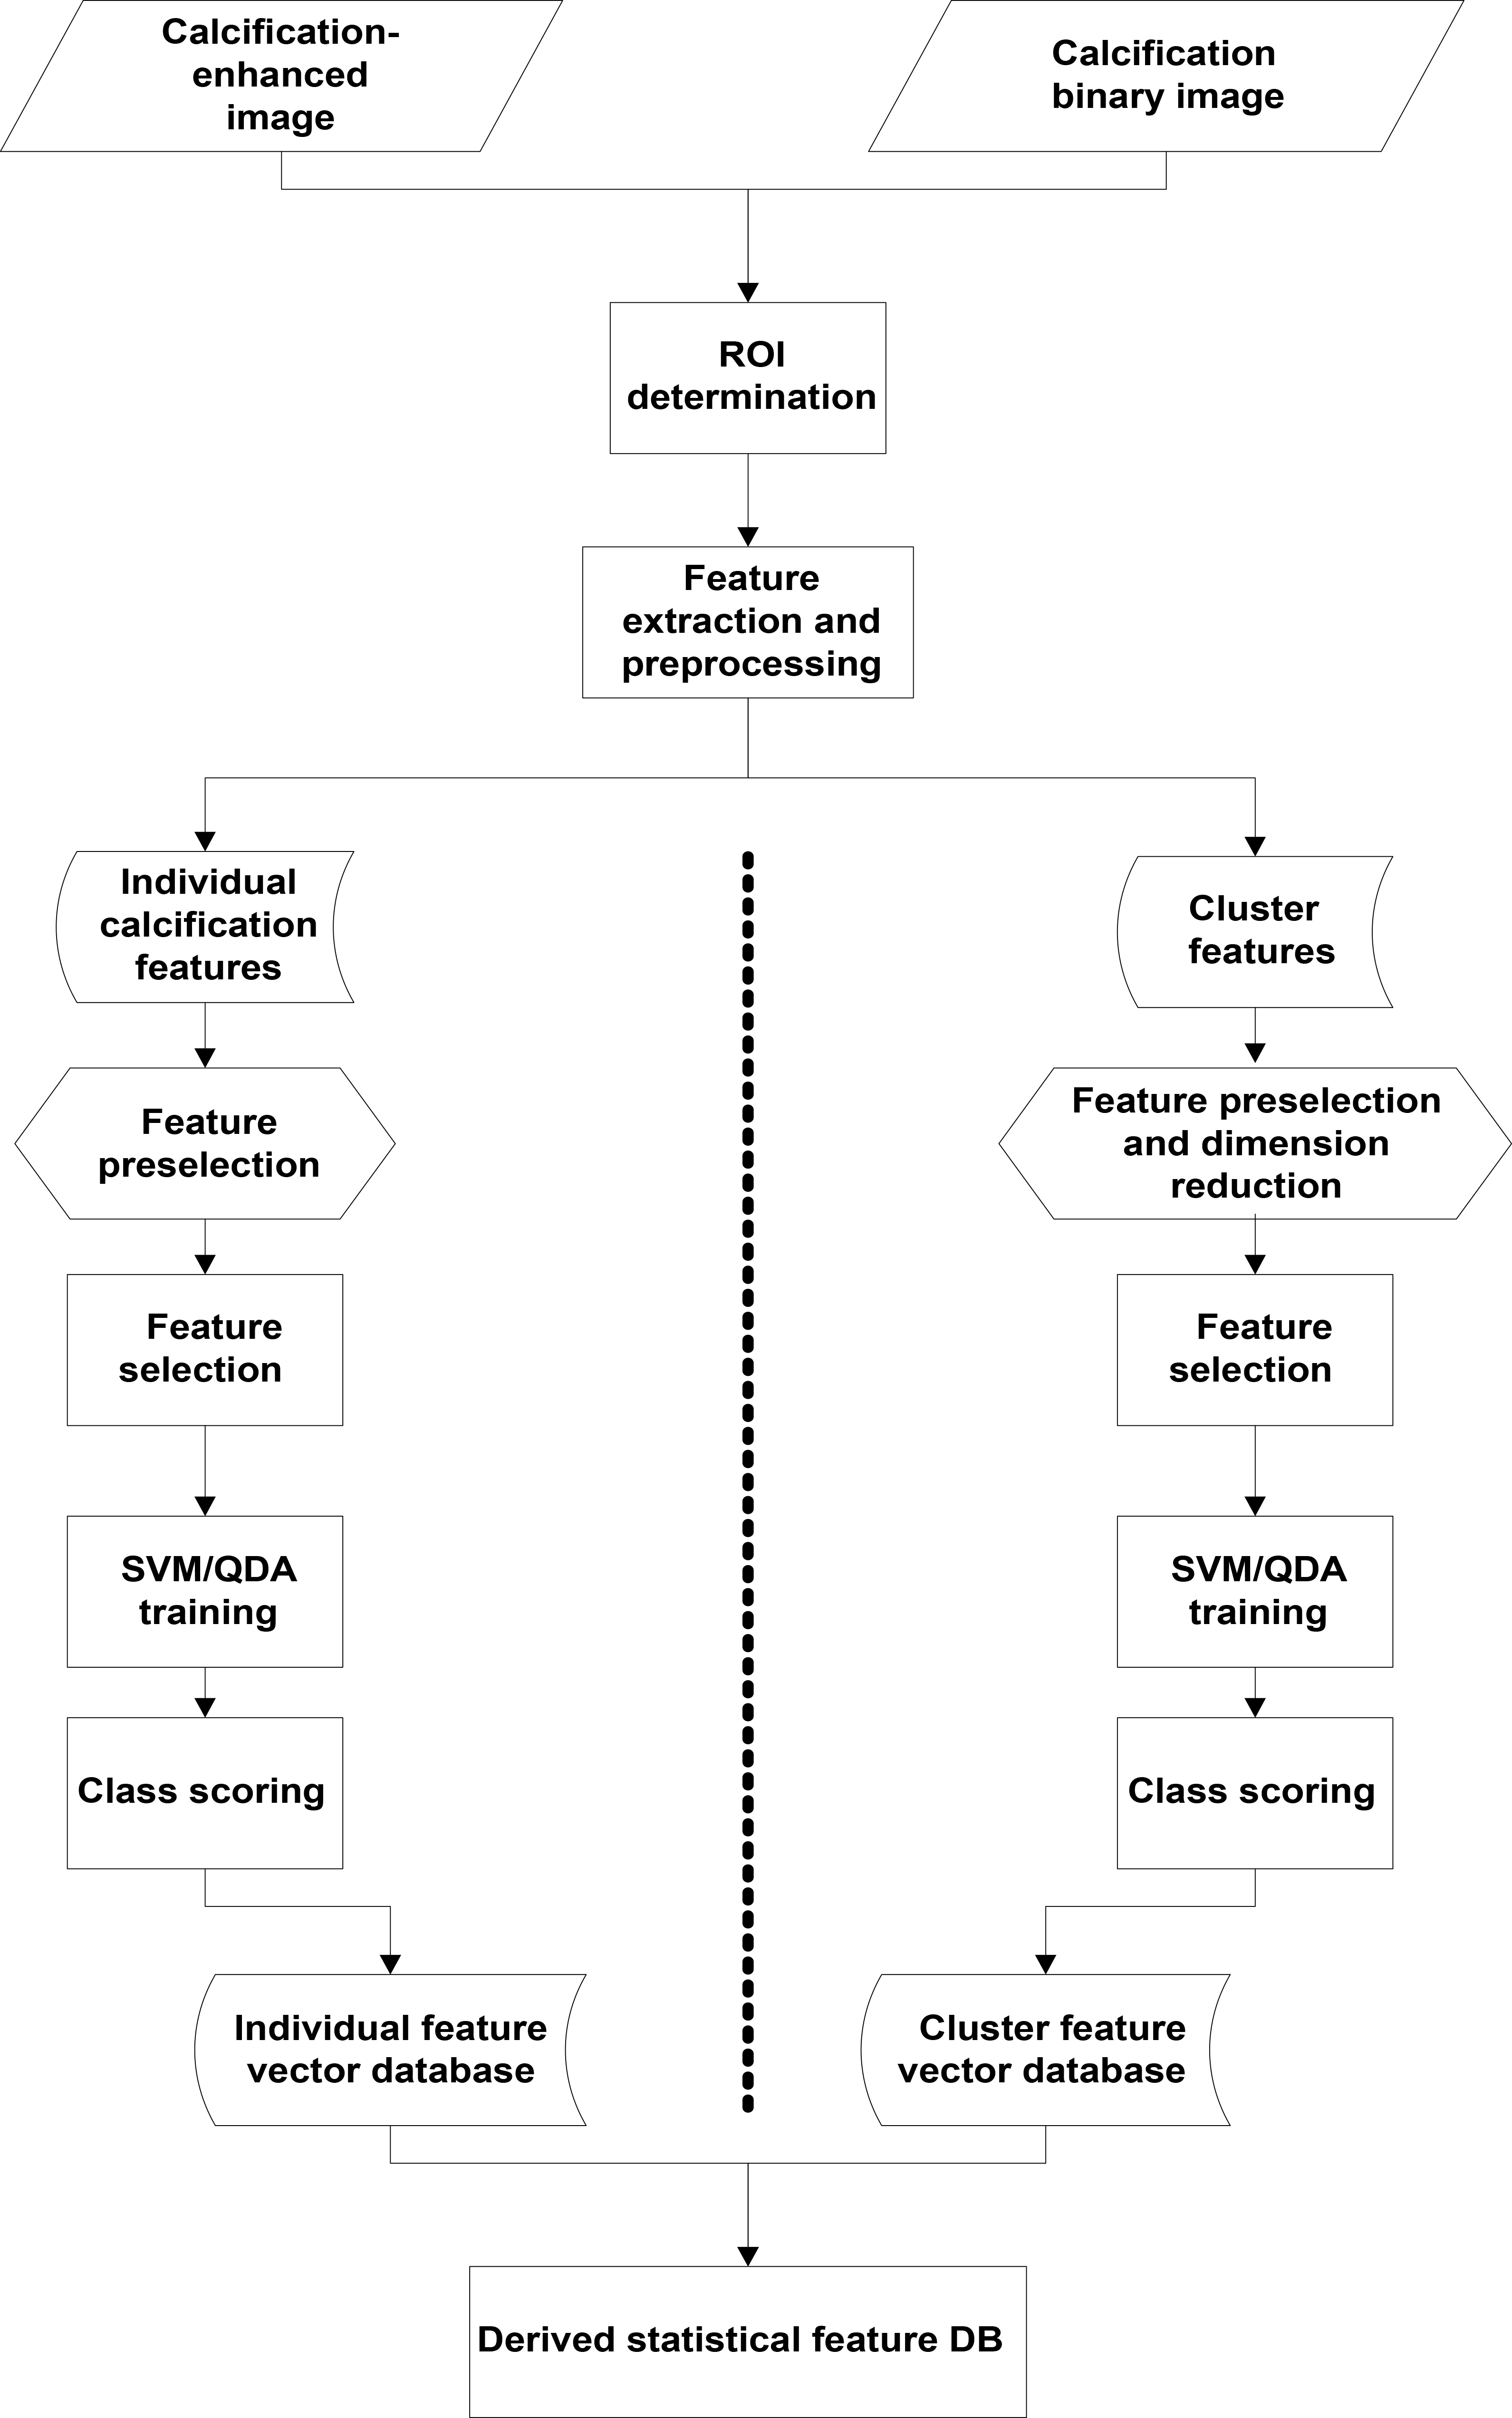
The ROI encompasses the region over which features will be extracted further down the pipeline. This region is drawn around clusters and individual calcification objects. The inputs to the model are comprised of a segmented binary image depicting calcification objects and its original grey level version as shown in Fig. 2. White pixels in the binary image are assumed to represent calcification objects with the black pixels forming the background. A cluster is established where there are three or more calcification objects within an area of 1 cm
For feature extraction, a bounding box is drawn around individual calcification objects and their containing cluster, where present, on the binary image; the bounding box is extended with a padding of 5 pixels from the bordering calcification’s boundary pixels. The ROI position and dimensions established from the binary image are superimposed on the gray level image, such that both ROIs have the same coordinates on both versions of the image – these two ROIs will represent the original image in the subsequent steps (see Fig. 2). The binary image is simply the segmented version of the grey level image (i.e. containing the detected calcifications).
Individual feature vector
, with dimension
Individual feature vector
The first image is the original, second is the segmented and the third is the superposition of the first image on the second to highlight the microcalcifications. The rectangle depicts the established region of interest for feature extraction.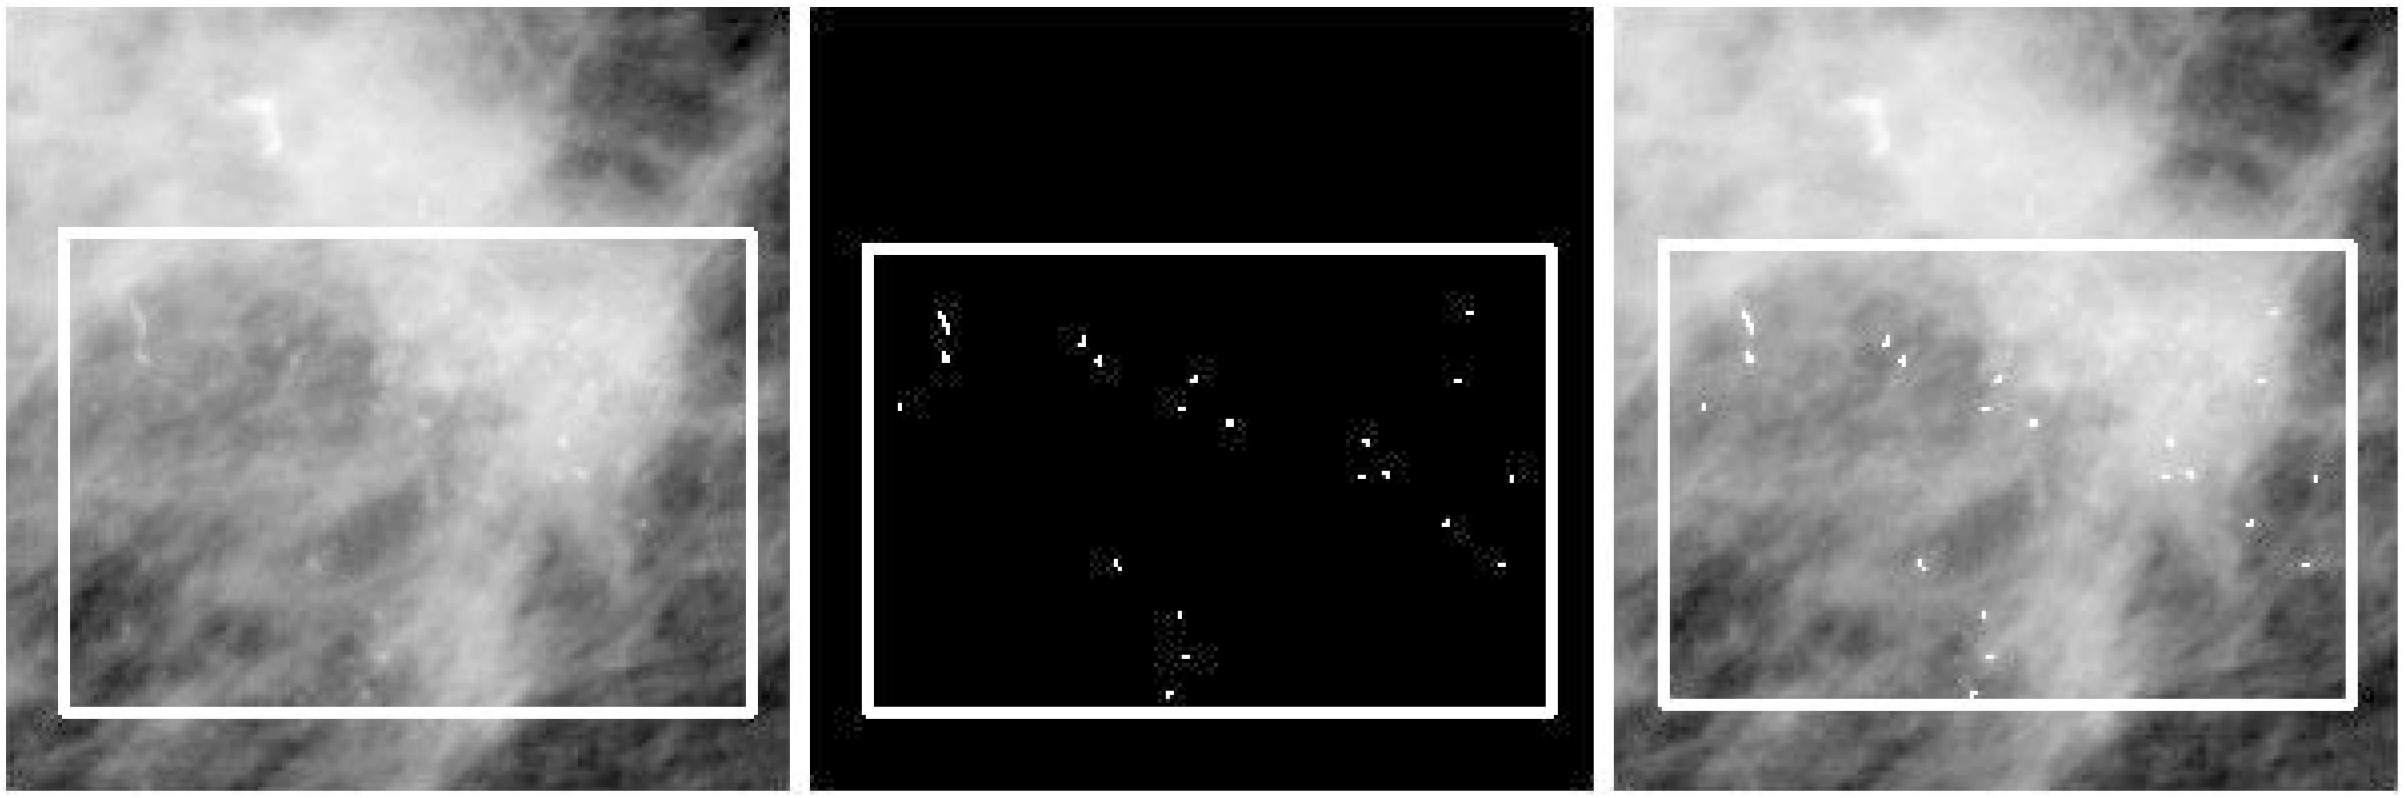
At this stage, features are extracted to represent individual calcification objects and cluster objects. Information on these two object types is critical to malignancy determination as explained in the literature review section. The individual calcification feature vector is denoted as
Feature extraction
The choice of features is guided by the need to bridge the semantic gap in the pathological description of microcalcifications between CBIR algorithms and radiologists. In this regard, two features that highly correlate with radiologists’ descriptions are extracted as the first set of features. These are: Haralick features, which are extracted from the gray level ROI, and geometric features, which are extracted from the binary image ROI [13, 34]. Table 1 shows all the feature vector components used to characterize individual microcalcifications, while Table 2 lists the features used for microcalcification clusters. These two features have been widely used in calcification characterization and their performance for shape and textural encoding applications is well documented [22].
Cluster feature vector
, with dimension
. The meanings of the abbreviations are as follows: CC – Cluster calcifications, CVH – Cluster convex hull, CR – Cluster region, B – Binary image, GL – Grey level image,
– mean,
– Standard deviation
Cluster feature vector
Haralick features are extracted from the GLCM matrix; they are used for modeling textural characteristics, which are distinctly defined in a calcification-present area of mammograms. The GLCM matrix,
where,
This work uses all four orientations shown in Eq. (2) and five distances,
Geometric features on the other hand describe shape characteristics of clusters or individual calcification objects, which is useful in distinguishing the various pathologies of calcifications. The five Shape features extracted in this work directly relate to the descriptions used by radiologists to characterize the various calcification properties [22, 27, 9]:
Area – the total number of foreground pixels; Compactness – the ratio involving a factor of the object’s perimeter and its area. It gives a measure of the roundness of the object; Orientation – the angle between the x-axis and the major axis of the ellipse of the object; Eccentricity – the ratio of the distance between the foci of the ellipse and its major axis length. Bigger values imply a higher linearity semblance of the object; Solidity – refers to the ruggedness of the object, measured as the ratio between its actual area and that of its convex hull.
Cluster region (CR) in Table 2 refers to the grey level ROI identified in the previous Section, the convex hull is drawn around the border calcification objects of the cluster. In the non-clustered ROI, haralick and geometric features are extracted for each individual calcification object.
At this stage, normalization is applied on both feature sets (
where
Given the few clusters that were obtained after feature extraction, the cluster feature vector
The reduction of the dimension of
The “curse of dimensionality” is a classic issue in CBIR systems, where the performance of such systems expectedly degrades with an increase in the number of features. In fact, some authors contend that some extraneous features act as noise, worsening the query results of CBIR systems[23, 11, 29]. Ladha and Deepa categorize features into three [23]:
features have an influence on the output. Their role cannot be overlooked
features have no influence on the output and can be left out without incurring any performance penalty
features can be substituted by other features
Feature selection plays a three-fold role of (1) reducing the cost of feature extraction, (2) improving classification accuracy and (3) improving the reliability of performance estimate [21, 4]. Feature selection methods are characterized by: a search strategy used to explore the space of hypothesis, a mechanism of proposing feature candidates for the current hypothesis and a measure of evaluating the selected candidate features at any given point. They can be categorized under three classes: filter model, wrapper model and hybrid model. Filter approaches rely on the general characteristics of data to evaluate features based on some discriminating criteria, while wrappers use classifiers and a subset selection approach to measure a feature subset’s prediction performance [23]. The Hybrid model is a combination of the two. These three categories have formed the focus of research in a wide range of applications and datasets [23, 21, 4, 1, 32, 18, 29]; a comprehensive discussion on feature selection methods for various biomedical applications can be found in [23, 18], with [4, 32] focusing on microcalcification detection applications.
Individual feature set Independence significance test results.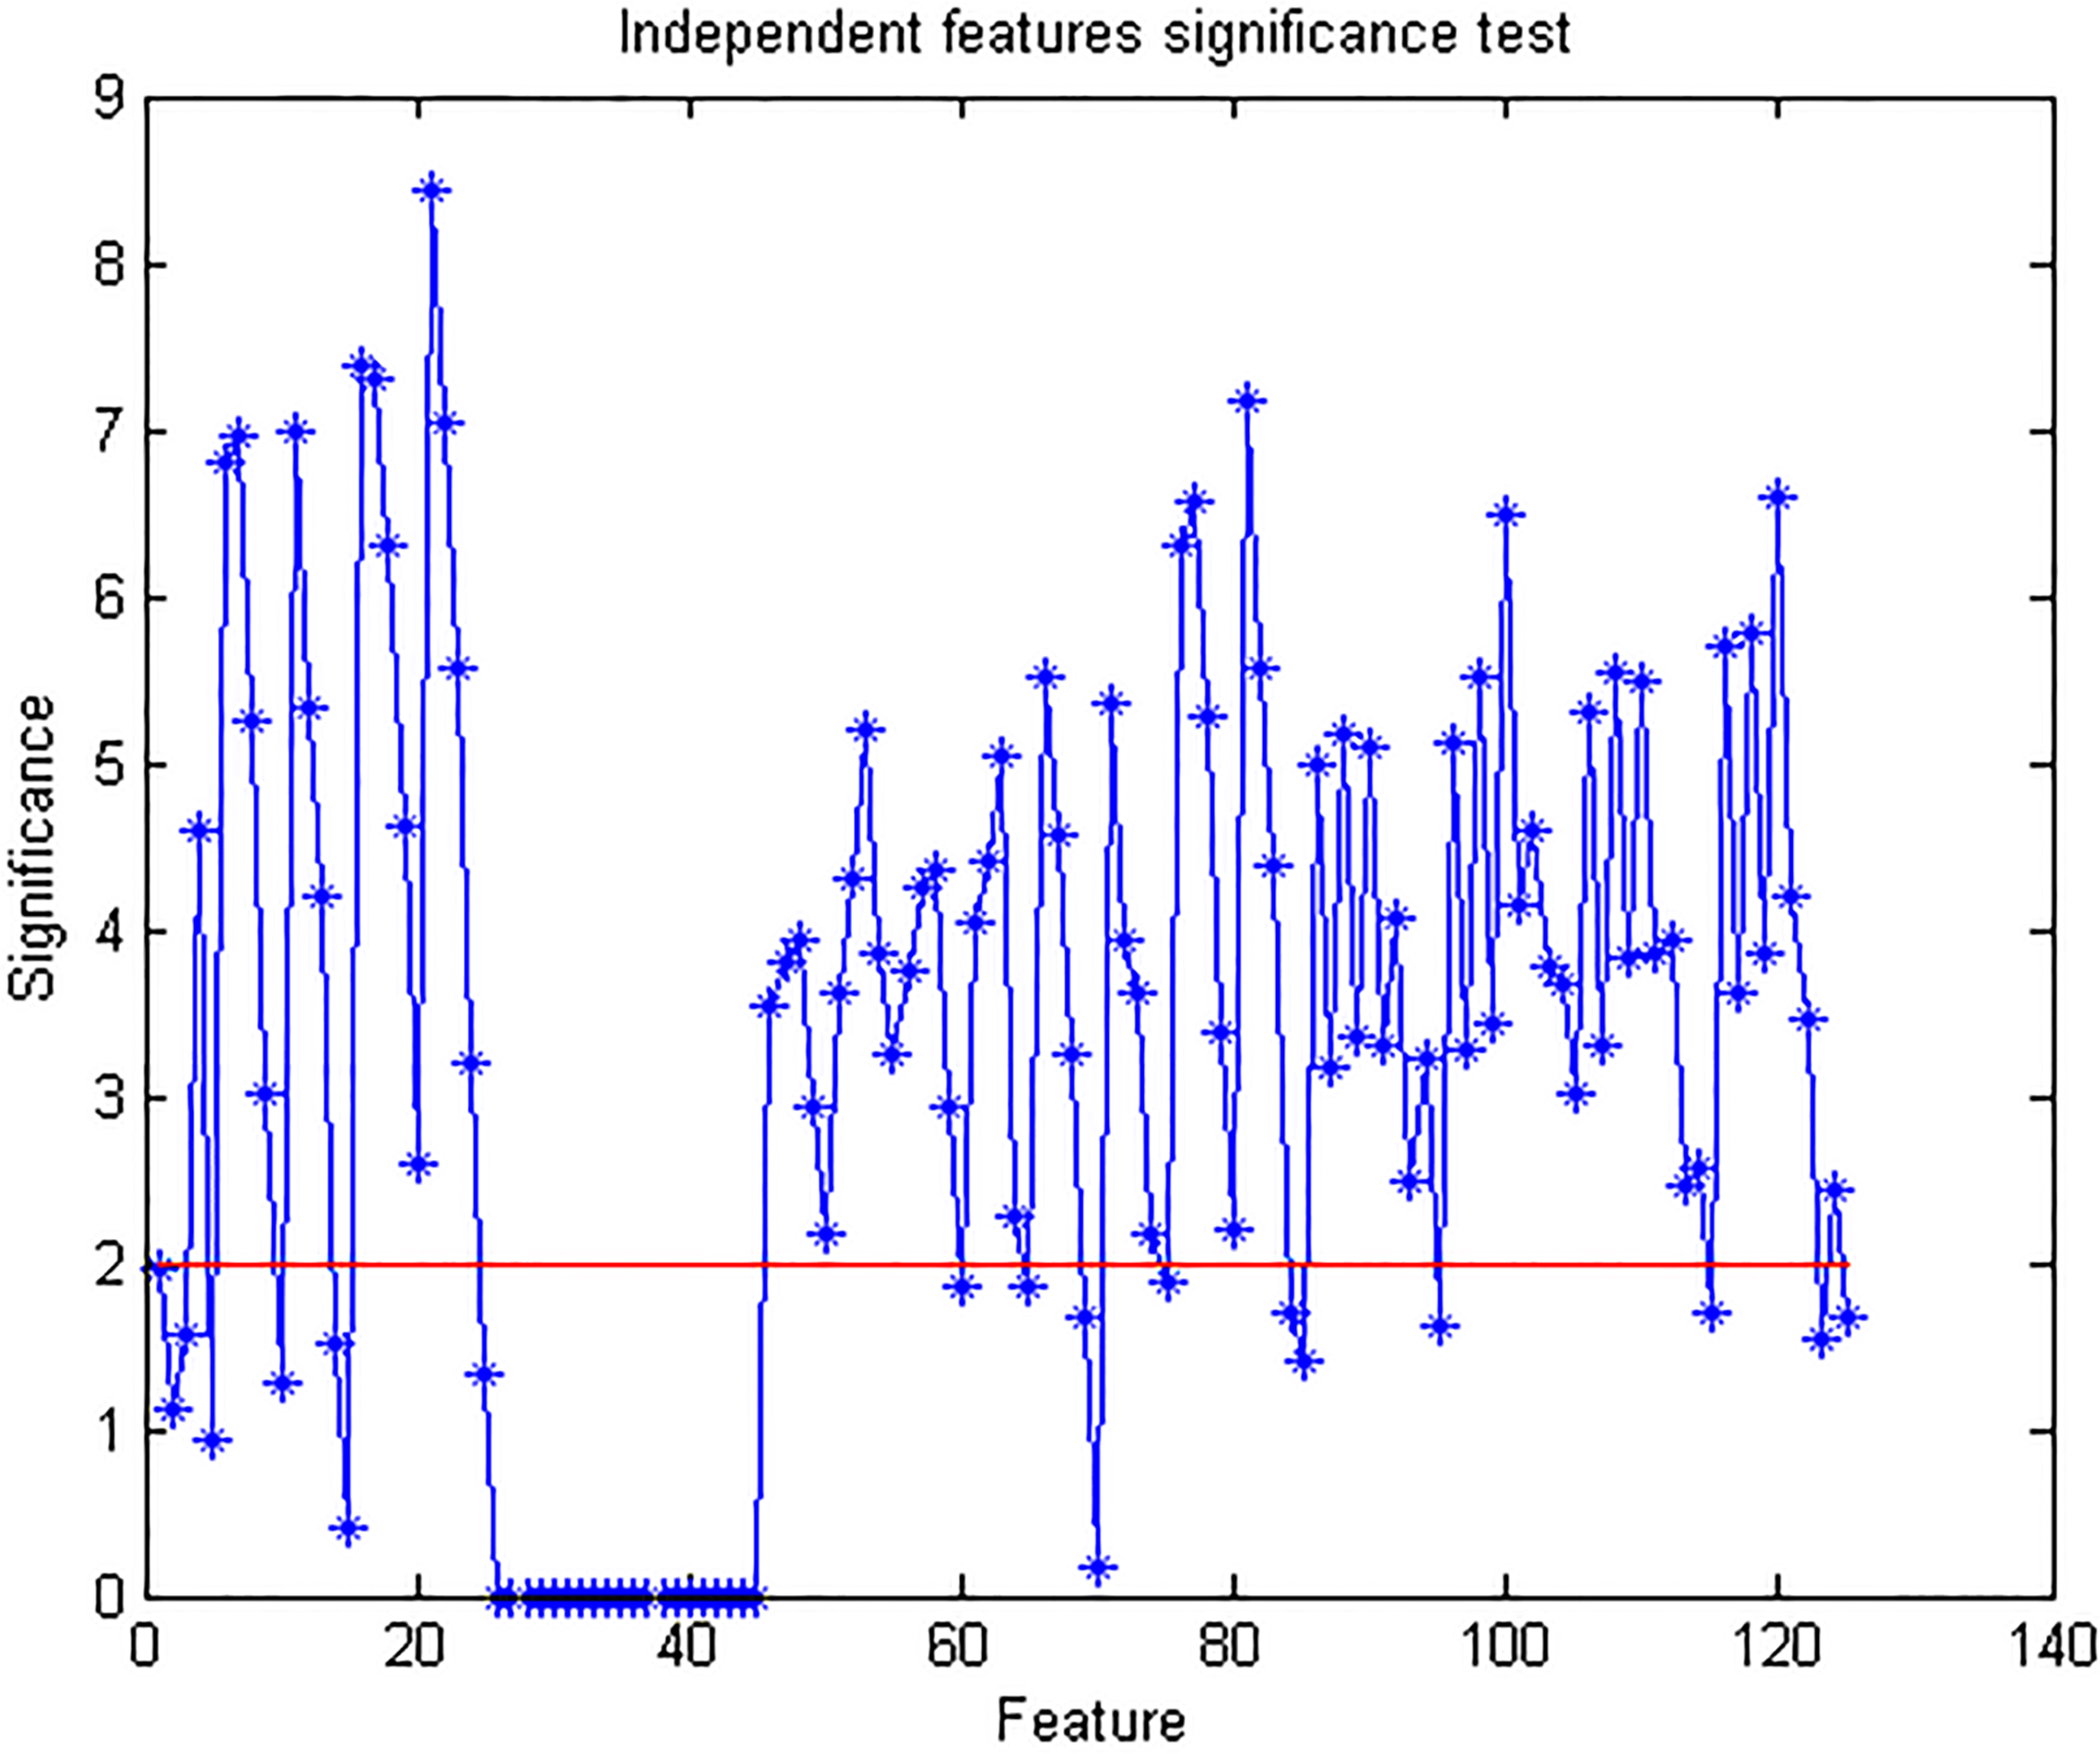
The optimal feature set was selected from the vectors
Convert cluster features to PCA eigen data Normalize by Preselect and rank by decreasing order Using the individual and cluster subsets (
Cluster feature set Independence significance test results.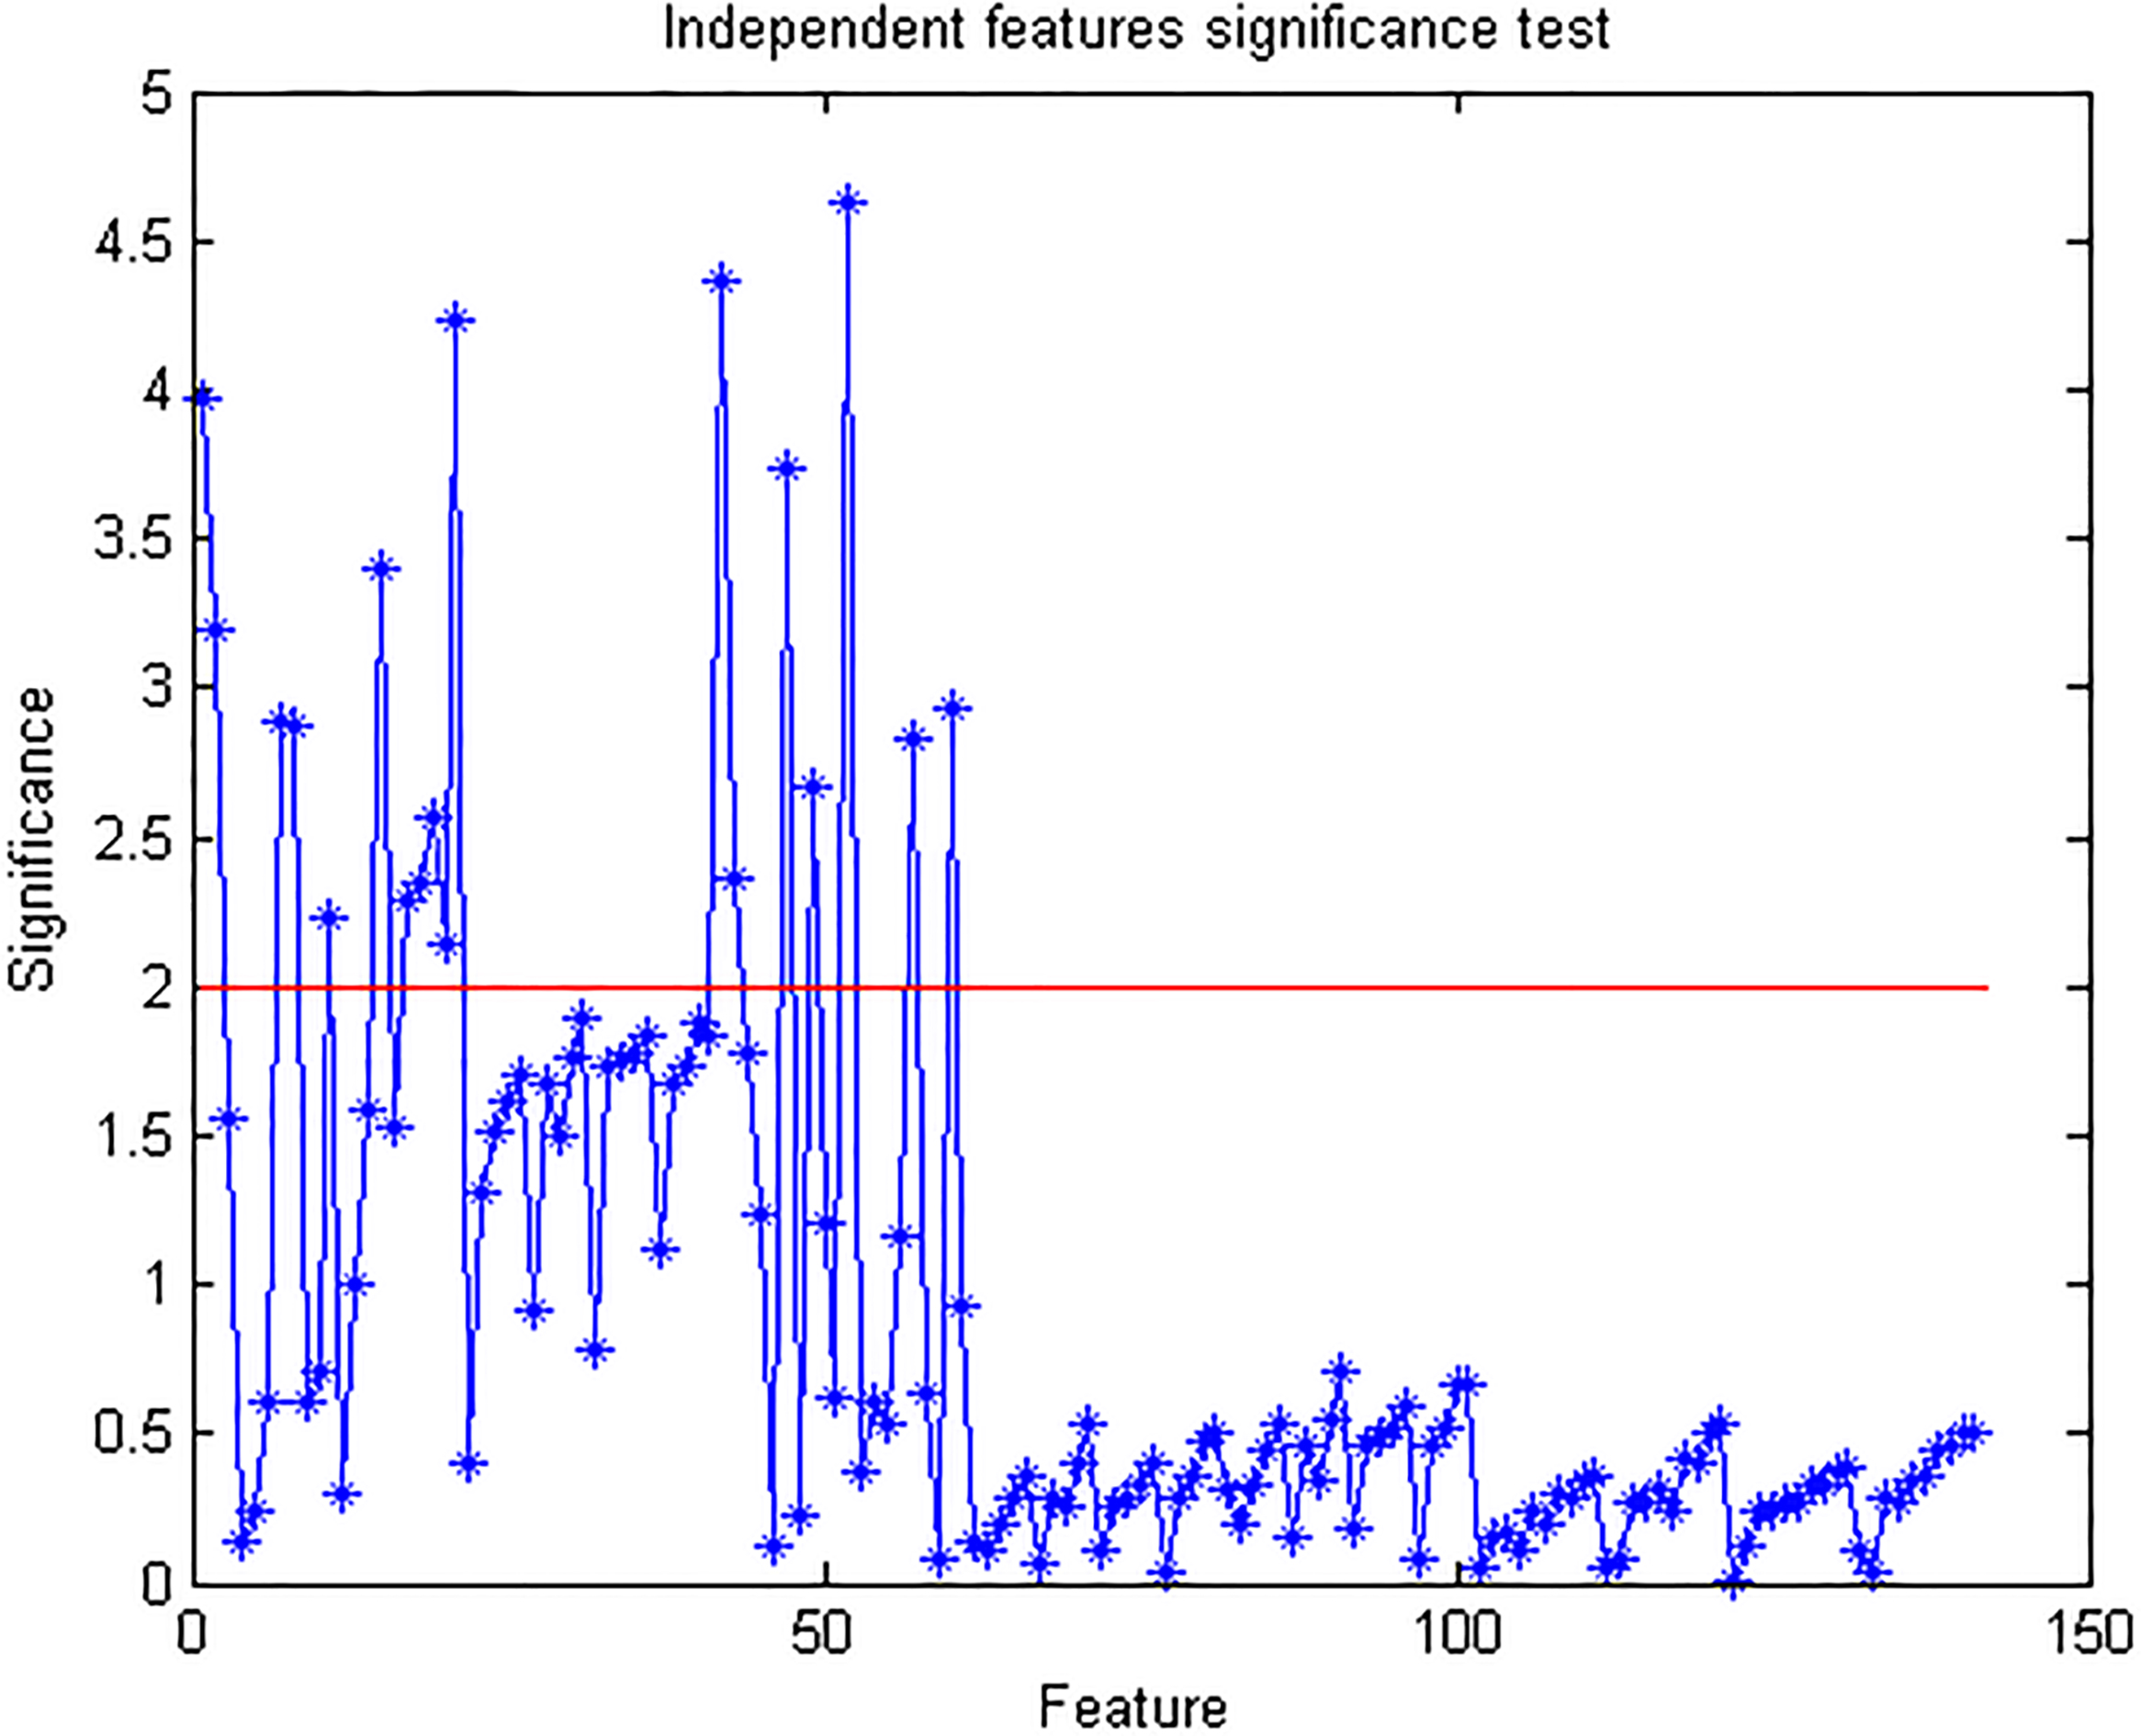
Cluster feature set Independence significance test results.
The preselection step employs a filter approach according to Weiss and Indurkhya [36], which they named the independent features significance test. It involves conducting a hypothesis test on each feature to measure its information value with regards to the separability of the classes. The essence of this step is to remove obviously uninteresting (irrelevant) features with little informative value; this significantly reduces the computational burden for the next step, which is computationally intensive. While this step overlooks dependencies (redundancies) among selected features, it is fast and useful as a preprocessing technique in feature selection applications [21]. Using
In accordance with the authors’ recommendation, all features having significance values less than 2.0 were removed from the final feature subset. Based on the results of the test, 86 individual features were selected from the original set
The second selection step applies a wrapper approach to remove redundant features using the Quadratic Discriminant Analysis (QDA) classifier and the Forward Selection Feature Search (FSFS) method. The QDA classifier is employed at this stage because of its relatively inexpensive time cost, as contrasted to the Support Vector Machine (SVM) classifier. The FSFS search strategy incrementally adds features to an initial null set until further addition cannot minimize the error rate [23]. The selection results following this process are shown in Figs 5 and 6.
Feature selection results for individual calcification features (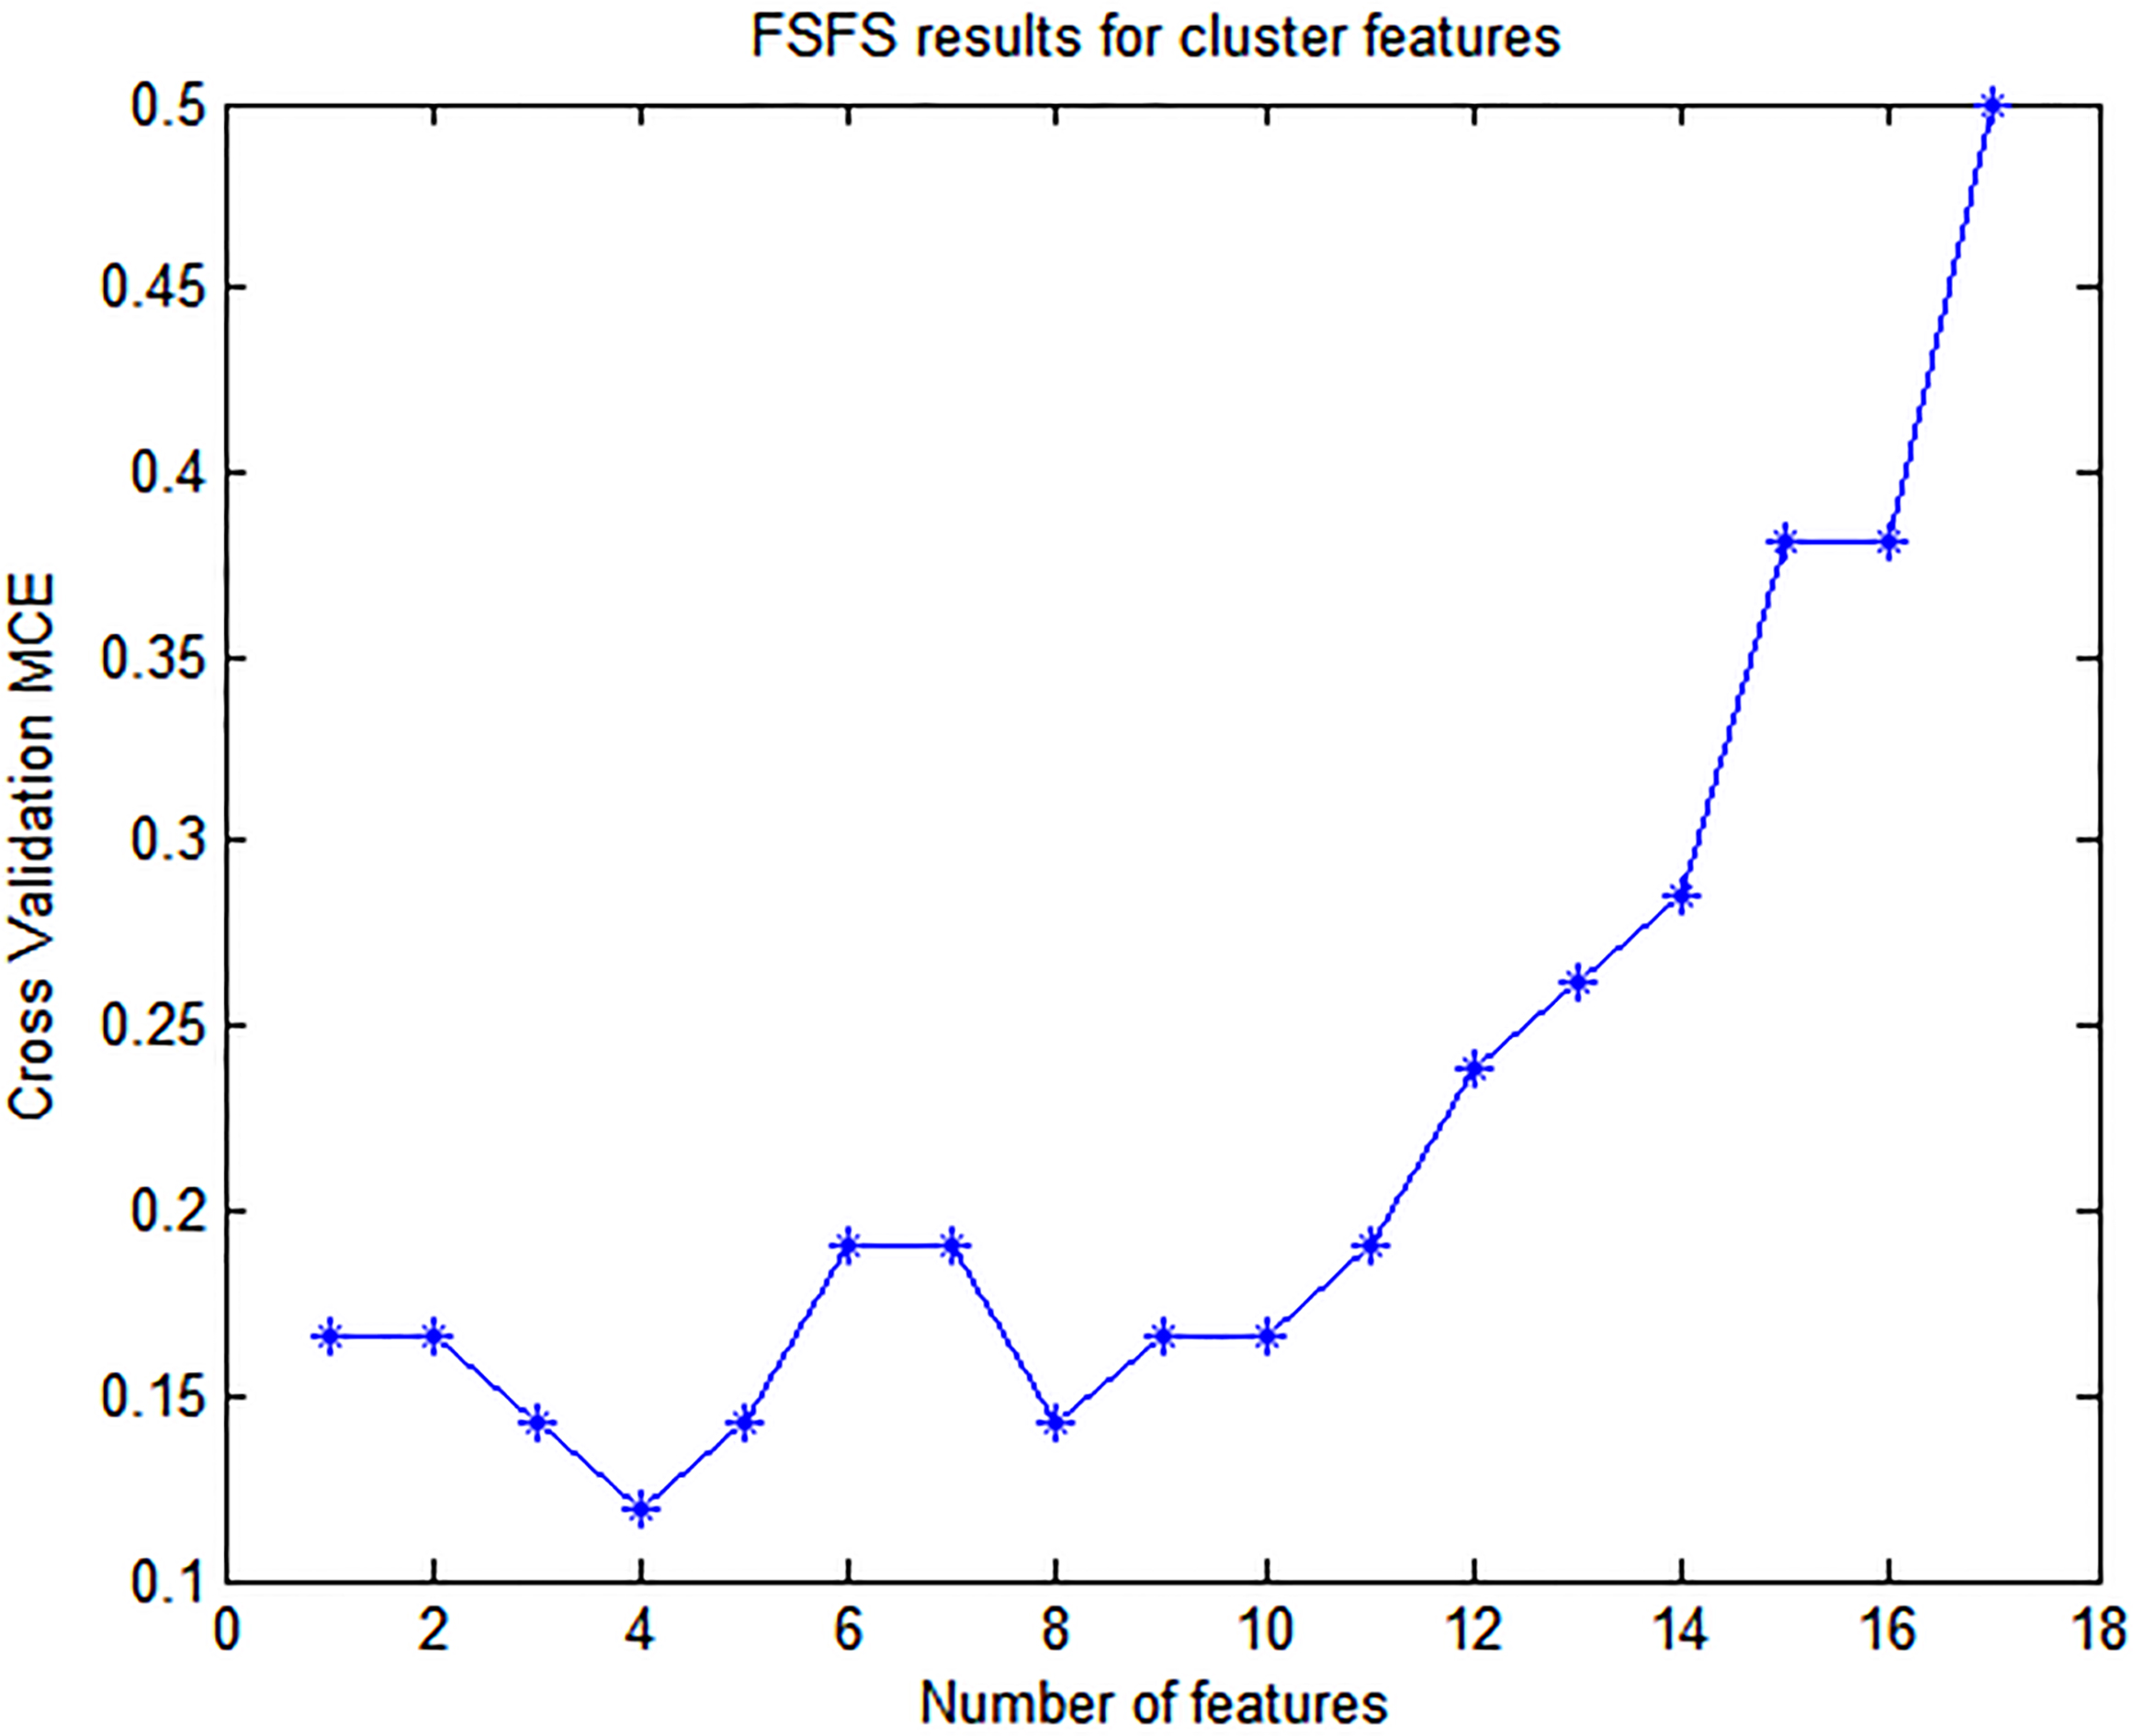
The SVM and QDA models were trained using the selected feature sets. Three parameters needed to be established for the SVM classifier: the kernel type, its associated parameters and the constraint value
[1] Train the SVM classifier
TrainSVMData [TrainData,TestData] = partitionData(Data,10) randomly partition Data into 10 sets with equal class representation Cost
Classifier scoring
The final feature vector is derived from classifier scores, unlike most related research works that directly employ primary features (Haralick, Wavelet, Geometric, etc.) to the
The final feature vector is a combination of classifier scores as well as basic first order statistics on them. This table also shows the individual performance of the features based on the independent features significance test described in Section 3.3
The final feature vector is a combination of classifier scores as well as basic first order statistics on them. This table also shows the individual performance of the features based on the independent features significance test described in Section 3.3
“Positive ROI calcifications” as mentioned in Table 3 refers to those calcifications that are classified as positive by the classifiers. A calcification is considered positive only if its score for both the QDA and SVM classifiers is greater than 50%.
The voting
In the case where more than one database samples have the same distance
Image dataset and experimental setup
The images used in this work were sourced from the Mammographic Image Analyis Society (MIAS) database [31]. The MIAS database has 29 ROIs containing microcalcifications, 15 of which are Malignant. These ROIs are spread over 25 different cases. This work extracted all ROIs classified positive for presence of microcalcifications, and 99 (randomly chosen but evenly distributed across all cases) classified as normal, from the MIAS database each having a resolution of 256
This dataset was divided into the training and testing dataset at the ratio of 0.8:0.2 respectively. The training dataset was used for the modeling of the SVM and QDA classifiers and the calculation of the standardization variables (
[H] [1] Leave-One-Out Cross Validation for the evaluation of a given modelX Feature vector set with associated ground truth
Performance metric
Multiple metrics were used in a complementary manner to give a wider assessment of the proposed model; this circumvents the incompleteness of singular metrics as test validity descriptors [3] and facilitates wide comparison with literature. Specifically, model performance was benchmarked using Sensitivity (or True Positive Rate), Specificity (is equal to 1-FPR(False Positive Rate)), Accuracy and Positive Predictive Value (PPV). These metrics were chosen because of their wide use in related applications [4, 6] and the valuable information on system performance that they capture [3, 25].
The metrics used for the evaluation of the model are based on the
2
2 contingency table depicting True Positives (TP), False Positives(FP), True Negatives (TN) and False Negatives(FN)
2
Having established the values of the contingency table, sensitivity, specificity, accuracy and the positive predictive value (PPV) are calculated as follows.
Sensitivity (also called the True Positive Rate/Fraction i.e. TPR/TPF) gives a measure of the probability that the algorithm will correctly classify an unseen positive query, while specificity is the probability that it will correctly classify an unseen negative query [3]. A high sensitivity model implies that it is unlikely to miss a test, and is usually preferred in screening for a disease [3]. A high specificity value is equally desirable as it implies a lower probability of false positives. The Positive Predictive Value gives the probability of the sample being truly positive, by considering the prevalence of the disease; it is useful since a positive classification score does not automatically imply the presence of disease, but rather varies with the prevalence of the disease within the population sampled. For instance, a highly sensitive test will have many FPs if the disease prevalence is low [28]. A good model should score high values in all the aforementioned metrics.
Experiments were conducted to comparatively analyze the proposed approach and two others employed in some literature works. The results are presented in Tables 5-6, benchmarked by the metrics discussed in the previous section. To provide a more clear perspective of the overall performance of the models for comparative assessment, the scores for all the metrics are averaged in the last column of the tables. The parameter values for
Performance benchmark using selected haralick and geometric features as detailed in Section 3.3. PPV is the Positive Predictive Value benchmark, also known as Precision. The highlighted row marks the best performing
value based on average score of all metrics
Performance benchmark using selected haralick and geometric features as detailed in Section 3.3. PPV is the Positive Predictive Value benchmark, also known as Precision. The highlighted row marks the best performing
Performance benchmark using SVM and QDA scores only. PPV is the Positive Predictive Value benchmark, also known as Precision. The highlighted row marks the best performing
Performance benchmark for the derived feature set comprising Statistics on SVM and QDA scores. PPV is the Positive Predictive Value benchmark, also known as Precision. The highlighted row marks the best performing
According to the results in Table 5, Model 1 performs the least in sensitivity and PPV, but strongly in specificity (95.91%), with the best performance attained at
Model 2 (Table 6) marginally improves the sensitivity score at 8.7% in comparison to Model 1. Its PPV score is more than double that of Model 1, but is still significantly lower at 37.92% when averaged across all values of
The proposed model (Table 7) outperforms both Models 1 and 2 in the average scores of all metrics. It has the best performance at
The high specificity scores, which are perfect in some settings for Models 1 and 2, might initially suggest good discrimination capability regarding negative cases for those models, until they are balanced with the other metrics. The experimental setup involved using all database images as query images at some point in the iterations. Given that the dataset samples are skewed towards non-malignant cases, the high specificity values of Models 1 and 2 might have undesirably been buoyed by that fact. This reasoning is supported by their low sensitivity and precision values. The high sensitivity values of the proposed model imply that it is relatively robust and effective in its ability to discriminate malignant cases even when the dataset’s class ratio is significantly imbalanced.
Accurate query results using an mdb227 ROI. The query image appears on the top-left. The incorrect result has been highlighted by a dark rectangle (bottom left).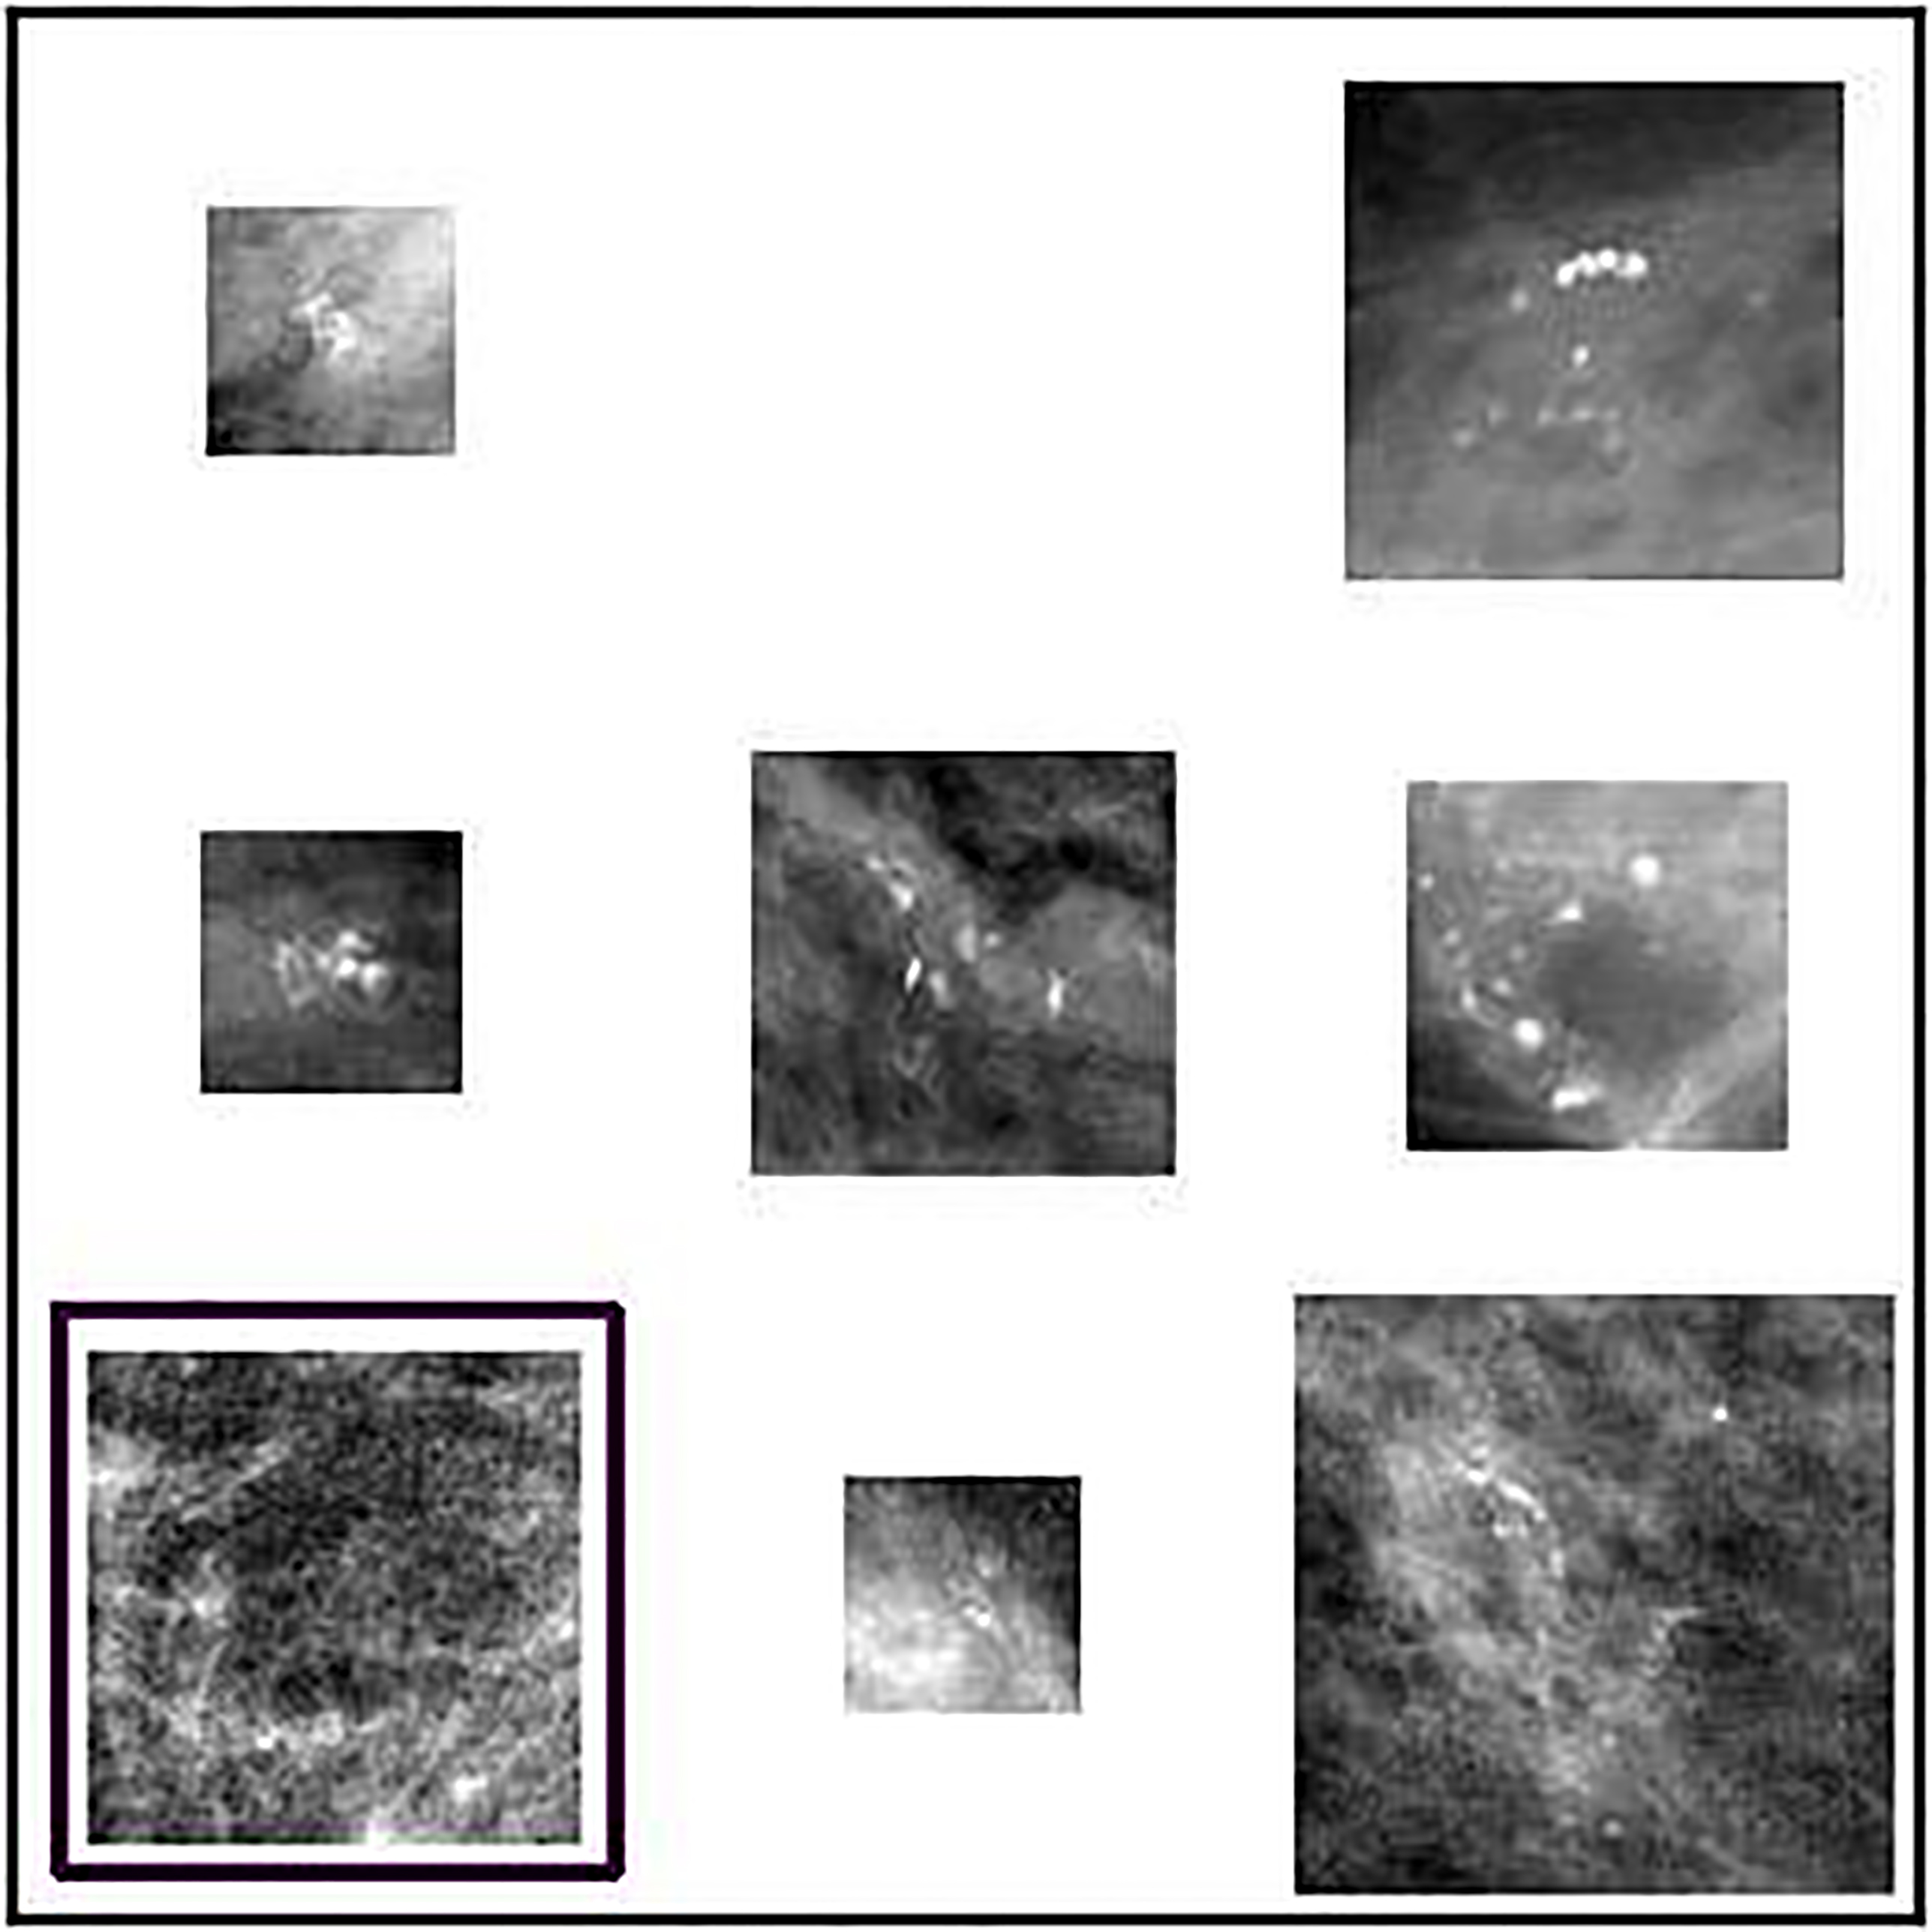
Comparison of proposed model against recent similar works. The values are expressed as percentage scores
Inaccurate query results using an mdb238 ROI. The query image appears on the top-left. The incorrect results have been highlighted by a white rectangle.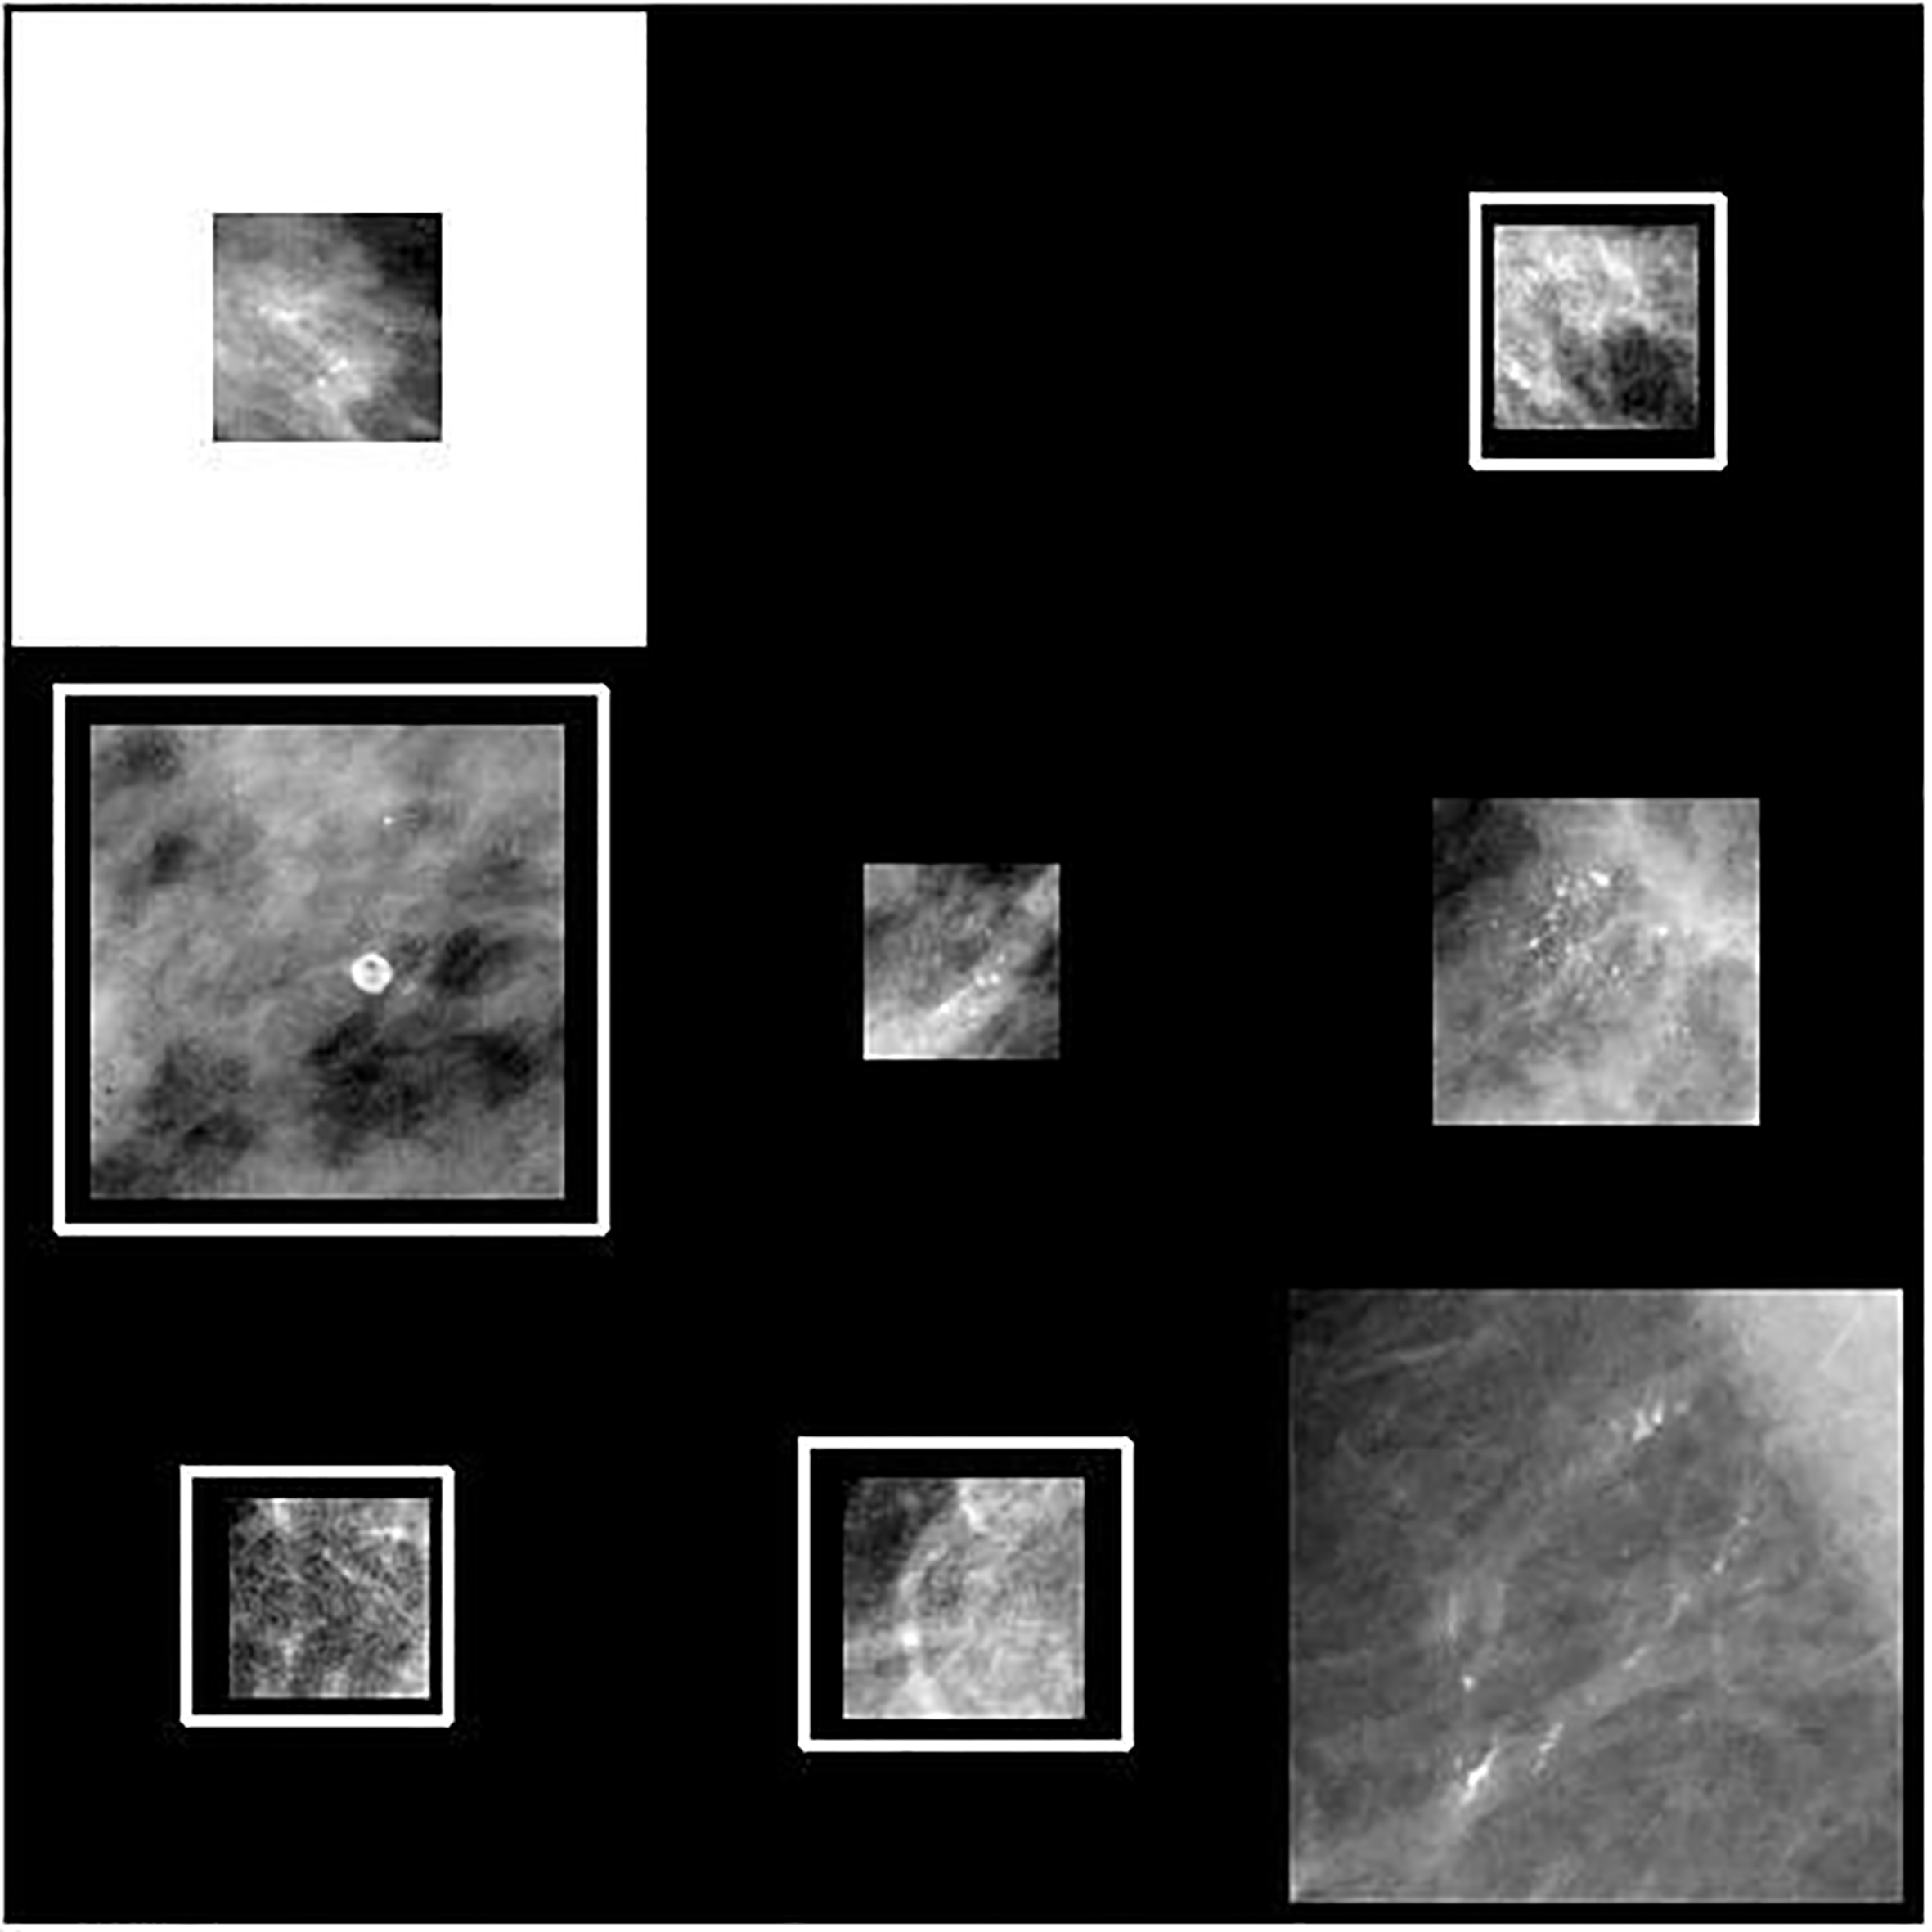
Studies have discovered a high rate of false positives as well as missed detections by radiologists during breast cancer screening, with estimates placing the radiologists’ sensitivity at about 75% [8]. Accurate query results based on visual content have been reported to be a significant diagnostic aid to radiologists [16, 9]. The significantly positive scores of the proposed model across all the metrics employed imply a high and consistent ability to extract database cases closely matching a given query sample; the incorporation of more suitable features as demonstrated by the proposed model can enhance the accuracy of CBIR-based CAD systems in breast cancer diagnosis. Such systems when used as a second opinion, can in turn improve the quality of diagnostic decisions [16, 6]. The experimental results show that the proposed model can retrieve the correct results for 78 out of 100 queries involving positive samples. It retrieves the correct image results for 98 out of 100 queries involving negative samples. The high predictive value of 82% assigns a commensurate credibility to the model’s positive results. Therefore, there is a high chance that the positive cases returned by the model are indeed positive. This is a desired attribute of a model in a clinical setting given that a low PPV leads to additional costs and negative pyschological effect on patients as follow up examination is necessitated to establish the actual diagnosis.
Most classification errors of the proposed model can be attributed to mammogram cases with dense fibroglandular tissues (Fig. 8); the intensity profile of such cases is very similar to that of microcalcifications making differentiation more challenging – this has been noted as a problem in similar studies as well and remains an open area of research [6, 15]. Our model nonetheless contributes to the field of computer aided diagnosis of breast cancer by introducing an improved feature characterization approach. Vijayalakshmi et al. [8] present a similar system combining the Local Binary Pattern (LBP) and the Artificial Neural Network classifier. While they report high scores (between 92.5%–100%) in the four metrics they use (specificity, accuracy, sensitivity and accuracy), their tests are however conducted on a smaller dataset of 80 images. Furthermore, the classes represented in their dataset are equally balanced as contrasted to the imbalanced class representation in this study.
Table 8 demonstrates the competitive performance of the proposed model in comparison to other related works. In particular, Tsochatzidis et al. [22] present a supervised retrieval model based on the SVM for malignancy assessment. Their feature vector is derived from participation values of support vectors. Their model considers all BI-RADS categories with the database composed of a total of 87 ROIs. In Table 8, we also consider their average accuracy score across all categories. Figures 7 and 8 give image results to sample queries for both accurate and inaccurate scenarios respectively. In Fig. 7, the inaccurate result appears in fifth position among the returned results. In Fig. 8, the inaccurate results appear in positions one, two, five and six.
As further work, the proposed model can be enhanced by including a physician-in-the-loop approach, where the results are assigned relevance scores, with the same being used to modify the weights of the attributes. Additionally, the incorporation of other pathological features important to the detection of breast cancer such as breast masses can be included to provide a wholistic diagnostic approach, given that this study focused only on microcalcifications. Modeling of the dense tissues and their differentiation from microcalcifications can be investigated as a means of reducing the false positive cases encountered in this study.
Content-based image retrieval is a potentially useful technique in supporting diagnostic decisions by availing similar cases with known pathology to radiologists. Accuracy and efficacy are required for CBIR systems to be adopted in regular medical practice. This paper presented an improved model for the retrieval of mammograms based on their pathology. The main contribution of this study is the combination of classifier scores, with statistics on the same to construct an effective feature vector for improving the accuracy of the retrieval of mammogram cases based on pathology and more specifically, the malignancy of clusters, where present. The feature characterization model was further improved by appropriate weighting of the features based on results of their individual discrimination ability. Experiments benchmarked the model’s performance using a wide range of metrics, with results showing increased relative effectiveness of the proposed model over the common application of texture/geometric features or their scores alone as widely applied in the literature. Further works on this model can consider extending the classification problem to include other pathologies according to BI-RADS classes and addressing the negative effect of dense fibroglandular tissues on microcalcification characterization.