Abstract
The technology trend of context-aware computer systems carries the promise of more flexible automated systems, with a high degree of adaptation to the user’s situation, but it implies as a precondition that the context information (such as the place, time, activity, preferences, etc.) is indeed available. One very important aspect of the user context is the activity in which the human is currently involved. Human Activity Recognition (HAR) has become a trending topic in the last years because of its potential applications in pervasive health care, assisted living, exercise monitoring, etc. Most of the works on HAR either require from the user to label the activities as they are performed so the system can learn them, or rely on a trained device that expects a “typical” ideal user. The first approach is impractical, as the training process easily becomes time consuming, expensive, etc., while the second one drops the HAR precision for many non-typical users. In this work we propose a “crowdsourcing” method for building personalized models for HAR by combining the advantages of both user-dependent and general models, finding class similarities between the target user and the community users. We evaluated our approach on 4 different public datasets and showed that the personalized models outperformed the user-dependent and user-independent models when labeled data is scarce.
Introduction
The technology trend of context-aware computer systems [64, 10] carries the promise of more flexible automated systems, with a high degree of adaptation to the user’s situation, but it implies as a precondition that the context information (such as the place, time, activity, preferences, etc.) is indeed available. One very important aspect of the user context is the activity in which the human is currently involved, because it highly influences her/his needs and expectations. Inferring the current activity being performed by an individual or group of people can provide valuable information in the process of understanding the context and situation in a given environment and as a consequence, personalized services can be delivered.
Of course one way of getting which activity the user is involved in is to ask her/him directly, by requiring from users to declare it in some computer interface, but this would be a burden that is of course better to avoid, and in practice almost no user would be constantly declaring his/her activity. It is way better to automatically recognize the human activity from clues such as the location, position, movements, etc. This is why in the last years Human Activity Recognition (HAR) [14] has gained a lot of attention. In the HAR wide range of applications we can find health and elder care [40, 51, 28, 62], sports [52, 36], indoor location systems [32], etc. There are several approaches to recognize human activities, e.g., from video cameras [19, 61], and even the Microsoft Kinect sensor [68, 55]. Some works have used sensors installed in the environment like binary switches, RFID tags, proximity sensors, motion sensors, etc. [25, 20, 51]. Recently, the use of wearable sensors has become the most common approach to recognize physical activities because of its unobtrusiveness and ubiquity – specifically the use of accelerometers [44, 11, 52, 50] because they are already embedded in several wearable devices and they raise less privacy concerns than other types of sensors, like video cameras.
One of the challenges in HAR systems lies in the training process. There are basically two options from which to choose: one is to apply a general model for a “generic” human user, lowering very much the precision for each individual user, and making it unusable except for the most basic activities, for which a general model is enough, as is the case for the pedometer function or for alerting a user who sits down too long; basic functions like these are now available in some fitting devices and smart watches. The other option is to train the device for each individual user, but then the problem is that training the device is a very tedious, time consuming activity, and also prone to errors; and as a consequence, most users abandon the training process altogether.
Another related problem with personalization in HAR is that at the initial state of a system there is no information about a specific user (in our case, sensor data and labels). In the field of recommender systems (e.g., movie, music, book recommenders) this is known as the cold-start problem [63, 6] and it includes the situation when there is a new user but nothing or little is known about him/her, in which case it becomes difficult to recommend an item, service, etc. It also encompasses the situation when a new item is added to the system but since no one has yet rated, purchased or used that item, then it is difficult to recommend it to the users.
The key idea of our approach is to assume that there is a community of users of the considered device, and that some of the users contribute with training data for themselves, but these data can be reused as well for some other users, especially if they “behave” in a similar way to the contributing user. Of course, the proportion of training data would be small compared to the quantity of users, but even with few available training data it is possible to take advantage of it. We do not expect, however, to reach the performance of a user-dependent device with full training data, but to have a comparable performance with much less effort from each individual user.
So, we will focus on the situation when there is a new user in the system and we want to infer his/her physical activities from sensor data with high accuracy even when there is little information about that particular user, assuming that the system already has data from many other users and also assuming that their associated data is already labeled. We are thus attempting to use a “crowdsourcing” approach which consists in using collective data to fit personal data.
The key insight in our approach is that we will use the scarce labeled data from the target user to select a subset of the other users’ data based on class similarities to build a personalized model. The rational behind this idea is that the way people move varies between individuals so we want to exclude instances from the training set that are very different from those of the target user in order to remove noise.
This work is based on our previous conference paper [22], with the additions of evaluating the use of an oversampling technique to avoid class imbalance problems, as well as the impact of choosing different clustering quality indices for the selection of the optimum number of groups in the clustering step of the proposed algorithm and additional statistical methods to validate our experimental results; also additional explanations, figures and tables are included given the ampler extension of a journal paper as this one.
This paper is organized as follows: Section 2 presents some related work. Section 3 details the process of building a Personalized Model. Section 4 presents the datasets used in this work. The experiments are described in Section 5. Finally in Section 6 we draw our conclusions.
Related work
From the reviewed literature, broadly three different types of models in HAR can be identified–namely: General, User-Dependent, and Mixed models.
General Models (GM): Sometimes also called User-Independent Models, Impersonal Models, etc. A model is constructed using a fixed set of users, with the hope that they will be similar to all other users, so the model will be also applicable to these ones.
User-Dependent Models (UDM): They are also called User-Specific Models. In this case, individual models are trained and evaluated for the given user using just her/his own fully labeled data.
Mixed Models (MM): Called also Hybrid models [48]. This type of model tries to combine GMs and UDMs in the hope of adding their respective strengths, and usually is trained using all the aggregated data without distinguishing between users.
Building UDMs and GMs is the standard way of evaluation in hand gesture recognition systems [73, 7, 38, 23] and also in pervasive health monitoring systems such as automatic stress detection [53, 49]. There are also some works in HAR that have used the UDM and/or GM approach [71, 27, 34, 74]. The disadvantages of GM are mostly related to their lack of precision, because the data from many dissimilar users is just aggregated. This limits the GM HAR systems to very simple applications such as pedometers and detection of long periods of sitting down. The disadvantages of UDM HAR systems are related to the difficulties of labeling the specific users’ data, as the training process easily becomes time consuming and expensive, so in practice users avoid it.
For UDMs, several techniques have been used to help users label the data, as it is the weakest link in the process. For example, Lara develops a mobile application [56] in which the user can select several activities from a predefined list. Anguita [8] video-records the data collection session and then manually labels the data. Some other works have used a Bluetooth headset combined with speech recognition software to perform the annotations [33] whereas others [24] take annotations manually. There are also some works that have used a crowdsourcing approach to label activities from video [29, 42]. Furthermore, once the data is labeled, the boundaries between labels may be shifted so further pre-processing to correct boundaries may be needed [35]. In any case, labeling personal activities remains being very time-consuming and undesirable indeed.
From the previous comments, apparently MMs look like a very promising approach, because they could cope with the disadvantages of both GM and UDM, but in practice combining the strengths of both has proved to be an elusive goal; as noted by Lockhart and Weiss [48], no such system has made it to actual deployment.
There have been several works that have studied the problem of scarce labeled data in HAR systems [26, 67, 44]and used Semi-supervised learning methods [17] to deal with the problem; however they follow a Mixed model approach, i.e., they do not distinguish between users.
Model personalization/adaptation refers to training and adapting classifiers for a specific user according to his/her own needs. Building a model with data from many users and using it to classify activities for a target user will introduce noise due to the diversity between users. Lane et al. [41] showed that there is a significant difference for the walking activity between two different groups of people (20–40 and 65
In Lu’s work [49]a model adaptation algorithm (Maximum A Posteriori) is used for stress detection using audio data. Zheng et al. [75] used a collaborative filtering approach to provide targeted recommendations about places and activities of interest based on GPS traces and annotations. They manually extracted the activities from text annotations whereas in this work the aim is to detect physical activities from accelerometer data.
Abdallah et al. [5] proposed an incremental and active learning approach for activity recognition to adapt a classification model as new sensory data arrives. Vo [72] proposed a personalization algorithm that uses clustering and a Support Vector Machine that first trains a model using data from user A and then personalizes it for another person B; however they did not specify how should user A be chosen. This can be seen as a
Lane [41] personalizes models for each user by first building Community Similarity Networks (CSN) for different dimensions such as: anatomical similarity, lifestyle similarity and sensor-data similarity. Our study differs from this one in two key aspects: First, instead of looking for inter-user similarities we find similarities between classes of activities. This is because two users may be similar overall but still, there may be activities that are performed very differently between them. Second, we just use accelerometer data to find similarities since other types of data (age, locations, height, etc.) are usually not available or raise privacy concerns. Furthermore, we evaluated the proposed method on 4 different public datasets collected by independent researchers.
In this work we will use an approach that is between GMs and UDMs, so it could be seen as a variation of Mixed Models, but here we use the small amount of labeled data from the considered user to select a subset of the other users’ activities instances, instead of just aggregating the user data with any other user data. This selection is made based on class similarities and the details will be presented in Section 3.
Our approach builds on the assumption that a community of users have already labeled data, in the style of the “crowdsourcing” systems [12]. We actually assume a very big community of users of a given device (like the nearly 10 millions of active users of the Fitbit devices); with that community size, even a very small percentage of labeling (say an average of only 1 label reported per user) is enough for having a very big data bank (10 million data points). Of course, there are some difficult aspects related to crowdsourced data, mentioned in the given reference [12], related to low-quality work by some users, unbalance of populations, even spammers, but with very large numbers it is possible to deal with those problems with specialized algorithms.
In our approach we also assume that the considered user will supply some little labeled data. Of course, it would be better to avoid asking for labeled data altogether, but the analysis we will present in this paper shows that the value of a little labeled data from the considered user for improving the accuracy is of a paramount importance.
Other authors like Nguyen [54] make use of crowdsourcing-style algorithms for activity recognition, also requiring from the user very small labeling, but they use completely different methods (semi-supervised learning and active learning), and their source of information is ambient sound, instead of accelerometers.
Personalized models
In this section we describe how a Personalized Model (PM) is trained for a given target user
The idea of building a PM is to use the scarce labeled data of
Build PM
Start with an empty train set
for
in
do
For each class
is the target user’s train set
Cluster
using k-means for
and select the optimal
according to some clustering quality index.
is the set of the resulting
groups
end
for
Assign a weight to each instance such that the importance of
increases as more training data of the target user is available.
Build model using training set
.
Build PM
Cluster
Build model using training set
The procedure starts by iterating through each possible class (activity type)
We conducted our experiments with 4 publicly available datasets from the UCI Machine Learning repository [46]. The criteria for selecting the datasets were:
The dataset must include simple activities. It must contain data collected from several users. The information of which user generated each instance must be included. Each class (activity type) should have several instances per user.
Now we describe the details about each of the datasets that met the criteria to be considered in our experiments. We also include information about the processing steps we made for each of the datasets.
D1: Chest Sensor Dataset. This dataset has data from a wearable accelerometer mounted on the chest [15, 1]. The data were collected from 15 participants performing 7 different activities. The sampling rate was set at 52 Hz. The sensor returns values for the
D2: Wrist Sensor Dataset. This dataset is composed of the recordings of 14 simple activities performed by a total of 16 volunteers with a tri-axial accelerometer mounted on the right wrist [13, 4]. The set of activities includes: 1) brush teeth, 2) climb stairs, 3) comb hair, 4) descend stairs, 5) drink glass, 6) eat meat, 7) eat soup, 8) getup bed, 9) liedown bed, 10) pour water, 11) sitdown chair, 12) standup chair, 13) use telephone and 14) walk. The data was collected in the volunteers’ homes and a supervisor labeled the data while the volunteer performed one of the activities of interest. The sampling rate was set at 32 Hz. The same pre-processing steps and the same set of features as dataset 1 were extracted from a window of size 128 that corresponds to 4 seconds. This resulted in a total of 3 098 instances.
D3: WISDM Dataset. This dataset was collected by 36 subjects while performing 6 different activities [39, 3]. The data was recorder using a smartphone with a sampling rate of 20 Hz. The data was collected with an application running on a phone which allows to label the activity being performed through a graphical user interface. The dataset already contained 46 features which were extracted from fixed length windows of 10 seconds each. The activities include: 1) downstairs, 2) jogging, 3) sitting, 4) standing, 5) upstairs and 6) walking. The total number of instances are 5 418.
D4: Smartphone Dataset. This database was built from the recordings of 30 subjects performing activities of daily living while carrying a waist-mounted smartphone with embedded inertial sensors [8, 2]. The activities in this database include: 1) walking, 2) walking upstairs, 3) walking downstairs, 4) sitting, 5) standing and 6) laying. The experiments were video recorded to perform the labeling. The sampling rate was set at 50 Hz. For our experiments we used a subset of this dataset that was distributed in the ‘Data analysis’ course [45] which consists of 21 users. The dataset already includes 561 extracted features from the accelerometer and gyroscope sensors. The total number of instances for the 21 users are 7 352.
For all the datasets the features were normalized between 0–1. Table 2 shows a summary of the datasets and its characteristics.
| Abbr. | Name | # subjects | # classes | # instances |
|---|---|---|---|---|
| D1 | Chest sensor | 15 | 7 | 9 188 |
| D2 | Wrist sensor | 16 | 14 | 3 098 |
| D3 | WISDM | 36 | 6 | 5 418 |
| D4 | Smartphone | 21 | 6 | 7 352 |
Distribution of selected number of groups according to the Silhouette index for each dataset
Several works in HAR perform the experiments by first collecting data from one or several users and then evaluating their methods using k-fold cross validation (being 10 the most typical value for
To preserve the class distributions, stratified random sampling was used, i.e., perform simple random sampling within each class. This will ensure that at least one instance per class is chosen. We chose
Figures 2–4 show the results of averaging the accuracy of all users for each
D1 – Chest sensor dataset. PM-2 is explained below. D2: Wrist sensor dataset.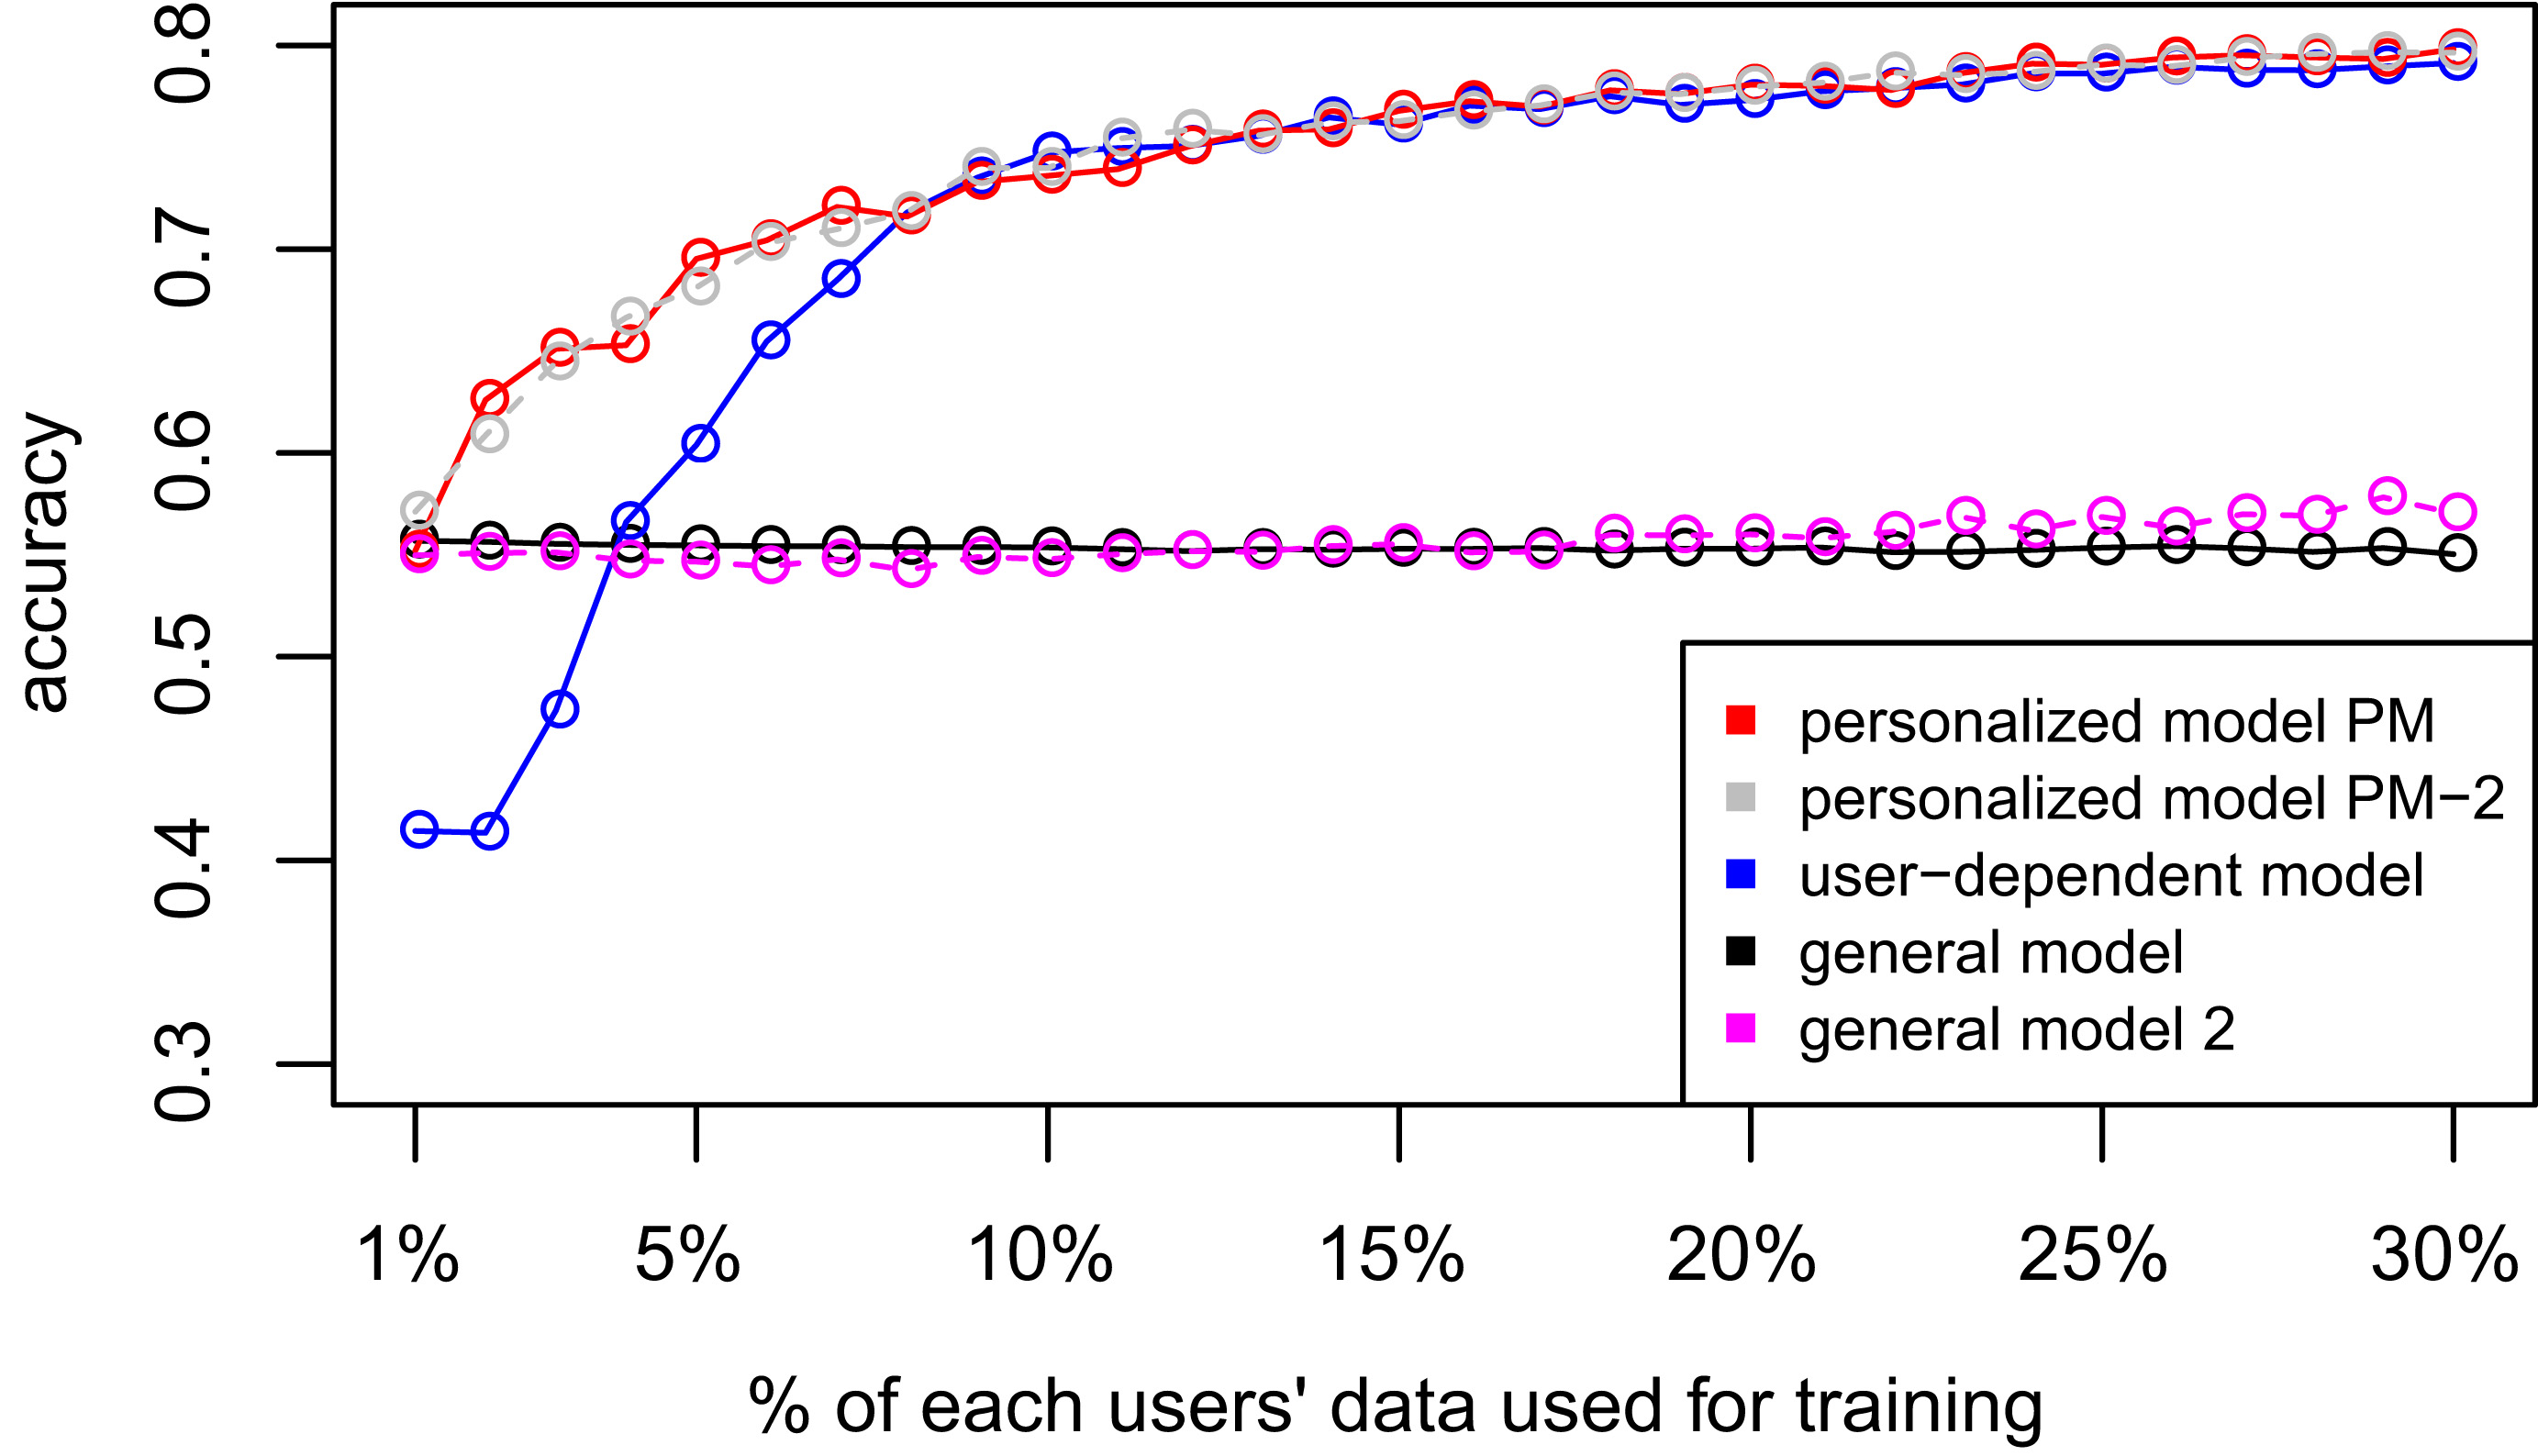

D3: WISDM dataset. D4: Smartphone dataset.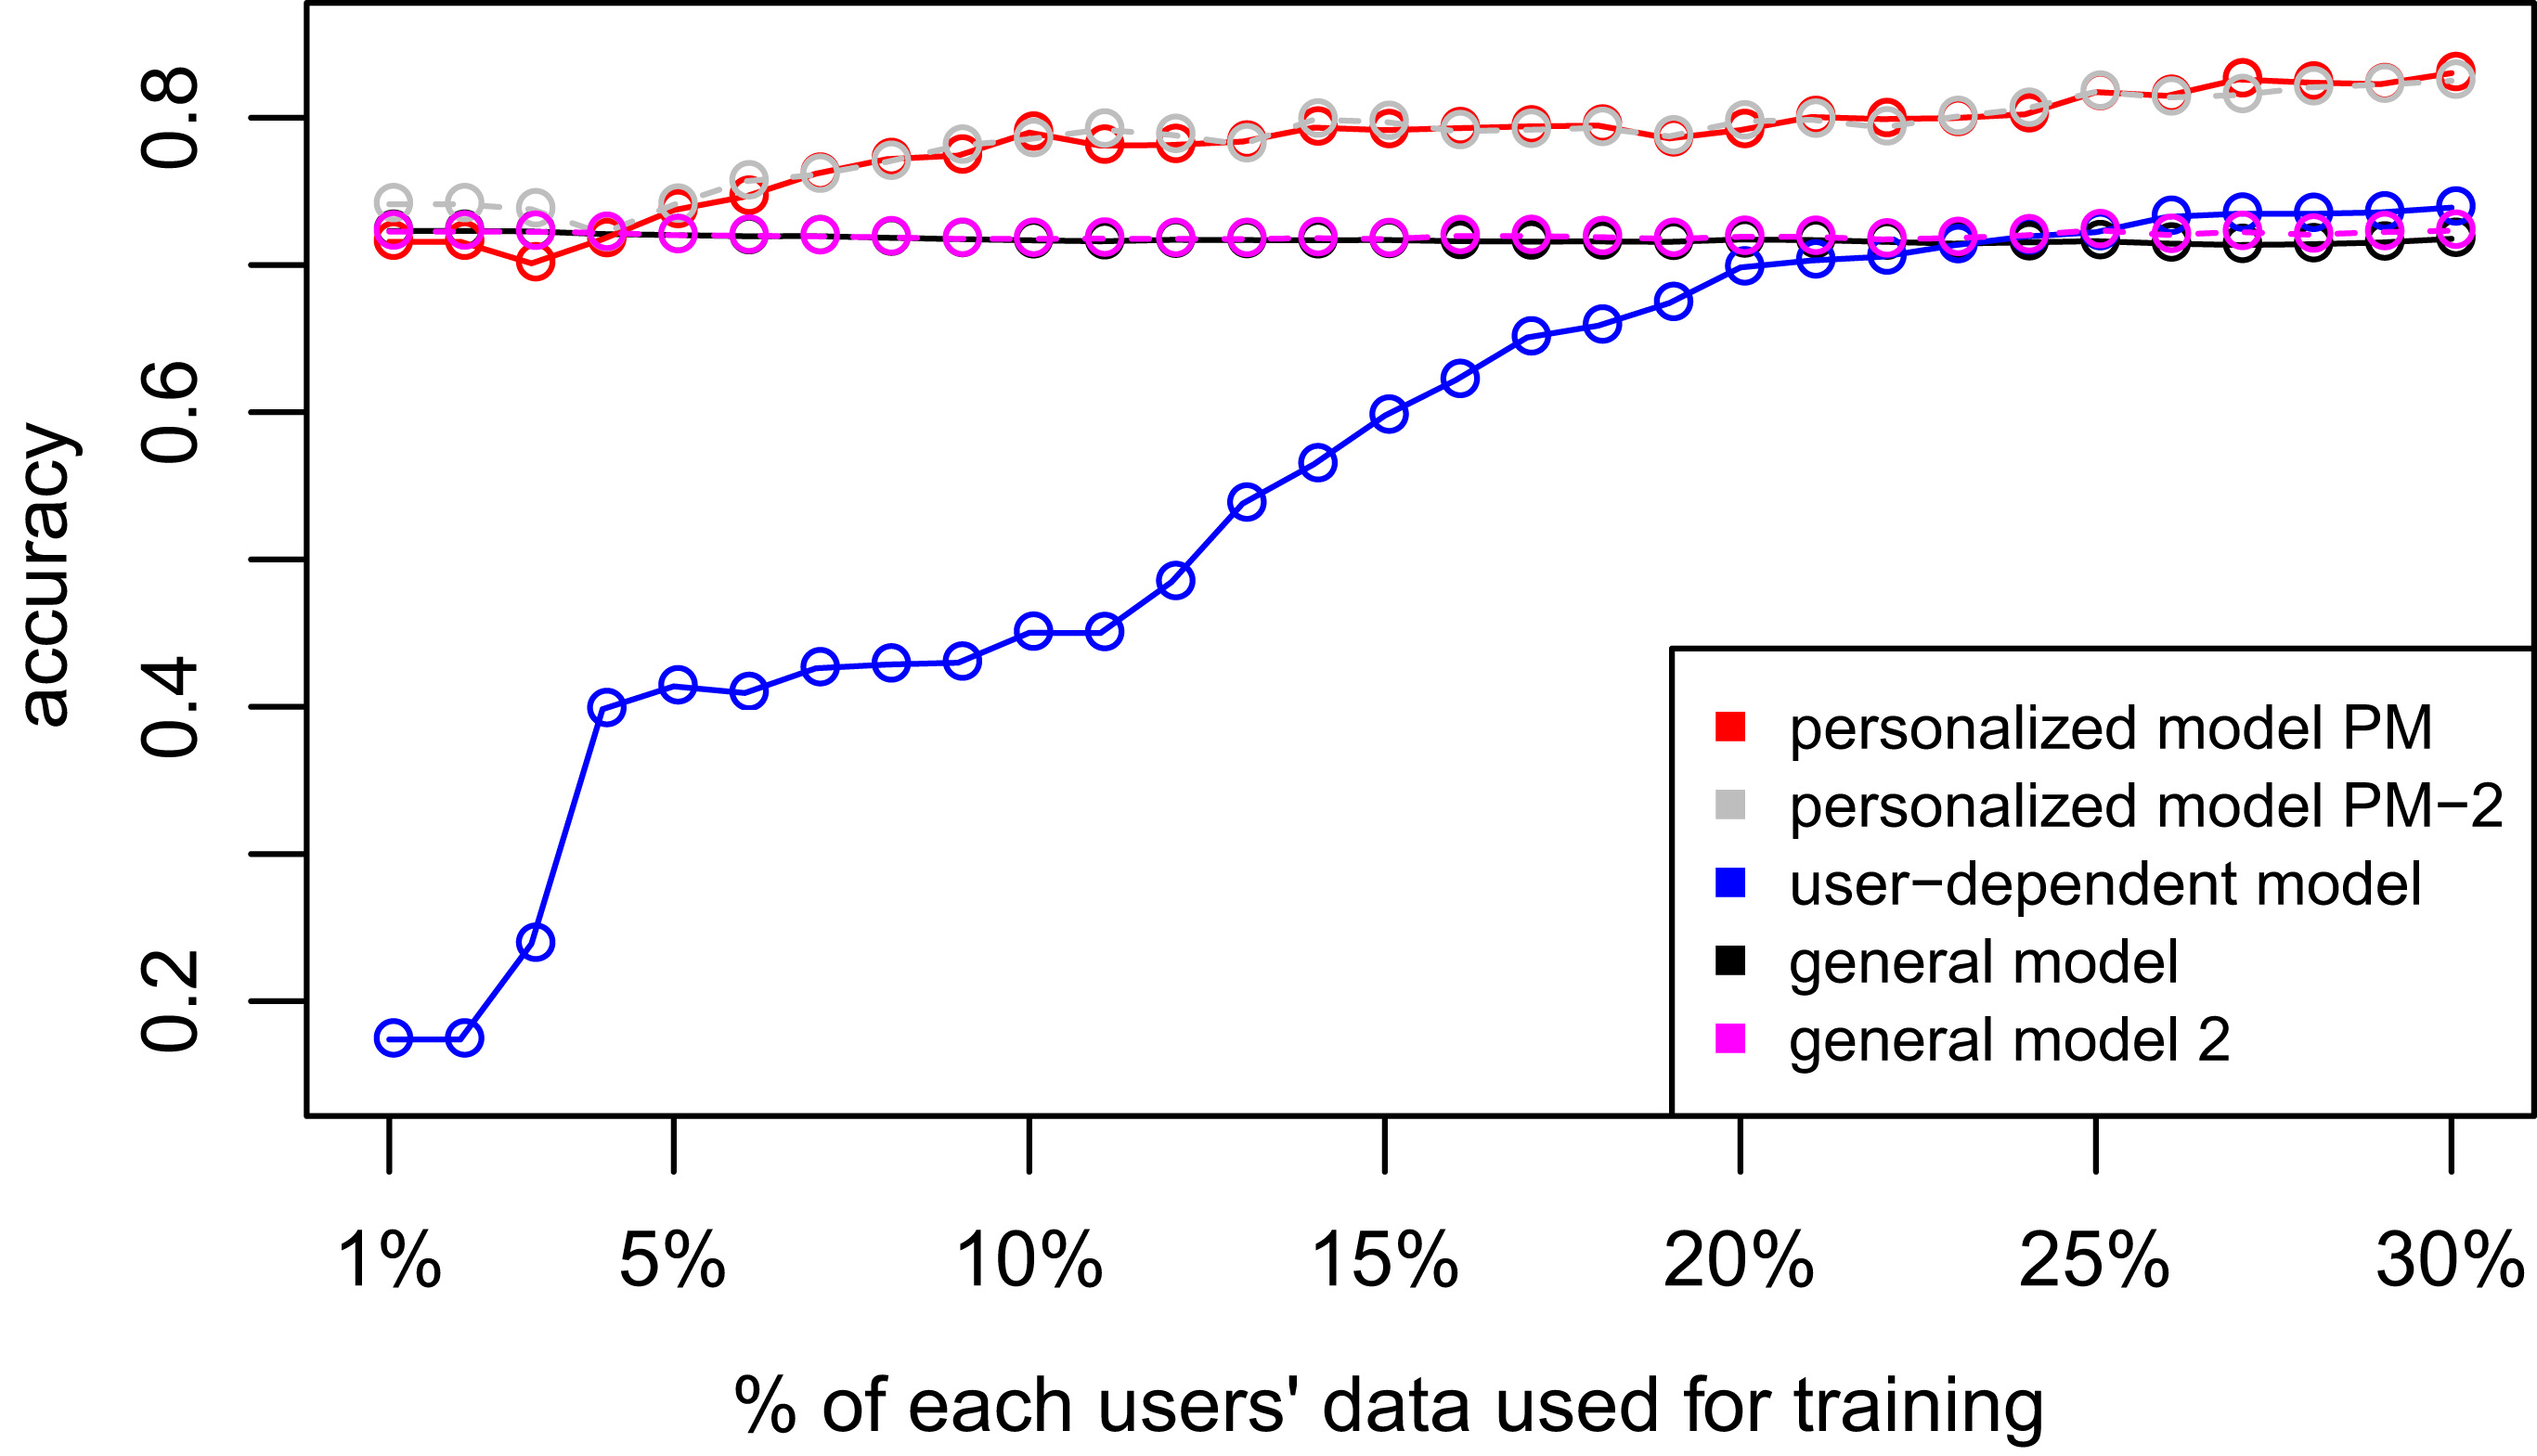

Table 2 shows the distribution of the resulting number of groups selected by the Silhouette index. For datasets D2, D3 and D4 the predominant number of groups was 2. For D1
Tables 4 and 6 show the difference of average overall accuracy and recall (from 1% to 30% of labeled data) between the PM and the other two models. Here we can see how the PM significantly outperforms the other two models in all datasets except for the accuracy in D2 when comparing PM – UDM, case in which the difference is negative. This may be due to the user-class sparsity of the dataset, i.e., some users just performed a small subset of the activities. This situation will introduce noise to the PM. In the extreme case when a user has just 1 type of activity, obviously it would be enough to always predict that activity. However, the PM is trained with the entire set of possible labels from all other users in which case the model will predict labels that are not part of that user. To confirm this, we visualized and quantified the user-class sparsity of the datasets and performed further experiments. First we computed the user-class sparsity matrices for each dataset. These matrices are generated by plotting what activities were performed by each user. A cell in the matrix is set to 1 if a user performed an activity and 0 otherwise. The sparsity index is computed as 1 minus the proportion of 1 s in the matrix. In datasets D1 and D4 all users performed all activities giving a sparsity index of 0. Figures 6 and 6 show the user-class sparsity matrices of datasets D2 and D3 respectively. D2 has a sparsity index of 0.6 whereas for D3 it is 0.18. For D2 this index is very high (more than half of the entries in the matrix are 0); further, the number of classes for this dataset is also high (12). From the matrix we can see that several users performed just a small number of activities (in some cases just 1 or 2 activities). One way to deal with this situation is to train the model excluding activities from other users that were not performed by the target user. Figures 2–4 (gray dotted line PM-2) show the results of excluding types of activities that are not in
| avg. #instances/secs. | 1% | 5% | 10% | 15% | 20% |
|---|---|---|---|---|---|
| D1 | 1/4 | 5/20 | 9/36 | 14/56 | 18/72 |
| D2 | 1/4 | 1/4 | 2/8 | 3/12 | 3/12 |
| D3 | 1/10 | 2/20 | 3/30 | 4/40 | 5/50 |
| D4 | 1/2.5 | 3/7.6 | 6/15.3 | 9/23.0 | 12/30.7 |
Difference of average overall accuracy (from 1% to 30% of labeled data) between the PM and the other two models
| PM-GM | PM-UDM | |
|---|---|---|
| D1 | 15.5% | 8.6% |
| D2 | 18.1% | 13.9% |
| D3 | 7.4% | 34.4% |
| D4 | 4% | 28% |
Mean overall accuracy between 1% and 30% of training data for different clustering quality indices (PM-2)
D2: Wrist sensor dataset user-class sparsity matrix. D3: WISDM dataset user-class sparsity matrix.

Since the method selects just the similar classes, it may introduce some class imbalance [37]. To account for this, we used the oversampling method called SMOTE [18] to make sure the classes are balanced. Figure 7 shows a comparison between PM-2 and PM-SMOTE, which adds the oversampling step before building the final classifier. In this figure we can see that performing the oversampling did not produce any significant improvement on the results (we did the comparison for all 4 datasets with similar results).
Results of the statistical tests with 95% confidence intervals.
D3: WISDM dataset. Comparison between PM-2 and PM-2 with SMOTE oversampling.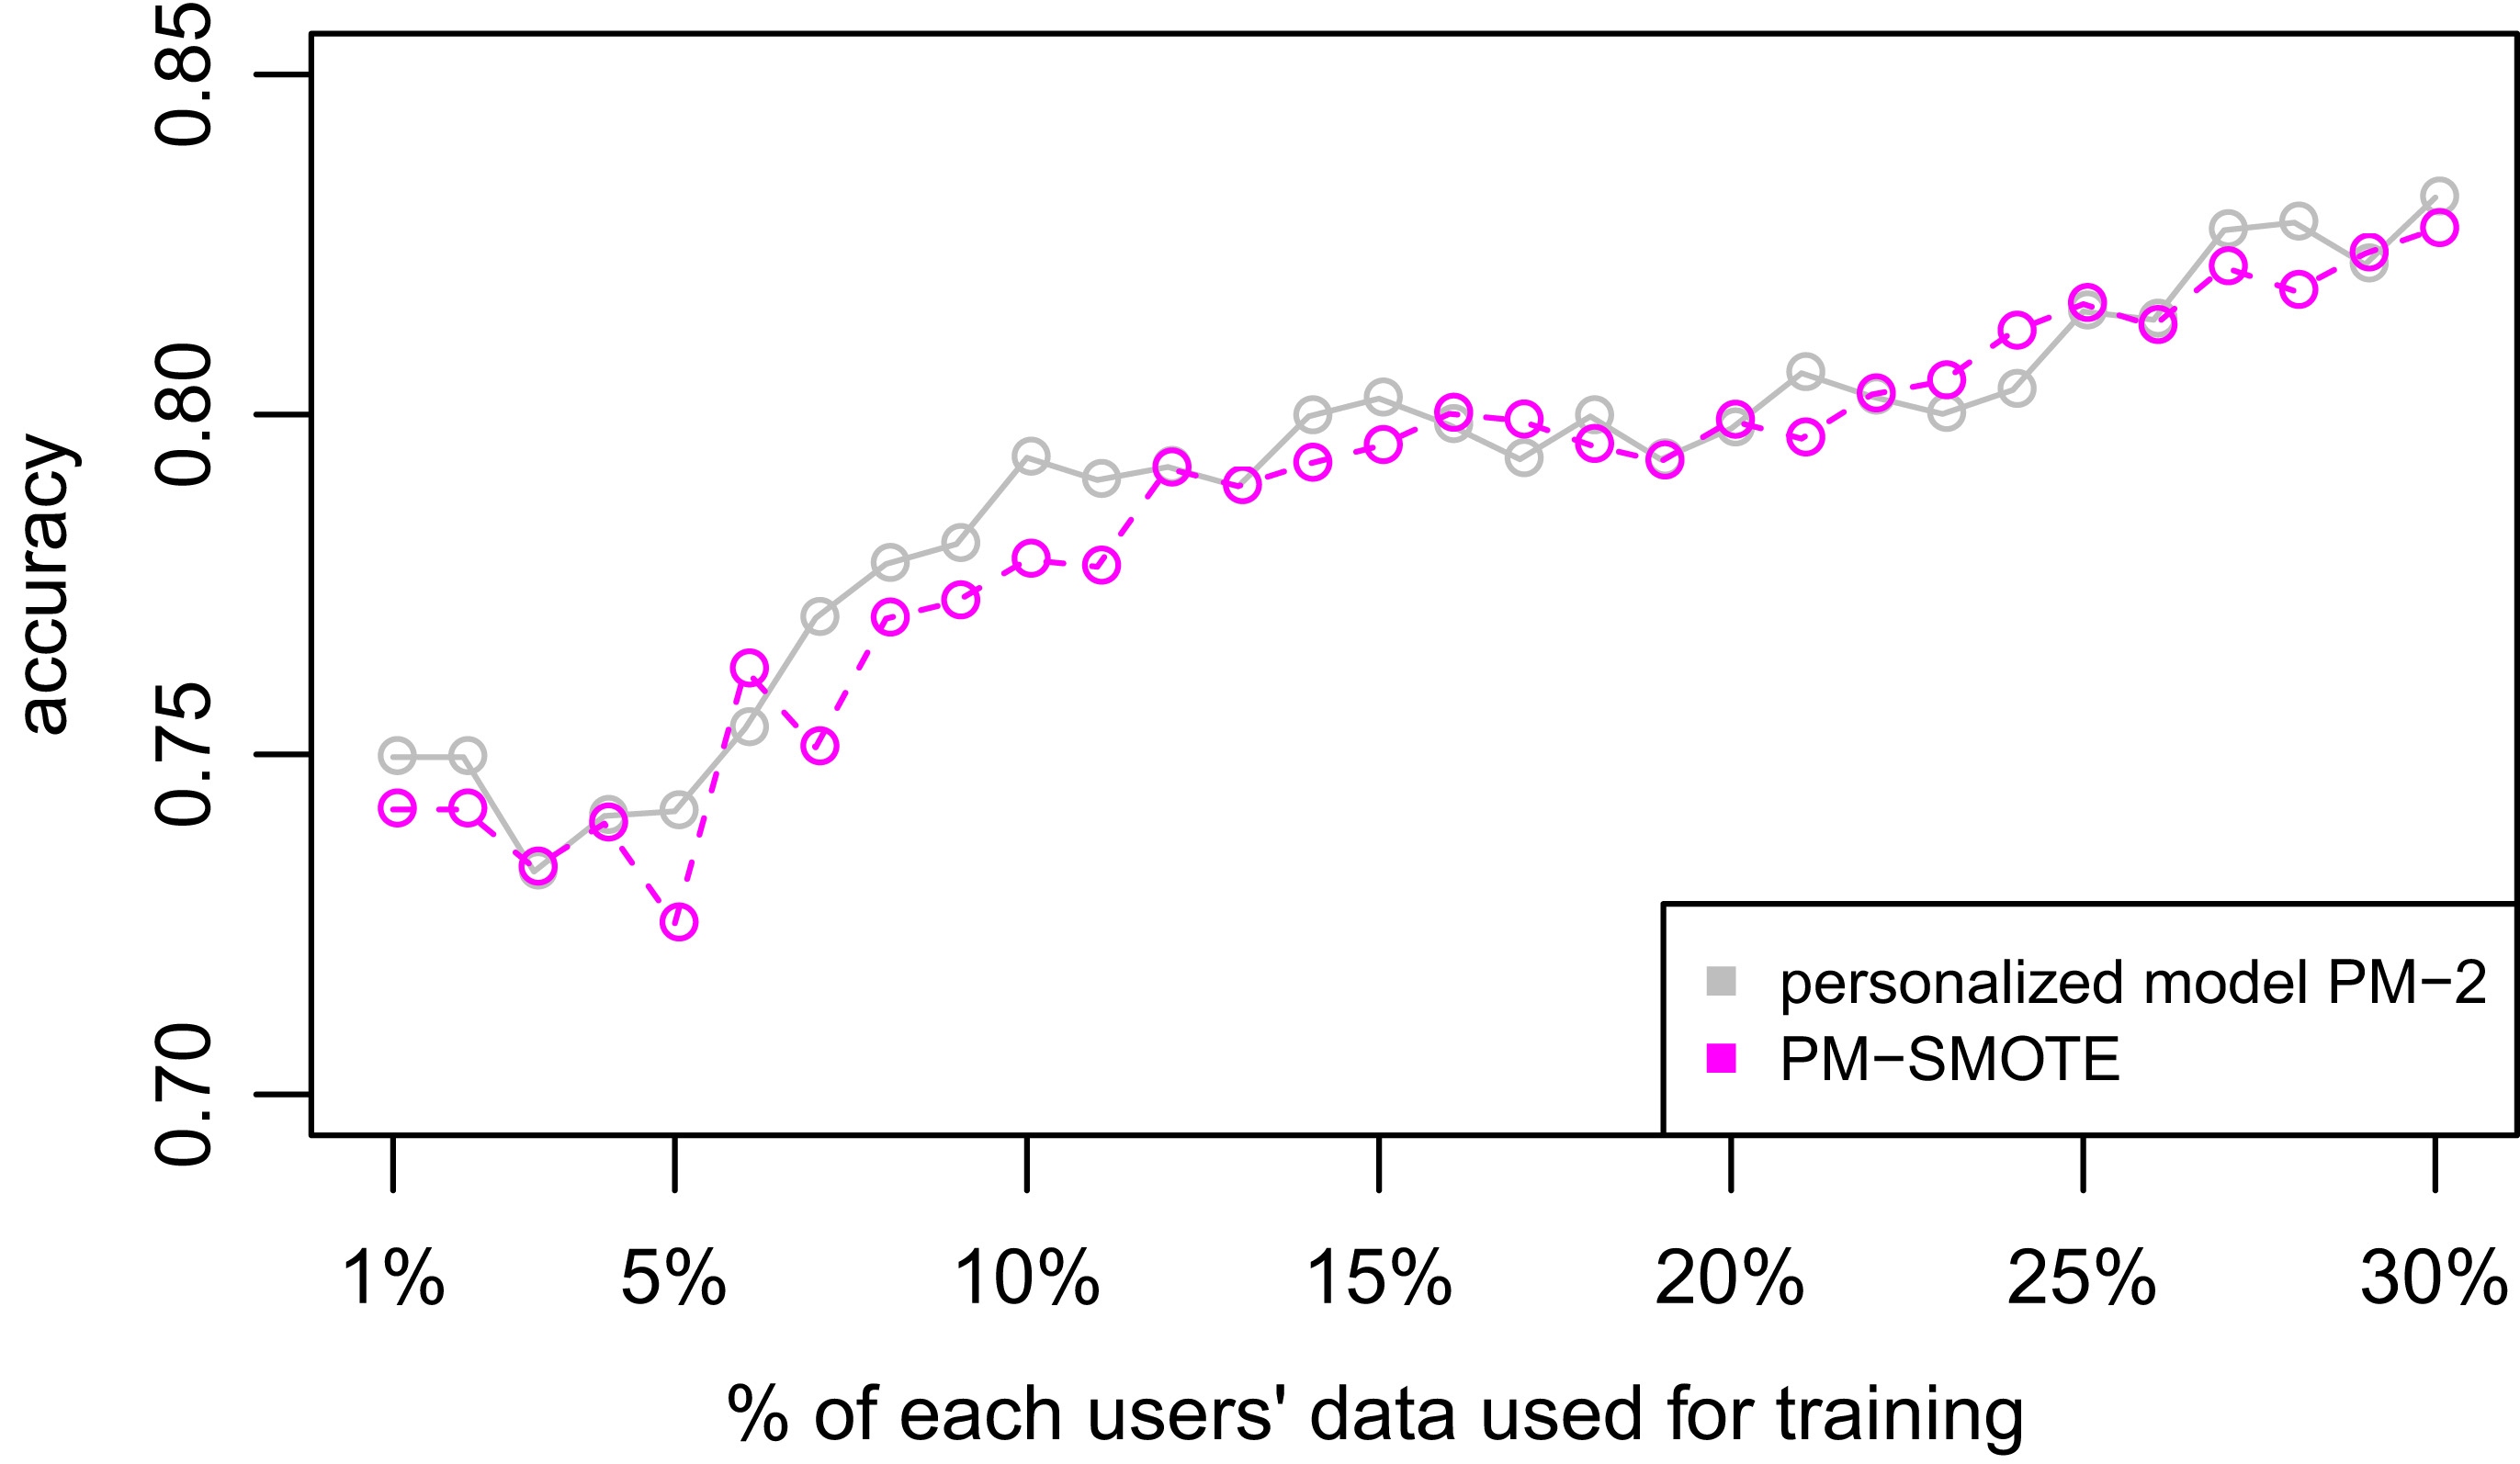
We also evaluated the impact of choosing another clustering quality index to identify the optimal number of groups for Algorithm 1. In this case we also tested with the PBM index which was chosen because it is more recent and in the original paper [57] it was claimed that the results were superior than other previously proposed indices. Table 6 shows the comparison between using Silhouette and PBM indices for the mean overall accuracy between 1% and 30% of training data (PM-2). The results show that there is no significant difference in the selection between the two clustering quality indices.
Figures 8–11 show the resulting confusion matrices. The anti-diagonal represents the recall of each individual activity. For datasets D1, D2 and D3 the recall of the general model seems to be skewed towards the walking activity which is also the most common one. For the personalized and user-dependent model, the recall is more uniformly distributed (the anti-diagonal has a more solid color). For all the datasets the major source of error was between the walking and stairs activities.
D1: Chest sensor dataset confusion matrix.
D2: Wrist sensor dataset confusion matrix.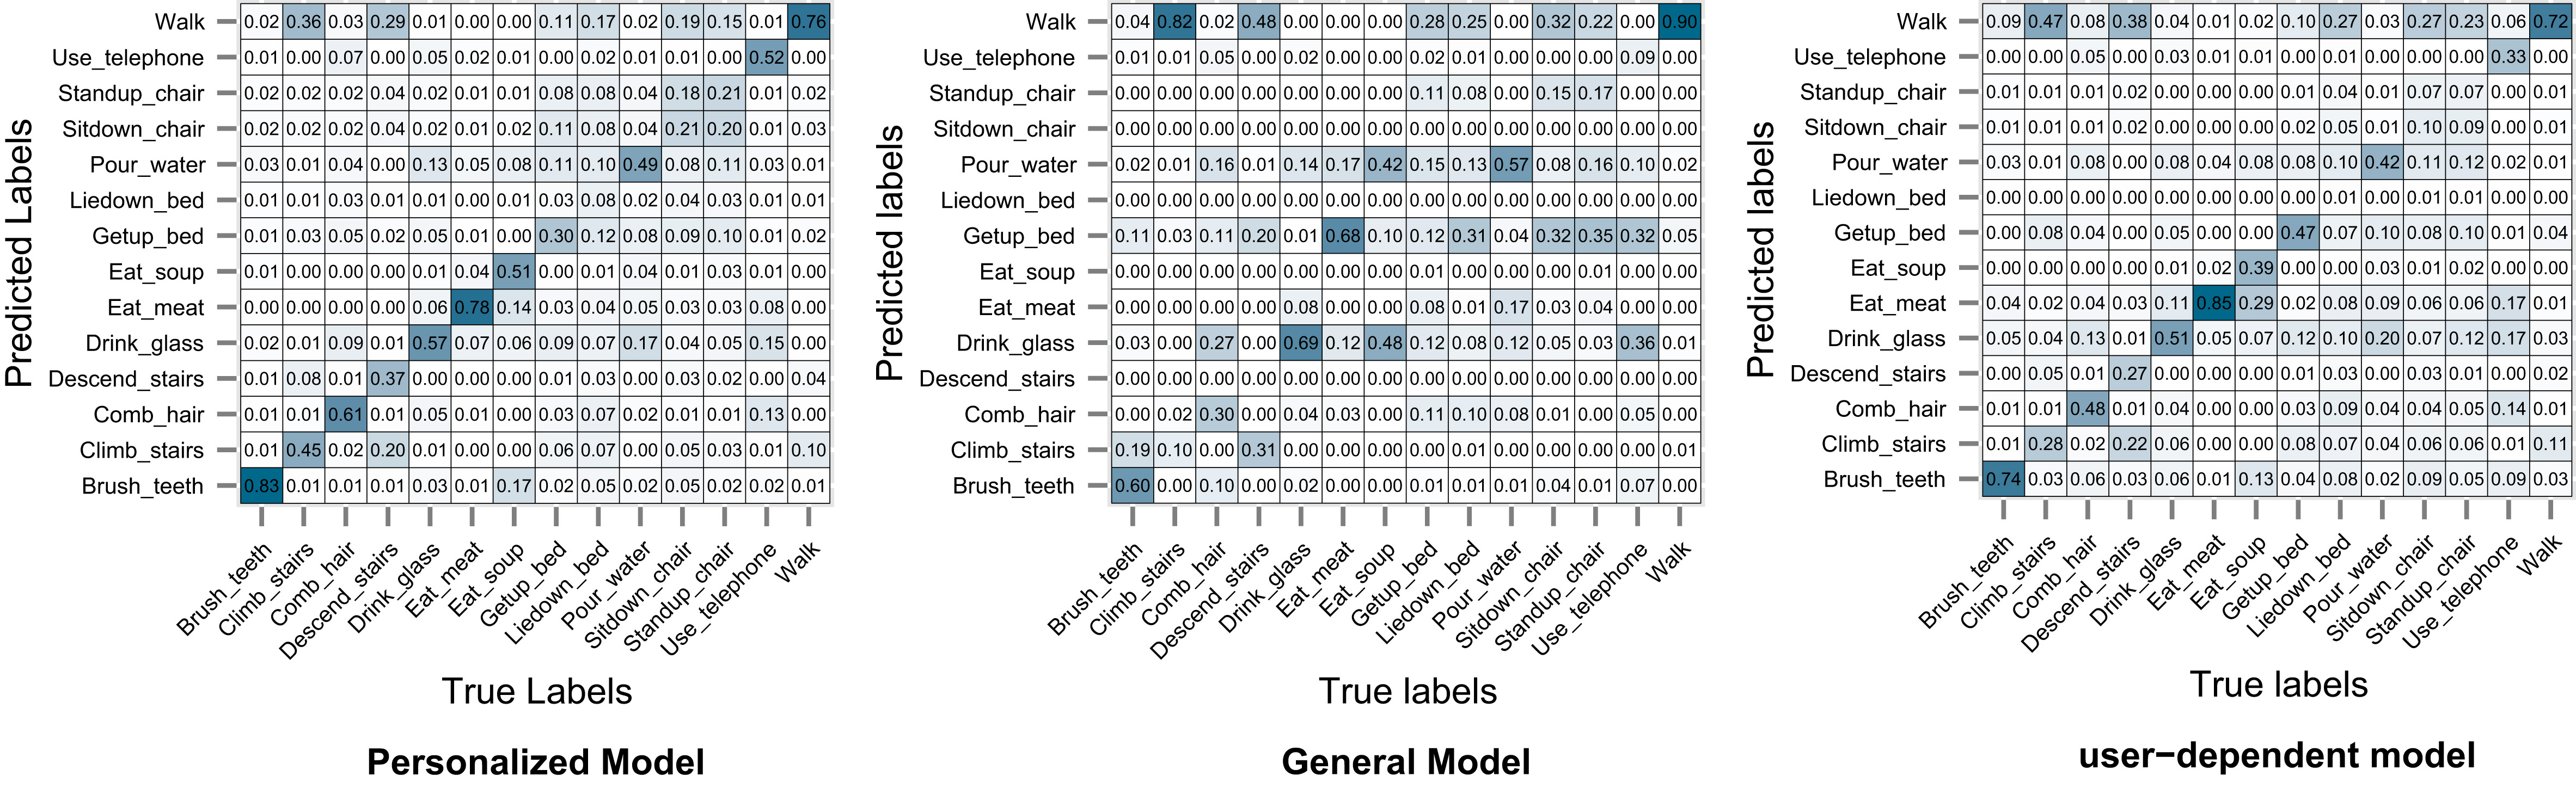
D3: WISDM sensor dataset confusion matrix.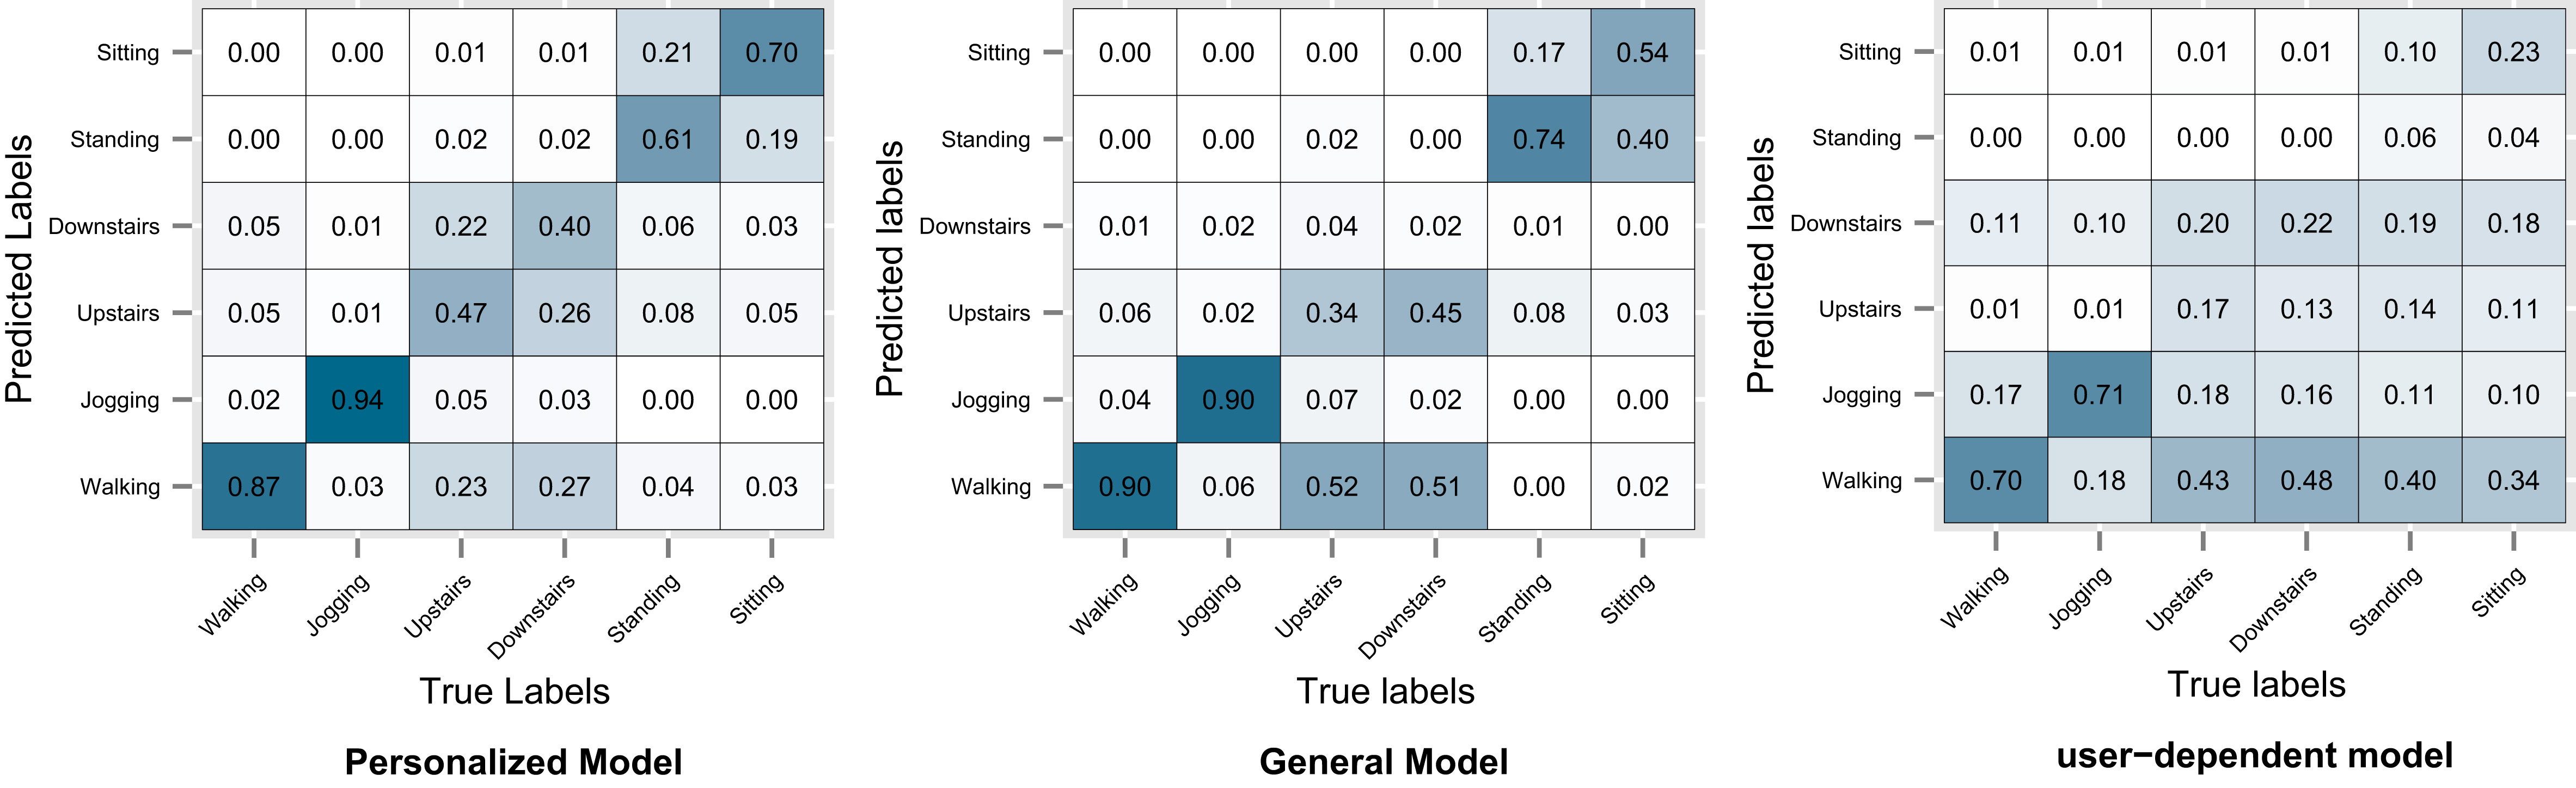
D4: Activities dataset confusion matrix.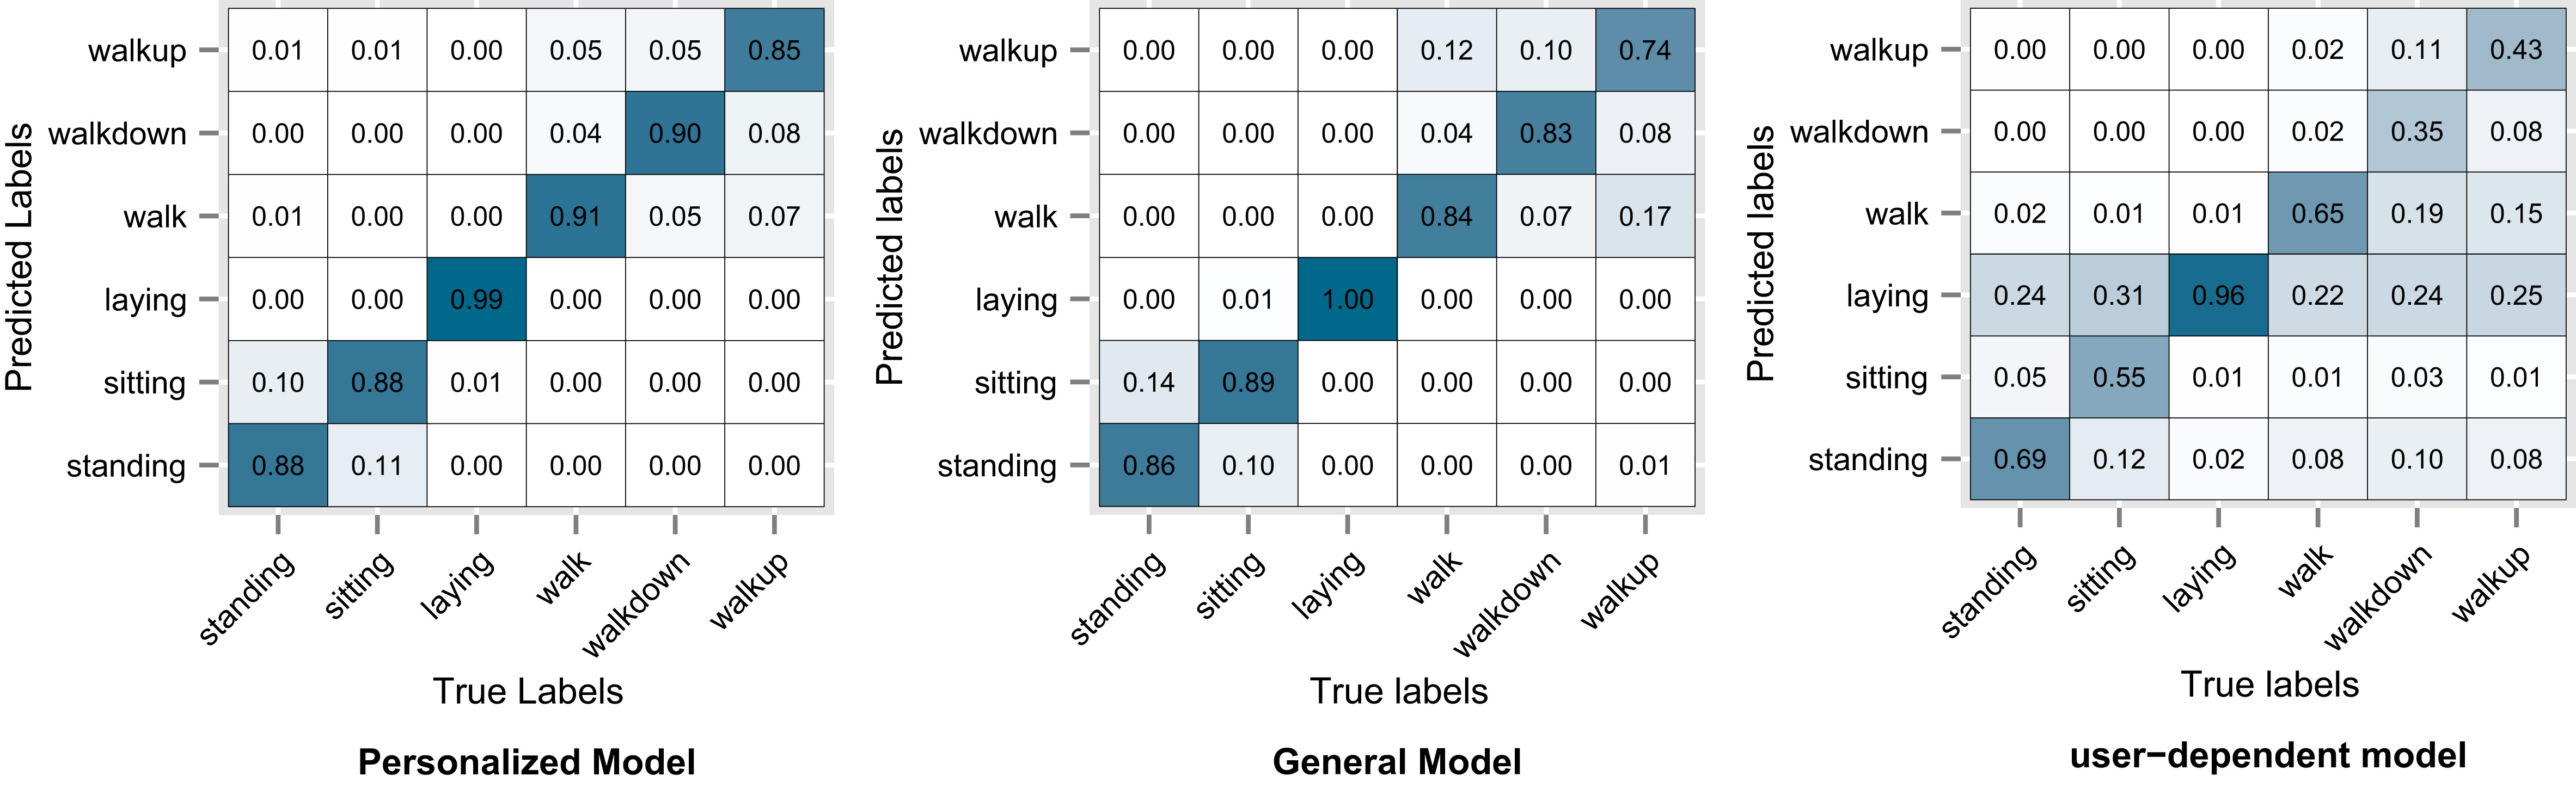
To validate our results we used a two-tail paired t-test with a significance level
D1: Chest sensor dataset box plots.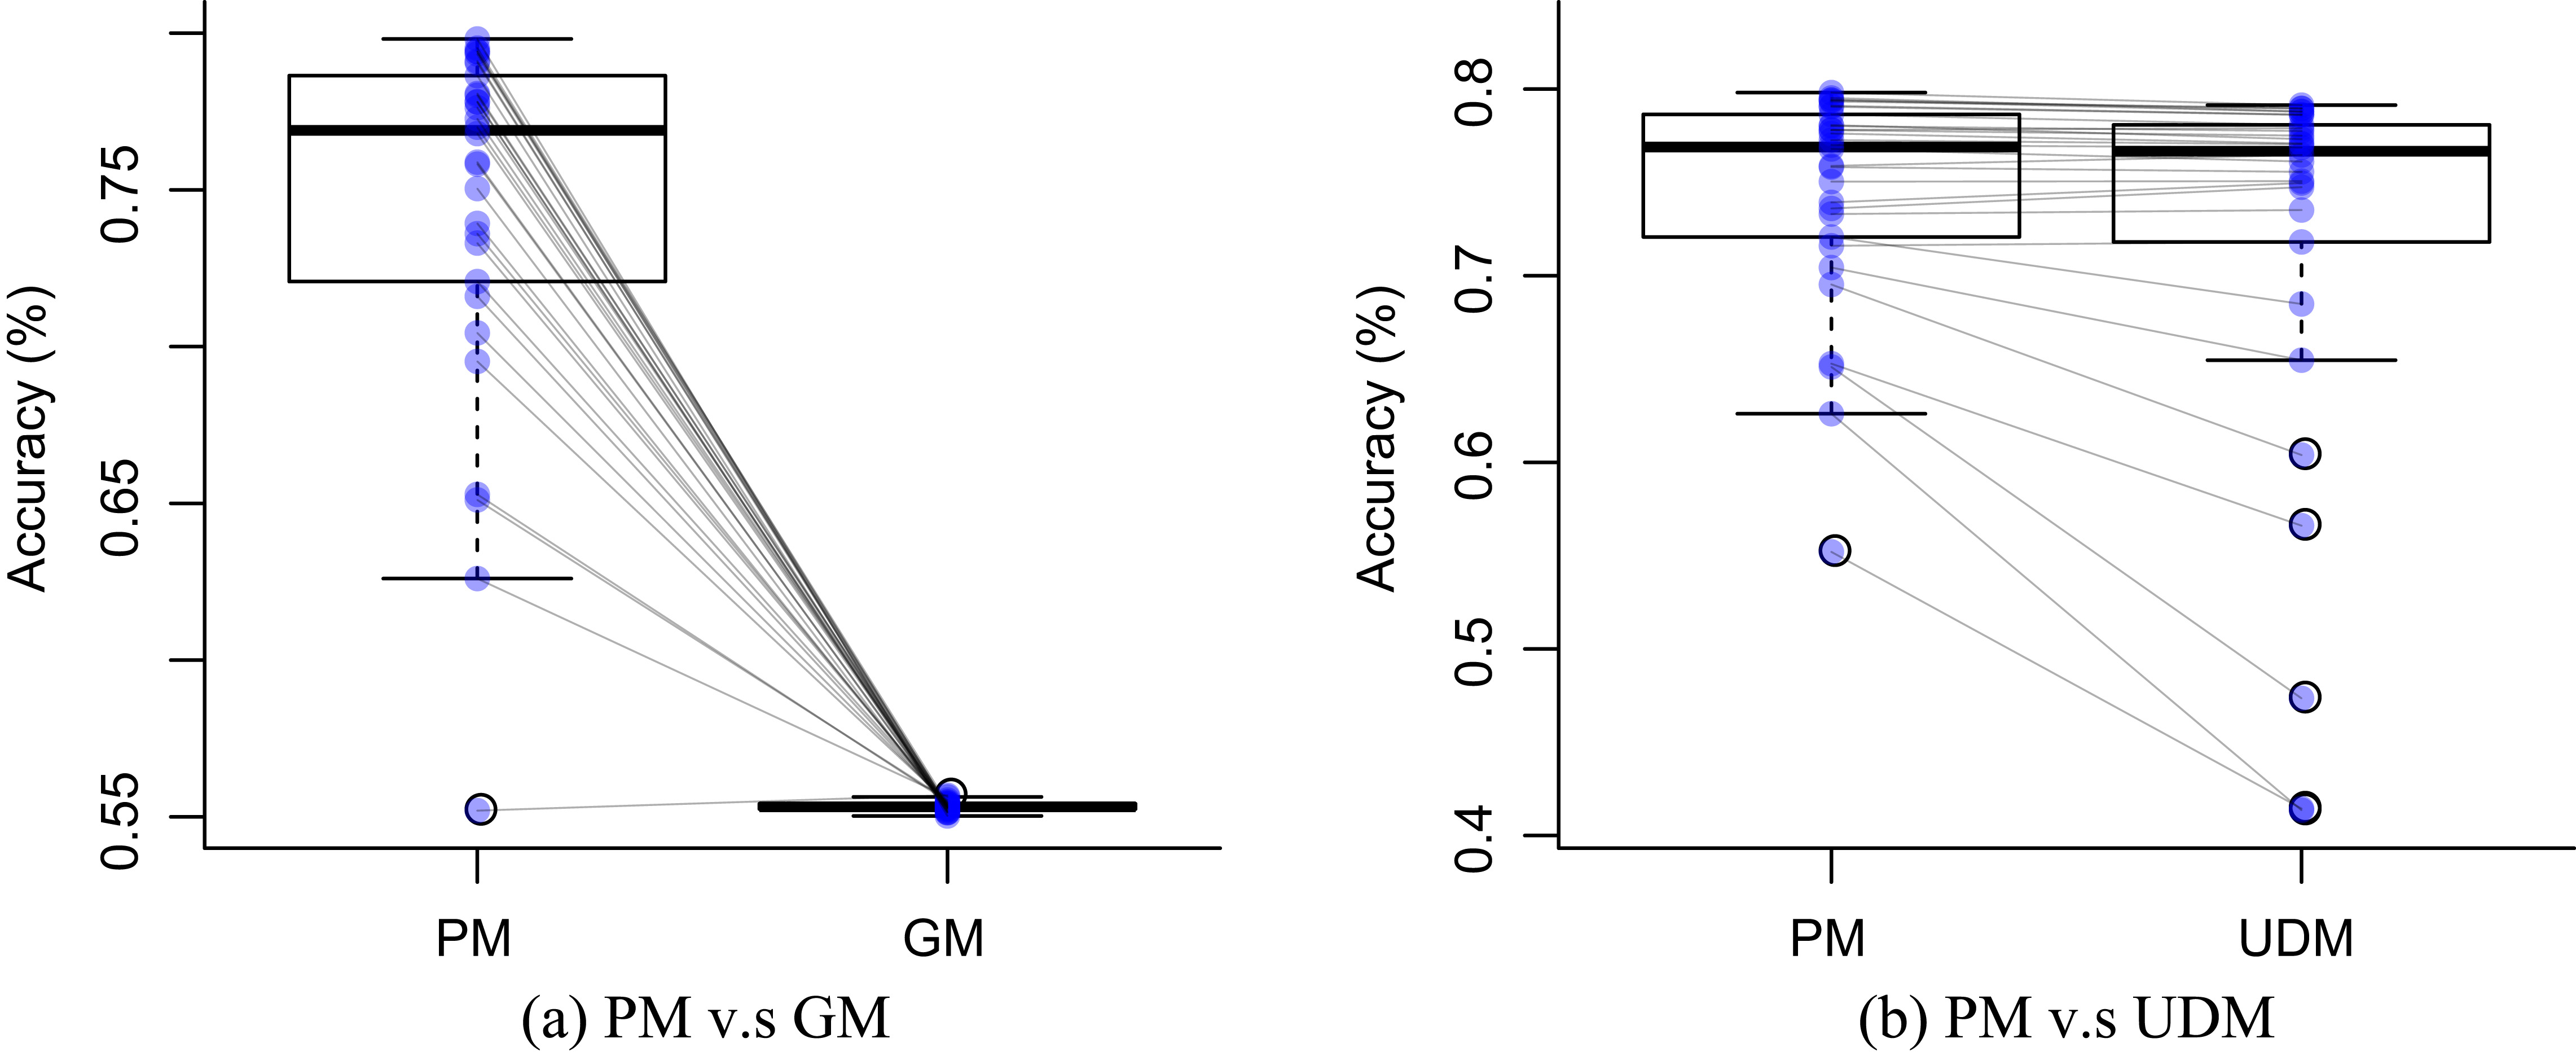
D2: Wrist sensor dataset box plots.
D3: WISDM sensor dataset box plots.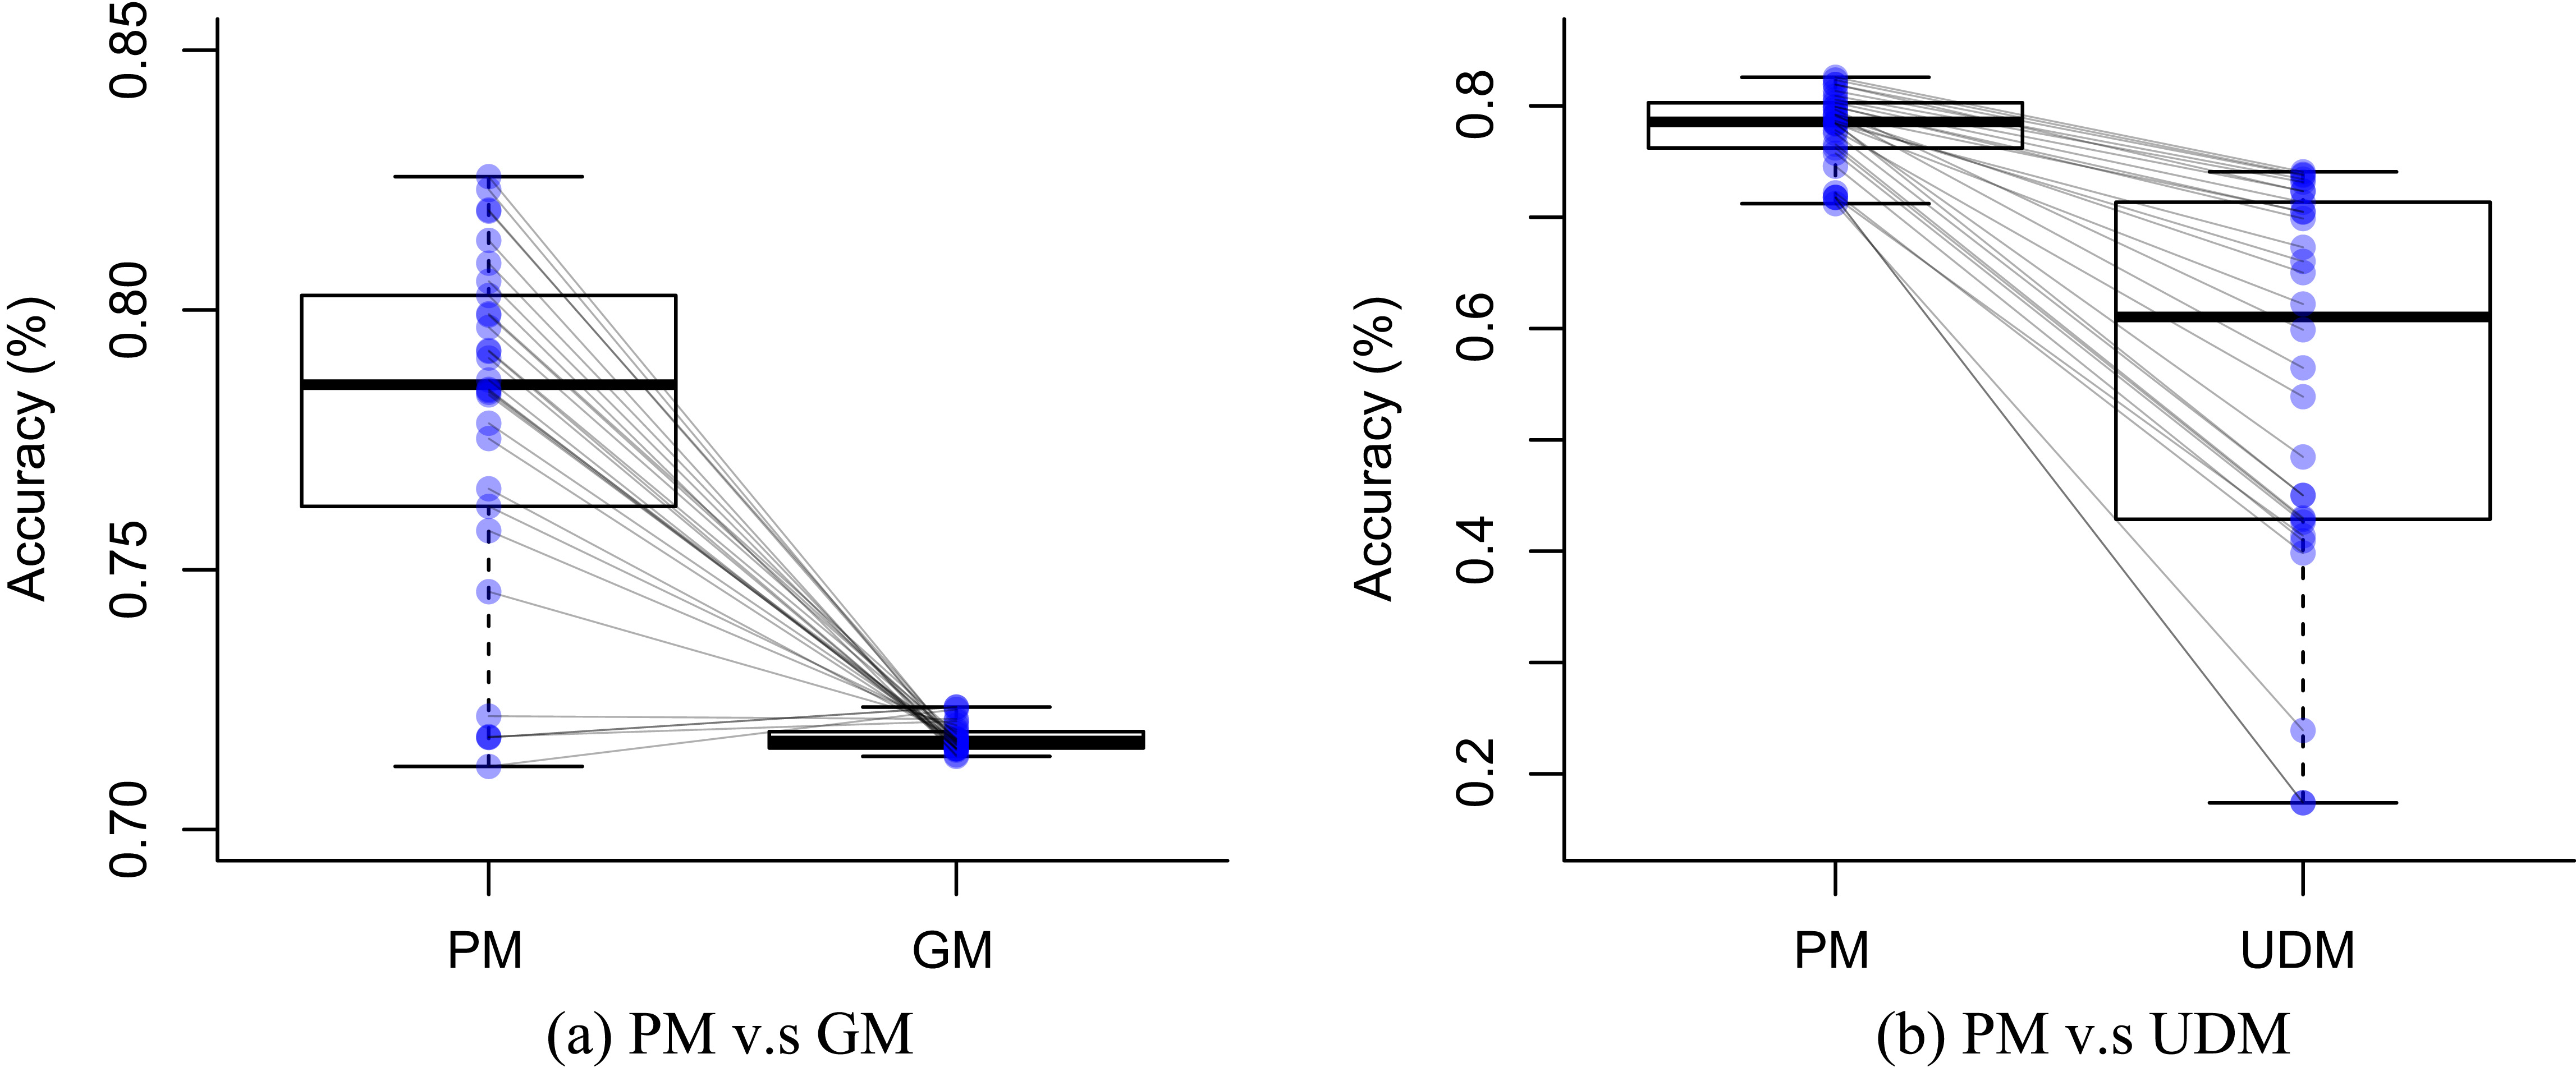
D4: Activities dataset box plots.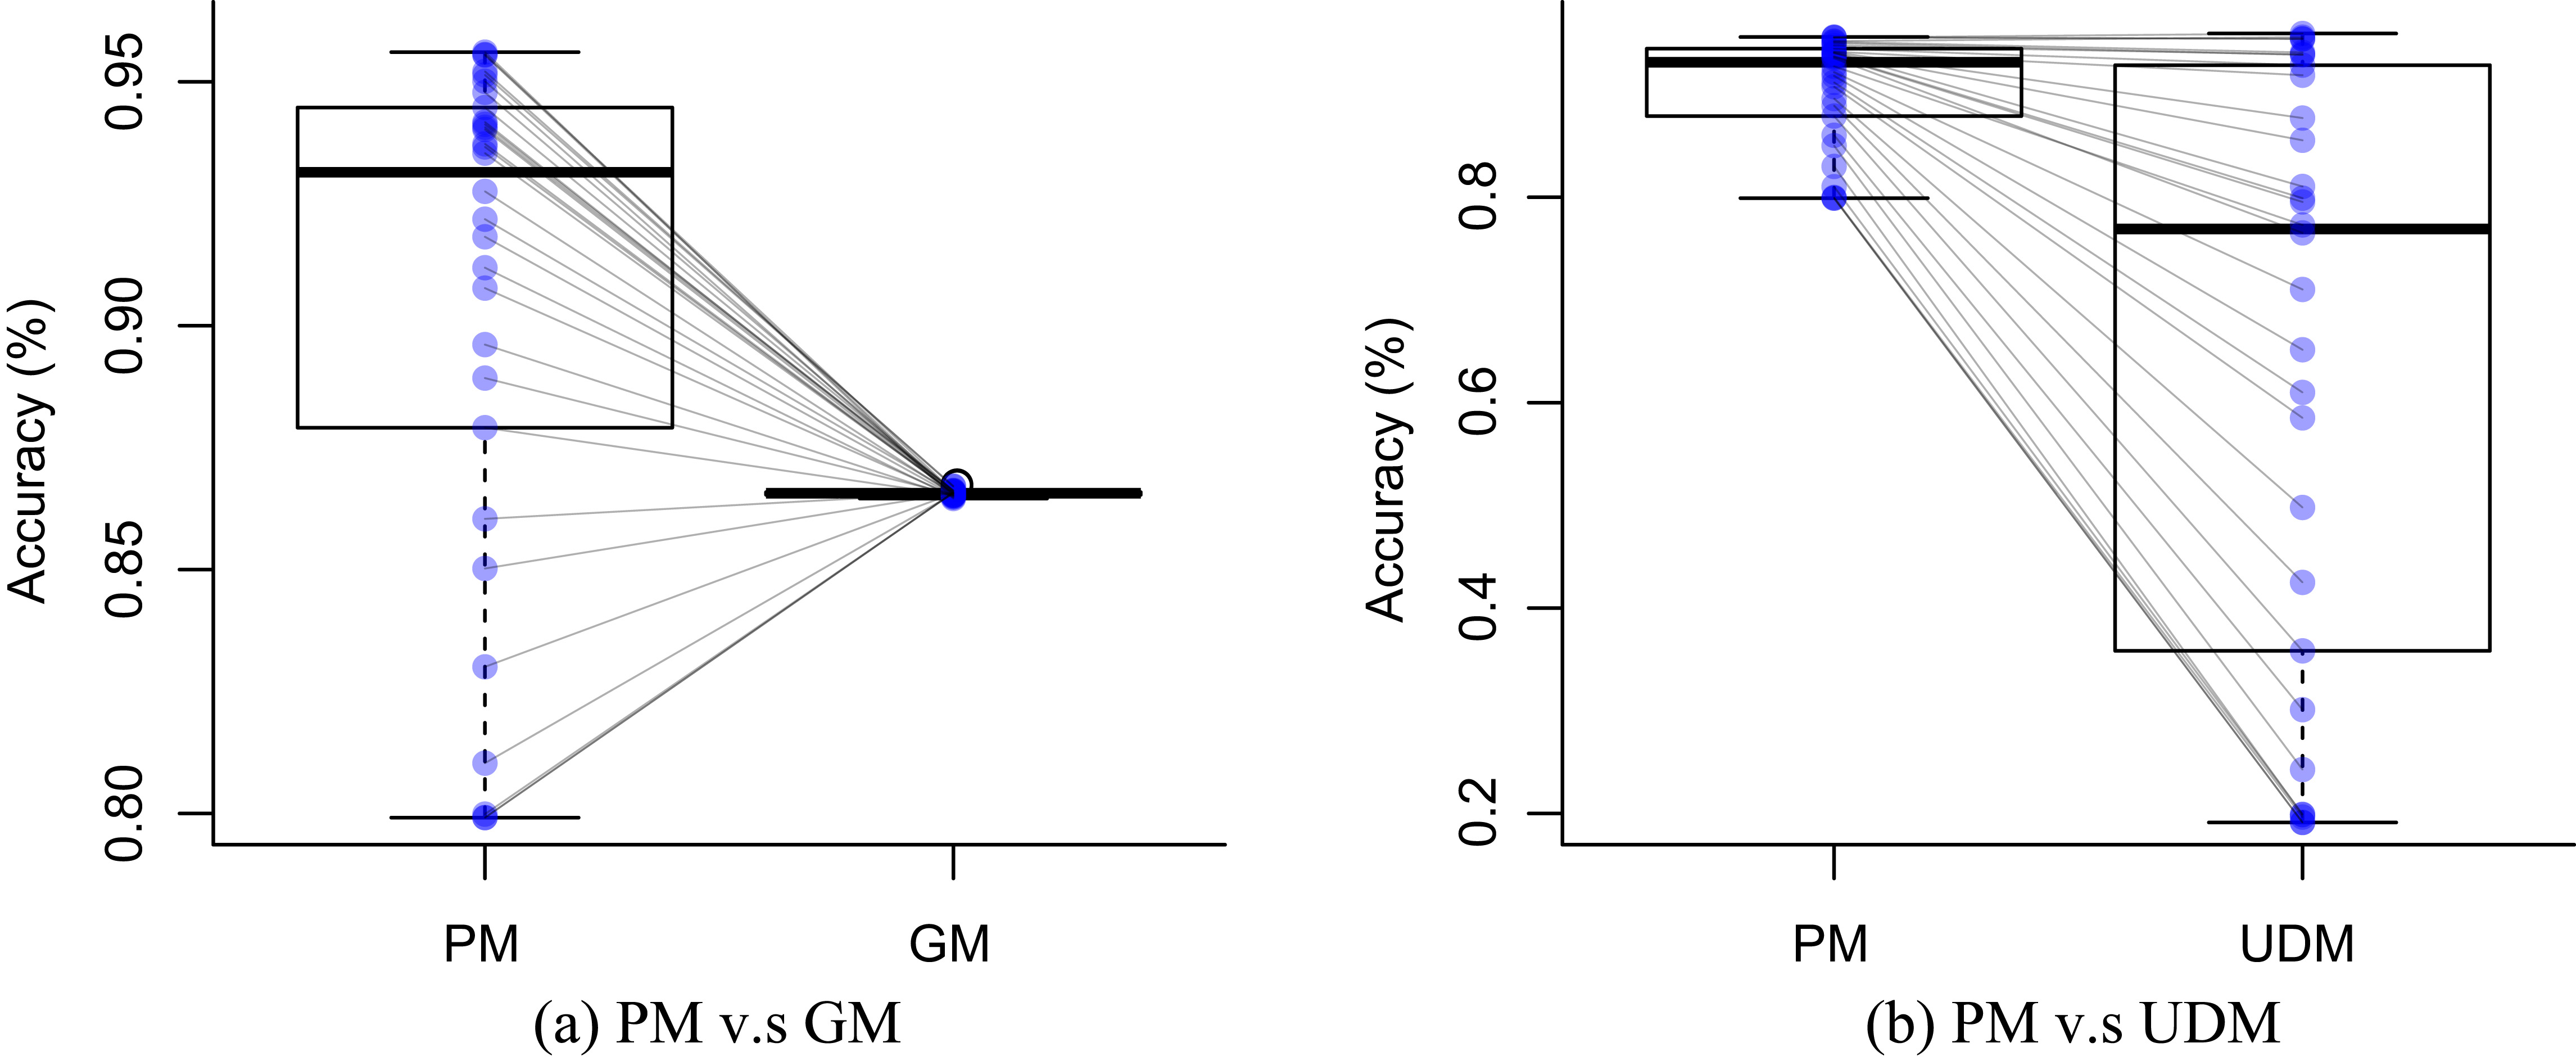
We have presented a “crowdsourcing” method for taking advantage of training data from a community of users in order to get data useful for personalizing a device for a given user, improving the accuracy in recognizing human physical activities. With this approach, we can get the benefits of personalized training reducing drastically the effort of a painful individual training. One of the main insights in our approach is that we select, from the universe of training data generated by the community of users, the data of users which behave in a most similar way to the user under consideration.
We evaluated the proposed method on 4 independent human activity datasets. The experimental data shows that with just 5% of users’ training data we can achieve accuracy close to 70% (as for instance in Fig. 2), in situations where the (user-independent) general model gives an accuracy below 60% and a user-dependent model (with data just from the considered user) would get an accuracy
The main contribution of our approach is to refine the community data identifying clusters of classes that behave in a similar way with respect to an activity, and then using training data only from that cluster. In the case of datasets with high sparsity, the performance problems were attenuated to a great extent by excluding types of activities from other users that were not performed by the target user.
One of the limitations of our approach is that it assumes that at least there is a small amount of labeled data; however it does not consider the case when there is no labeled data at all for the considered user. This scenario will be considered in future work. In the present paper we also assumed that the users collected the data using the same type of device, accelerometers in particular. An interesting future direction would be to also take into account the heterogeneity of devices. Another future direction is to intend to carry this type of crowdsourcing-based selection of training data on long-term/complex activities [31, 47], like commuting, shopping, cooking, dining, etc.
Footnotes
Acknowledgments
Enrique Garcia-Ceja would like to thank Consejo Nacional de Ciencia y Tecnología (CONACYT) and the Intelligent Systems research group at Tecnologico de Monterrey for the financial support in his PhD. studies.
A. Appendix
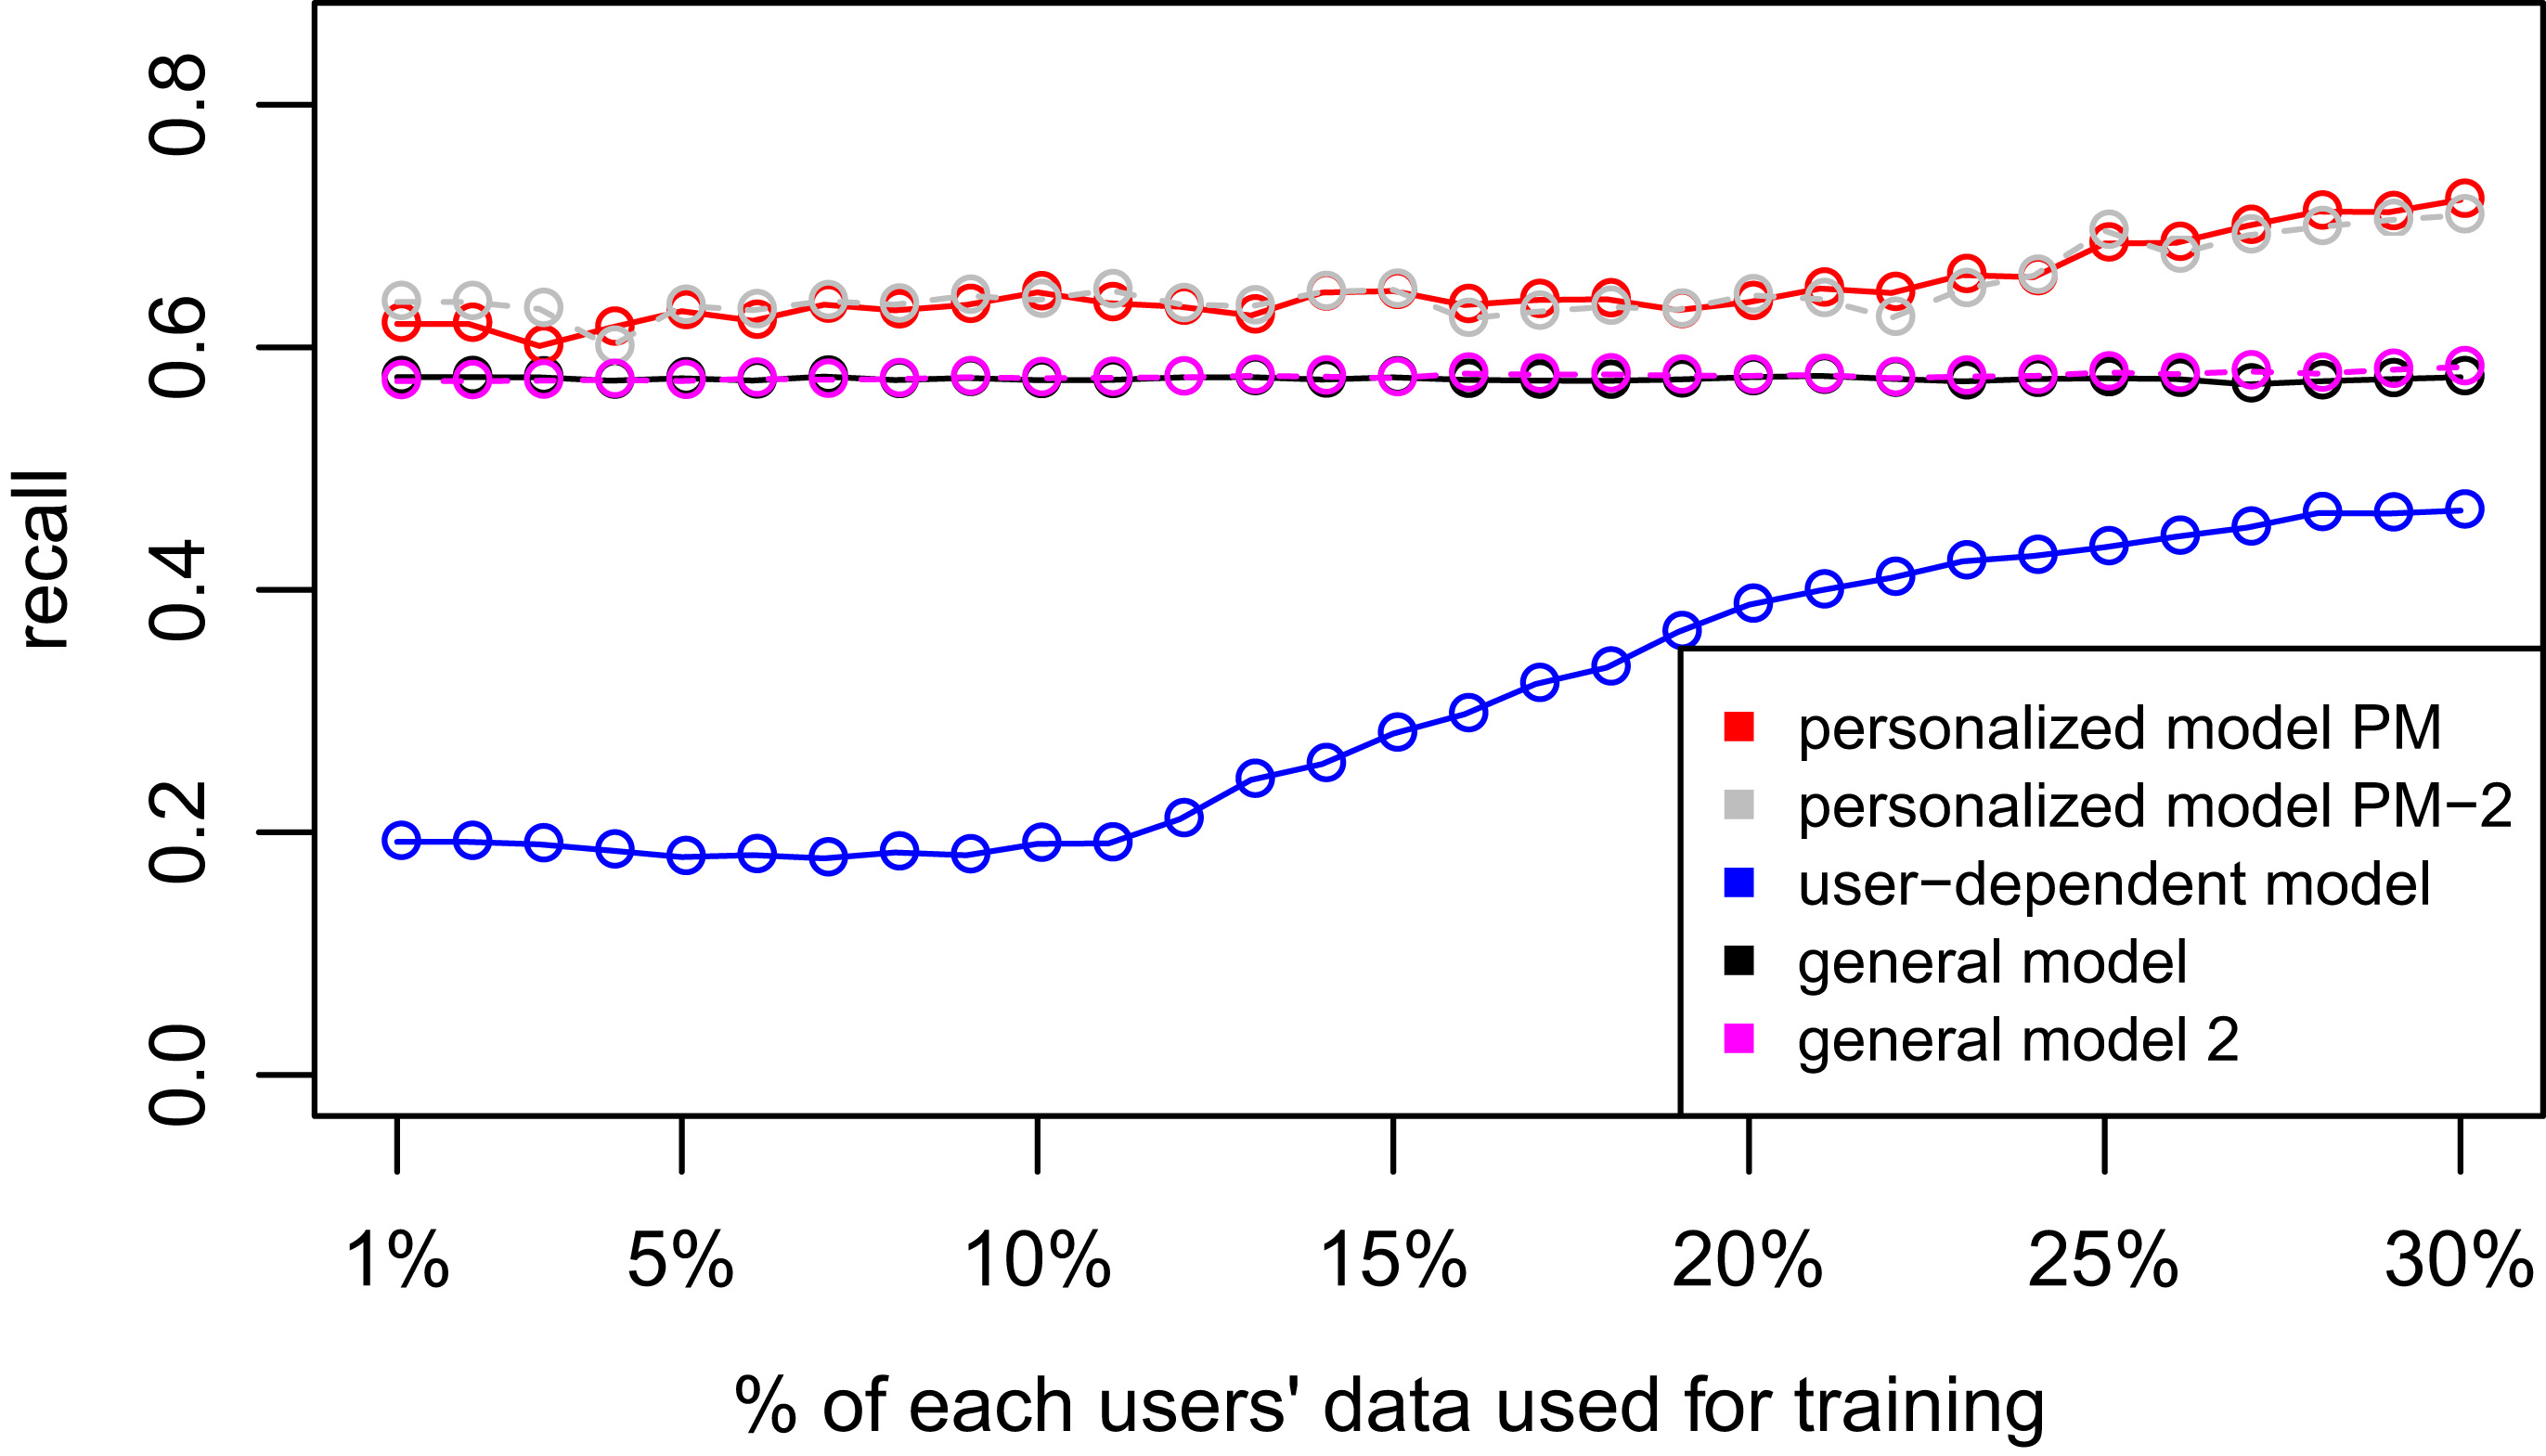
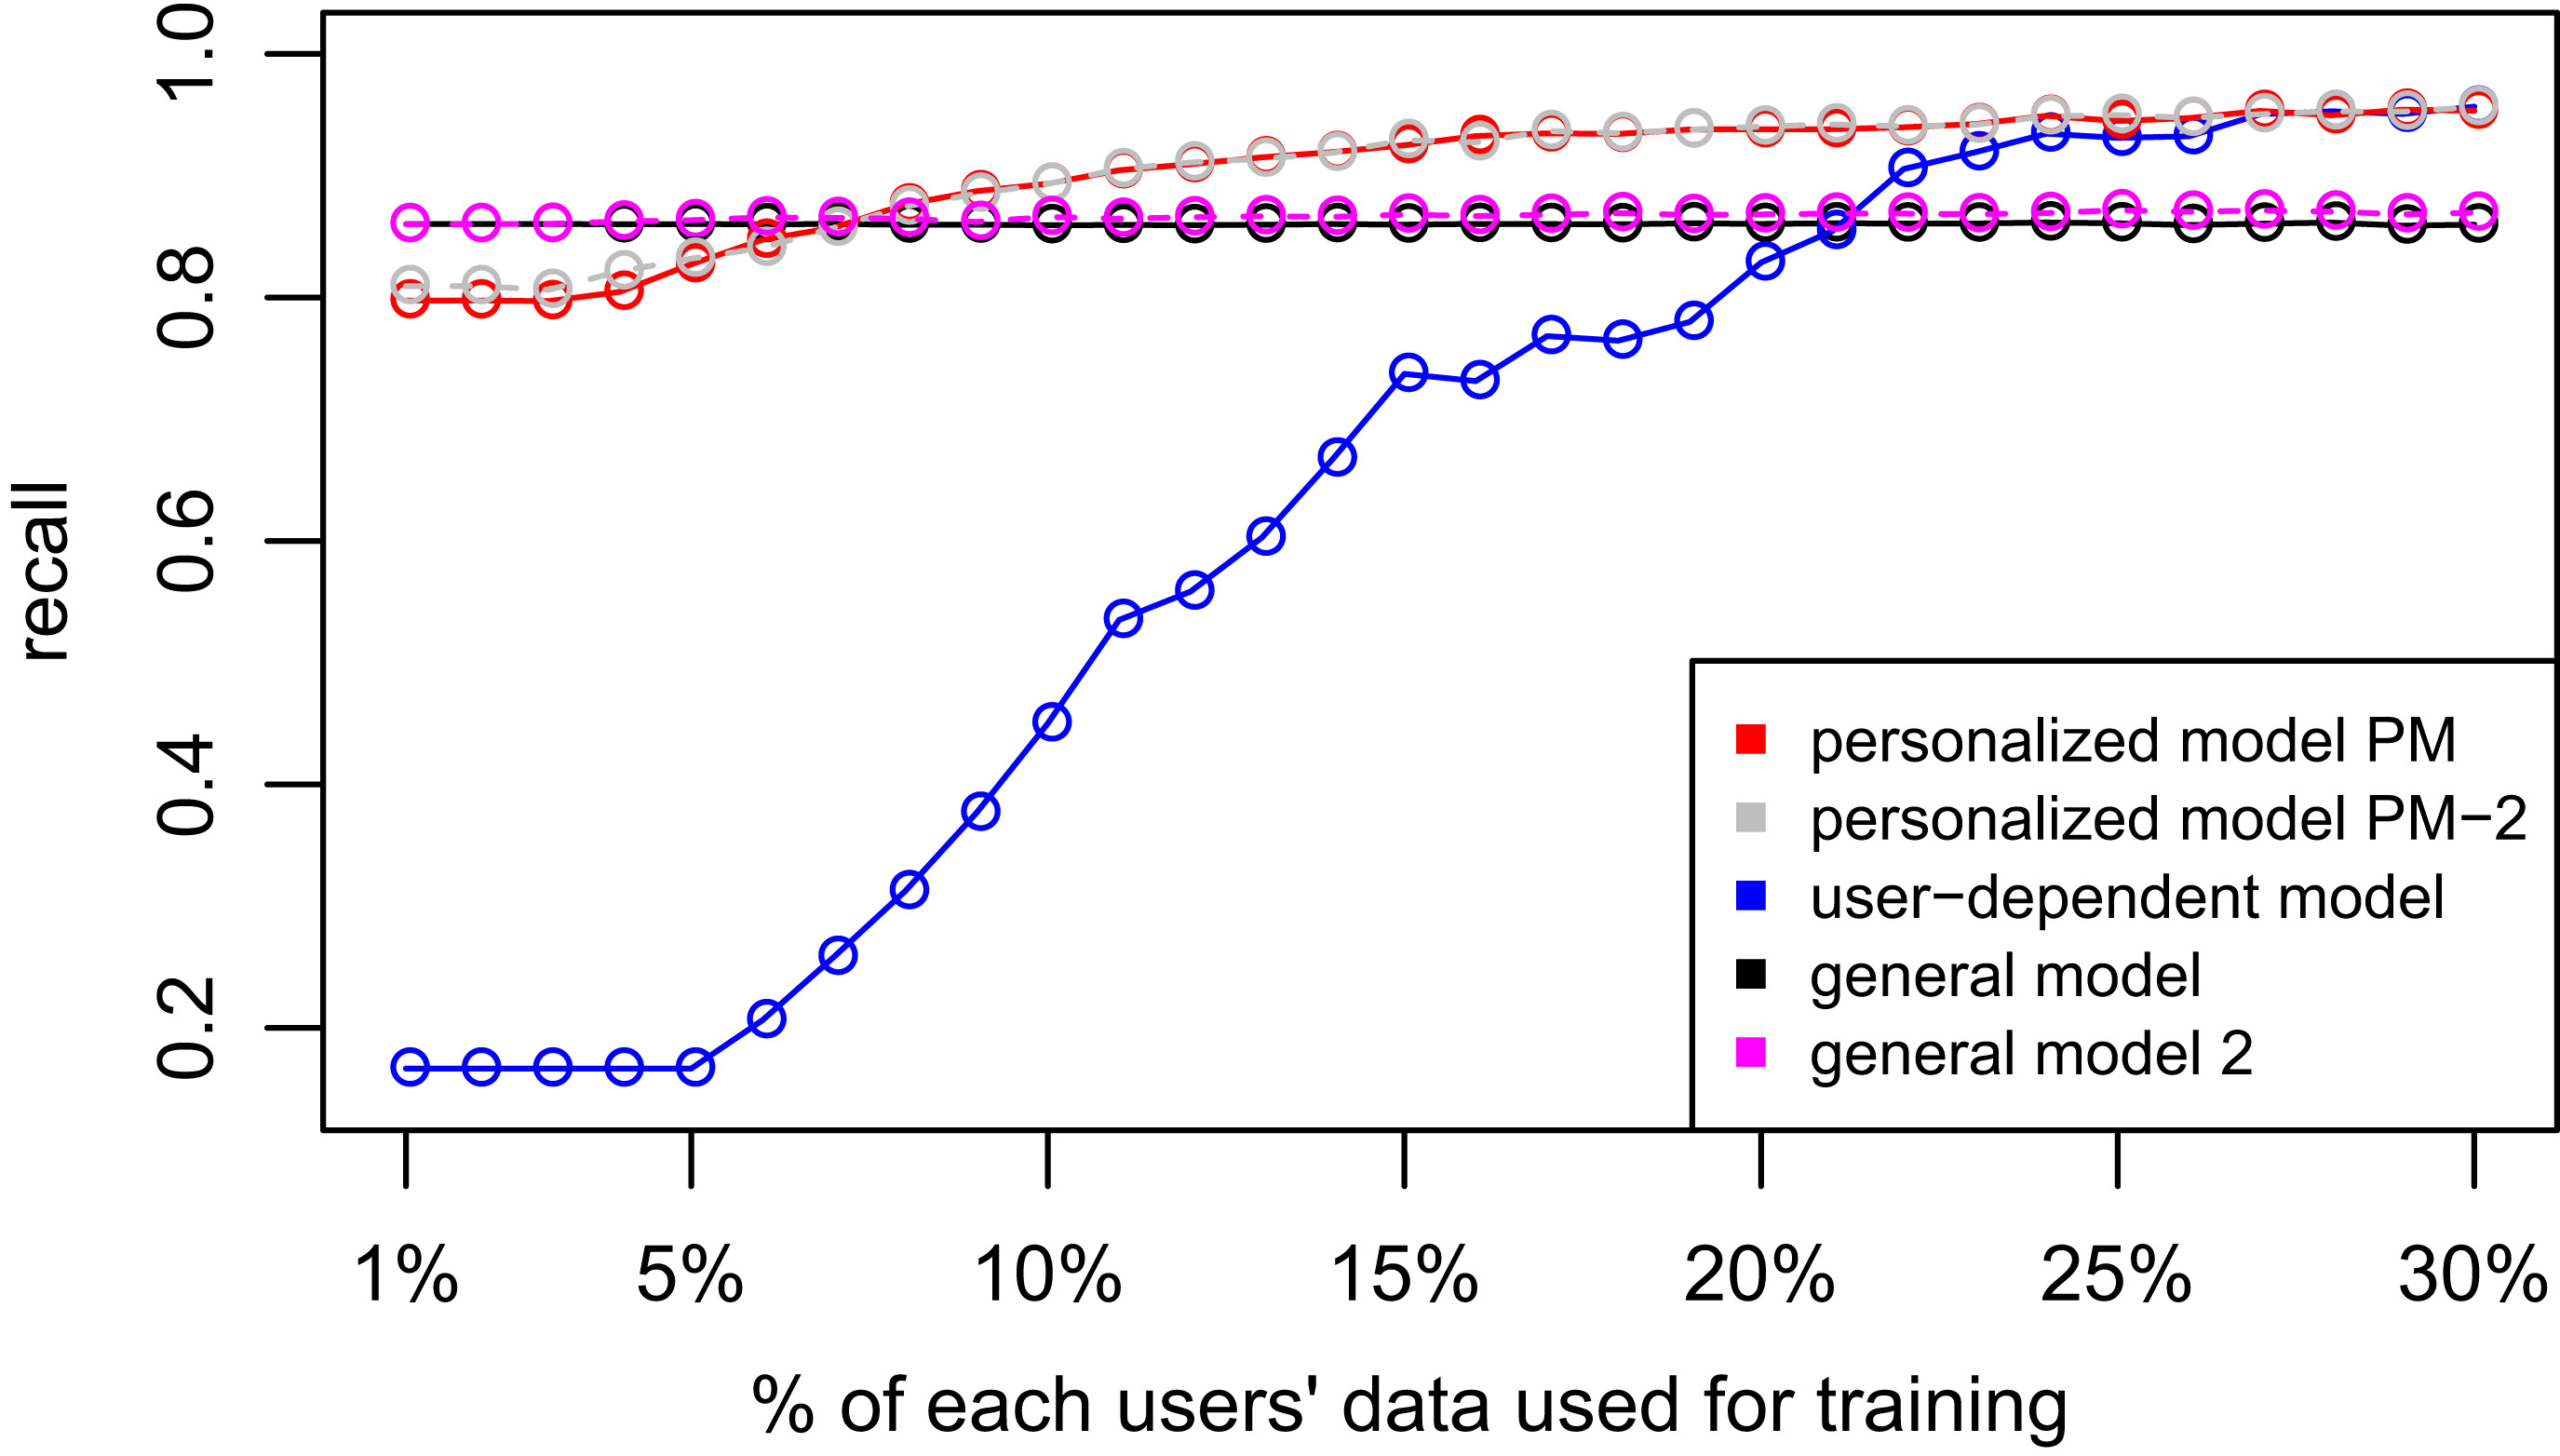
Recall plots for the Personalized Models experiments of the 4 datasets.
D1 – Chest sensor dataset. D2: Wrist sensor dataset.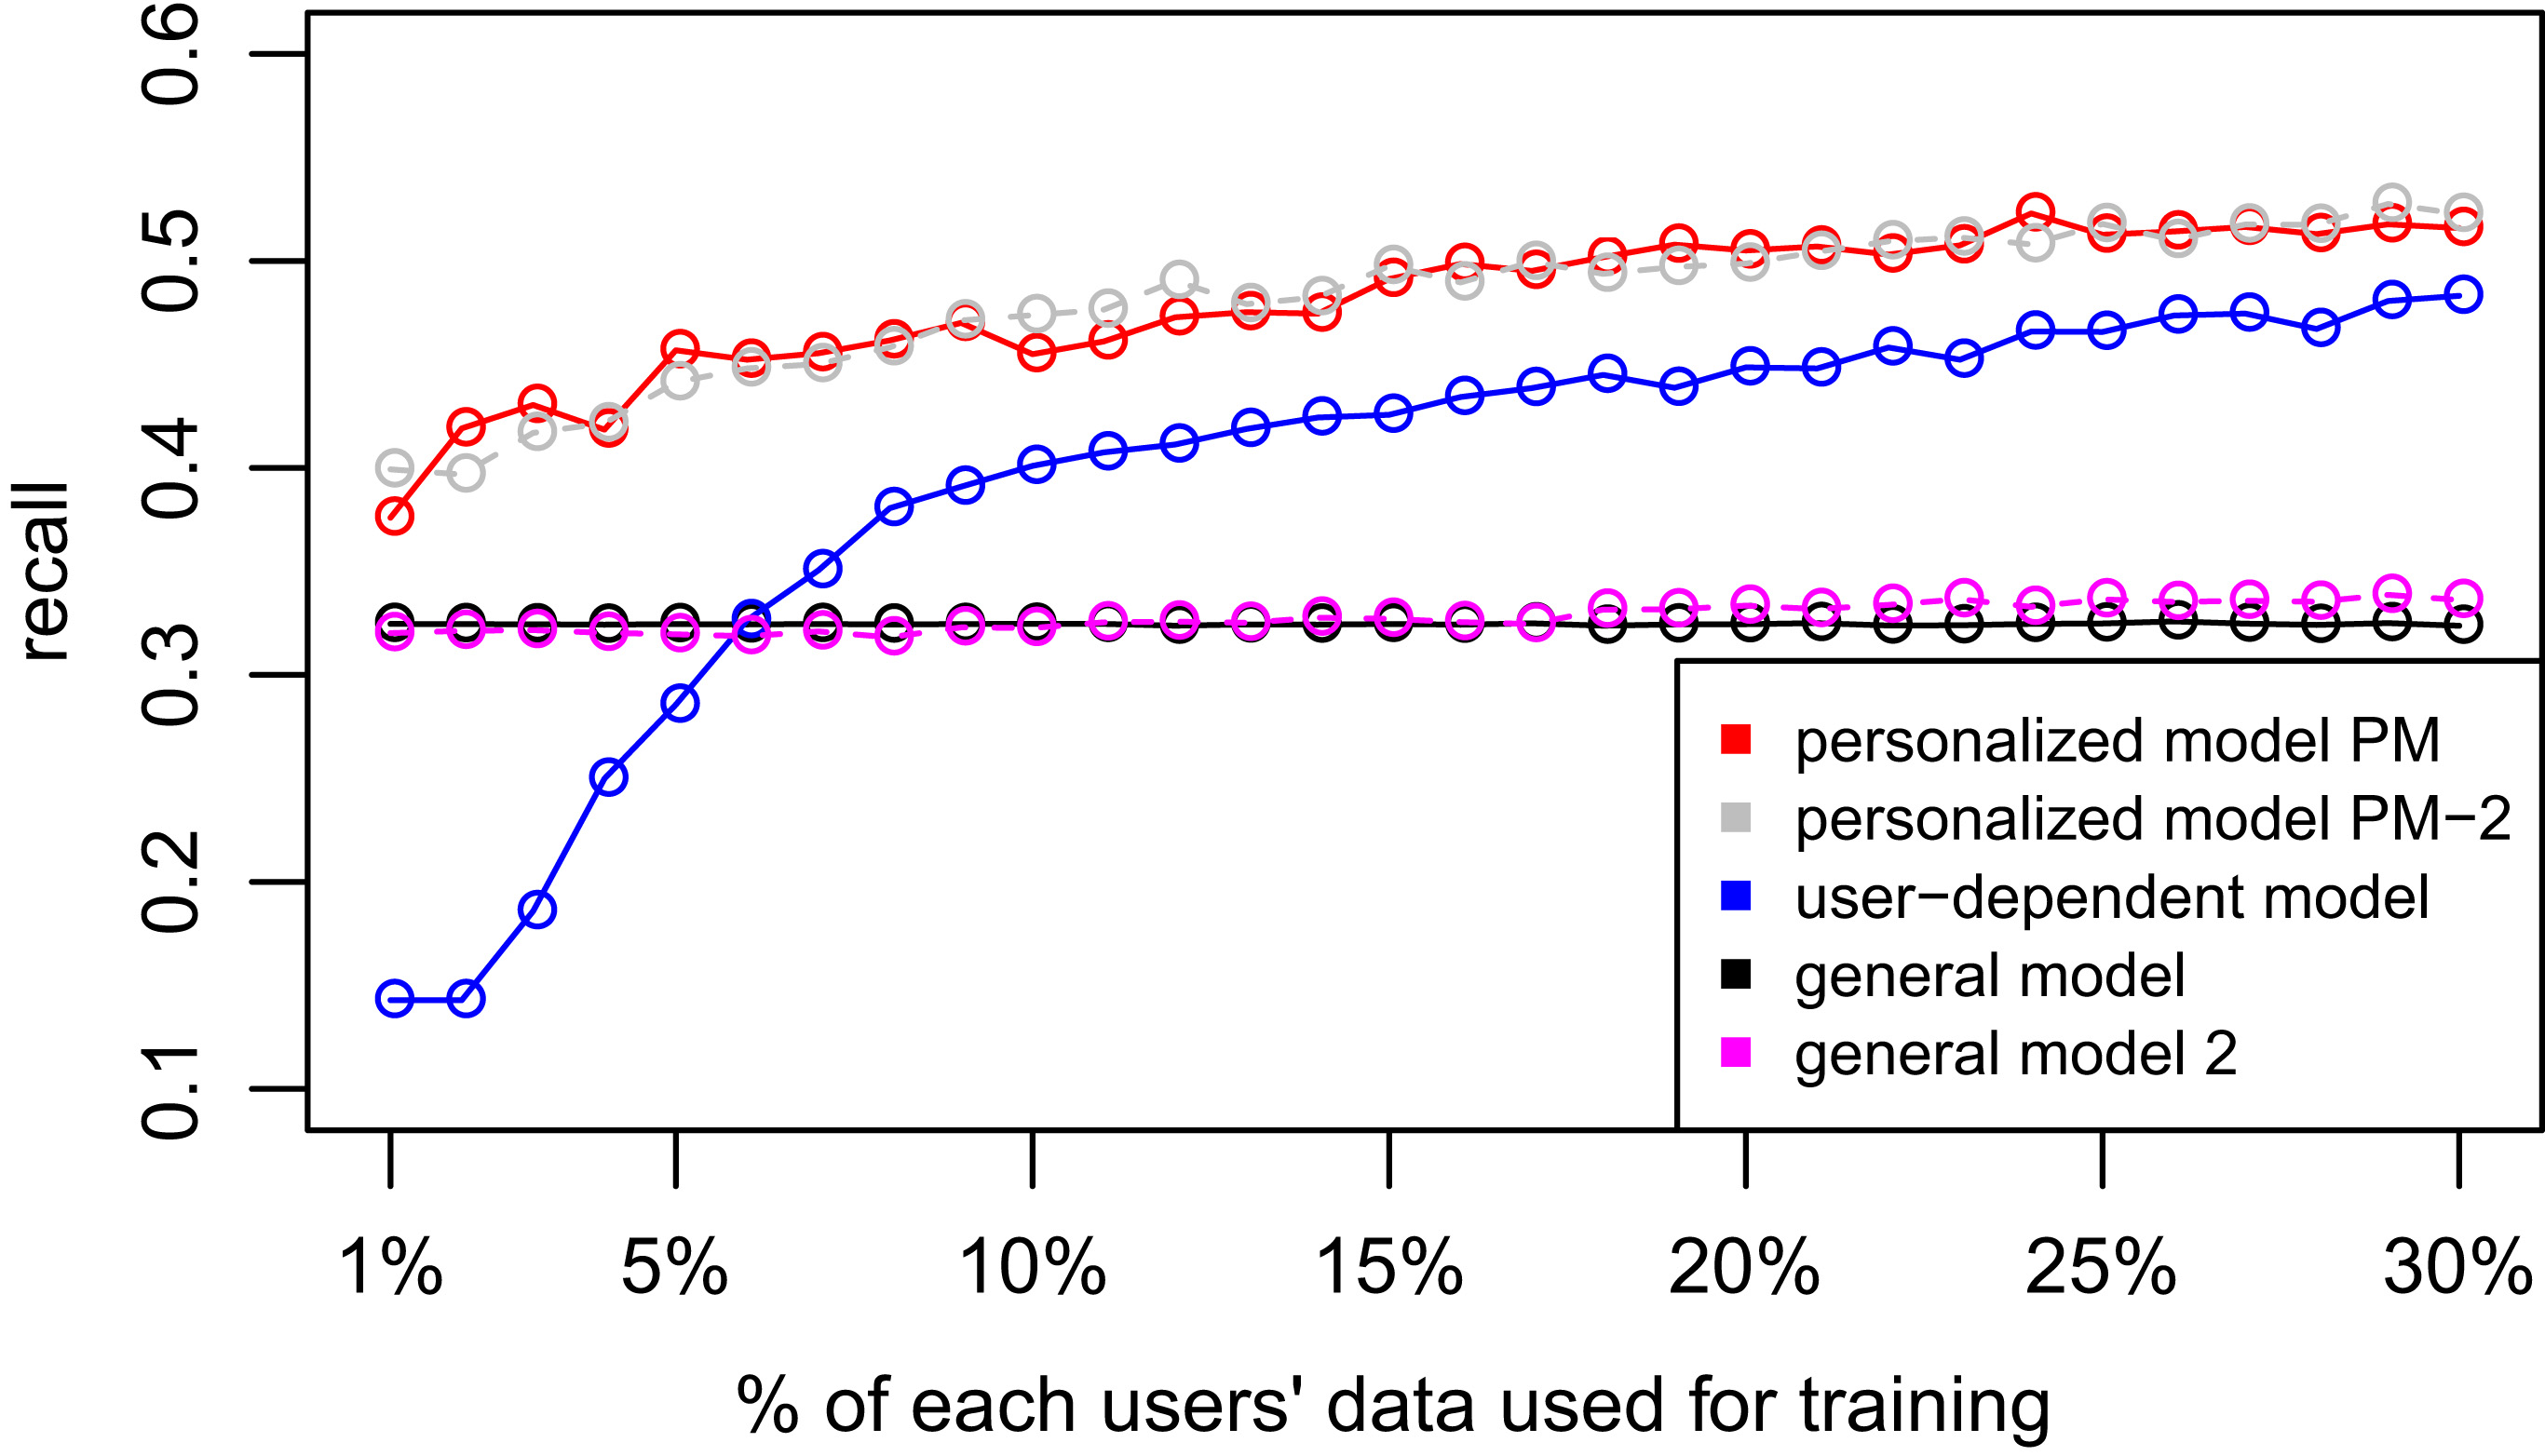
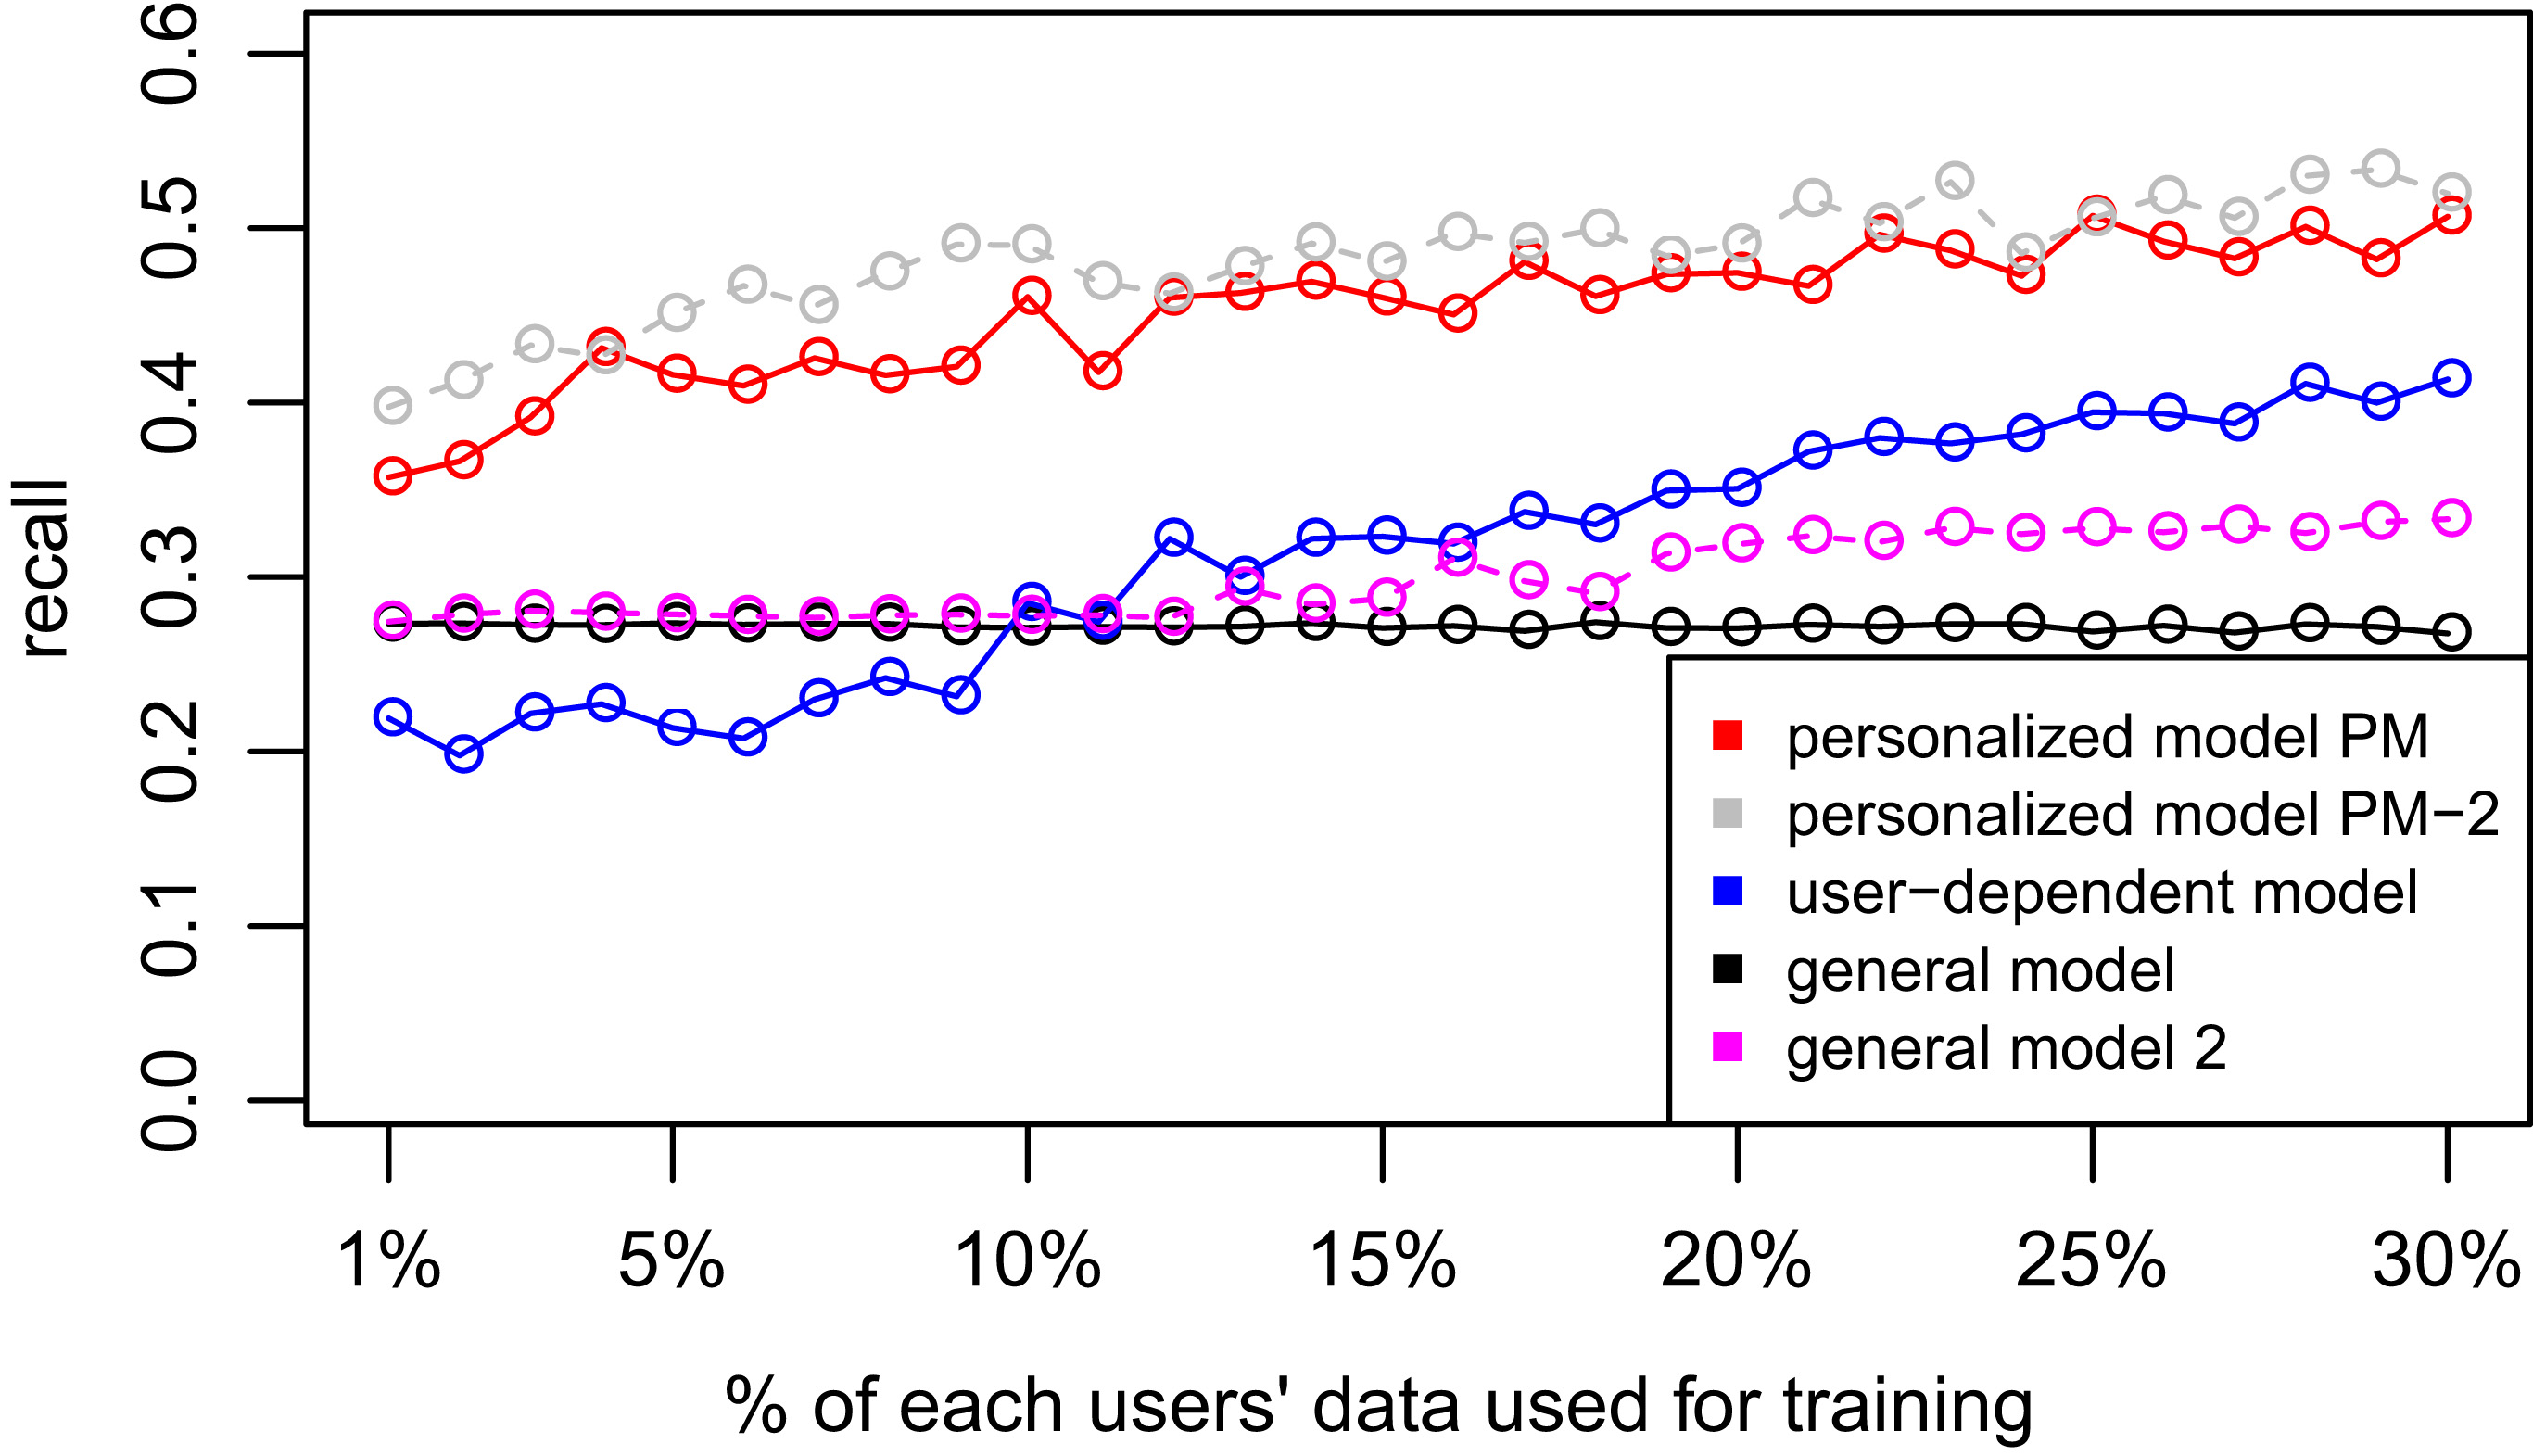
D3: WISDM dataset. D4: Smartphone dataset.