
Abstract
Evaluating in a correct, fair, systematic and reliable way the quality of the work is a central problem in modern business. Both from the psychological and the social point of view, this problem is very far away from being solved, let alone from being managed by a (semi-) automatic decision support system. In this paper we consider the case study of evaluating the operators’ work quality in a medium-sized contact center, and, in particular, the problem of selecting the correct variables to be used in such an evaluation. Starting from a data set representative of the company’s range and size of activities, that allowed no usable predictive model for evaluating the skills of the agents, we were able to devise a reproducible methodology, along with an a posteriori optimization process, to select the essential variables that should be used to objectively evaluate the quality of the agents’ work. These results may be used in a support system helping the supervisors in evaluating the agents’ performances. Moreover, we believe that our methodology may be extrapolated and reused in other comparable contexts characterized by the measurability of the human operators’ performance.
Introduction
Evaluating the quality of the work that is being done by the employees is a central problem in modern business; such an evaluation should be correct, fair, systematic and reliable, and, to this end, it should be measurable. In this paper, we considered the problem of evaluating the quality of the work of operators (also called agents) in a contact center of average dimensions.
A call center is a set of resources, personnel, computers, and telecommunication equipment, which enable the delivery of services via the telephone. Thanks to the advancements in information technology, call centers are gradually evolving into contact centers, in which the phone-operator role of the agents is complemented, and sometimes substituted, by services offered through other technologies, such as faxing, instant messaging, web portals. Contact centers handle both inbound and outbound communications, with different purposes, including customer care and follow-up, as well as marketing and quality control. The distinguishing feature of a multi-service contact center is that the offered services vary over a wide range of possibly very different types (e.g., specific product client follow-up and travel reservation systems) [4]. The cornerstone of a contact center is the agent. An agent (or CSR, that is, Customer Service Representative) is the endpoint of a service, and his/her performances determine in large part the success rate of a transaction. The services’ providers are usually able to identify a set of rules to evaluate an agent’s performance; such rules are typically employed in both the training and the evaluation of an agent. Such a methodology, however, is specific for a service, and typically rules cannot be easily generalized. Therefore, the problem stands to identify a methodology that allows some sort of evaluation in a general way.
A large contact center generates vast amounts of data, which can be broadly classified as operational or service data. Operational data include all the technical information needed to reconstruct a detailed history of the events that take place during each communication, and include, for example, the dialled or dialling phone number, the agent(s) that has (have) been involved, possible call transfers, and time-stamps. On the other hand, service data are specific to the particular service for which the contact has taken place, and may include, for example, all answers given by the interviewed subject during an outbound survey. Descriptive statistics of such a collection of data would be useless for the identification of the subset of variables that may or may not influence the performances of an agent. Instead, we applied a very large collection of feature selection mechanisms [20], along with a novel a posteriori “decision” making process in order to identify, if they exist, a subset of variables that may be thought of as objective indicators of the performances of an agent; in this context, decision making refers to effectively decide which results (subsets of features) are most indicated among those produced by the different mechanisms (and it should not be confused with “decision” in the context of management). To this end, we collected the cumulative data, for each agent, of a significant period of time and a significant range of different services, and we asked to three, independent, supervisors to evaluate each involved agent. Such an evaluation plays the role of the expert’s view of this problem. We therefore transformed the task into a feature selection for supervised classification problem [10]. It turned out that this is an hard problem, as the classical classification model learning algorithms return very poor models when run on the entire range of attributes. This indicates an elevate noise rate that makes it very difficult to decide the best methodology a priori. Since our aim is to identify a set of meaningful attributes that may influence the judgment of an agent, and not to build a classifier, we formulated the problem as a decision making one among a very high number of selections. Intuitively, we proceeded as follows: we built a mechanism that allowed us to run a very wide range of combinations of search methods, evaluators, and model learners (categorized into univariate/multivariate, filter/wrapper, and deterministic/probabilistic), obtaining as many as 79 different optimal selections. Each selection has been used in three different classifier learners (two tree-based learners and one support vector machine), with four different performance indicators. Again, the problem at hand does not allow us to decide a priori which is the most correct indicator, as our results must be interpreted; therefore, we devised a complex automatic decision method, which may be generalized for a problem that results in
The paper is organized as follows. In Section 2 we give the necessary preliminaries concerning the entire range of methods that we have used, and we introduce multi-objective combinatorial problems. In Section 3 we describe our data set along with the single attributes and their domain-related meaning. In Section 4 we describe our methodology, and in Section 5 we give an overview of the results of our experiment, as well as a domain expert’s interpretation of them, before concluding.
Background and related work
In this section, we briefly review the main methods and algorithms used in our experiments. The fact that these algorithms are all included in the WEKA data mining suite [11] is very convenient: being an open-source product, we had access to the Java classes of the state-of-the-art of each algorithm. In this way, we were able to design a simple script that allowed us to execute a very wide range of experiments on the same data in a systematic way.
Feature selection
Feature selection is the process of removing features from the data set that are irrelevant to task to be performed [20]. Its main aim is to facilitate data understanding, and to reduce storage and computation time requirements for model learning, while retaining a suitably high accuracy in representing the original features; nevertheless, we defined our problem as a feature selection problem per se, since we are searching for a specific subset of variables with a certain set of characteristics. Feature selection algorithms may be classified into several categories, depending on the specific criterion under consideration. According to whether the training set is composed of labelled instances or not, the selection may be, respectively, supervised or unsupervised. Methods in the former category seek for correlations between attributes and class label values, whereas those in the latter employ (usually, descriptive) statistical tests over attributes, such as, for example, a near-zero-variance test. Feature selection methods consist of four steps, namely subset generation, subset evaluation, stopping criterion, and result validation. The design of such steps entails the selection of: (i) a target to which to apply the procedure; (ii) a search strategy, to guide the incremental generation of the feature set; (iii) an evaluation strategy, which depends on the target type and, in the case of supervised methodologies, may imply choosing an actual classifier; (iv) an evaluation metric used to score the candidates.
Subset generation
Subset generation methods (also called
Subset evaluation
According to the target of the selection procedure, it is possible to classify evaluation strategies into univariate and multivariate. Strategies that belong to the former category evaluate attributes independently; as a result, they are computational less demanding than those that belong to the latter, which consider subsets of attributes as a whole. Moreover, multivariate approaches can also take into account complex relationships between features, such as redundancy. Here we have taken into consideration supervised methods, and, in particular, filter and wrapper models. Filter models are independent from the successive classifier learning phase, and are based only on general measures such as the correlation or consistency with the variable to predict. Filter techniques scale well with the size of data sets; however, since they ignore the classification performance, they might not always provide the best results [8, 27]. Wrapper models, on the other hand, evaluate the predictive accuracy of the attribute set with a selected classifier. These techniques typically offer better results than filters, at the cost of being computationally more demanding, and more prone to overfitting [22]. We considered the following univariate filters: (i) GainRatioAttributeEval [18], (ii) SignificanceAttributeEval [1], (iii) SymmetricalUncertAttributeEval [2], the univariate wrapper ClassifierAttributeEval [32], the following multivariate filters: (i) CfsSubsetEval [14], (ii) ConsistencySubsetEval [21], and the multivariate wrapper WrapperSubsetEval [19]. As far as univariate filters are concerned, GainRatioAttributeEval evaluates the worthiness of a single attribute by measuring its gain ratio value with respect to the class labels. Gain ratio is a well-known, commonly used assessment measure, calculated as the difference between the entropy of class distribution minus the conditional entropy of the classes given the values of the attribute, divided by the entropy of the attribute itself; SignificanceAttributeEval scores a single attribute by computing its probabilistic significance as a two-way function of its association to the class decision, and the intuition behind this algorithm is that if an attribute is significant with respect to the class labels, then it is expected that different sets of elements with complementary sets of values for the attribute will also belong to complementary sets of classes; finally, SymmetricalUncertAttributeEval evaluates the worthiness of a given attribute by measuring its symmetrical uncertainty with respect to the class. The univariate wrapper ClassifierAttributeEval scores an attribute by employing a user-selected classifier, evaluating its performance with respect to a specified evaluation metric (e.g., classification accuracy). For the purpose of this paper, we use it in conjunction with the classifiers J48 (C4.5 [28]), LibSVM [5] and RandomForest [3]. J48 is a Java implementation of the widely-used decision tree learner C4.5, which is known to be computationally efficient. The learning algorithm builds a decision tree from a set of labelled training instances in a recursive fashion, starting from the root node, by using the information gain ratio criterion. LibSVM is a library for support vector machines learning. A support vector machine is a supervised machine learning algorithm, which can be used for both regression and (typically binary) classification problems. Each instance is mapped to a point in
Evaluation metrics
Evaluation metrics are used to assign a numerical score to each candidate during the feature selection process. The metrics employed in the present work include: accuracy (for classification), weighted area under ROC (for classification), the root mean squared error (for regression and binary classification), and the model size. The accuracy (ACC) measures the amount of correctly labelled instances, as classified by a model. It is given by the ratio between the number of correctly classified instances and the number of total instances. The weighted area under ROC (WAUC) metric is calculated on a ROC curve [23, 9], which is a graphical representation of the sensitivity versus specificity for a classifier system, obtained by varying the model class discrimination threshold. The AUC value belongs to the interval [0,1]; a score of 1 represents the perfect classifier, while 0.5 is typical of a random classification behaviour; in the weighted version (WAUC), this number is computed taking into account also the cardinality of each class. The root mean squared error (RMSE) measures the difference between values predicted by a model and the values actually observed. Finally, the model size (MS) simply measures how big a classification/regression model is. Typically, ACC and WAUC are to be maximized, while RMSE and MS are to be minimized.
Multi-objective combinatorial optimization
Optimization [17] indicates the process of selecting a best element with respect to some criteria; mathematical programming is the discipline that studies the theory, the algorithms, and the techniques to represent and solve optimization problems. While some of the subset generation methods described above (precisely, the probabilistic subset generation algorithms) are defined as multi-objective optimization (MOO) problems [6], our interest here is in defining a decision making process as such. A minimizing MOO problem can be formally defined as:
for
Data sets and problem definition
The data we used have been provided by Northern Italy company Gap Srlu, and consist of the cumulative performances of 77 agents over a period of 6 months. Contacts in Gap are managed and organized as follows. The flux of information is categorized into inbound (that is, contacts that Gap receives, such as phone calls) and outbound (i.e., surveys made by Gap). Each of these is classified by commissions: a commission is the unit of contract between Gap and a client (i.e., the ACME airline company commissions to Gap the phone ticket selling service for their customers), and each commission may be declined into several services. A service is a specific type of interaction that the client wants Gap to operate with (i.e., ACME wants Gap to deal with ticket selling but not lost-and-found), and each service includes several sub-types (i.e., ACME ticket selling includes a channel for information, a channel for reservation managing, and so on). For the purpose of this experiment, we considered phone-based communications only. Of all agents, 56 were employed for outbound, inbound, and backoffice services, while the remaining 21 had no inbound communications. The work of all agents has been described via 69 attributes, while for those agents with at least some inbound communications over the analyzed period, we were able to add 6 more features (that make sense for inbound communications only). Compared to previous data mining experiments on contact center databases, the quality of the information at our disposal is considerably higher. Not only did previous experiments such as [25] made no use of feature selection; they did also operate on a very restricted set of attributes, consequently limiting the significance of their results. Moreover, all previous experiments, including [30, 15], were not designed to evaluate the performances of the agents.
Variables related to the agent and variables related to the switching frequency of the agent
Variables related to the agent and variables related to the switching frequency of the agent
For a better understanding, the set of variables common to both data sets (the one containing the cumulative performance indicators of all agents and the one containing the cumulative performance indicators of only those agents that had inbound communications) can be classified into several categories, depending on the particular aspect they describe. The first category is agent related variables (see Table 1 – top),1
Unless otherwise specified, every numeric variable is in fact a pair of variables that takes into account average and variance of each aspect.
A session is the most basic unit of work done by the agent, to which it is possible to assign a result, for example a phone call.
Variables related to the agent’s work distribution and heterogeneity, and turn distribution
Six more attributes have been considered for those agents whose job during the observed period included inbound communications. Such variables take into account the structure, the understandability, and the type of call-related notes written by the agent. These may be abbreviated, articulated, non-articulated, domain-related, hybrid, or unrecognizable.
Our choice of attributes naturally led to two distinct data sets, hereafter called ALL_AGENTS and INBOUND_AGENTS; the former contains 69 attributes and 77 instances, and the latter contains 75 attributes and 56 agents. Both data sets have been enriched with a variable that describes the agent performance value. This has been obtained by asking to three independent supervisors a fair judgement of each agent to the best of their expertise. Their judgement, on a scale from 1 (lowest) to 5 (highest), takes into account the overall impression of the agents and their performances; then, the three votes have been combined into a single one by averaging them. The purpose of this work is to answer the following question: which are, if they exist, the performance-related variables that influence the expert judgment on an agent?
For each of the two data sets we applied a simple preprocessing methodology. First, we have replaced all the missing values with their respective mean; to this end, the procedure ReplaceMissingValues from the weka.filters.unsupervised.attribute package has been used. Second, we have searched for those features with too small variation by using RemoveUseLess from the same package: no features have been eliminated via this process, indicating that, potentially, all of them might influence the agent judgment.
After the preprocessing, we have systematically applied 79 different feature selection mechanisms,3
The hardware that we have used is a machine with 8 processors Intel Xeon X7550 @ 2.00 GHz, RAM 1TByte at 1067 MHz and storage Lustre Distributed File System v2.5.2; interconnection network: Infiniband QDR (40 Gbps).
Proposed methodology for feature selection.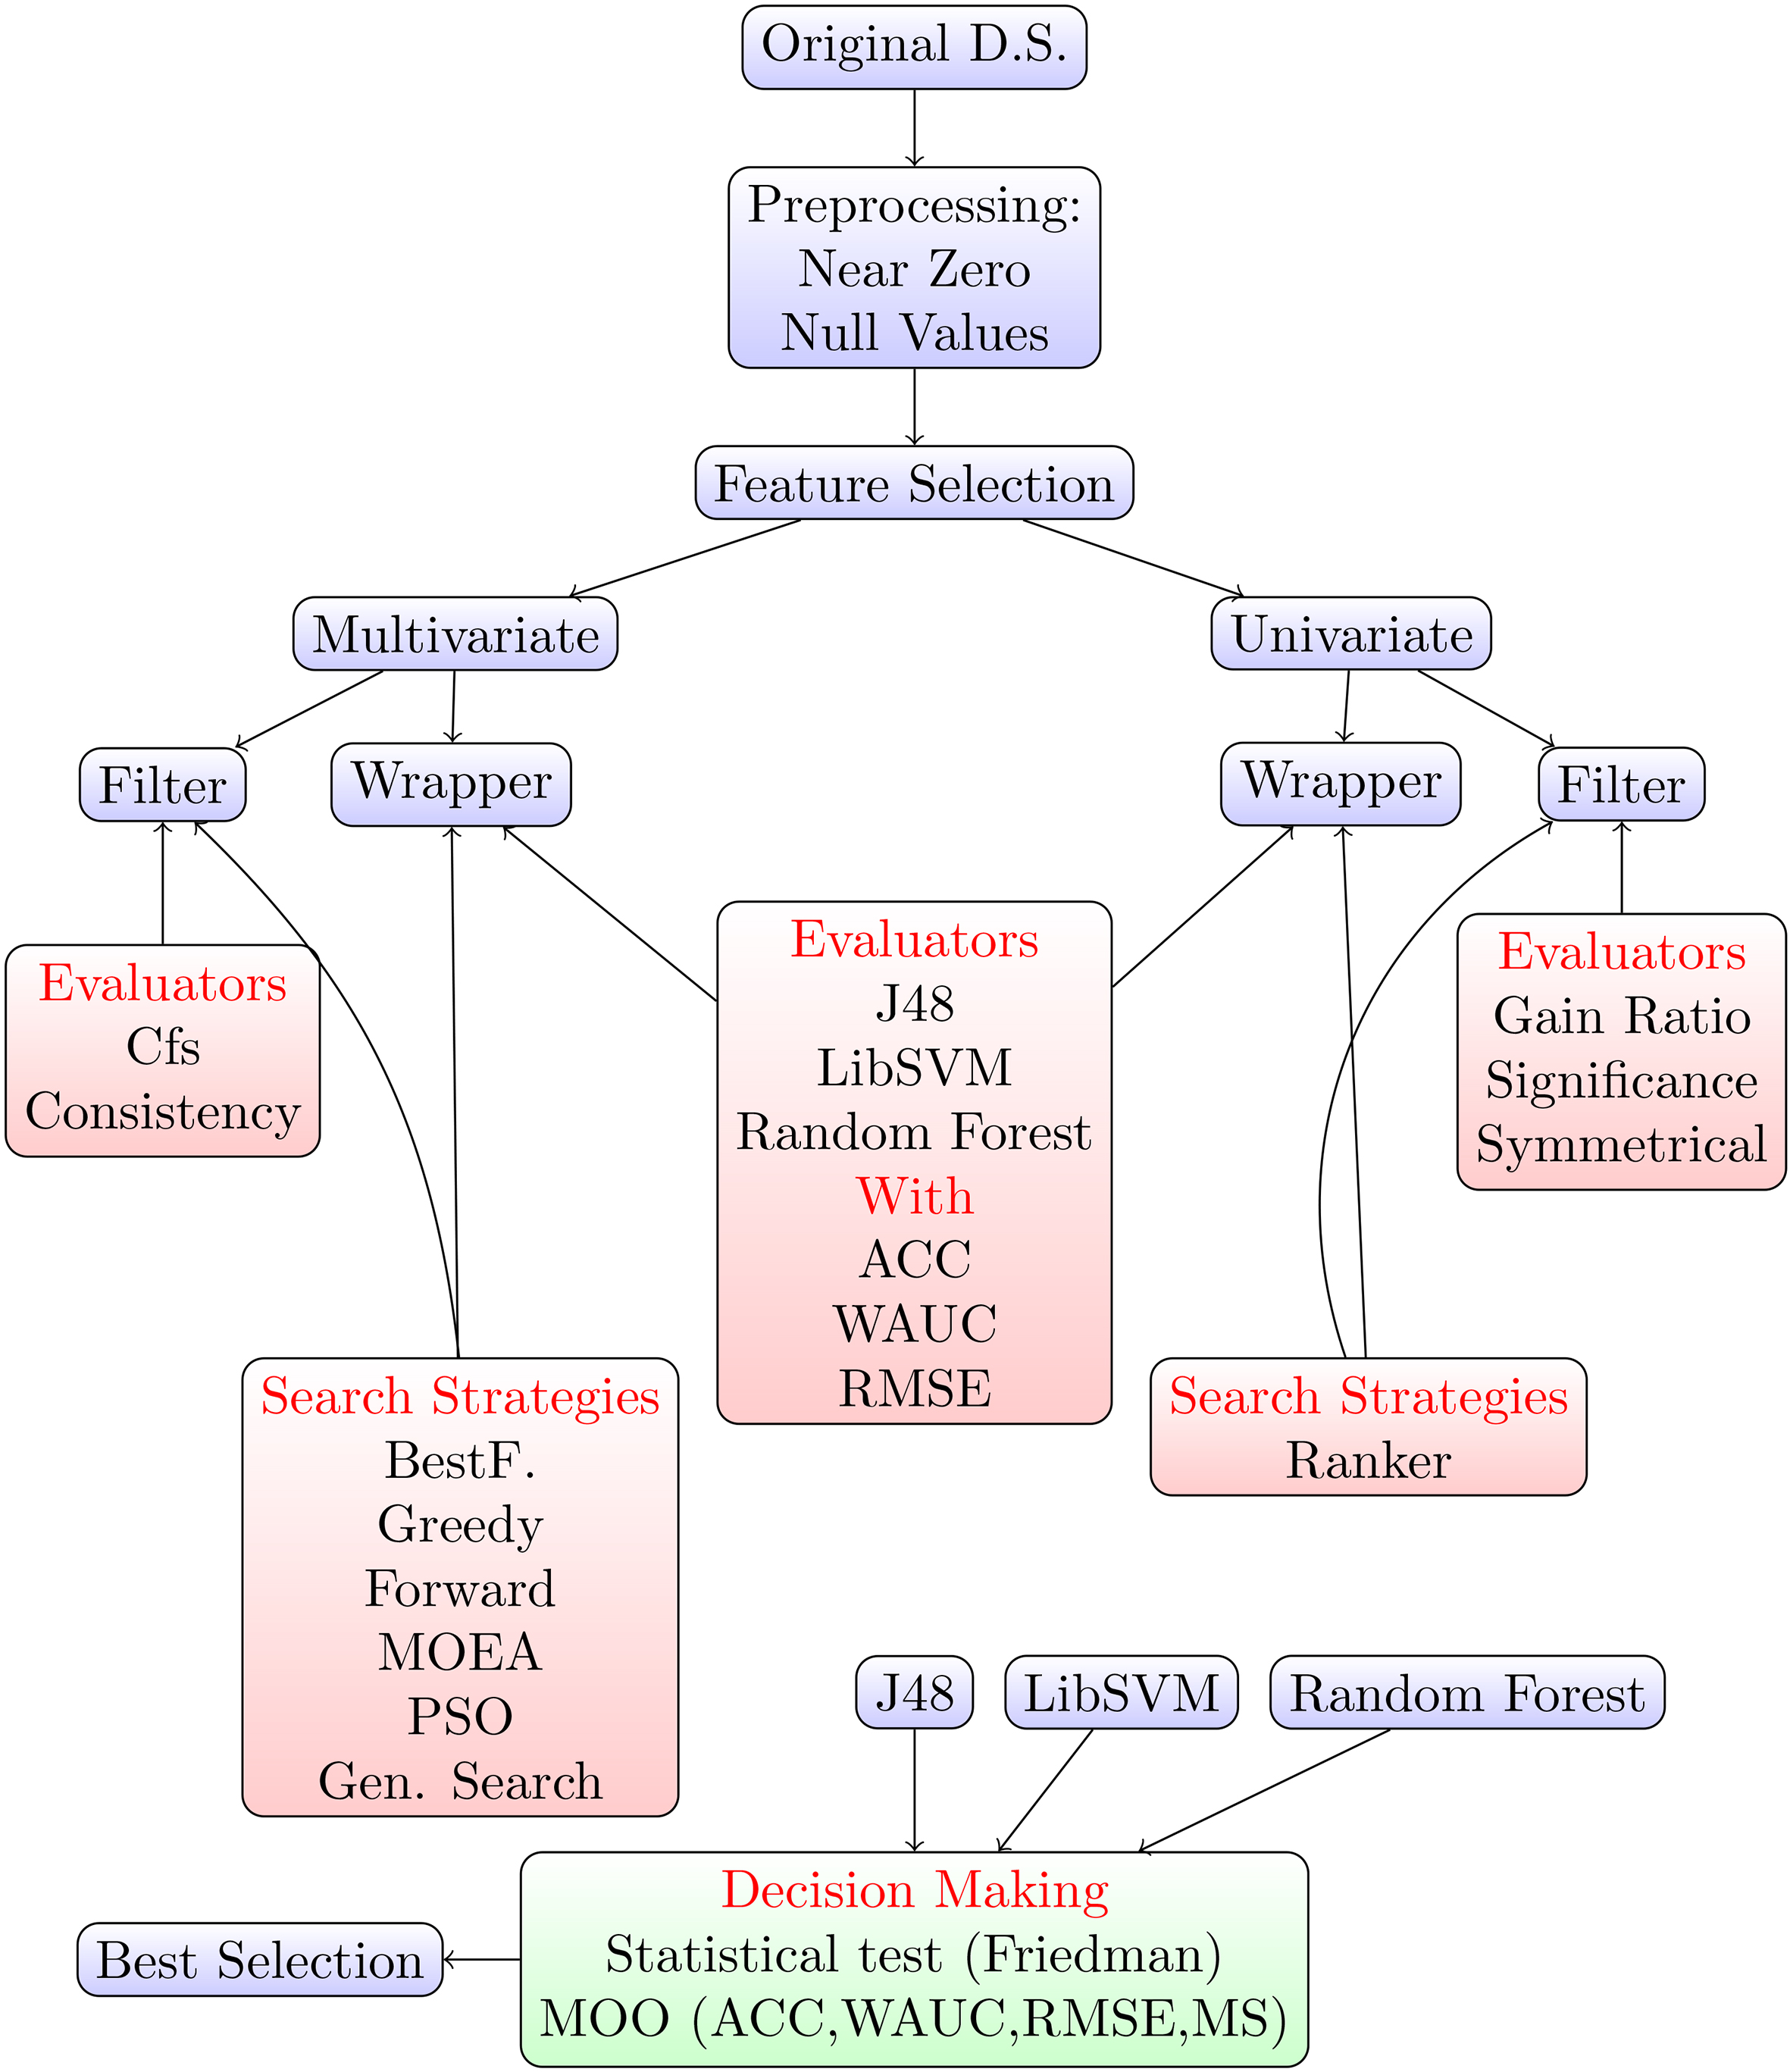
The result of this process is composed of 79 different selections of attributes, each one of them optimized following a different criterion. The test phase consisted of training a model with each of the 79 corresponding data sets, via: (i) a decision tree learner (J48); (ii) a support vector machine (LibSVM); (iii) a random forest learner (RandomForest). For each of the resulting models, we measured, after a leave-one-out cross-validation test: (i) accuracy (ACC); (ii) (weighted) area under the ROC curve (WAUC); (iii) root mean squared error (RMSE); (iv) serialized model size (MS). Finally, we applied the following decision making strategy. In order to highlight possible significant statistical differences among the resulting selections, we performed a non-parametric Friedman test [36] with significance level
where
As the last step, we considered the best selections obtained in this way, and we analyzed the corresponding features: the most common ones are those that, in fact, influence the experts’ judgments. The entire methodology, applied to both ALL_AGENTS and ALL_INBOUND, is displayed in Fig 1. Algorithm 1 presents the pseudo code summarizing the overall approach.
[t!] Pseudo-code of the generic analysis approach[1] Analyze Missing values imputation Remove attributes with too small variation Perform feature selection methods Classification with J48, RandomForest and LibSVM over the reduced databases Statistical test (Friedman) to determine if the observed differences are statistically significant, and to eliminate the worse selections Multi-objective combinatorial optimization over the remaining reduced databases with significant statistical differences Analyze features of the non-dominated reduced databases
The Friedman test showed no statistical differences among the selections, for both the (original) data sets. This means that we solved the MOO (optimizing the four chosen objectives) among the 79 selections, once for each problem. Recall that our problem presented a very low susceptibility to classification, and that we are not interested in building a classifier, but in identifying a meaningful subset of variables. The MOO objectives are designed precisely to this aim (see Section 4), as they optimize the average performance degree without committing to a specific classifying model learner. As a consequence, we are not interested in their absolute values. It turns out that 12 solutions from the ALL
Wrapper methods have shown better performance than filter methods; Multivariate methods have shown better performance than univariate methods; Among wrapper methods, tree-based ones have shown better performances than every other learning methods, especially when combined with our evolutionary search strategy; The run time of RandomForest is acceptable in wrapper methods after limiting the number of iterations to 10, and the method is not very sensitive to the variation of its parameters. However, RandomForest is prone to overfitting and generates larger regression models.
Variables related to the agent’s notes
Non-dominated solutions
Most commonly selected attributes
In synthesis, multi-objective evolutionary search with ENORA resulted to be the most successful search strategy, and RandomForest to be the most precise classifier to be used in wrappers.
Having reduced the number of solutions to 17, we can now analyze them, and, in particular, we can examine the attributes that have been selected. Table 5 shows the most common ones, which must be interpreted as those having the highest influence on the judgement. A first, immediate, observation is that separating our initial objective into two sub-problems has been the right choice: there exists a substantial difference in the results of the selections, meaning that the agents that work on both inbound and outbound communications behave in a substantially different way from those who concentrate solely on outbound. Focusing on the group of variables that, apparently, may influence the judgement on all agents, we notice that these are taken exclusively from the set of variables that describe the work and the turn distribution. On top of this observation, we notice that break and inactivity periods (in particular, the average number of breaks over a single day of work, and the total inactivity time over the entire observed period) are the most influential characteristics. Moreover, the average workload seems to have some relevance in determining the quality of an agent. Finally, it also seems that the average amount, his/her turn distribution in the mornings and in the nights varied over the observed period had played a role in determining the judgement.
Focusing on on the results for the group of agents that had both inbound and outbound work, we discover some interesting differences. Unlike the previous case, agent’s education level, age, and gender do play a role in determining the quality of his/her work. This makes perfect sense: inbound sessions are essentially different from outbound ones, and it emerges that education and age may make the difference. The average number of break sessions during a working day still has a relevant role (which means that this aspect is transversal to the type of agent), as well as the variance of his/her turn distribution in the mornings.
Finally, we notice that the structure of the written notes taken by the inbound agents seems not to have any essential role in determining the overall impression on them. Similarly, and maybe more interestingly, in both groups, the skill level of the agents (determined internally in Gap), as well as the entire range of indicators that depend on the heterogeneity and on the relative importance of the work assigned to the agent, seem not to influence the judgement in any way. This may depend, among other reasons, from the fact that the skill level is an internal evaluation based on technical aspects, and it is independent from the judgment that we used as class (and that we wanted to predict).
The problem of evaluating in a correct, fair, systematic and reliable way the quality of the work is central in modern business. As a case study, we considered a group of customer service representatives, or agents, in a medium-sized contact center, and we associated a very subjective evaluation of their performance in a six-months period (obtained by combining three, independent, expert evaluations) with a synthesis of the operational and service data generated by their activity in the same period. Our aim was to identify the subset of parameters that (implicitly) influenced their evaluation, and therefore help the experts in designing a (semi) automatic system for evaluating the agents. Since such a problem is not susceptible of a classical learning approach, we applied a very large collection of feature selection mechanisms along with a novel a posteriori decision making process in order to identify optimal subsets of variables that may be thought of as objective indicators of the performances of an agent. We found, first, that those agents that work on both inbound and outbound communications behave in a substantially different way from those concentrating solely on the outbound. Moreover, we discovered that for a generic agent (regardless of him/her being assigned inbound services or not), work and turn distributions seem to have some influence in his/her performance, as well as break and inactivity periods; also, the average workload and turn distribution in the mornings and in the nights seems to have some relevance in determining the quality of their work. Interestingly, education level, age, and gender of an agent has some influence only on those assigned to inbound work.
We believe that our methodology may be extrapolated and reused in other comparable contexts characterized by the measurability of the human operators’ performance.
Footnotes
Acknowledgments
This study was supported by computing facilities of Extremadura Research Centre for Advanced Technologies CETA-CIEMAT), funded by the European Regional Development Fund (ERDF). CETA-CIEMAT belongs to CIEMAT and the Government of Spain.