
Abstract
The application of algorithms based on data analytics for the task of knowledge mining in a student dataset is an important strategy for improving learning outcomes, student success and supporting strategic decision making in higher educational institutions of learning. However, the widely used data analytics based clustering algorithms are highly data dependent, making it pertinent to find the most effective algorithm for knowledge mining in a dataset associated with student engagement. In this study, performances of five famous clustering algorithms are evaluated for this purpose. The k-means algorithm was benchmarked with 22 distance functions based on the Silhouette index, Dunn’s index and partition entropy internal validity metrics. The hierarchical clustering algorithm was benchmarked with the Cophenetic correlation coefficient computed for different combinations of distance and linkage functions. The Fuzzy c-means algorithm was benchmarked with the partition entropy, partition coefficient, Silhouette index and modified partition coefficient. The k-nearest neighbor algorithm was applied to determine the optimum epsilon value for the density-based spatial clustering of applications with noise. The default parameter settings were accepted for the expectation-maximization algorithm. The overall ranking of the clustering algorithms was based on cluster potentiality using the median deviation statistics. The results of the evaluation show the well-known k-means algorithm to have the highest cluster potentiality, demonstrating its effectiveness for the task of knowledge mining in a student engagement dataset.
Introduction
The advent of big data era coupled with an explosively growing mass of data and development of technology for data analytics has brought about an increasing necessity for educational enterprises to discover useful knowledge in student datasets. Amongst the intrinsic merits of knowledge mining in the education domain is to unveil hidden facts that would help to improve learning outcomes, student success and support strategic decisions pertaining to effective management of students. The educational enterprises, particularly the higher educational institutions of learning worldwide, generate, share and store a monumental volume of data at incredible rates, which present a real data management challenge. It is customarily the case that higher educational institutions are awash in data about students, staff, research activities and other daily business transactions. Moreover, many educational institutions are increasingly delivering online learning that has resulted in trillions of data being harvested and stored in various institutional datasets [1]. In particular, a student engagement dataset is crucial because student engagement is affirmed in literature as multifaceted constructs for understanding educational concerns like enrollment planning, student dropout and is positively related to academic performance [2]. In addition, it has been described as a ductile aspect of intrinsic motivation and behavior of students that are useful for learning and adjusting the institutional context [3]. Analytically, a student engagement dataset can assist students and teachers in recognizing the precarious activities as danger signs before threatening learning, academic success and full engagement [4, 5]. Moreover, a student engagement dataset interconnects many other educational datasets such as admission dataset, finance dataset, academic records, research dataset and accommodation dataset.
A student engagement dataset is a set of records that reflects the quality of effort, time and energy that students, staff, faculty and institutions have committed to educational events that directly contribute to enhancing student success [6, 7, 8, 9]. It can be monumental, depending on the size of an academic institution and learning activities that directly impact on students. In view of the importance of student engagement, the National Survey of Student Engagement (NSSE) carried out surveys in different colleges and universities all over the world in 2000. In 2017, 725 colleges and universities participated and 517,850 students completed the surveys. Since 2000, over 1,600 institutions have participated and approximately 6 million students have completed the surveys (
Researchers and higher educational institutions have applied different methods to analyze a student engagement dataset in order to realize an outstanding purpose of detecting aspects of student engagement that should be enhanced to align with the standard practices of undergraduate education. However, many of these methods come with the intrinsic curbs that limit their wide applications for knowledge mining. For instance, they can analyze numerical variables based on groups, but cannot identify individual characteristics [10]. In addition, they can generate ambiguous results [11] and cannot reliably obtain inference that is useful for early detection of student defects. The use of methods based on data analytics is potentially valuable for improving student success and discovering useful knowledge that would help to enhance student management. Data analytics can extract meaningful knowledge in raw data and unveil hidden facts that can assist in understanding academic challenges facing students. Moreover, it is a useful device for learning and gaining intuition about student engagement [12]. This will in turn help unveil some aspects of undergraduate student education practices and activities that should be enhanced through a change in policies and practices that are congruent with the goals of undergraduate education. The unique contributions of the study at hand, lie in the above vantage position as succinctly articulated below:
Five famous unsupervised clustering algorithms for data analytics are experimentally evaluated to discover the best cluster structure for knowledge mining in a student engagement dataset. The choice of unsupervised learning algorithms such as clustering over supervised learning algorithms such as neural networks is paramount because many educational datasets are often unlabeled and cannot readily be used to fit models. Since the effectiveness of the k-means algorithm is heavily dependent on the distance function utilized, 22 distance functions were tested to discover the most suitable of them for the task of knowledge mining in a student engagement dataset. The optimum number of clusters was determined based on the widely used internal validity metrics of Silhouette, NbClust and Elbow. The determination of an appropriate number of clusters is a prime problem in the application of data clustering algorithms. A methodological framework has been developed in this study to rank different data clustering algorithms based on the cluster potentiality to discover the most suitable algorithm for the task of knowledge mining in a student engagement dataset.
The discussion of related literature is succinctly organized in two dimensions in order to show currency, originality, relevance and relatedness of this study with respect to the extant research and to justify the suitability of the study methods. These dimensions are methods that have been previously used to study student engagement and data clustering.
Student engagement methods
The literature reveals different methods, models, frameworks and tools that scholars have engaged to assess and understand student engagement [13, 14]. These methods include self-report [15], teacher rating [16], interview [17], observation [18] and experimental sampling [19]. Moreover, various methods have been deployed to analyze a dataset associated with student engagement. They include constant comparative method [15], process-oriented analysis [20], analysis of variance [21], content analysis [22], structural equation modeling [23, 24], exploratory factor analysis, confirmatory factor analysis [25], cognitive engagement model and quadrant analysis [26], correlation analysis [27], descriptive statistics and econometric analysis [28]. This current review shows that these efforts have demonstrated potentials and produced reliable reports. Nevertheless, descriptive statistics and some of the already engaged methods can only analyze numerical variables based on groups, but cannot identify individual characteristics [10]. For example, factor analysis can generate ambiguous results [11] and cannot reliably obtain inference that is useful for early detection of student defects. However, an approach of data analytics with its great potential to learn and gain intuition about data has not really been well-explored for the task of knowledge mining in a student engagement dataset to the best of our understanding, which is a gap that has inspired this study.
Data clustering methods
Data clustering is an exploratory unsupervised learning task that classifies a set of data objects into groups, such that objects are homogeneous within each group and heterogeneous between groups. Each group is referred to as a cluster, such that objects in a cluster have high similarity in properties, but are very dissimilar to objects in other groups [29]. Clustering is important for identifying hidden patterns, revealing previously unknown knowledge and giving a better understanding of each distinct cluster from a huge volume of data [12]. Different clustering algorithms have been proposed in the literature for data analytics. However, their applicability depends heavily on the type of dataset and essential requirements of the problem space [30, 31]. The hiccups often associated with the methods of data analytics have been extensively reviewed in the literature [29, 32, 33].
There is a difficulty in providing a direct categorization of clustering methods because of overlapping in the categorization [29]. However, data clustering methods could be diametrically categorized into hard clustering and soft clustering. In hard clustering, one data point is mapped exactly into one cluster, while in soft clustering, a data point can be represented in different clusters with the specified membership degrees. In [34], hard clustering methods were further categorized based on the approach of cluster structure modeling. The categories of structural modeling include, connectivity, centroid, distribution and density methods. The connectivity methods such as the hierarchical clustering algorithm, build models based on distance connectivity. The centroid methods such as the k-means algorithm, represent each cluster by a single mean vector. The distribution methods such as the Expectation-Maximization (EM) algorithm, model clusters based on statistical distributions. The density methods such as the Density Based Spatial Clustering of Applications with Noise (DBSCAN) and Ordering Points To Identify Clustering Structure (OPTICS) define clusters as connected dense regions in a data space.
Like other methods of data analytics, clustering algorithms have been broadly investigated and tested on diverse datasets in different application domains with promising results. These application domains include, gene expression data [33], biological data [35], sensor network data [36], medical dataset [37, 38], food data [39], student academic data [40], image segmentation [41], market sales data [42, 43], network traffic data [44] and residential electricity consumption [45]. However, the implementation performances of clustering algorithms on different datasets differs most likely because of the inherent data dependency issue [29, 31, 46]. Data dependency is a critical issue in data analytics research that always necessitates experimental comparisons of different methods on a particular dataset to discover the most appropriate one [31, 47]. Consequently, the overarching objective of this study, was to evaluate five famous clustering algorithms for the task of knowledge mining in a student engagement dataset and rank the algorithms according to their performances. The clustering algorithms are the k-means, Hierarchical, DBSCAN, EM and Fuzzy c-means as shown in Fig. 1.
The methodological framework with the standard indices for ranking data clustering algorithms.
The methodological framework of this study as shown in Fig. 1 is divided into four essential components for evaluating and ranking different data clustering algorithms. These components, which are further expounded are data collection, cluster evaluation, algorithm evaluation and algorithm ranking.
Data collection
The dataset used in this study was based on the data collected from the 2016 South African online survey on student engagement carried out by the Durban University of Technology (DUT) in South Africa. The DUT is one of the five South African universities that is participating in the Siyaphumelela Saide project focusing on student success at South African universities. The project is funded by the Kresge foundation to the tune of 2.9 million US dollars to support data analytics capability at South African universities. The principal goal of the Kresge foundation is to significantly improve student learning outcomes and success using data (
The engagement framework presents four dimensions, which are the academic challenge, learning with peers, experience with staff and the campus environment. These dimensions are further sub-divided to form 10 engagement practices, which are the higher-order learning, reflective and integrative learning, learning strategies, quantitative reasoning, collaborative learning, discussions with diverse others, student-staff interaction, effective teaching practices, quality of interaction and supportive environment. The 10 engagement practices are together measured with 47 activities for proper evaluation of each engagement practice. Moreover, 41 variables describe information on socio-demographic characteristics of students. In total, 88 variables representing the dataset fields were used for a knowledge mining task. The dataset contains 1399 examples that represent perceptions of male and female students of the DUT and they constitute the dataset records. All fields of the dataset are of numeric data type, which makes data preprocessing or processing simple. A lot of records were missing on certain fields, which has resulted in the exclusion of respondents with incomplete information. Data analytics have been performed on 904 records with 88 fields after removing the missing records from the engagement dataset of this study.
Cluster evaluation
The general problem often associated with the partitioning based data clustering algorithms is to ascertain an appropriate number of clusters [48]. The cluster validity indices of the Silhouette index, NbClust package and Elbow method were examined using the
Algorithm evaluation
In this study, five different clustering algorithms have been investigated, evaluated and ranked based on cluster potentiality. The primary reason for selecting these clustering algorithms is because they are famous, they belong to the category of cluster structure modeling and their implementations are readily available in many data analytics software tools. To determine the best cluster structure for the
The hierarchical clustering algorithm engages linkage and distance functions for data clustering. Different combinations of 8 linkage functions with 5 distance functions were experimentally evaluated to determine the best performed hierarchical clustering method. The efficiency of the function combinations was evaluated using the Cophenetic correlation coefficient (CPCC), which is a widely used metric in literature [31, 56]. The CPCC is the Pearson correlation between the actual distance and predicted distance based on a particular hierarchical configuration. A value of 0.75 or above needs to be achieved for a clustering to be considered useful [57]. The optimal value of epsilon was determined for the DBSCAN algorithm using the
The within the sum of square error plot for k-means, Hierarchical and Fuzzy c-means clustering algorithms.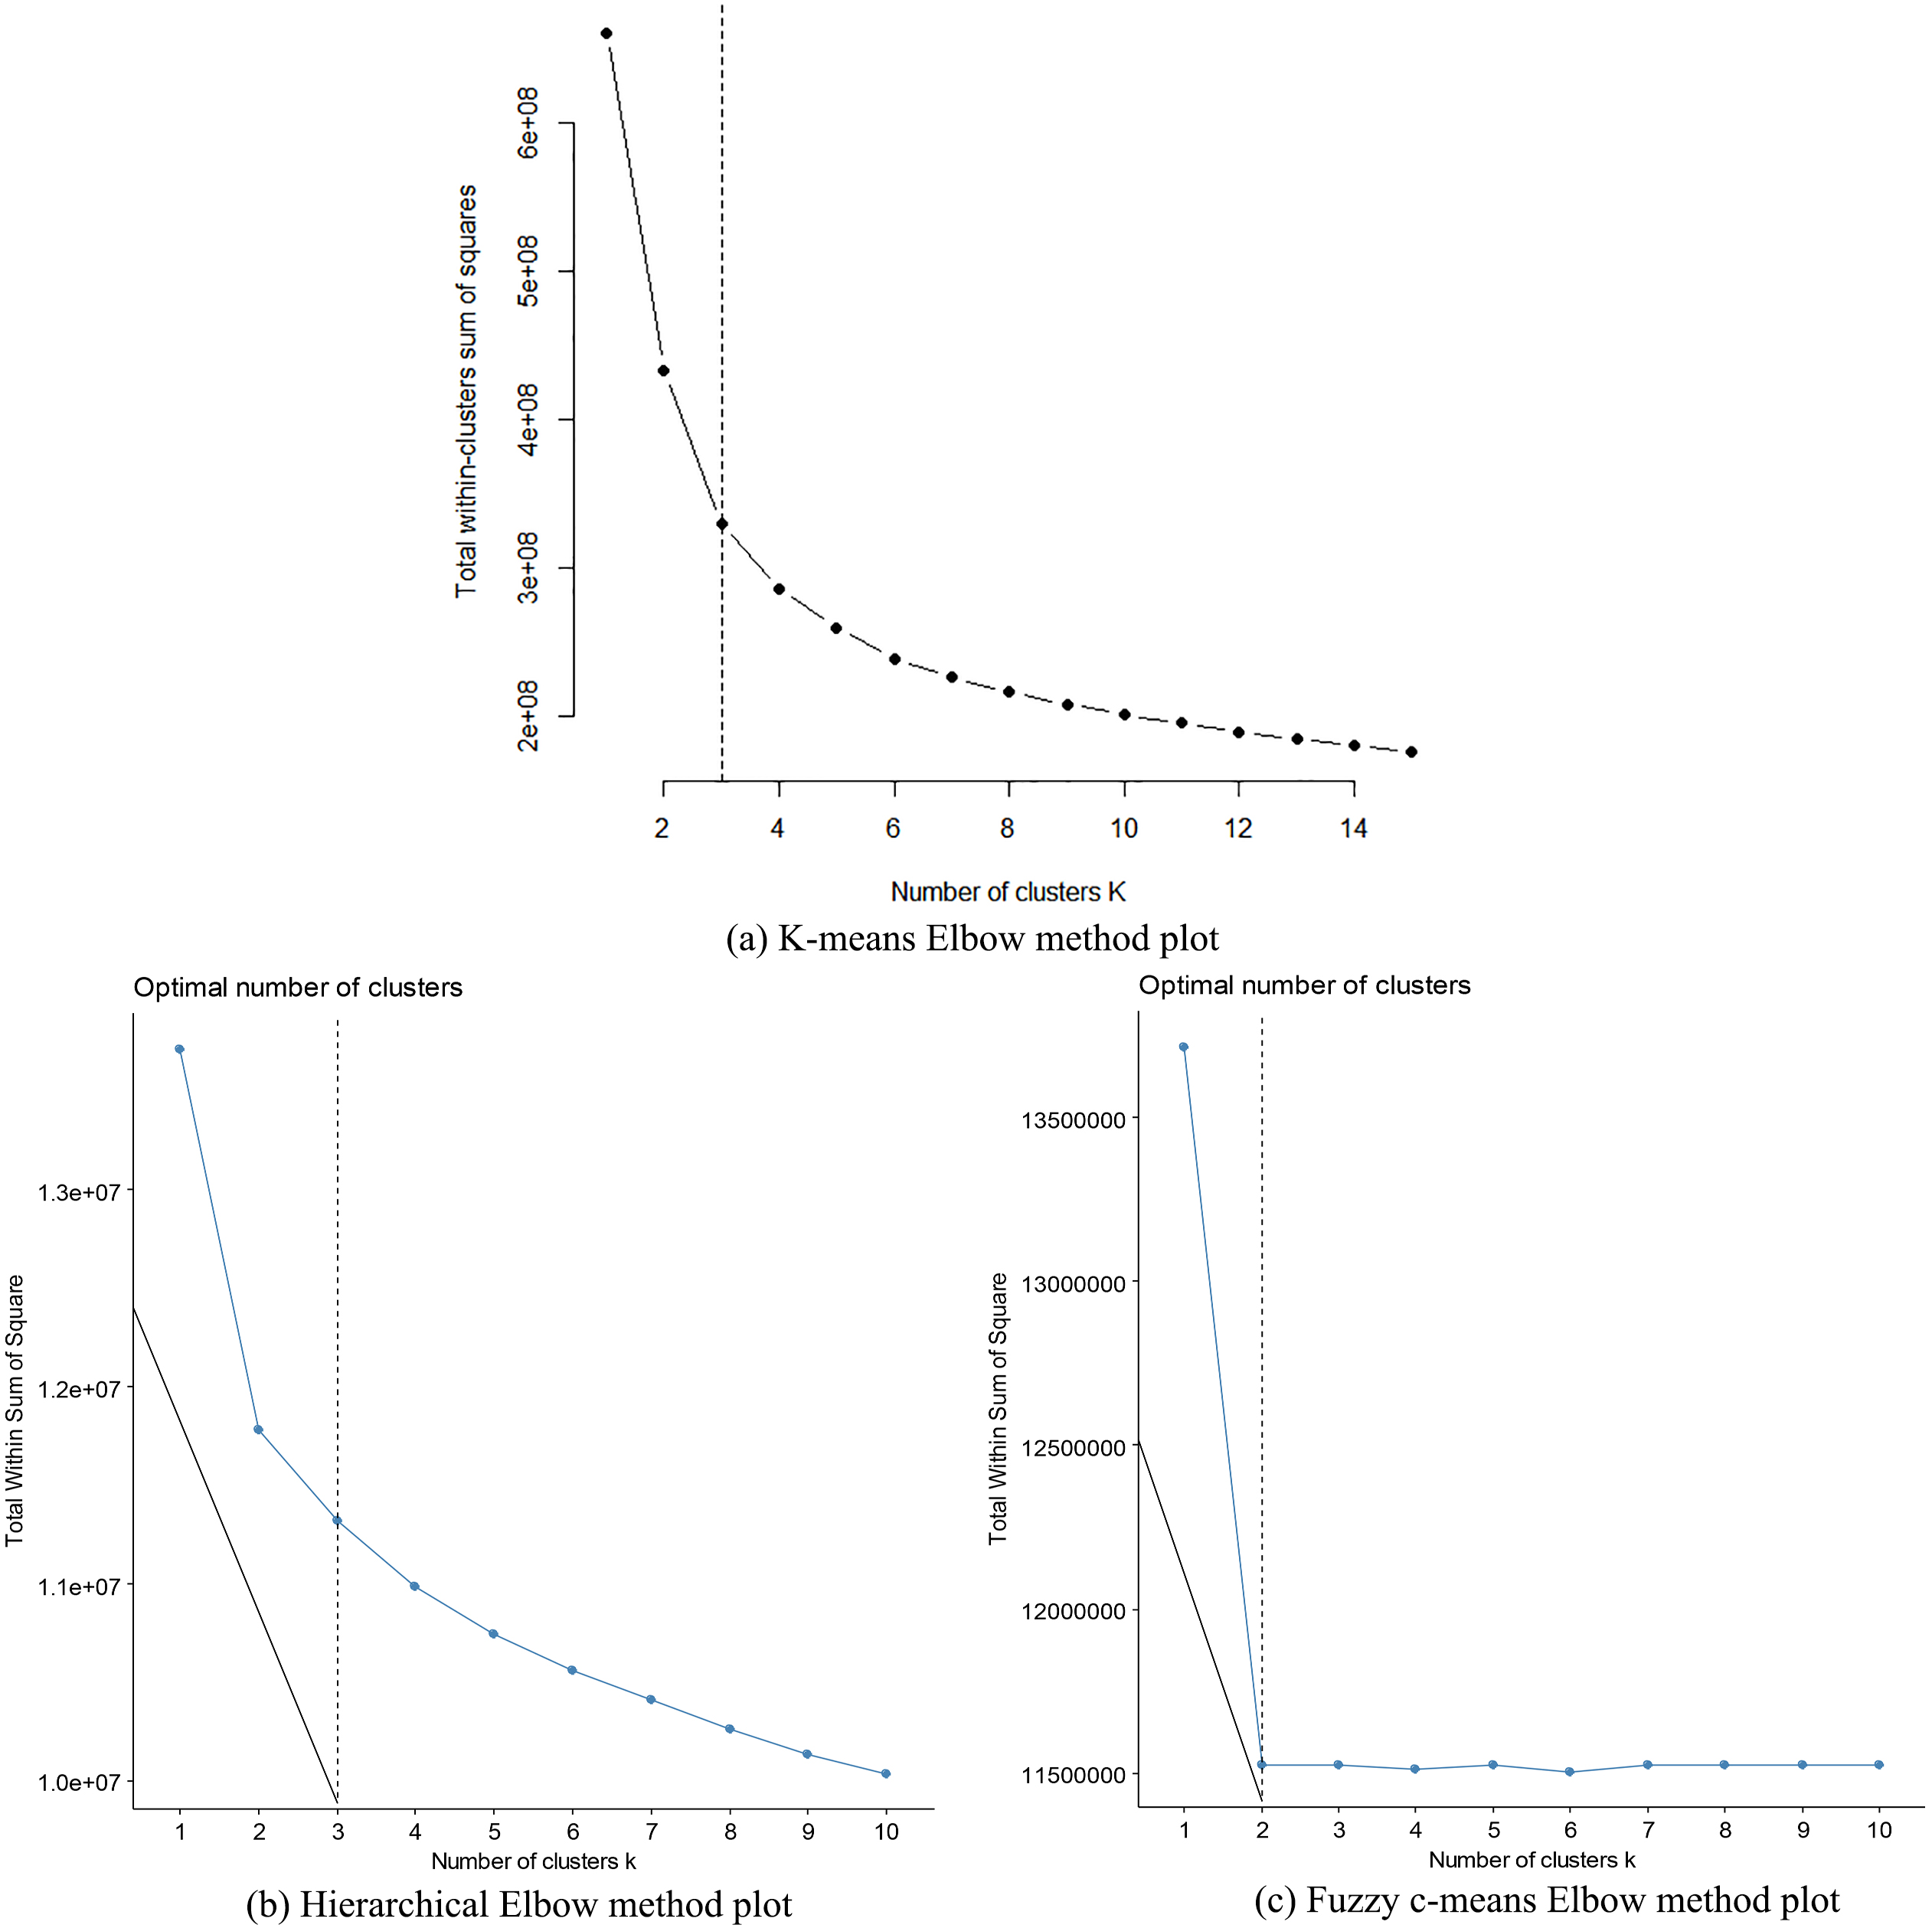
The average silhouette width for k-means, Hierarchical and Fuzzy c-means clustering algorithms.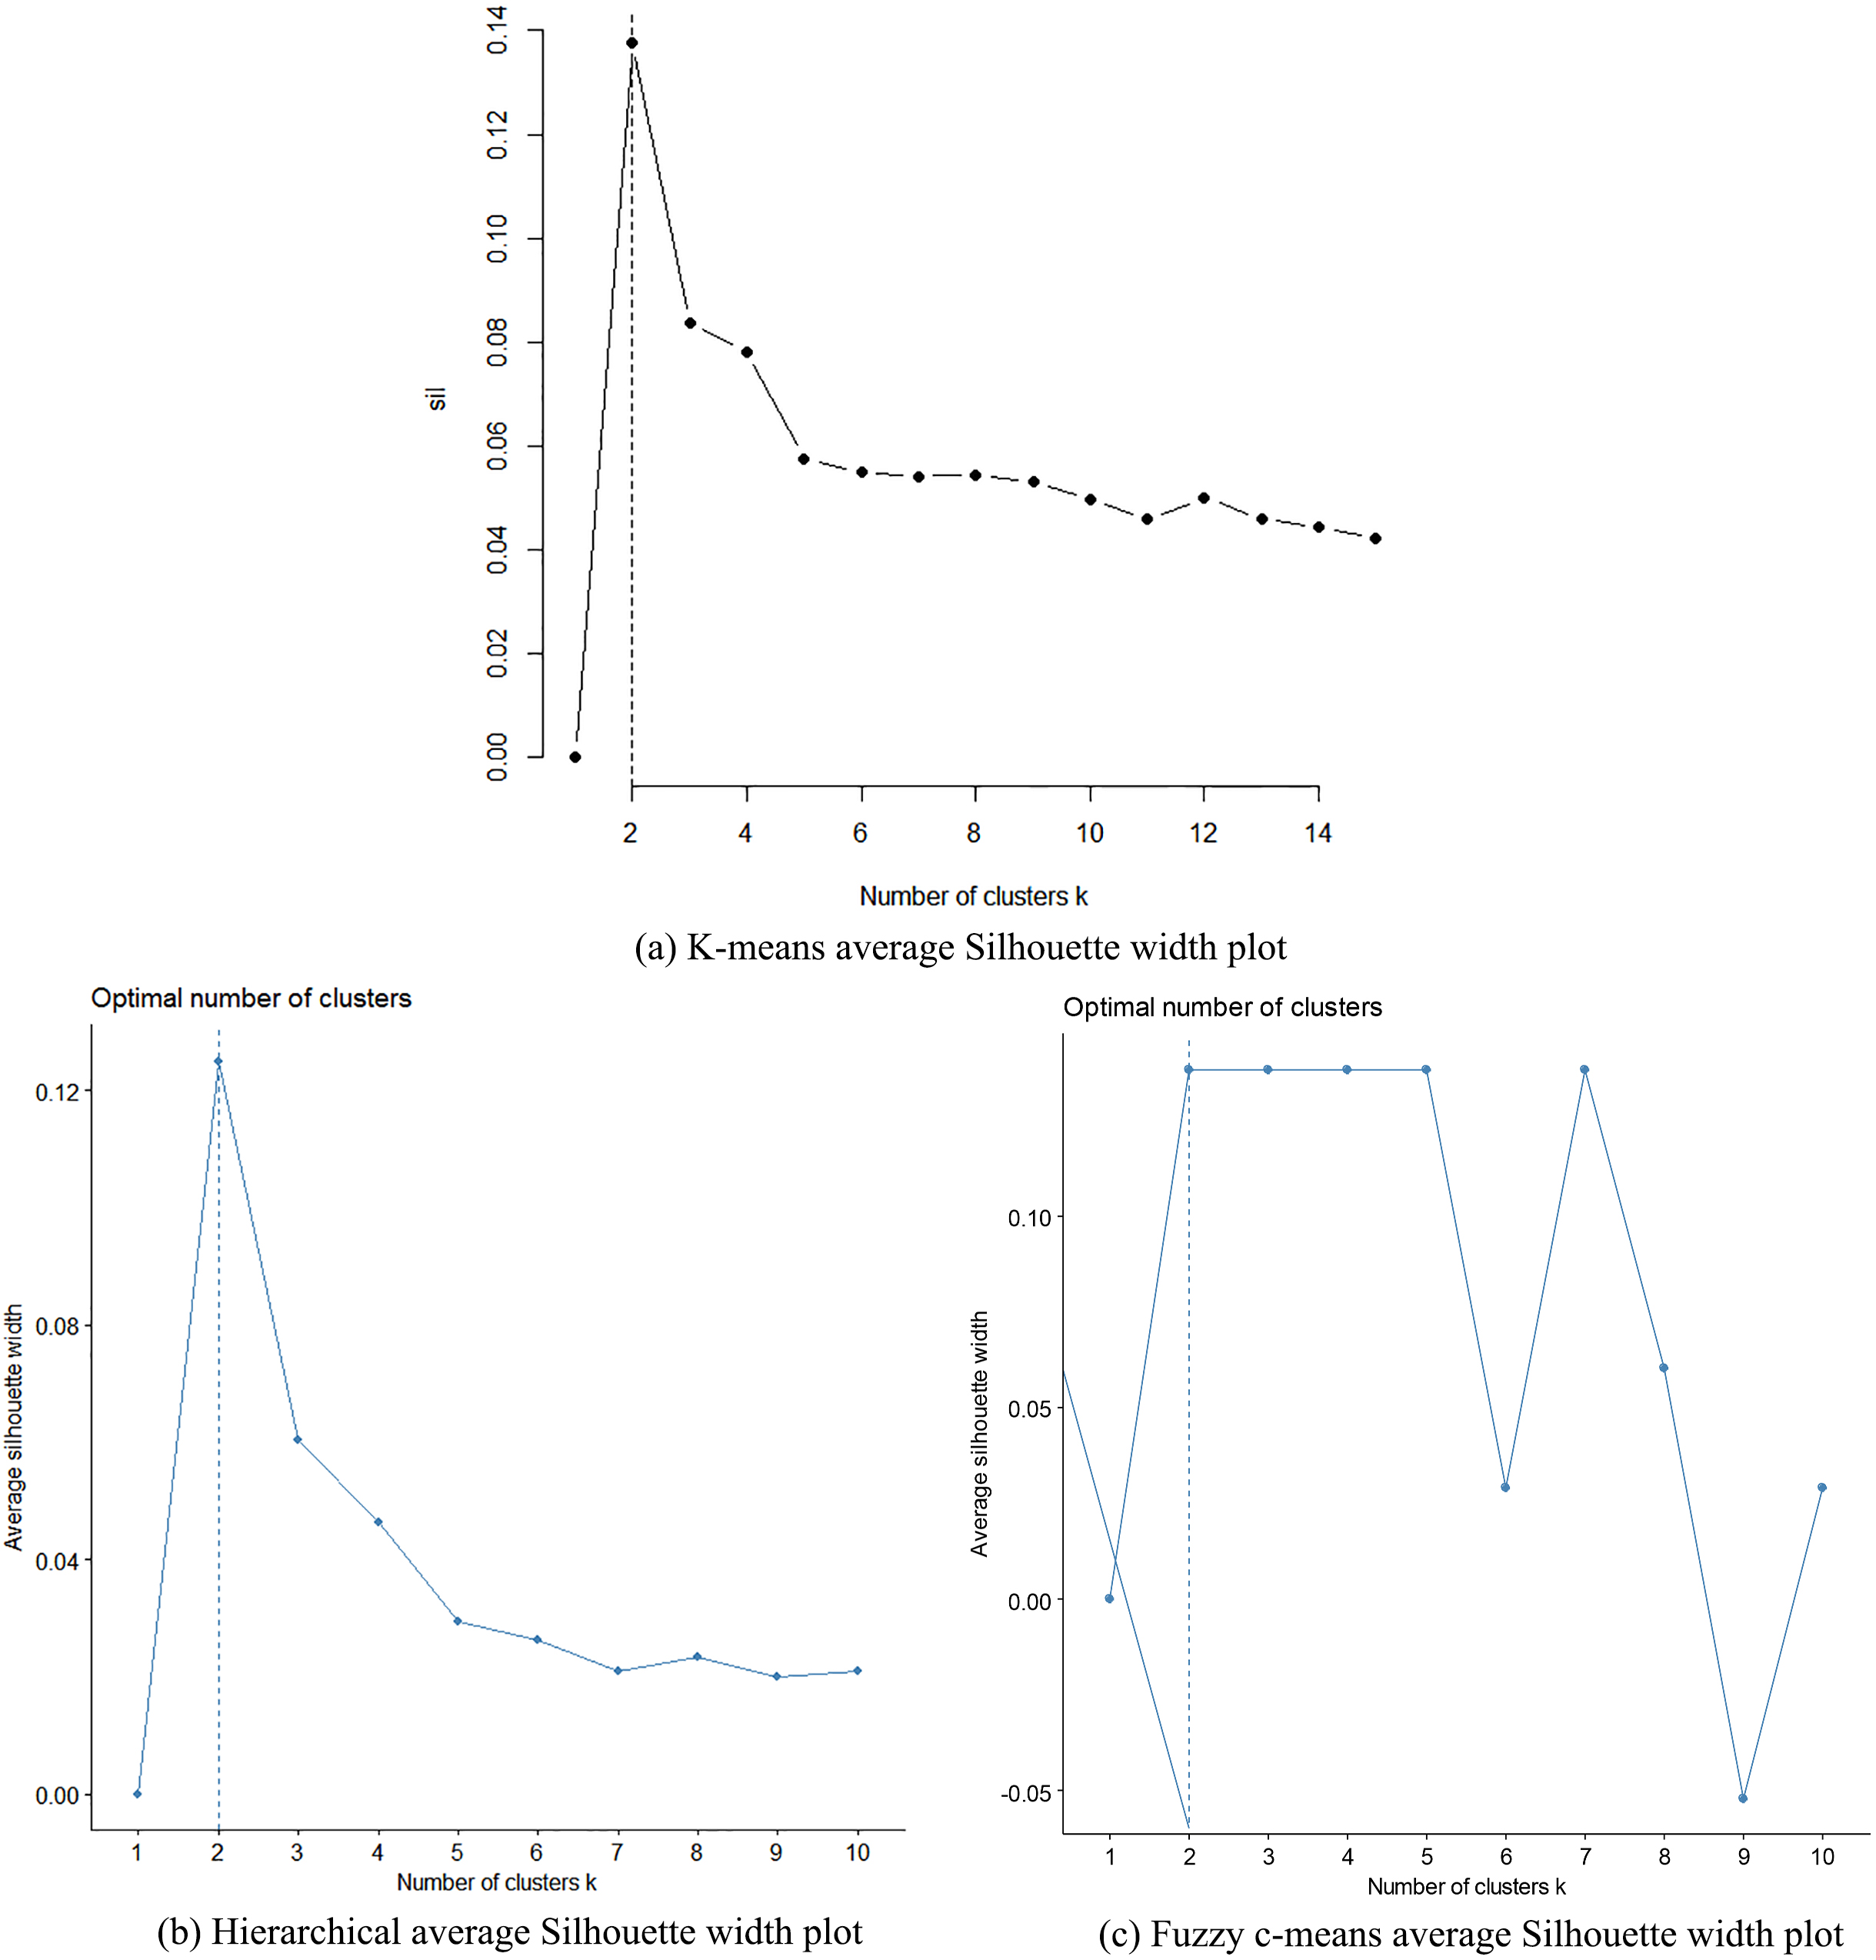
The NbClust graphs representing frequency of 30 indices cluster evaluation output.
The Bar chart for average Silhouette width versus distance function for k-means algorithm.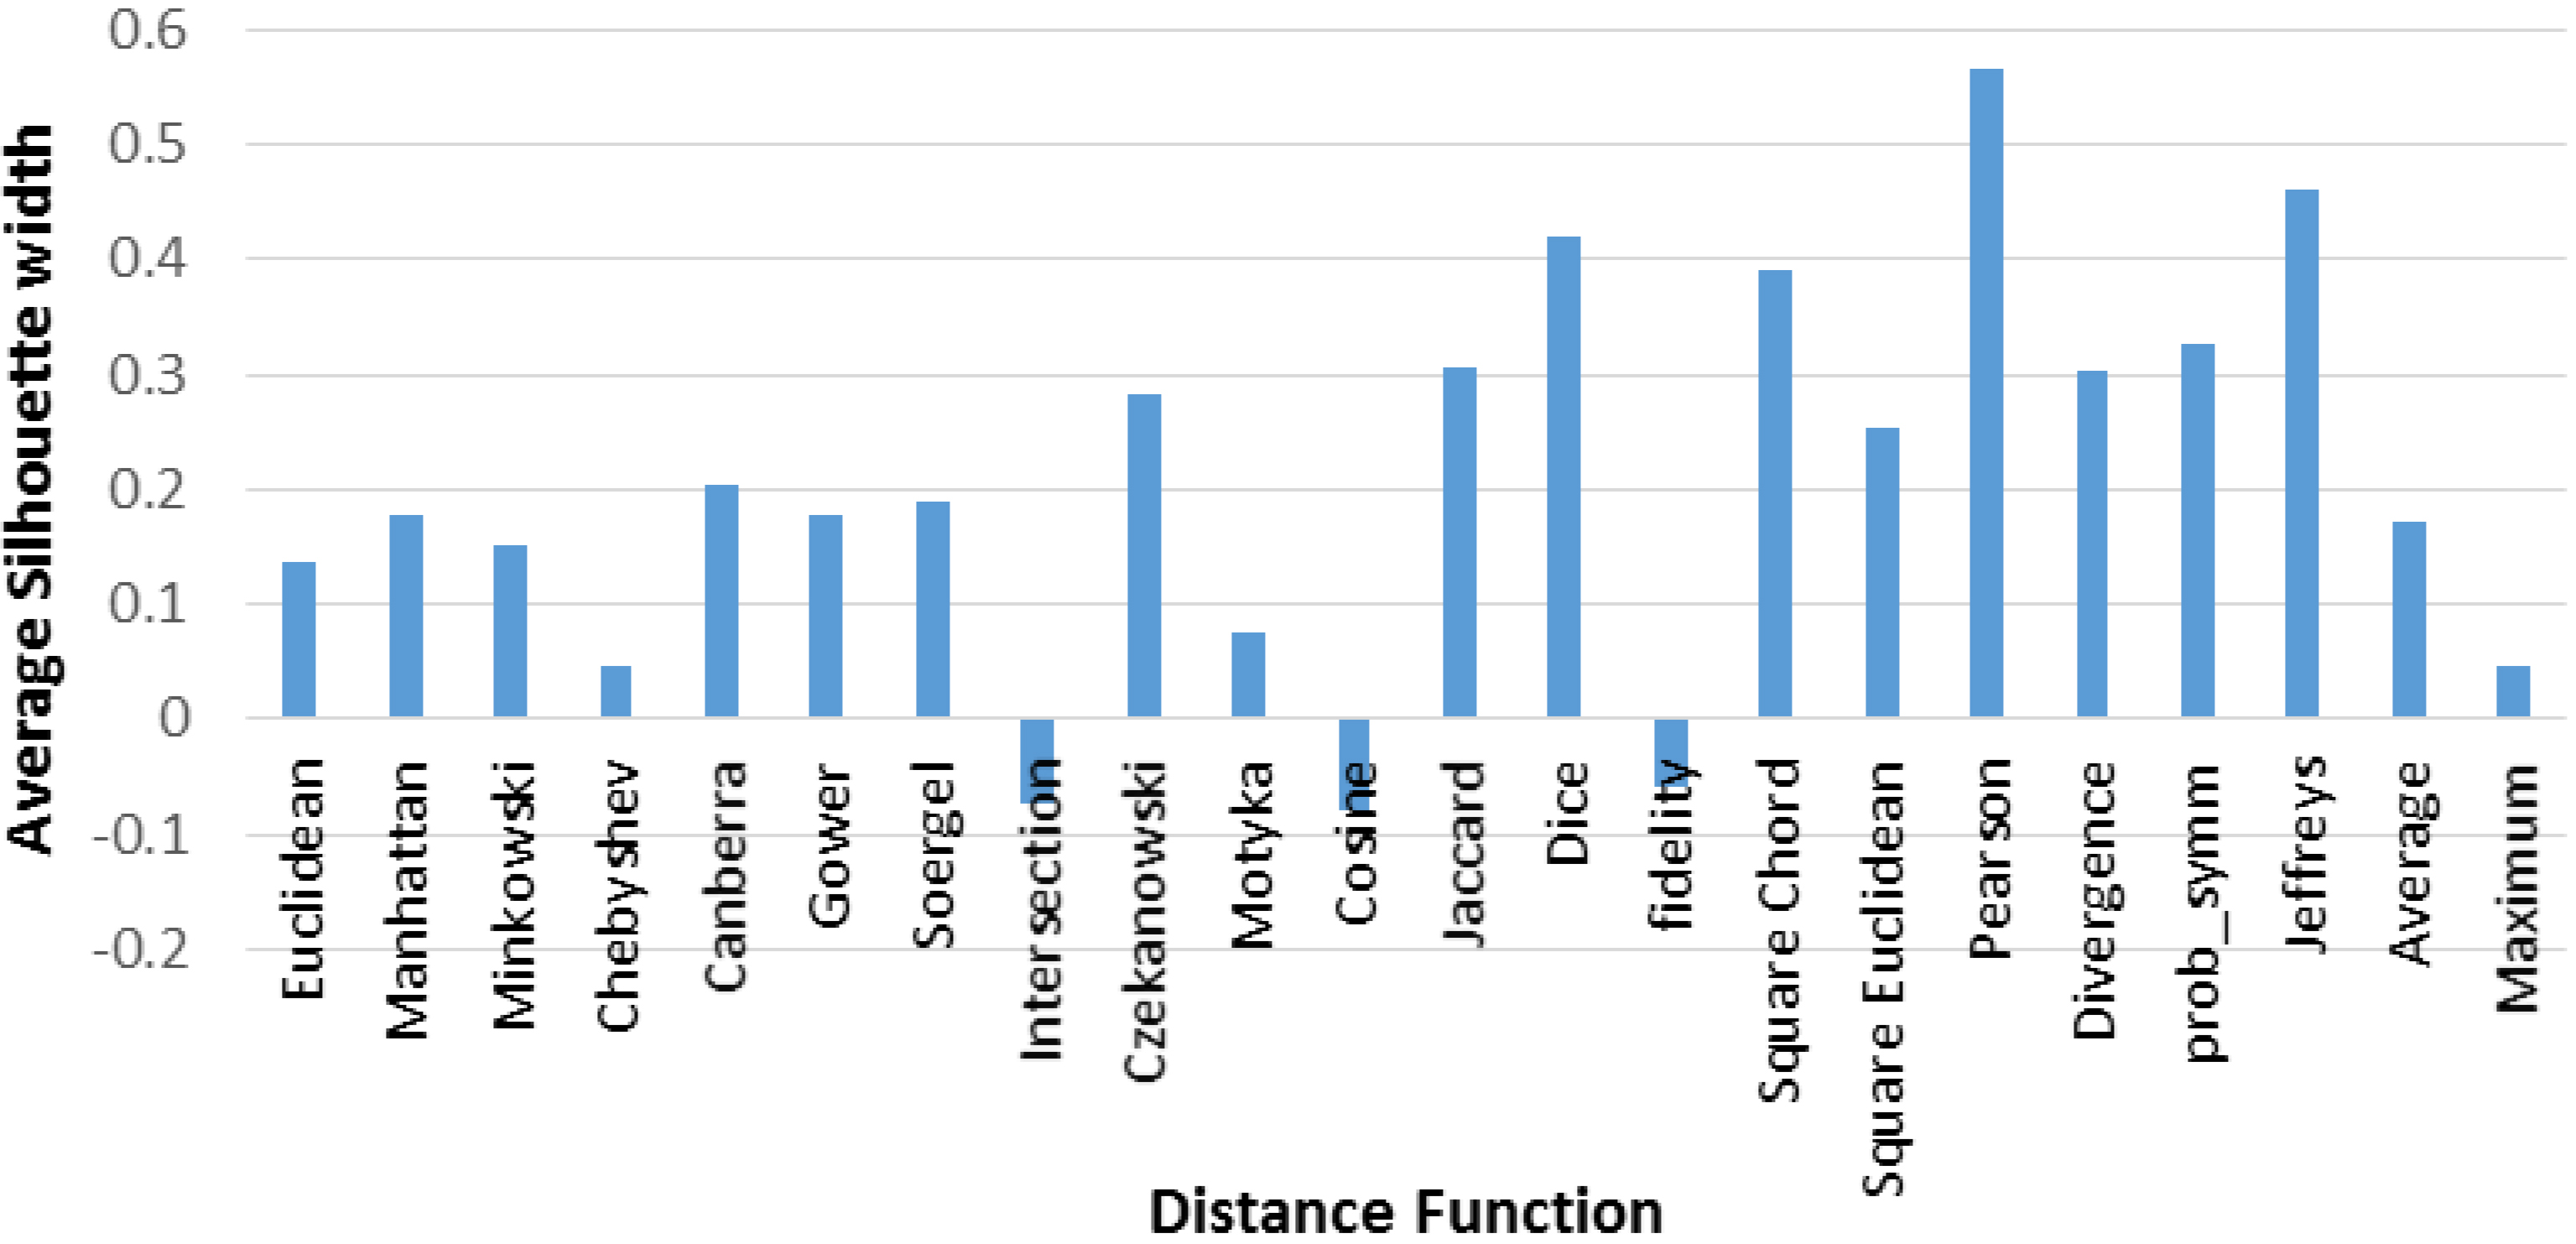
The Bar chart for average Dunn index value versus distance function for k-means algorithm.
Bar chart for partition entropy versus distance function for k-means algorithm.
The overall ranking of five clustering algorithms has been done using the average number of data points per cluster [31]. This was achieved using the cluster potentiality based on the mean deviation (MD) statistics. The lower the MD value, the better the cluster structure, which suggests less deviation of the objects in clusters, as compared to the average number of objects in the corresponding clusters taken collectively [31]. The
In terms of its operational mode, the
The cluster validity indices for k-means algorithm with 22 distance functions where the higher the Silhouette value, Dunn’s index and the smaller the entropy value, the better the clustering result
The cluster validity indices for k-means algorithm with 22 distance functions where the higher the Silhouette value, Dunn’s index and the smaller the entropy value, the better the clustering result
The k-nearest neighbor distances in a matrix of points plot for DBSCAN and cluster structure plot.
CPCC values for the hierarchical clustering of various combinations of linkages and distance functions
Fuzzy c-means performance with five distance functions
Number of data objects obtained by using 5 clustering algorithms in two clusters
The Silhouette index, NbClust package and Elbow method were faithfully engaged in a series of experiments to determine the best possible number of clusters using the k-means, hierarchical, DBSCAN, EM and Fuzzy c-means algorithms. The experiments were repeated 100 times to estimate the average Silhouette values with the k-means, hierarchical clustering and Fuzzy c-means algorithms. The results are shown in Fig. 2a–c, Fig. 3a–c and Fig. 4a–f. Specifically, in Fig. 2a and b, the Elbow method for the k-means and hierarchical clustering suggests 3 clusters, while in Fig. 2c, the Fuzzy c-means algorithm indicates 2 clusters. From Fig. 3a–c, the Silhouette with the k-means, Hierarchical clustering and Fuzzy c-means suggests 2 clusters. In Fig. 4a–e, the NbClust package suggests 2 clusters, while in Fig. 4f, the NbClust package for the average hierarchical clustering using the Manhattan distance function suggests 8 clusters. Hence, using the principle of majority voting, 2 clusters have been taken as optimal.
Figures 5–7 respectively give the bar charts of the average Silhouette width, Dunn’s index and Partition entropy against 22 distance functions. In Figs 5 and 6, the Pearson correlation has the highest average Silhouette width and Dunn’s index respectively. In Fig. 7, the Dice has the smallest partition entropy (0.38) followed by the Pearson correlation (0.41). This result suggests the Pearson correlation as the best distance function for k-means clustering. Figure 8a and b shows the k-nearest neighbor distance graph for computing optimal epsilon for the DBSCAN. The plot of the corresponding cluster structure shows outliers, core and border objects respectively. From Fig. 8a, the knee for k-nearest neighbor distance plot was found at 90, which suggests the best value for epsilon, while the MinPts value is 6. In Fig. 8b, the DBSCAN cluster structure (804, 67 and 33) plot shows the overcrowding of outliers around the two clusters. The cluster structure shows 2 clusters and 804 noise points because of the capability of the DBSCAN algorithm to discover noise in a dataset [59], making it inappropriateness for the knowledge mining task considered.
The result of 3 internal validity metrics used to evaluate the best cluster structure for the k-means algorithm against 22 distance functions is presented in Table 1. The result of the CPCC for hierarchical clustering is presented in Table 2, where it is evident that a combination of Canberra distance with a centroid linkage function has the highest value of CPCC. This is the best possible parameter for achieving an ideal hierarchical clustering for the task of knowledge mining considered. In the experimental analysis of the Fuzzy c-means algorithm, 5 different distance functions were evaluated over 100 maximum iterations with 2 clusters. Results were collected after 100 times of repeating the algorithm for each distance function. The final experimental result is shown in Table 3, where it can be seen that the Cosine distance function has recorded the smallest average execution time of 0.96 s and average converging iteration rate of 9.76. The Minkowski distance function shows the largest average execution time of 5.4 s and average converging iteration rate of 45.07. This result indicates that engaging Fuzzy c-means algorithm with the Cosine distance function utilizes less computing time and converges faster when compared to others, irrespective of its performance. Nevertheless, the Euclidean distance function gives the best performance for all the indices evaluated for the Fuzzy c-means algorithm when compared to other algorithms. This recommends Euclidean as a good distance function to apply in Fuzzy c-means algorithm for the task of knowledge mining considered in this study.
The overall result of ranking five data clustering algorithms based on the average number of data objects per cluster is shown in Table 4. The result shows that k-means algorithm has the lowest value of mean deviation, which suggests it with the Pearson correlation as the best ranked algorithm for the task of knowledge mining in a student engagement dataset.
Findings
The findings of this study have shown that a student engagement dataset could be clustered into two categories, which likely indicate positive and negative perceptions of students on engagement. The findings show that when benchmarking the k-means algorithm with different distance functions, some distance functions, majorly from the Shannon’s entropy family [51] such as Kullback-Leibler, K-divergence, Topsoe, Jensen difference and Jensen-Shannon broke down when applied to the dataset of this study. This observed curb can be attributed to the fact that these functions are logarithmic in nature, which are mainly defined for positive and non-zero values. It is possible to overcome this inherent curb by transforming the functions to realize the shifted equivalent functions that would cater for negativity and singularity, which is not considered in this study. The Pearson correlation is the best choice of a distance function for k-means clustering (Table 1). This finding is contrary to what exists in [31], where Cosine stood out as the best distance function for the task of knowledge mining in manufacturing firms as a result of the nature of the dataset investigated. It was also found to be the fastest distance function in terms of convergence with the k-means and K-medoids algorithms when applied to a large dimensional continues dataset in [30].
It is observed from Table 2 that most of the cluster structures generated by the hierarchical clustering algorithm have unequal cluster sizes. This could be as a result of how the algorithm divides data into clusters. A cluster structure is majorly dependent on the chosen distance and linkage functions [31]. The average and centroid methods were found to give the best performance in terms of CPCC and generated unequal cluster sizes. This behavior was also observed in [56], using a different dataset. The Ward method on the contrary, gave almost equal sizes of cluster structures, but the performance was bad in terms of CPCC. The Ward performance could be as a result of outliers in the dataset of this study as highlighted under the review [56]. The Canberra distance function performed outstandingly with all the linkage functions investigated for the hierarchical clustering with a high CPCC close to 1, except with the Ward linkages (Table 2). The plot of DBSCAN cluster structure (Fig. 8b), reveals the occurrence of noise in the investigated dataset, which because of its sensitivity to noise makes it unable for the task of knowledge mining in a student engagement dataset. The Euclidean distance function was able to maximize the Silhouette index and minimize the modified partition coefficient when compared to other distance functions considered for Fuzzy c-means clustering algorithm (Table 3).
In the overall ranking, the k-means algorithm provides the best cluster, followed by the hierarchical clustering algorithm (Table 4). The Fuzzy c-means algorithm is the least performed clustering algorithm, while the EM algorithm could not give a stable result. The DBSCAN algorithm was found incongruous (Fig. 8), because of its high sensitivity to noise in the investigated dataset [61]. The unstable performance of the EM algorithm is suspected to be as a result of its capability to detect outliers. This intrinsic limitation could be improved by evaluating outliers in a student engagement dataset to identify those records that could possibly bias result before engaging a data clustering algorithm.
Conclusion
In general, focusing on the objective of this study, selecting the best clustering algorithm for the task of knowledge mining in a student engagement dataset is quite challenging because the performance of a clustering algorithm is majorly data dependent. The objective of this study was to experimentally evaluate the performances of five famous clustering algorithms to determine the best one for the task of knowledge mining in a student engagement dataset. Clusters have been evaluated using the Silhouette index, Nbluster package and Elbow method to find the best possible number of clusters in a student engagement dataset in accordance with what exists in literature. All the three methods have found two clusters in the dataset of this study. Three cluster validity indices of the Dunn, Silhouette and partition entropy have been fittingly applied to benchmark the k-means clustering algorithm with 22 different distance functions because of the unlabeled nature of the investigated dataset, while the Pearson correlation stood out as the best. The Cophenetic correlation coefficient was used to benchmark 8 linkage functions and different distance functions used with the hierarchical clustering algorithm in harmony with the previous works. In addition, for other algorithms, different indices have been implemented to get the best cluster from them.
The methodology of this study becomes a plausible device to identify factors impacting on student engagement and locate the aspects of student engagement practices and activities to be improved. This study has allowed to identify student engagement perceptions by social-demographic characteristics of students. In this way, we were able to identify valuable information that allows to recommend alternative student engagement practices and activities using the appropriate criteria that can influence policy change in undergraduate education. In future work, it is prudent to carry out an evaluation of outlier to identify records that could possibly bias results of knowledge mining in a student engagement dataset. In addition, practical application of the k-means clustering algorithm for the detection of useful patterns that could inform the building of a student engagement theory is highly desirable.