
Abstract
This study proposes a novel distance metric learning method called evolutionary distance metric learning (EDML) to improve clustering quality that simultaneously evaluates inter- and intra-clusters. While we also provide an extension which integrates kernelization technique to the proposed method namely kernelized evolutionary distance metric learning (K-EDML). Hence, the non-linear transformation of distance metric can be performed while maintaining all properties of EDML. The proposed methods are able to handle either class label or pairwise constraints and directly improve any clustering index as an objective function. Both can be viewed as utilization of cluster-level soft constraints, unlike other instance-level hard constraints which sometimes collapse the clustering. Also, maintaining neighbor relation of clusters can lead to better visualization of the clustering result. For multimodality problem of the objective function, an evolutionary algorithm (EA), differential evolution with self-adapting control parameters and generalized opposition-based learning (GOjDE), is employed to optimize a metric transform matrix based on the Mahalanobis distance. We empirically demonstrate the drawback of EDML in non-linearly separable input space and illustrate the benefit of kernel function to extension K-EDML method by showing its superior result benefits to other clustering algorithms in the semi-supervised clustering on various real-world datasets.
Keywords
Introduction
In data mining and machine learning, the definition of distance between two data points substantially affects clustering and classification tasks. Recently, varieties of distance metric learning (DML) methods have been proposed to improve the accuracy of data mining tasks by learning a distance metric from a dataset [35, 15, 41]. Example approaches include nearest neighbor classification [32, 11], clustering [14, 56, 6], image ranking [16, 44, 27, 42, 53], and data visualization [23, 50].
This research is focusing on the DML in clustering domain, precisely semi-supervised clustering. Semi-supervised clustering [13, 14, 56] has been proposed to take advantage of background information, e.g., pairwise constraints, in the clustering. Traditionally Xing et al. have attempted to learn a similarity metric from side information [14], such as constraints on which pairs of documents must or must not appear in the same cluster [33], so that the ideal clustering can be produced. Semi-supervised clustering has emerged as an interesting alternative in the last years. These algorithms improve the clustering quality through external knowledge conveyed in the form of constraints. These constraints are used to guide the clustering process and can be directly derived from original data (using partially labeled data) or provided by a user, trying to adapt clustering results to his/her expectations [48]. Figure 1 illustrates the benefit of DML in clustering. Figure 1a shows data points with three classes (i.e., circles, squares, and stars) and three initial partitions (or clusters) in Euclidean space; one of the clusters has data points in all three classes. To correctly cluster every data point, the data space transformation stretches the partitions as shown in Fig. 1b such that every data point is correctly clustered. DML methods tries to find the appropriate transformation of the data space globally or locally so that the data points of the same class should be in neighbors and the data points of the different classes should be in distant places.
Conceptual diagram of distance metric transformation.
However, the conventional semi-supervised clustering methods have the following drawbacks. It is reported that instance-level constraints, sometimes destroy the clustering quality [21, 34, 16], depending on relationship between the constraints and the data distribution. Moreover, there is no monotonicity to the number of constraints, that is the improvement of cluster quality is not guaranteed by adding constraints. These drawbacks are critical issues in practice. Instead of including the pairwise constraints into the objective function as penalty, we propose a methodology to directly improve a cluster validity index such as purity, F-measure, and entropy. The neighbor relation of clusters expects to propagate estimations of classes for unlabeled data by neighboring labeled data, like other DML methods such as neighborhood components analysis [23] or large-margin nearest neighbor classification [32]. In our work, the smoothed clustering validity index [28], which is an objective function, is used to evaluate overall cluster structure by simultaneously evaluate inter- and intra-clusters. Thus, our method can be regarded as based on cluster-level soft constraints.
In general, a function of the clustering index, either conventional or smoothed one, is massively multimodal when distance metrics vary. Hence, the proposed method named evolutionary distance metric learning (EDML) framework utilizes an evolutionary algorithm for this multimodality problem to search a sufficiently optimal metric transformation. The advantages of an evolutionary algorithm (EA) are as follows: (1) EAs can provide a solution even to problems that are hard to formulate using mathematical programming; (2) EAs sometimes heuristically discover unexpected solutions; and (3) EAs are highly parallelizable and can therefore make use of recent computational resources as multicore CPUs or PC clusters. Classic optimization methods such as gradient descent require a differentiable objective function, thus we addressed this by differential evolution (DE) [45] algorithm, since DE does not require the optimization problem to be differentiable. Thus, our work utilizes differential evolution with self-adapting control parameters and generalized opposition-based learning (GOjDE) [18] for a real-valued optimization problem, which has a high search-ability without requiring parameter adjustments. Koloseni et al. [9] proposed the DML method using DE [45] for classification. Our proposed EDML is for clustering, while their work supports the capability of applying DE to DML.
EDML provides outstanding results over other semi-supervised clustering in many dataset [57, 60, 58]; however, it can only perform a linear transformation, like most of the DML techniques, which yields small benefit to non-linearly separable data. Many kernel-based distance metric learning approaches have been proposed to address non-linearly separable data [10, 37, 46, 11, 8]. Thus, this study proposes kernelized evolutionary distance metric learning (K-EDML), a DML method which provides an integration of kernelization technique and EDML in order to address the problem of non-linearly separable data while maintaining all properties of EDML simultaneously. Therefore, the non-linear transformation of the distance metric can be performed while maintaining the optimized cluster validity index by an evolutionary algorithm.
The contributions of this work are as follows:
Proposing a novel semi-supervised distance metric learning for clustering techniques, by optimizing a cluster validity index that can be seen as utilizing cluster-level soft constraints Proposing an extension for semi-supervised distance metric learning for clustering techniques, by integrating the kernelization technique to address non-linearly separable data The neighborhood smoothing of a clustering index is introduced for better visualization of clustering result and for propagating label information to unlabeled data Because of multimodality of clustering validity index as the objective function, an evolutionary algorithm is utilized for searching the sufficiently optimal distance metric
The experiments1
in this paper show that (1) GOjDE discovers better solution than other evolutionary algorithms, (2) the ratio of labels samples affect the result, (3) the smoothing of the clustering index with DML refines neighboring clusters for better visualization, (4) EDML and K-EDML outperforms the conventional semi-supervised clustering methods for benchmark datasets. Lastly, (5) the problem of EDML which yields insignificant to non-linearly separable data is addressed by K-EDML which is an integration of kernelization technique to EDML.Distance metric learning
Distance metric learning (DML) [35] attempts to optimize a metric to improve classification or clustering. Example approaches include nearest neighbor classification [32, 11], clustering [14, 56, 6], image ranking [16, 44, 27, 42, 53], and data visualization [23, 50]. It can be categorized into 3 categories according to the amount of label information:
Unsupervised DML attempts to identify geometric relationships in the Euclidean data space. Normally, unsupervised DML methods are viewed as dimensional reduction or projection into low-dimensional space while preserving neighbor relations of data points. Classical method of multidimensional scaling (MDS) fall into this category. ISOMAP [26], local linear embedding (LLE) [49], and Laplacian eigenmaps [39] can also be called manifold learning, which is an approach for learning the nonlinear structure of the data distribution. Supervised DML attempts to learn a distance metric transform function based on auxiliary information, including class labels and pairwise constraints of must-links and cannot-links. So far, a lot of supervised DML algorithms have been proposed, such as Mahalanobis distance learning model which first proposed by Xing et al. [14], Distance Metric Learning for Large Margin Nearest Neighbor Classification(LMNN) [32], linear DML for ranking (LDMLR) [4], Online Algorithm for Scalable Image Similarity learning (OASIS) [16], DML using dropout [44], and Geometric Mean Metric Learning (GMML) [42]. Semi-supervised DML combines an advantage of supervised and unsupervised DML, which attempts to use unlabeled data to help supervised metric learning which has limited of auxiliary information to learn an appropriate metric such that it satisfies the constraints. Example algorithms are MPC-Kmeans [38], Information-Theoretic Metric Learning (ITML) [25], Hierarchical Confidence-based Active Clustering with Metric learning [6], An Intrinsic Approach for Semi-supervised Distance Metric Learning [53].
Moreover, DML can be viewed in another perspective as global and local DML: Global distance metric learning[14, 1, 23, 25, 32, 64, 16, 61, 44, 8, 42, 6, 53] has a common metric transformation in a whole data space, and attempts to learn the optimal transformation by preserving all the elements of classes close to each other while separating different classes. Conversely, local distance metric learning[36, 32, 43] attempts to locally satisfy the constraints rather than simultaneously satisfy all constraints. This locality is particularly useful for information retrieval and
In addition, there are several nonlinear methods which learn more flexible metrics in order to fit into non-linearly separable data [10], for instance, the kernelization technique aid the linear learning algorithm by a implicit nonlinear mapping function, e.g., a nonparametric kernel matrix [37], Semi-supervised Kernel k-means (SS-K-KMN) [5], and Kernel-Based Distance Metric Learning for Ranking [8]. Moreover, a nonlinear distance metric could be learned via non-linear Gradient Boosting Regression Trees (GBRT) [11] or a deep feedforward neural network [62].
Our proposed EDML and K-EDML both have a distance metric learning as a basis and they are categorized as semi-supervised linear global DML and semi-supervised non-linear global DML respectively.
Semi-supervised clustering tries to improve clustering quality aiding by external knowledge, mostly pairwise constraints. COP-Kmeans [33] is the first attempt to introduce pairwise constraints to K-means clustering. The cluster assignments of data points are forcibly modified to satisfy the constraints (hard-constraints), and the centroids are updated based on the modified assignments. MPC-Kmeans [38] uses soft-constraints to allow violating some constraints, and integrates with DML as well. Then, Information-Theoretic Metric Learning (ITML) [25] uses the LogDet divergence regularization which will later be used in several other Mahalanobis distance learning methods. Hierarchical Confidence-based Active Clustering with Metric Learning (HCAC-ML) [6] is one of the successor of ITML which generate the constraints from hierarchical information and feed to ITML. In addition, there are several nonlinear methods which learn more flexible metrics, for example, a nonparametric kernel matrix [37], Semi-Supervised Kernel k-means (SS-K-KMN) [5].
As mentioned earlier, the instance-level constraints sometimes collapse the clustering. Davidson et al. [21] introduced Coherence that is the degree of agreement between the constraints to measure the property of a given set of constraints. Constraints with low coherence have contradictions in the data space. Thus it will be difficult to fully satisfy the constraints and can lead the clustering to undesirable result. Meanwhile, our EDML and K-EDML utilizes cluster-level constraints, which tries to satisfy the constraints as much as possible guided by a clustering validity index.
Kernel function
Kernel trick is a technique to map the feature space to a higher dimensional feature space using a nonlinear function. Given a dataset
For example the polynomial kernel function is as follows:
In two dimensional space, given
Thus, the mapping function is
Figure 2 shows the visualization of data space on synthetic data. Each point denotes the data points and color denotes the class of each point. In Fig. 2a, two classes are not linearly separable. On the other hand, Fig. 2b shows the transformed data space using polynomial mapping function in Eq. (4), this visualization shows the linearly separations of two classes.
Example of the mapping function of polynomial kernel on synthetic data.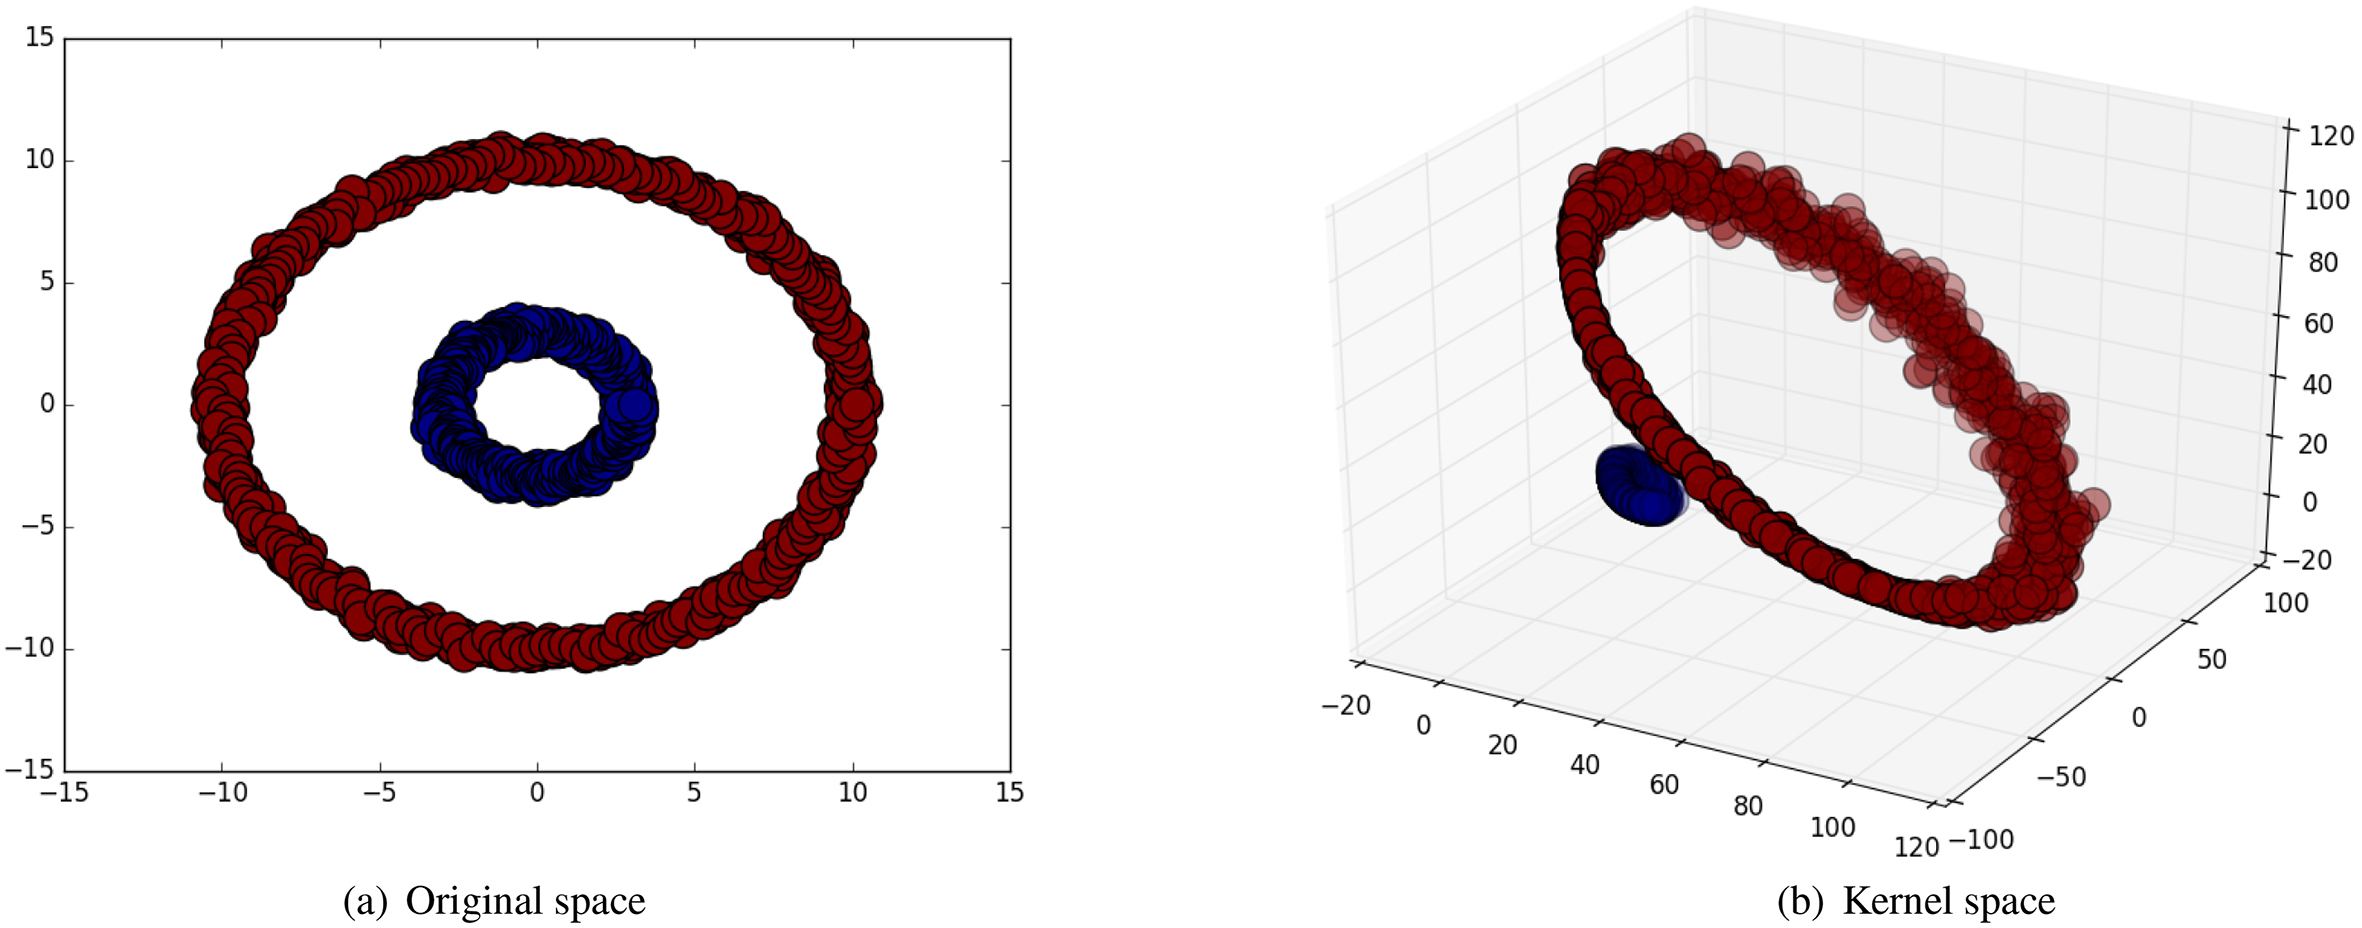
Kernel k-means clustering (K-KMN) [22] is an enhancement of K-means clustering (KMN) that can extract non-linearly separable clusters in the original data space by applying a proper nonlinear mapping function (kernel) to a higher dimensional feature space. Given a dataset
Note that
Self-Organizing Map (SOM) [55] represents clustering concept by grouping similar data together which gradually adjusted in an attempt to preserve neighborhood relationships that exist within the input dataset. Moreover, in the visualization of high-dimensional data, SOM preserves the neighbor relations of clusters in a low-dimensional space to the possible extent.
Clustering index with neighbor relation
In general, an external clustering index evaluates individual cluster quality, while Fukui and Numao [28] introduced neighbor relations of clusters into the conventional external indices by adding a weighting function. In principle, to introduce neighbor relations, the data points of the same class in the neighbor clusters should have high weights, while those of distant clusters should have low weights based on the inter-cluster distance. For example, optimizing the distance metric according to pairwise F-measure allows the data points of the same class belong to the same cluster (improving precision), and each class is distributed to fall in fewer clusters (improving recall). Moreover, by introducing the smoothing function into the index, the data points of the same class tend to located in neighboring clusters [58].
Set-based indices
Given dataset
Here, the smoothing function
By using Eq. (8) through Eq. (10) instead of the original values, any set-based clustering index, such as purity, F-measure, and entropy, can be extended as follows:
weighted purity (wPUR)
weighted F-measure (wFME)
where weighted entropy (wENT)
Given class and cluster assignment of a data point
Here, Fukui and Numao [28] introduced
Class and cluster confusion matrix of data pairs
Class and cluster confusion matrix of data pairs
Then,
With these extended
weighted pairwise F-measure (wPFM)
where
Differential evolution (DE) [45] is a population-based meta-heuristics approach for solving real-valued optimization problems. DE requires less user’s interaction by requiring minimal gene selection operator(s) and control parameter adjustments. Furthermore, DE performs better than real-valued genetic algorithms or evolution strategies and is therefore applied to various optimization problems [30].
Our work makes use of a variant of DE, generalized opposition-based jDE (GOjDE) [18], which is an extension of self-adaptive differential evolution (jDE) [24]. They do not require any adjustment to crossover rate CR and scale factor SF by randomization of the parameters while searching. Because each individual has its own CR and SF values, GOjDE/jDE allows individuals that have better values to lead to better individuals in the next generation owing to their higher survivability rates. Also, jDE showed the best performance in “Evolutionary Computation in Dynamic and Uncertain Environments” in CEC2009 [7].
GOjDE employs generalized opposition-based learning (GOBL) for population initialization and for population jumping during the optimization. GOBL improves the search performance of DE for functions whose global optimum is around the center of its search space, in particular [51, 19]. Because most non-diagonal elements of optimal solutions in EDML become zero, which implies the solutions located around the center of the search space, GOjDE is suitable for this problem. The GOjDE algorithm is summarized as follows:
Initialization Randomly generate
where Termination determination When a termination condition is satisfied, the process terminates. Operation selection Select GOBL operation (go to Step 4) with the probability GOBL Randomly determine Evaluation and selection (GOBL) Evaluate the fitness of individuals in the opposition population, and then select top Control parameter update Update scale factor
where Mutation Let a target vector be the
where Crossover Generate trial vector
where rand[0,1] is a uniformly distributed random numbers in the range [0,1]. Repair When the trial vector involves a violation against the constraint, the repair operation is executed in order to maintain the individual back on track, e.g., the repair operation of individual in EDML and K-E Evaluate the fitness of the trial vectors and compare with each target vector, and then select the more fit vector as an individual to the next generation. Update the generation no.
Evolutionary Distance Metric Learning (EDML) is an efficient framework that applies an evolutionary algorithm (EA) to firmly search a sufficiently optimal distance metric transformation matrix. EDML is based on a clustering index with neighbor relation that simultaneously evaluates inter- and intra-clusters to improve clustering quality. In contrast to other semi-supervised clustering, which formulate a penalty function for constraints into an objective function, EDML, however, directly improves the cluster validity index, such as purity, F-measure, or entropy, depending on the clustering purpose, as an objective function, when class information is available. Moreover, the cluster validity index is smoothed by neighbor relations which refines neighboring cluster for better visualization and the data points of the same class tend to locate in neighboring clusters.
Global distance metric learning
In this work, a Mahalanobis-based distance is used just as in the case of many global DML methods. Given a dataset
where
in which diagonal elements of
Our metric learning approach optimizes a clustering index Eval as follows:
where
For constraint condition, in order to satisfy the proposition of distance metric, we set a condition as matrix
EDML is focused on applying to real-world problems, which typically involve a gigantic high-dimensional data. High-dimensional global optimization is one such high-complexity problem. Therefore, self-adapting control parameters and generalized opposition-based differential evolution (GOjDE) [18], which explained in Section 2.7, is used to optimize the objective Eq. (29) in order to manage the quality of candidate solutions. Here an upper bound on the generation number or fitness evaluation number value is used as a termination condition in GOjDE. The matrix
The proposed EDML framework is summarized in Fig. 3. First, the candidates of metric matrix
Diagram of the evolutionary distance metric learning (EDML) framework.
Evolutionary Distance Metric Learning (EDML)
As mentioned at the end of Section 1, theoretically the proposed EDML yields insignificant results in non-linearly separable data. Therefore, this study proposed an improvement of EDML, namely kernelized evolutionary distance metric learning (K-EDML) which is an integration of kernelization technique and EDML. While this proposed method maintains all the properties of EDML, unlike other kernelized DML [41] which are formulating a penalty function for constraints, i.e., must-link and cannot-link, into an objective function. Note that, the K-EDML is similar to the EDML when the linear kernel function
Integrating kernelization technique to EDML
The kernelization technique is unified in the cluster structure learning process. K-EDML could be applied to any partition-based kernel clustering with neighbor relation. In this study, kernel K-means clustering (K-KMN) [22] has been used as a base clustering method. In order to integrate the kernelization technique into EDML, a symmetric positive semi-definite matrix
Hence, the Mahalanobis-based distance can be viewed as the Euclidean distance after a linear transformation by
Diagram of the kernelized evolutionary distance metric learning (K-EDML) framework.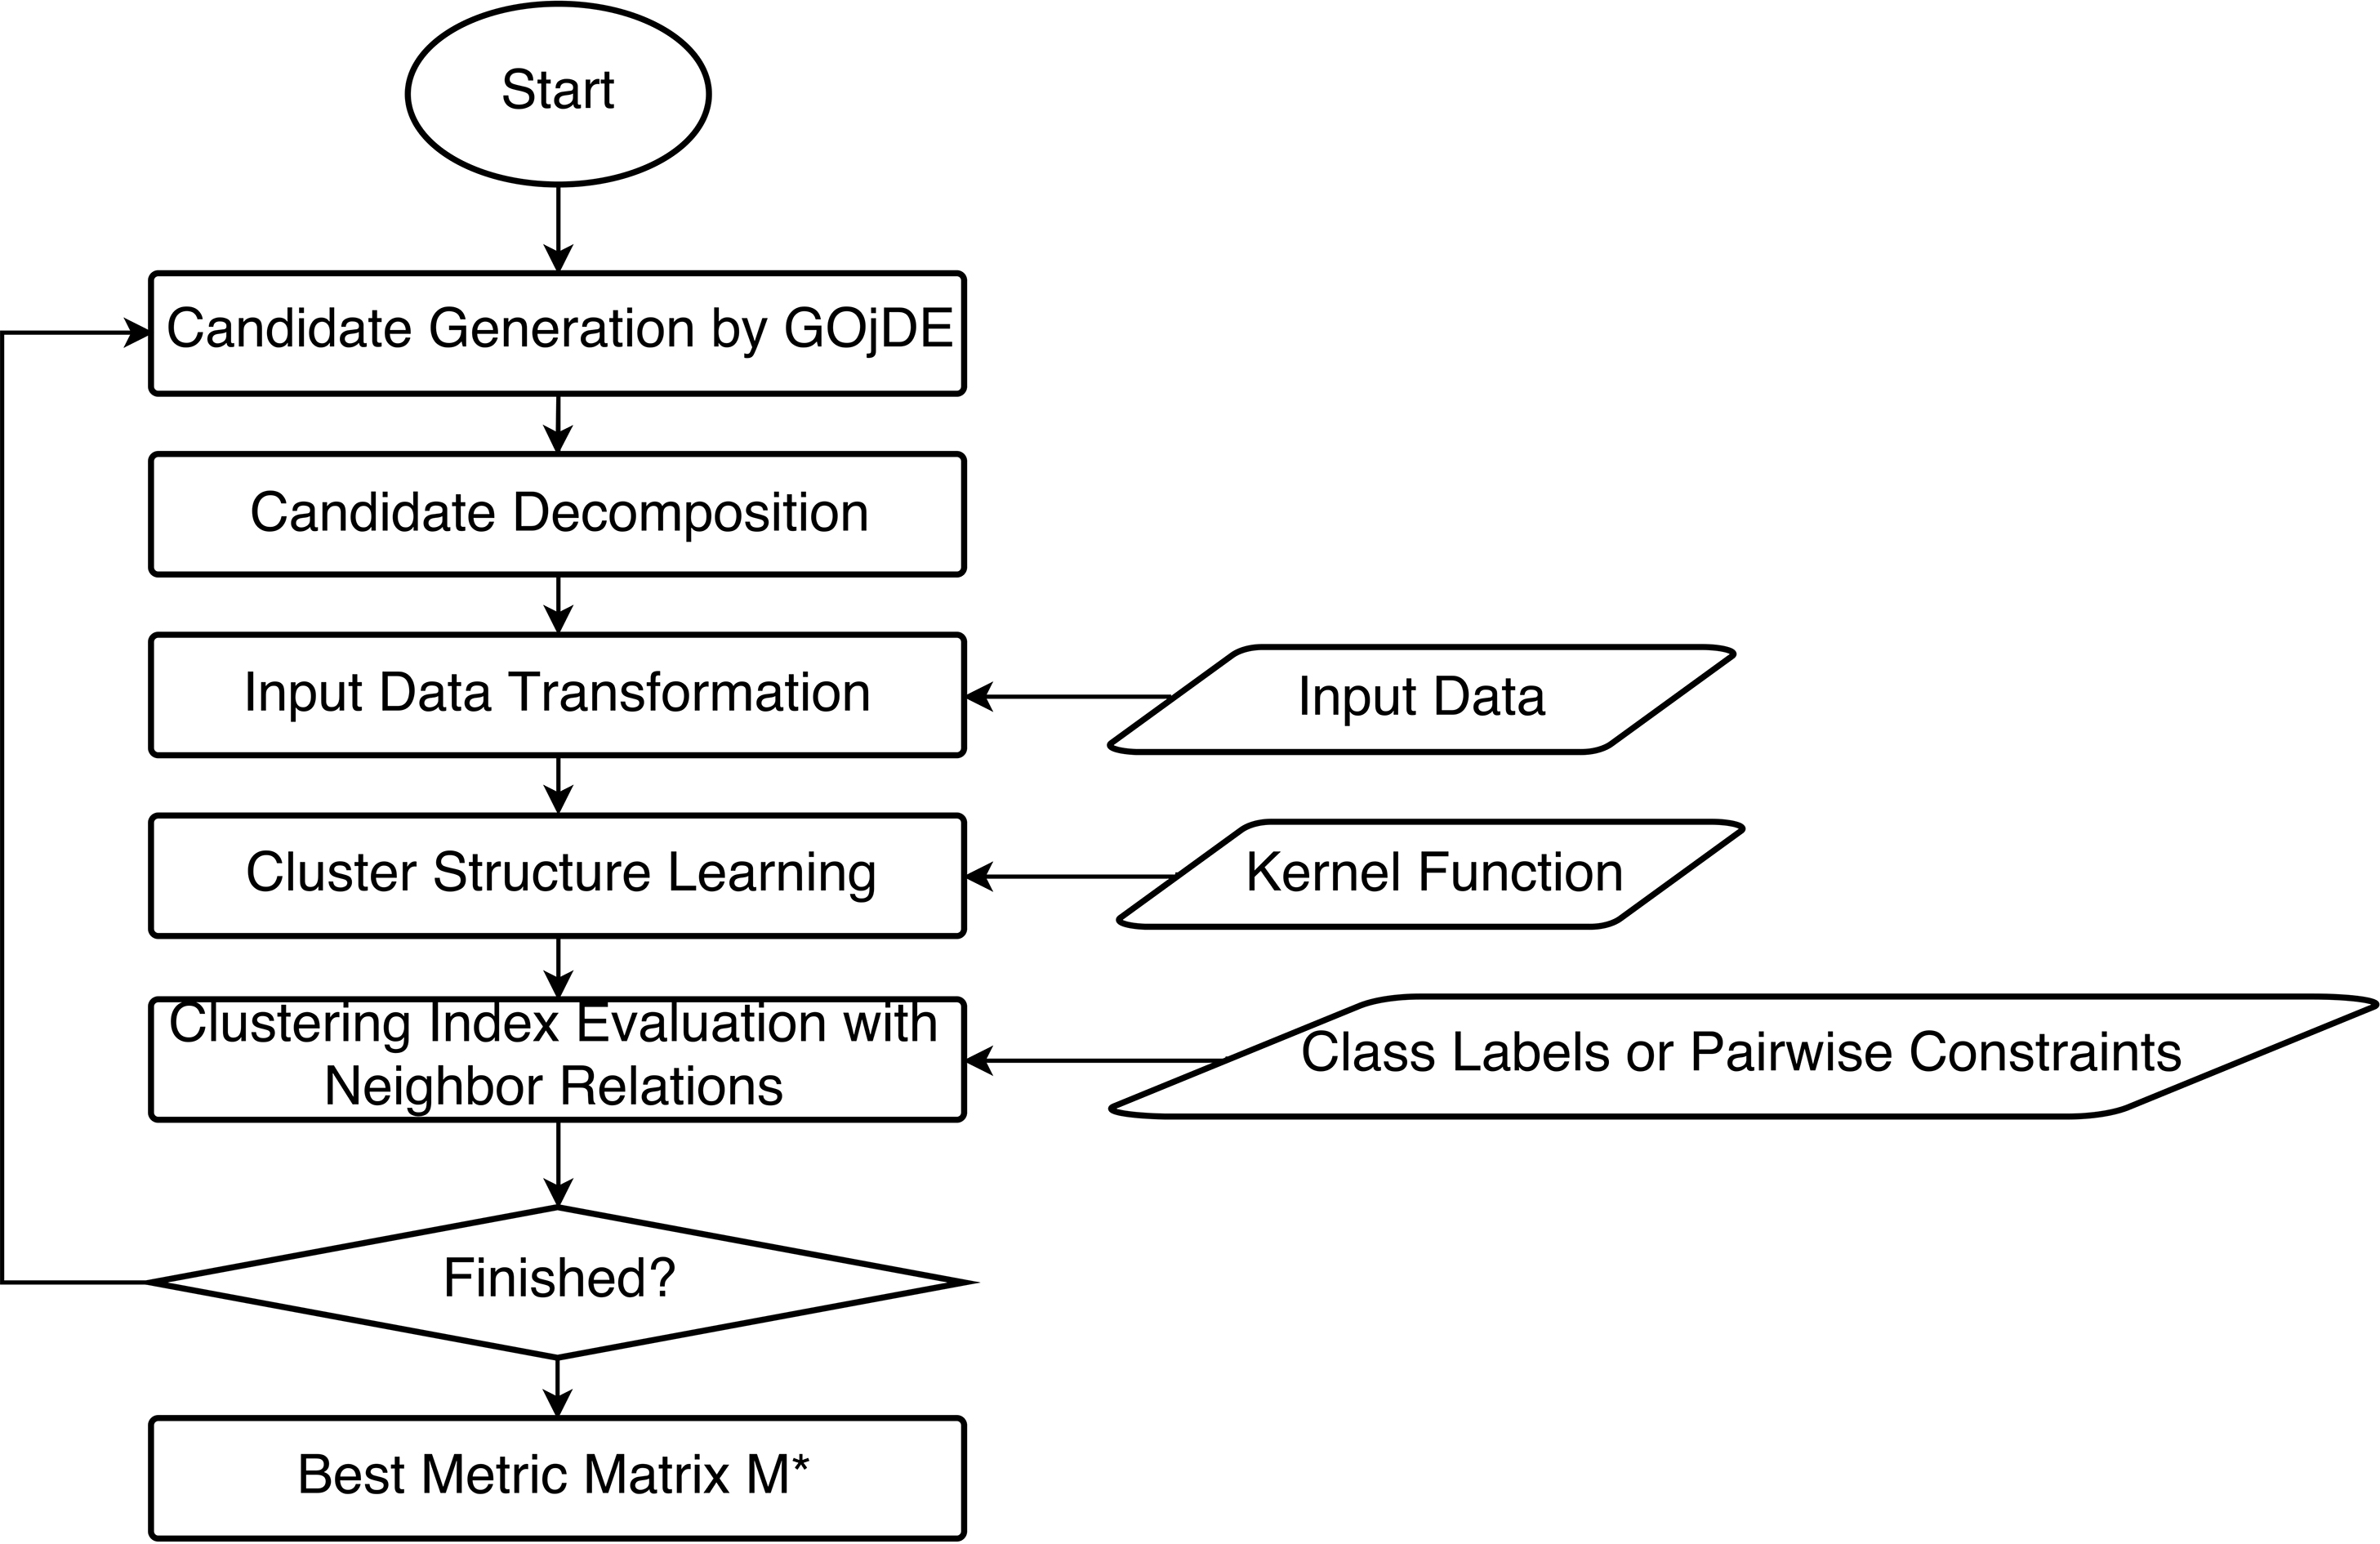
Although the framework of K-EDML is similar to EDML, two steps are added, i.e., candidate decomposition, input data transformation, and a modification in cluster structure learning. Figure 4 summarized K-EDML framework. First, candidates of metric transform matrix
Kernelized Evolutionary Distance Metric Learning
Kernelized Evolutionary Distance Metric Learning
Figure 5 visualizes the concept of the proposed K-EDML. The original data is visualized in Fig. 2a, each color denotes each class. In order to see the different in kernel data space, we map the original data to the kernel data space using the Eq. (4) as in Fig. 2b. Figure 5a and b present the result of K-KMN and K-EDML respectively. Since the K-KMN cannot make use of provided class labels, also only the minimization of the distance between centroid and data points in Eq. (5) is preserved. Thus, K-KMN cannot correctly cluster the data even it has a linear separation which we can see from the mixing of two clusters on the outer circle. In contrast, K-EDML can take advantage of class labels to preserve the clusters with the same class label by stretch the data space, i.e., the same class data move close together, and the different class move apart which we can see in Fig. 5b.
Visualization of clustering results on kernel space.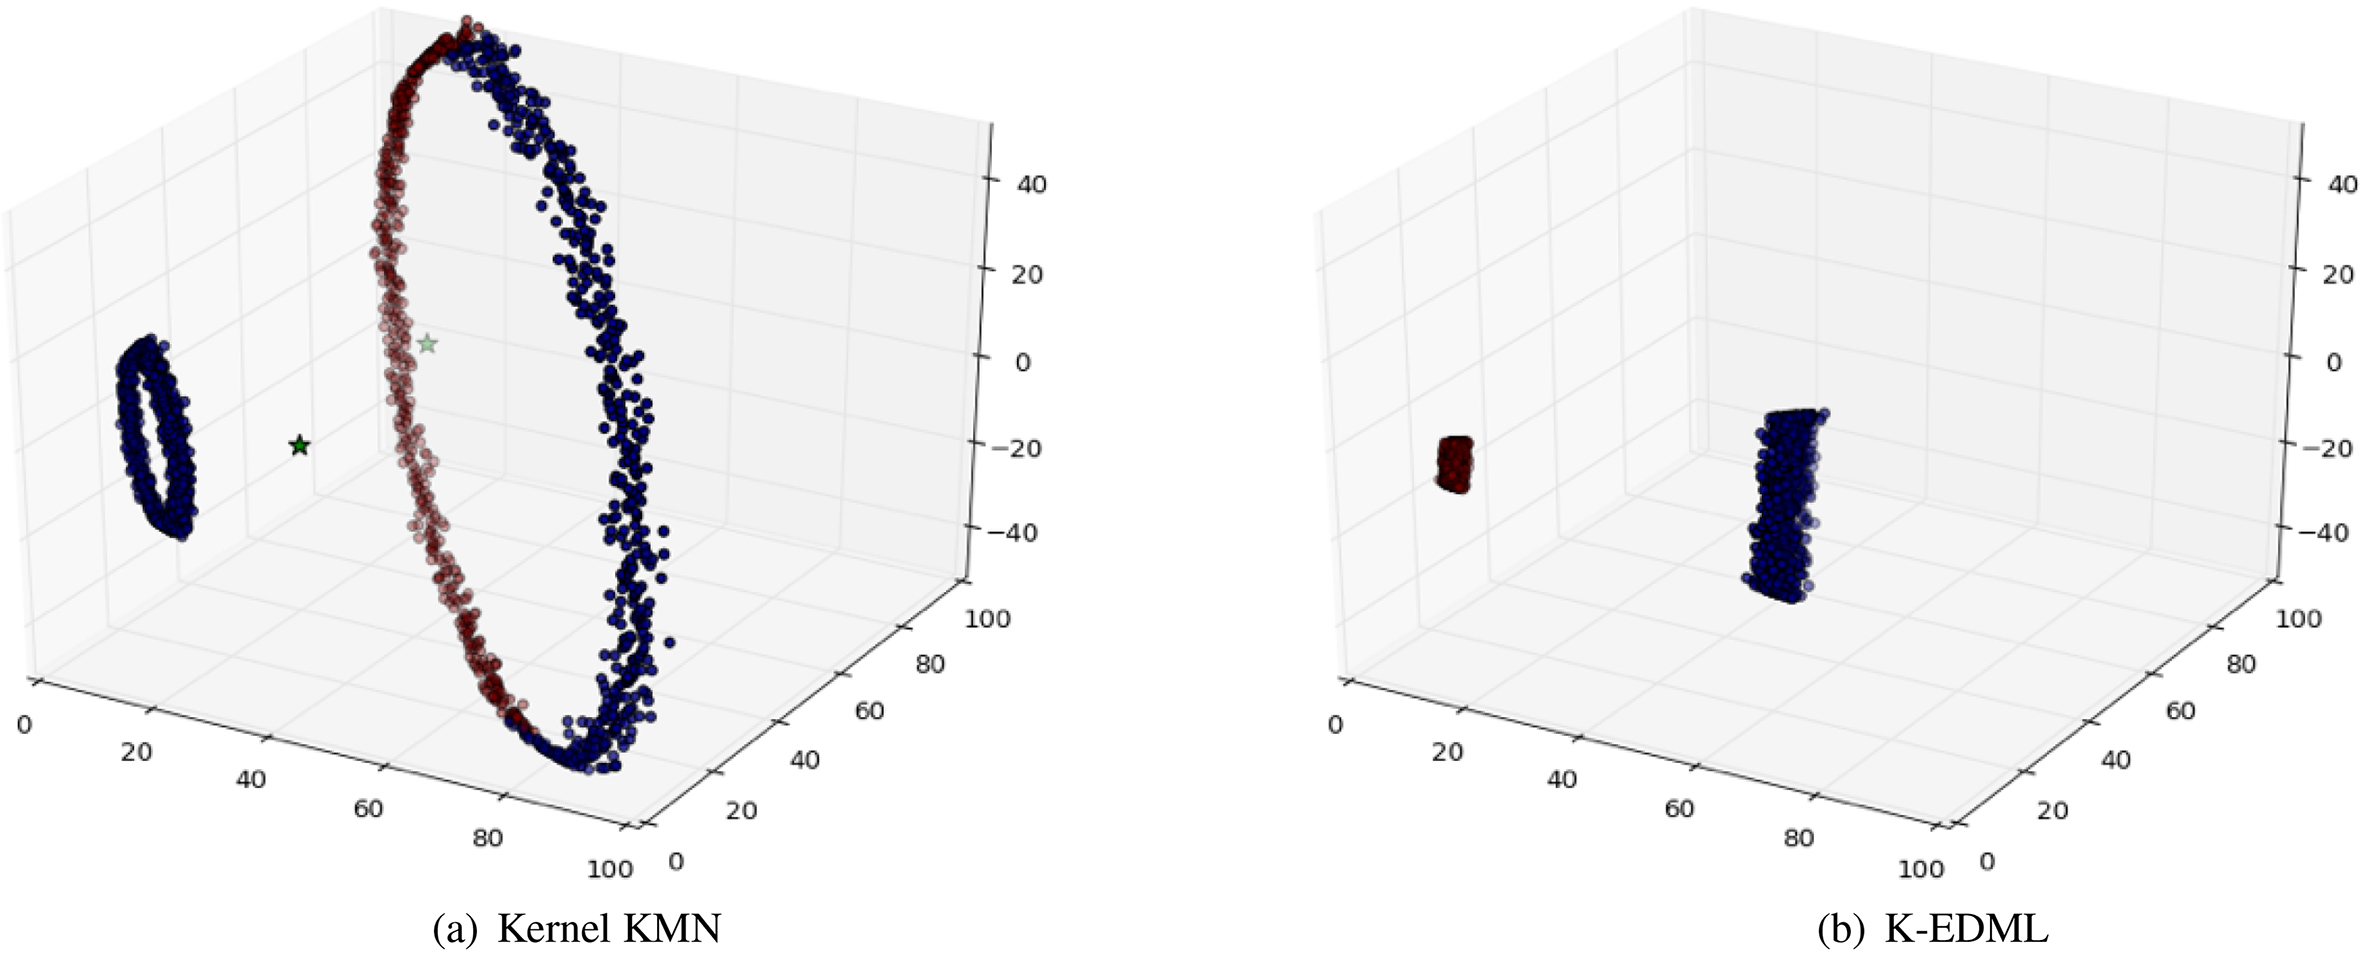
Experimental settings
We used the following ten open datasets from the well-known UCI Machine Learning Repository2
The basic statistics of UCI datasets
Settings for SOM, K-means with K-nearest neighbor graph (KMN-KNN) and Kernel K-means kernel function, and the evolutionary algorithms (EA) (“diagonal” is
We employed k-means together with k-nearest neighbor graph, or SOM [55] to obtain clusters with neighbor relations in EDML. We also used SOM to visualize the cluster structure because SOM is often useful for intuitively understanding learning results. The standard batch-type SOM with a regular grid and a Gaussian neighbor function was employed. We set unique initial weights for each dataset by using PCA alignment [40] to avoid initial value dependency, where the initial weights are aligned on the first and the second principal component plane so as to equally be distributed among the input data.
Table 3 shows the settings of the parameters for each dataset. The number of SOM nodes and K-means clusters were set depending on dataset size. In this experiment, it is not necessary to determine appropriate number of clusters. The number of individuals in an evolutionary algorithm (EA) was determined depending on the size of search space. We set 1D, where D is the dimension number of variables, for larger number of variables; Wine, Vehicle, and Segment with a full matrix, and the rest of cases use 2D to 5D. Also the generation limit in EA was determined by checking convergence and by computational time consumption. As we mentioned earlier, the parameters in GOjDE and jDE, CR and SF are automatically adjusted while searching. Moreover, the optimal neighborhood radius in the smoothing function
The landscape of the clustering index (weighted F-measure) as a fitness function on Iris dataset.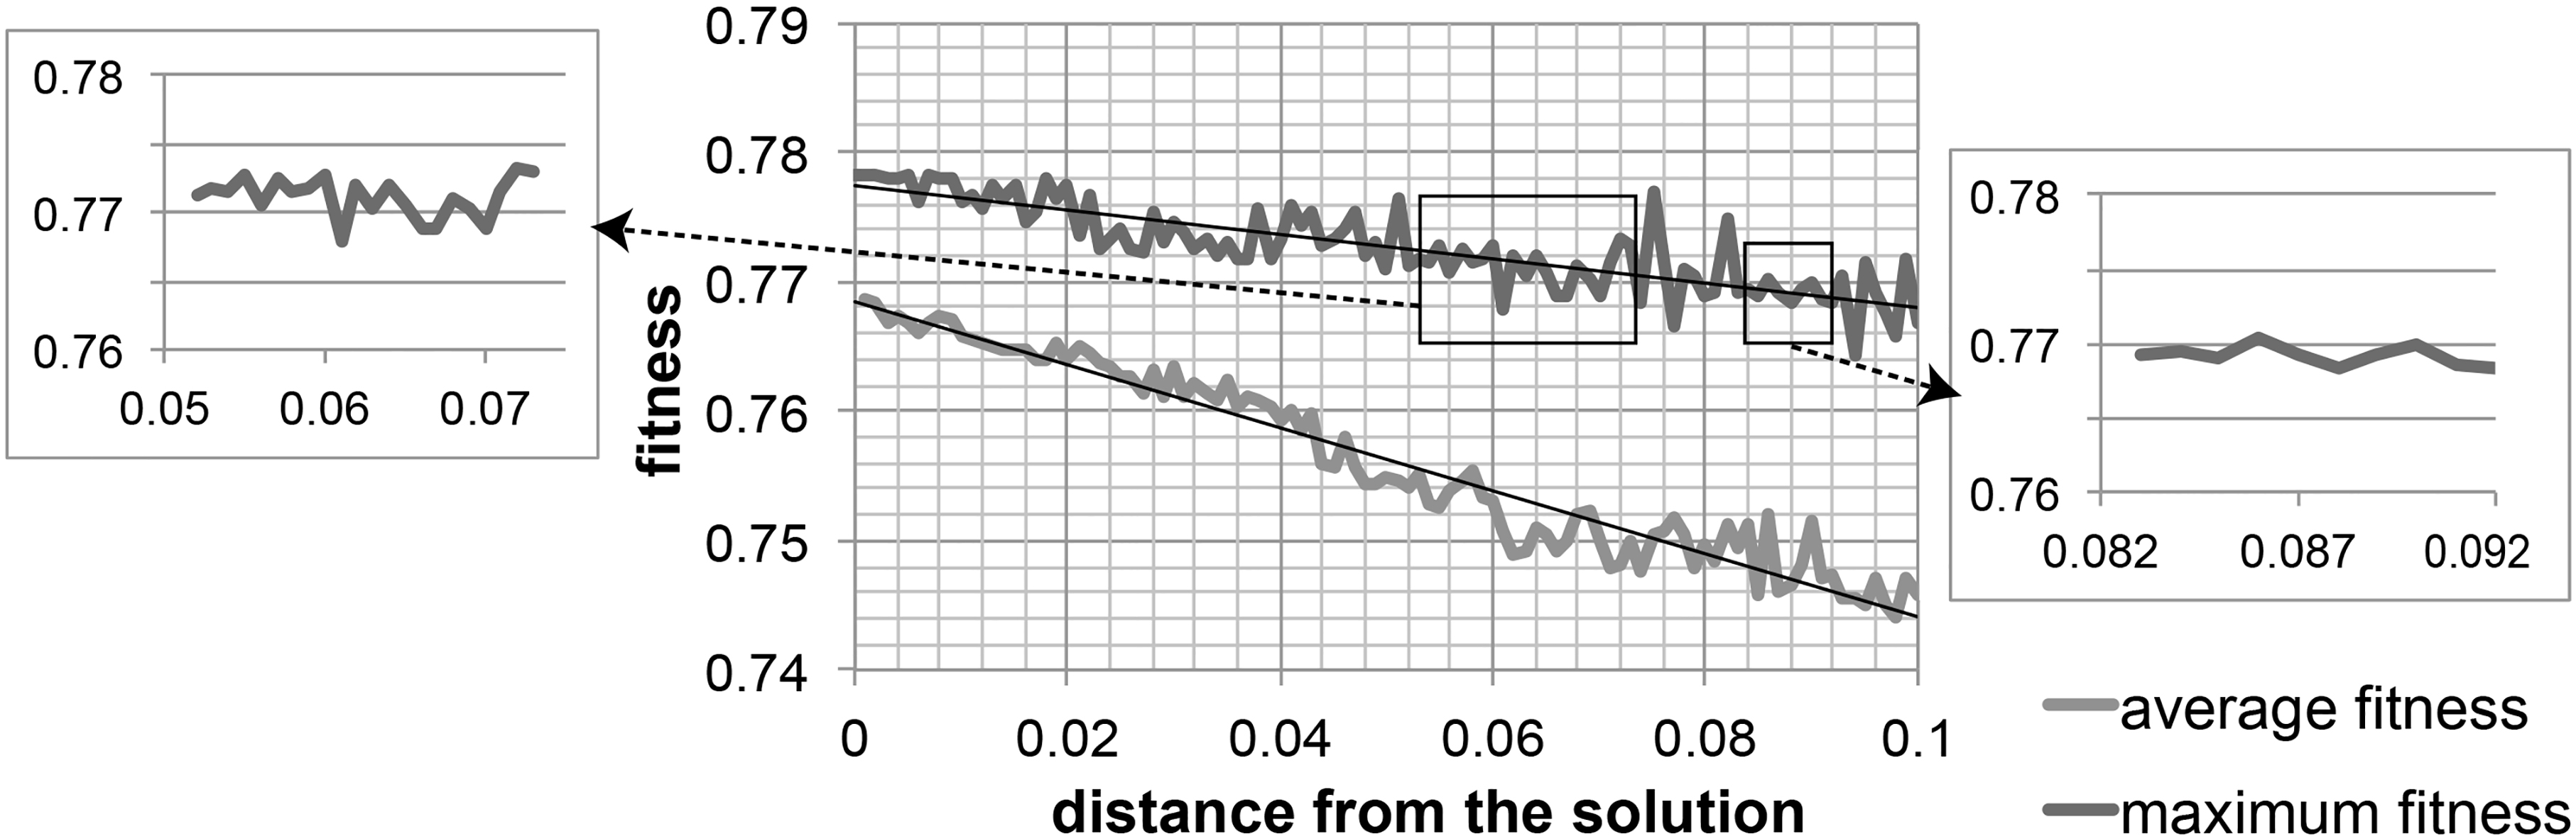
This section shows why the cluster validity index is hard to optimize, by illustrating the landscape of the fitness function. Figure 6 shows the fitness landscape of Iris dataset using the weighted F-measure in the neighbor of the best solution obtained by EDML. This landscape analysis is based on the idea of the work [54]. In each equivalent distance from the solution, in terms of Euclidean distance in the variable vector space, 100 points were sampled and the average and the maximum of fitness values (weighted F-measure) are illustrated in the graph.
From the figure, clearly there exists many spikes, thus greedy search is easily trapped in a poor local optimum, stochastic search is necessary to obtain better solution. Also we can see gradual global trends in both average and maximum of the fitness shown as a linear approximation, which implies that EDML was able to find the sufficiently optimal solution. However, it is difficult to find such trends in some distances locally as shown in the enlarged graphs, which sometimes makes an optimizer difficult to find the optimal solution by being trapped in these shelf regions.
Figures 7 and 8 show transitions of the fitness (Eval) of the best individuals averaged over five trials with random initial values. These figures illustrate the improvement and convergence of the clustering index along with the evolution of the generation of the evolutionary algorithms.
Transitions of the fitness (in various indices) of the best individuals on Iris dataset.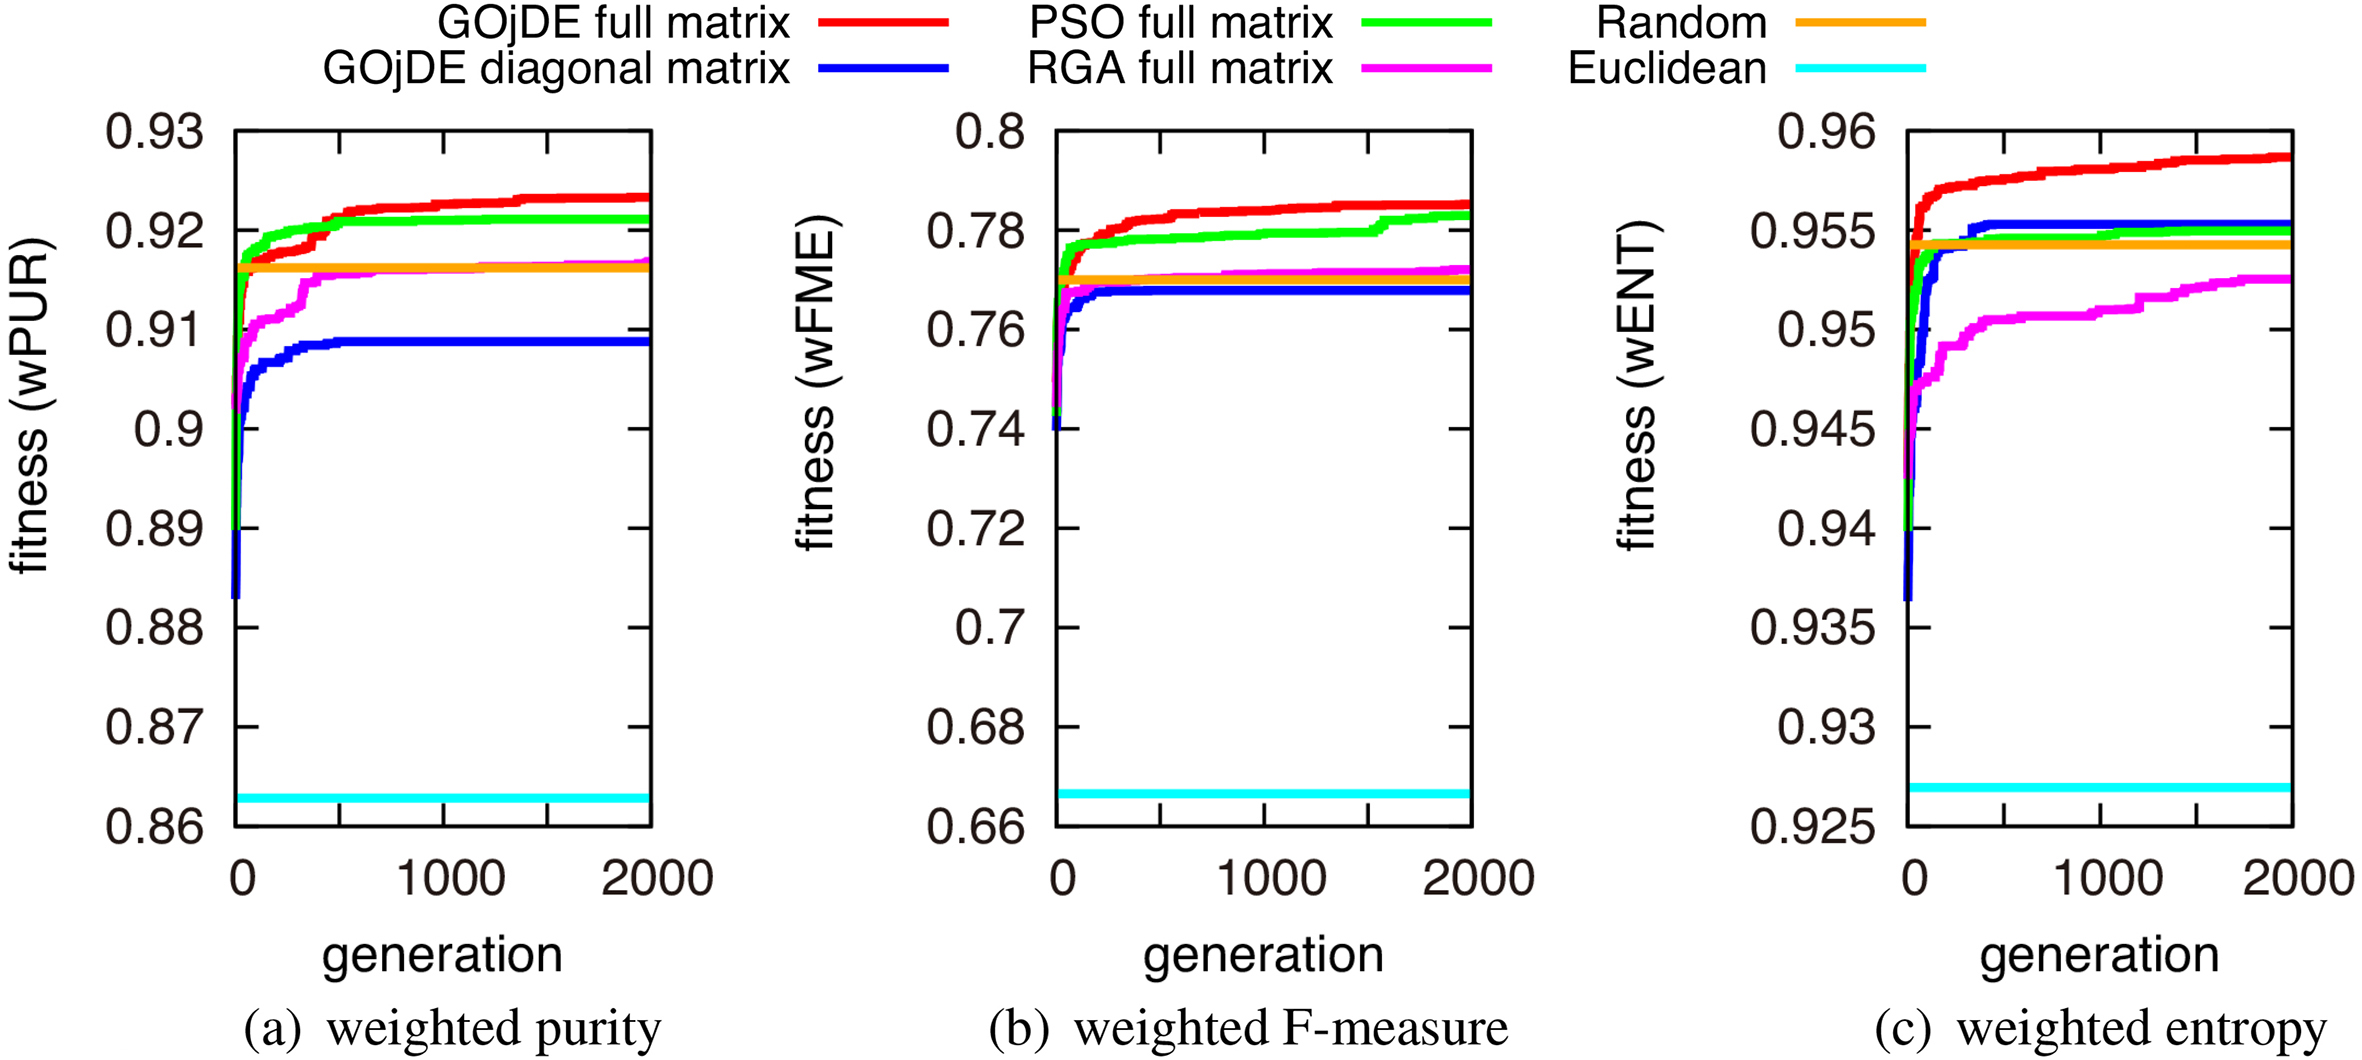
Transitions of the fitness (weighted F-measure) of the best individuals on various datasets.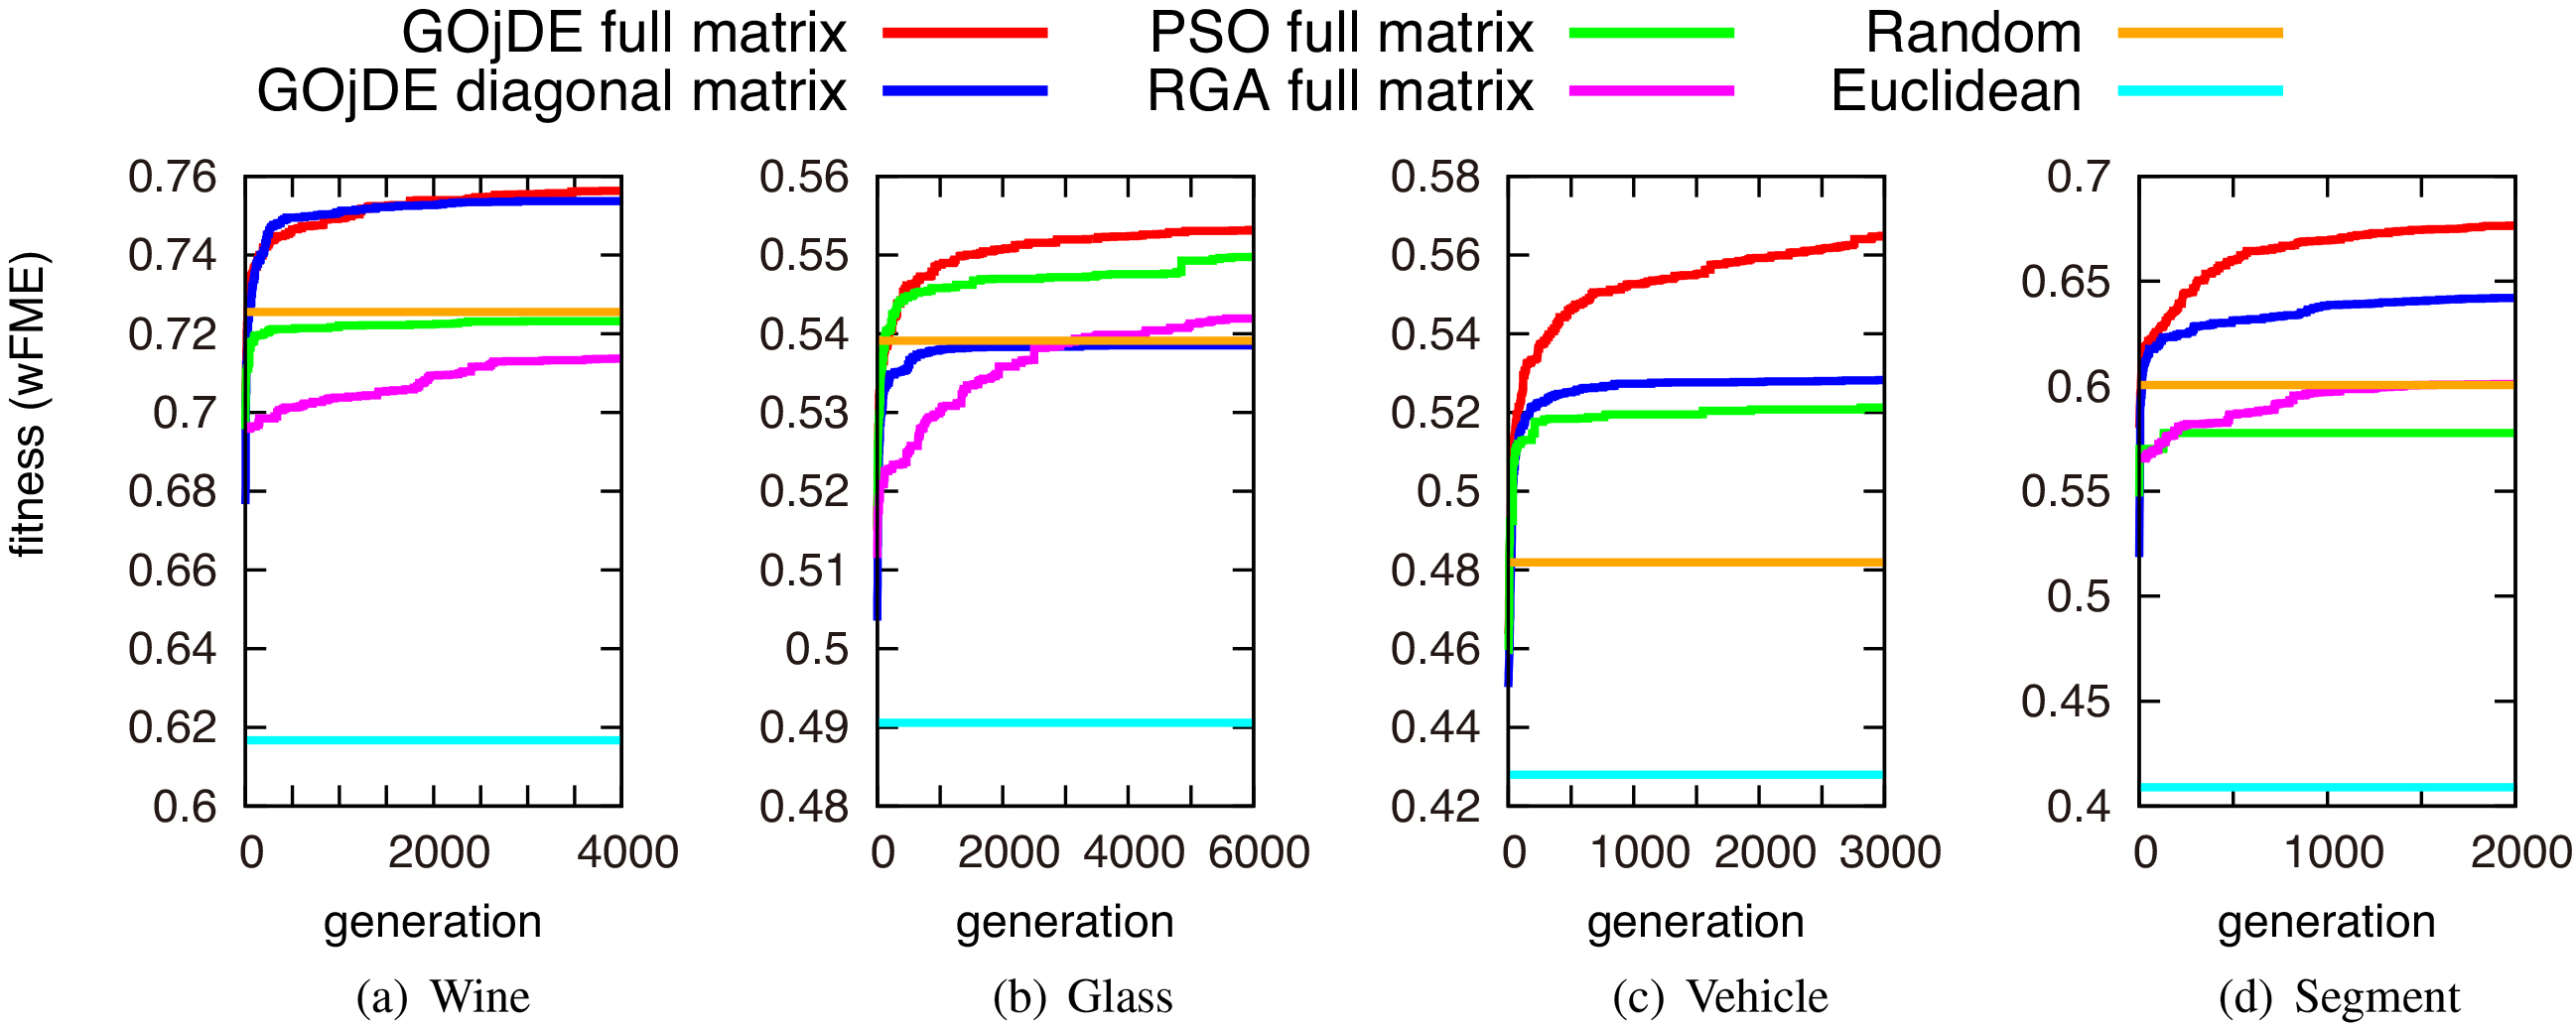
We compared a diagonal matrix case (i.e., in which
We also partially compared representative real-valued evolutionary algorithms, particle swarm optimization (PSO) [47], and real-coded genetic algorithm (RGA) [52]. For the parameter settings of PSO, we used generally recommended values of inertia weight
First, comparing our approach to one using Euclidean distance, even a random search outperforms Euclidean, which shows the capabilities of using a Mahalanobis-based distance. Second, the performance of GOjDE using a full matrix was better than using a diagonal matrix in most cases except for Wine data with weighted F-measure (wFME) (Fig. 8a), which shows that GOjDE was able to appropriately search even in high dimensions of a full matrix case. Third, although the performance of GOjDE is almost equal to PSO for the Iris dataset when using the weighted purity (wPUR) or the weighted F-measure (wFME) indices (Fig. 7a and b); performance of GOjDE is much better than PSO and RGA3
In RGA, we needed to adjust the parameters depending on the dataset: the number of parents and children for crossover; and the expanding rate.
Effect of the amount of labeled samples.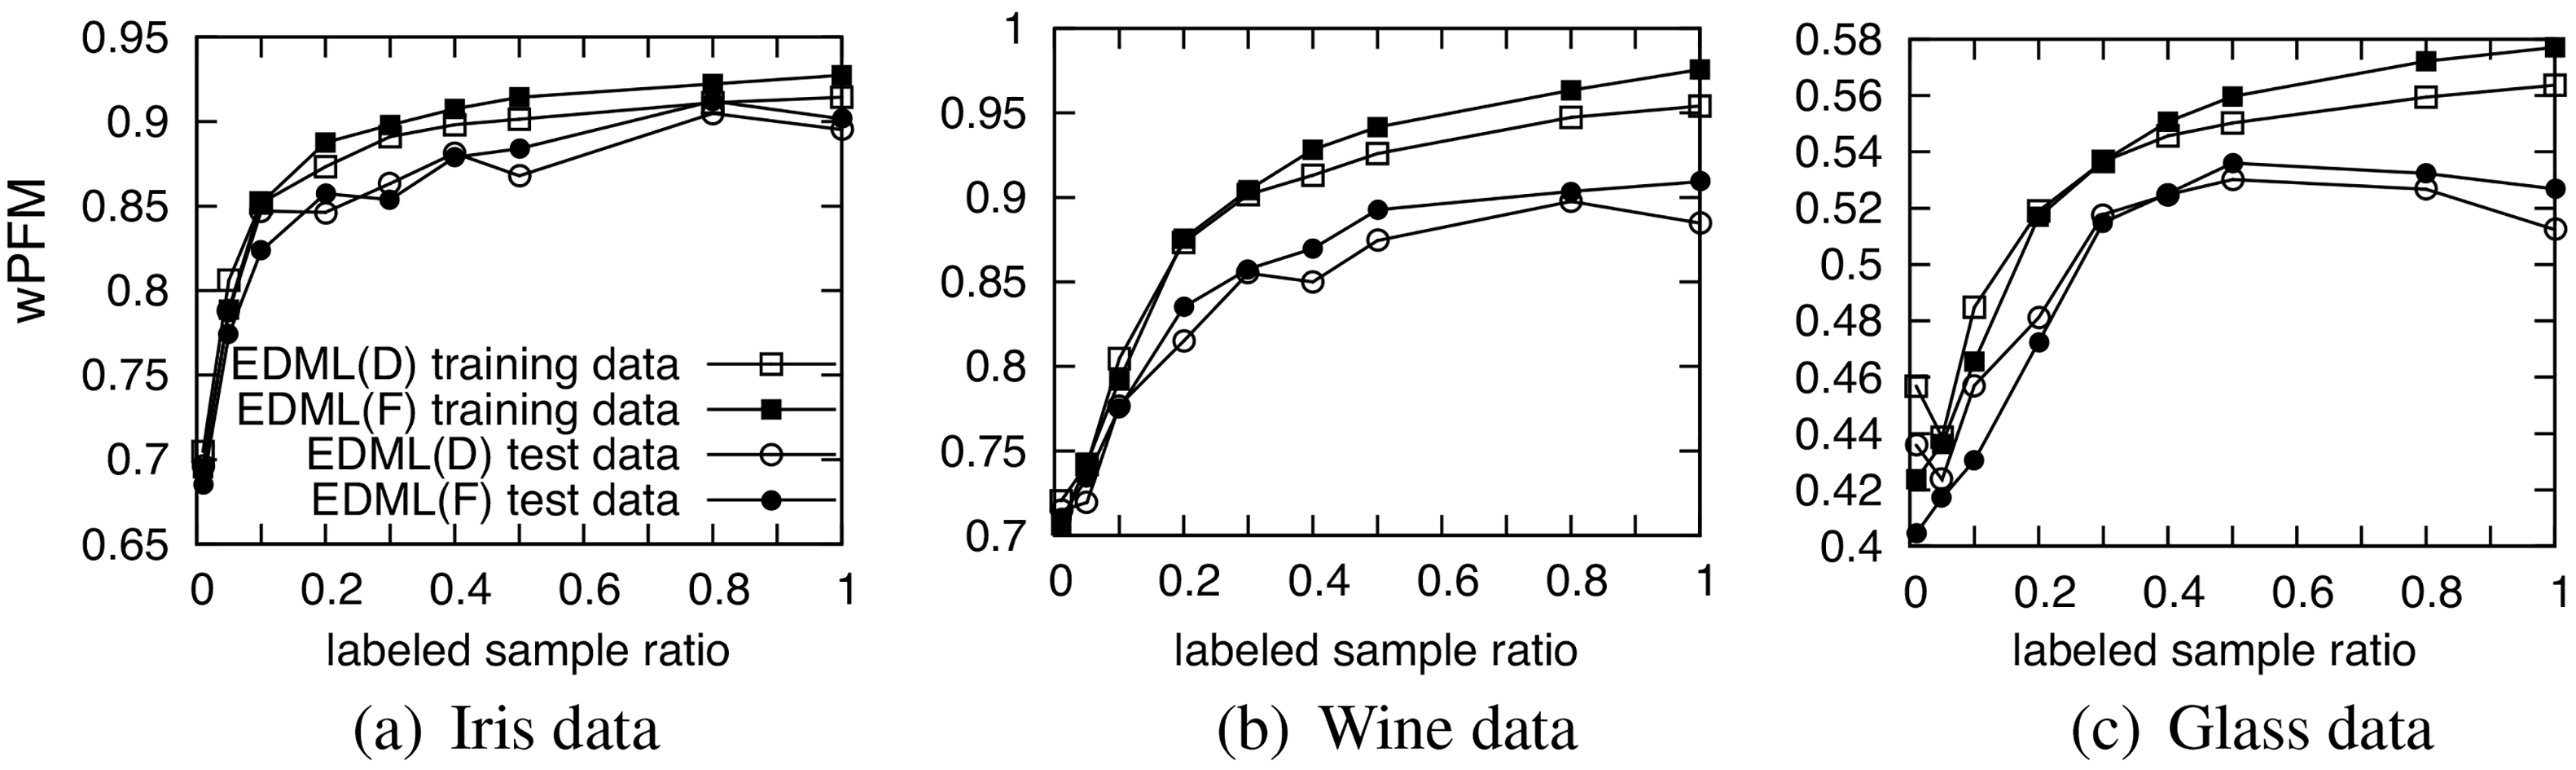
Comparison on visualization of the clustering results by representative class (Segment data).
In this section, we studied the effect of the number of constraints in the learning. We varied the ratio of labeled samples for generating constraints in a range of 0.01 to 1.0 on Iris, Wine and Glass data (Fig. 9). The wPFM was used as the fitness evaluation. As increasing the labeled sample ratio, wPFM rapidly increases until around 0.3. Glass data shows overfitting when labeled sample rate is larger than 0.5 as the score for test data decreases.
Distribution of each class by standard SOM (Segment dataset).
Distribution of each class by EDML-SOM without smoothing (Segment data).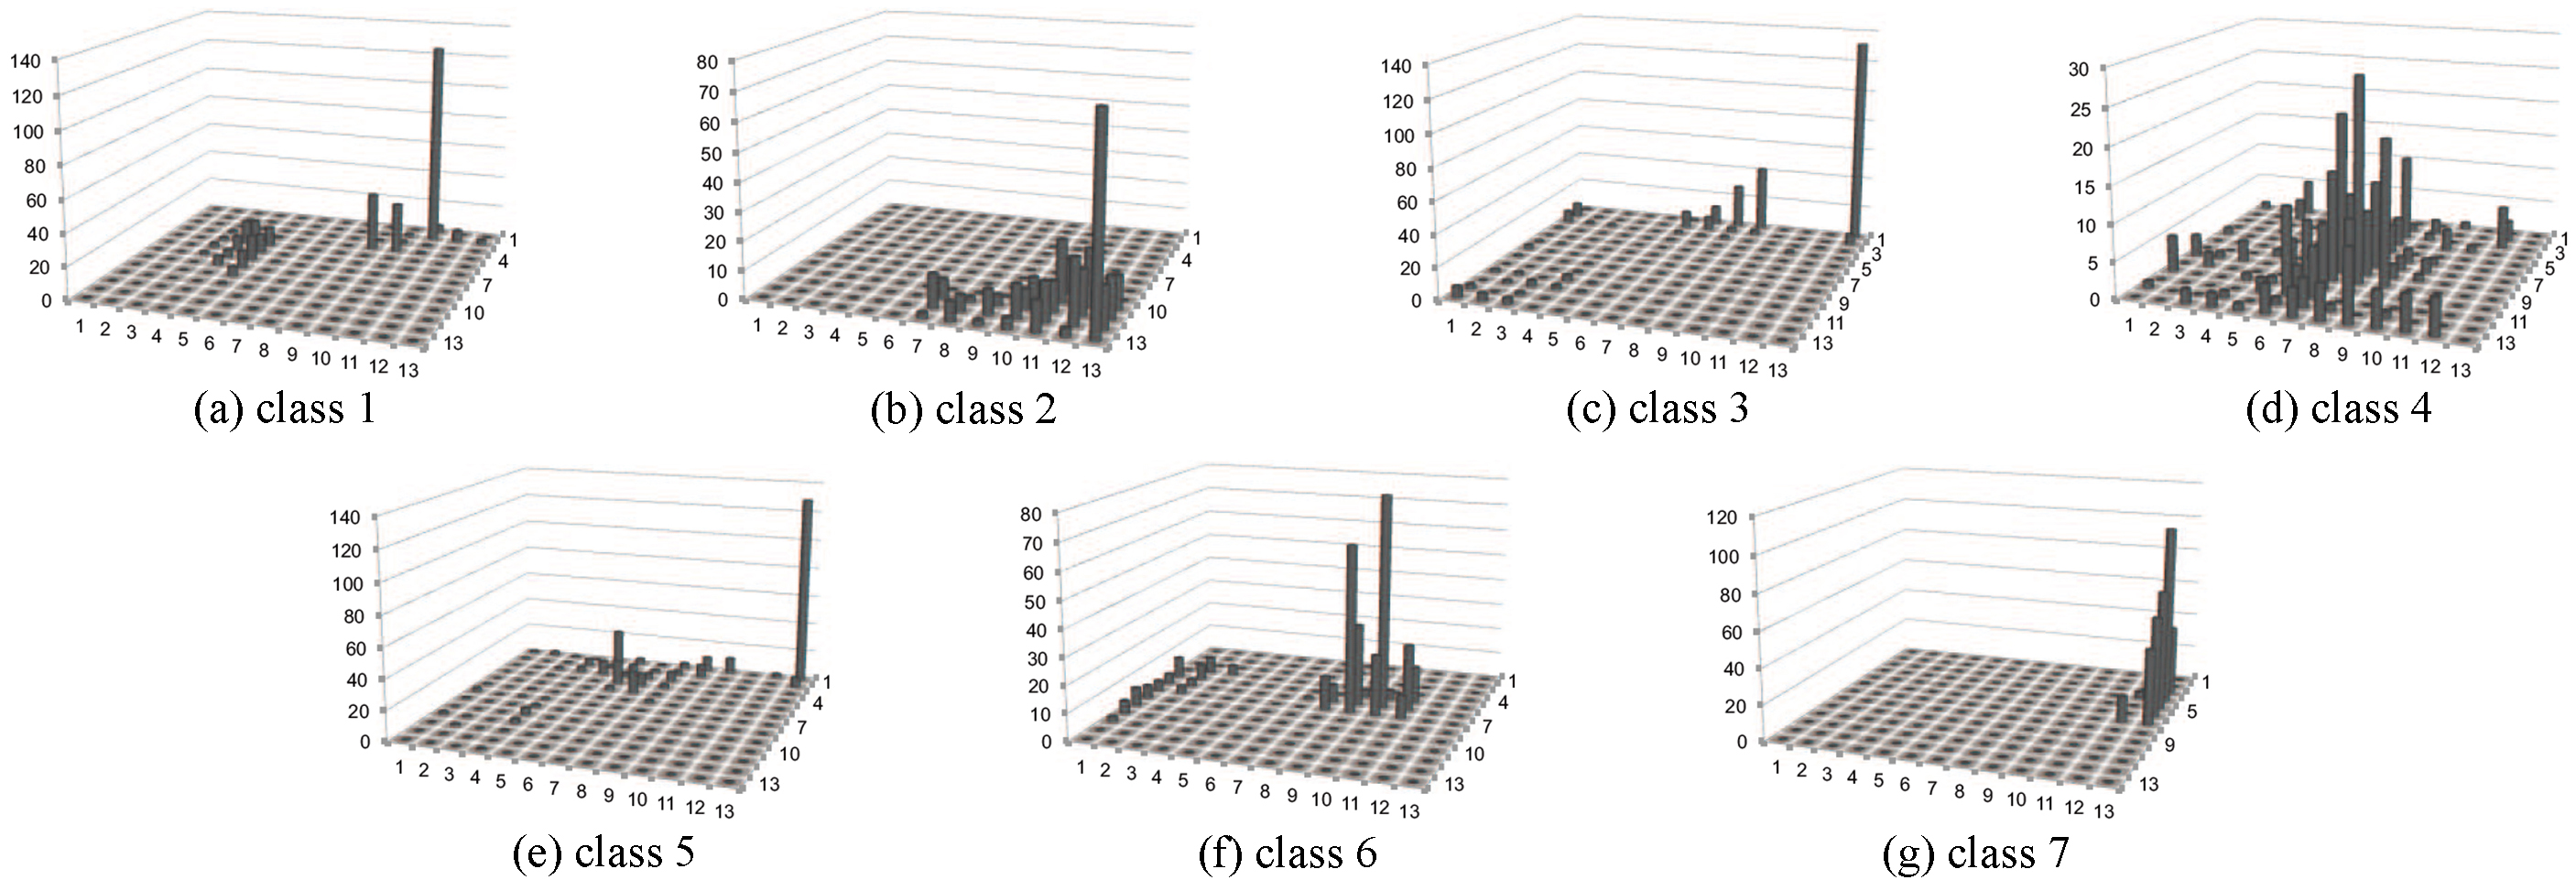
From the result, around 30% of labeled samples are recommended to use in order to avoid overfitting in some data, and contribution of the rest of labeled samples are much less than the first 30%. Moreover, when the ratio of labeled samples is lower than 0.1, there is no difference between EDML with a full matrix and with a diagonal matrix. It is suggested that when less than 10% of the labeled samples could be obtained, we can use a diagonal matrix for smaller computational time.
This section shows how metric learning affects SOM cluster visualization. SOM captures the data space by the topology of neurons and maps this onto a low-dimensional space. Comparison on the clustering results on Segment data are shown in Figs 10–13. We compared the standard SOM and EDML with SOM (denoted as EDML-SOM), also compared EDML-SOM with and without neighborhood smoothing. The wFME was used for EDML training.
Distribution of each class by EDML-SOM with smoothing (Segment dataset).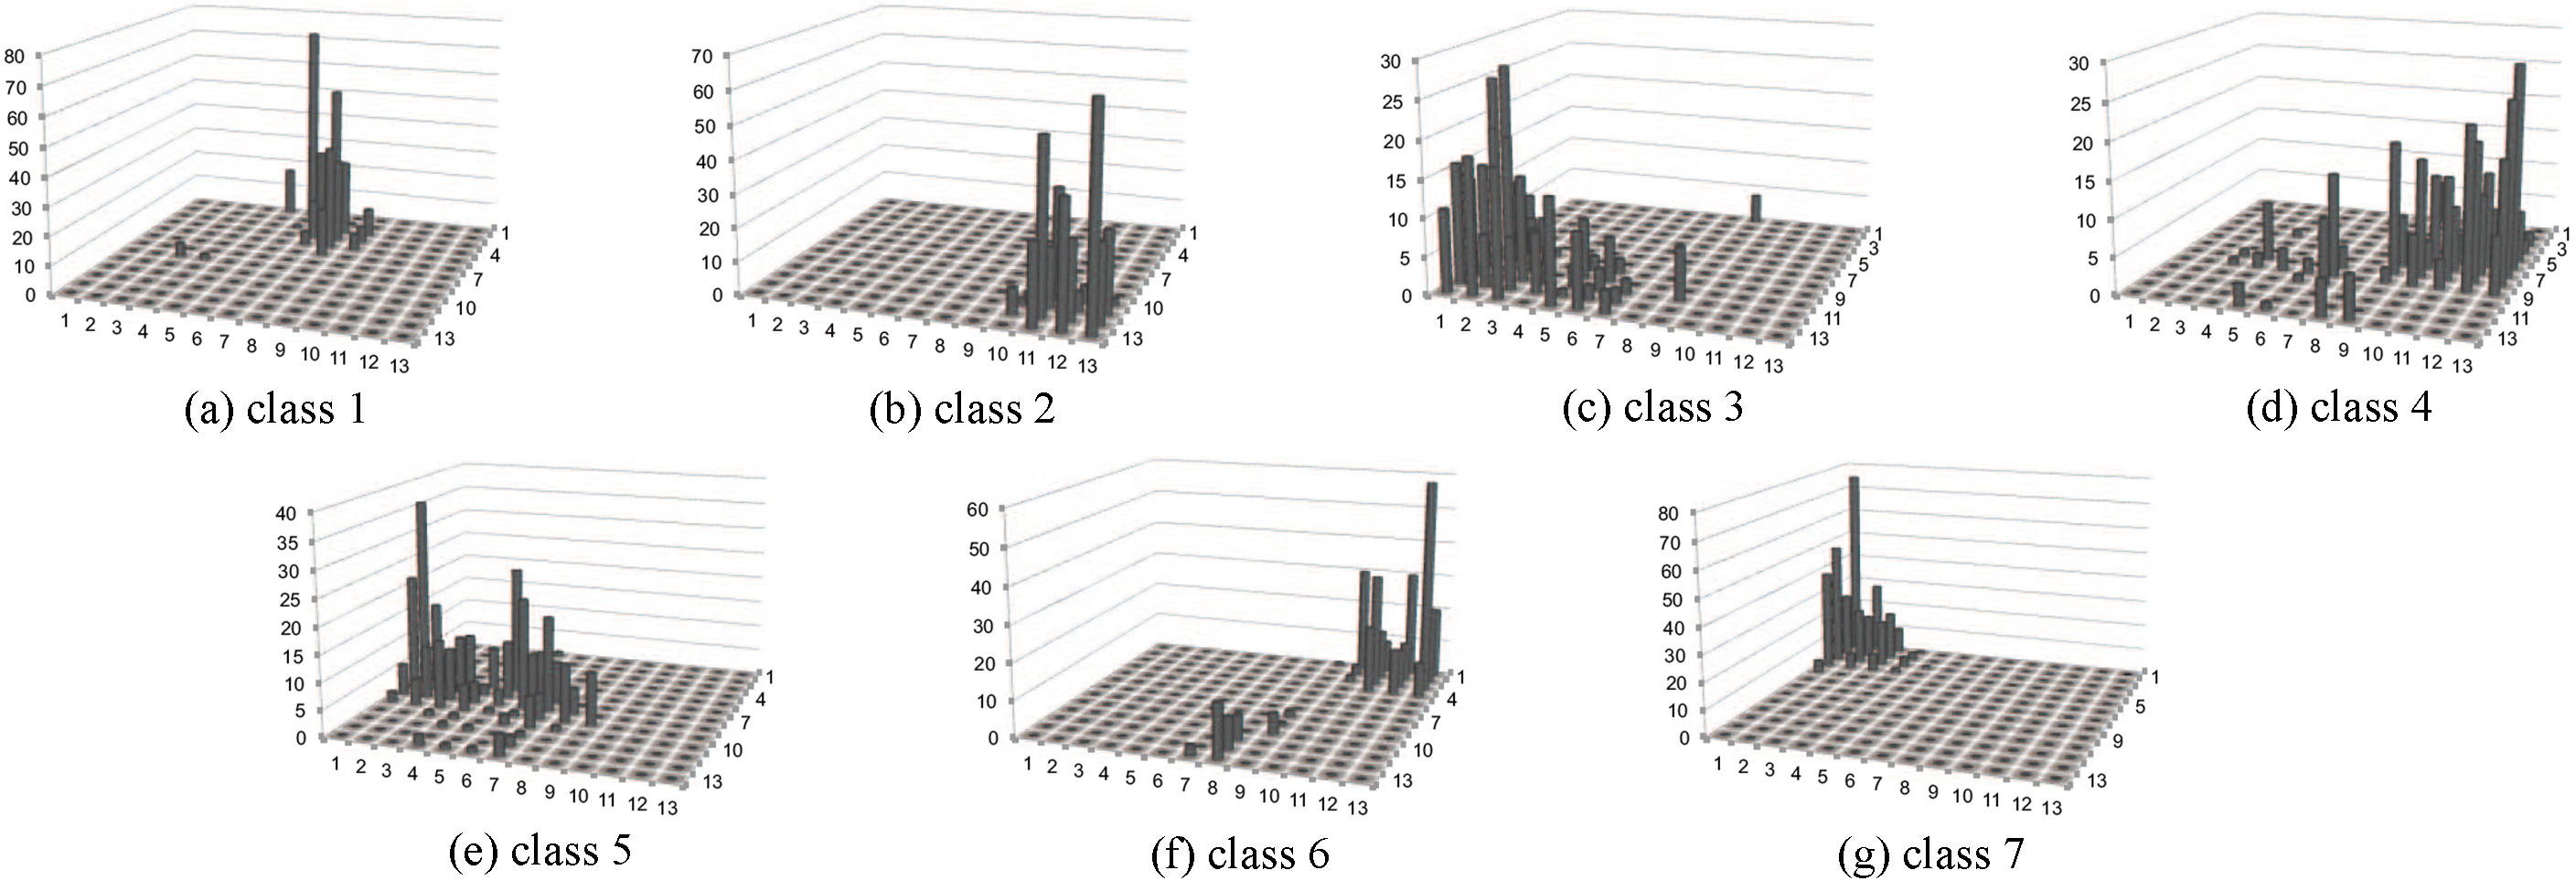
First, Fig. 10 shows majority class of each micro-cluster, where the x-y coordinate planes in the subfigures show the mapped planes. Clearly, EDML-SOM with neighbor smoothing (Fig. 10c) well organizes the same classes into the neighbors in the low-dimensional space, while the one without neighbor smoothing (Fig. 10b) has no clear difference to the standard SOM (Fig. 10a).
Next, the distributions of samples in each class in the mapped space are shown in Fig. 11 using standard SOM, Fig. 12 using EDML-SOM without smoothing, and Fig. 13 using EDML-SOM with smoothing. The z-axis indicates the number of samples assigned to each class, which should be neighbors in the mapped plane.
Standard SOM failed to keep the same neighbors for most of the classes, especially classes 1, 3 and 5 (Fig. 11), that are consistent result with Fig. 10. EDML-SOM without smoothing obtained clusters in which each class is much closer but some classes, most of samples in classes 3 and 5 are assigned to identical clusters (Fig. 12). Meanwhile, the distribution in EDML-SOM with smoothing (Fig. 13) spreads comparing to without smoothing, however they are still in neighbor, and more importantly there are small overlaps among classes. Overall, EDML-SOM with smoothing shows the best visualization in terms of the density of each class and separation among classes.
To measure the generalized performance of our proposed algorithms, we compared our proposed methods, EDML and K-EDML with well-known methods in each categories. For standard unsupervised clustering method, K-means clustering (KMN) and Kernel K-means clustering (K-KMN) [22] were selected as a basedline. Information-Theoretic Metric Learning (ITML) [25], Distance Metric Learning for Large Margin Nearest Neighbor Classification (LMNN) [32], and Geometric Mean Metric Learning (GMML)[42] were chosen as DML representative methods. And for non-linear DML technique, we selected Gradient Boosted Large Margin Nearest Neighbors (GB-LMNN) [11]. Note that, we omited some popular semi-supervised clustering, i.e., COP-Kmeans [33], clustering with distance metric learning methods, i.e., DML [14] and MPC-Kmeans [38] since our other comparison methods overcomes this baseline clustering and DML methods [25, 32, 11].
For the fair comparison, the experiments performed under five-fold cross-validation. In the training process, each method produces 5 metrics matrix in each fold, the number of clusters and neighbors equal to 20 and 5 respectively. Label sampling rate for training data is set to 30%. During the kernel selection and hyper-parameter tuning, grid search with five-fold cross-validation was performed to achieve the suitable kernel and hyper-parameters. The suitable kernel was selected among polynomial kernel, radial basis function (rbf) kernel, laplacian kernel and sigmoid kernel. And for the hyper-parameters tuning range, degree
Product from each method, i.e., cluster centriods in KMN and K-KMN and
Each method is evaluated base on their category, i.e., linear and non-linear distance metric learning. This research adopted k-means with k-nearest neighbor graph for linear technique (KMN, ITML, LMNN, GMML, EDML) and kernel k-means clustering with k-nearest neighbor graph with an identical trained kernel for non-linear methods (K-KMN, GB-LMNN, K-EDML). Weighted pairwise F-measure (wPFM) with the same configurations as in training process, the number of cluster and nearest neighbor equals to 20 and 5, was used to evaluating the clustering results.
| KMN | ITML | LMNN | GMML | K-KMN | GBLMNN | EDML | K-EDML | |
|---|---|---|---|---|---|---|---|---|
| Glass | 0.416 |
0.418 |
0.416 |
0.422 |
0.471 |
0.443 |
0.425 |
|
| Iris | 0.568 |
0.619 |
0.644 |
0.641 |
0.675 |
0.606 |
0.642 |
|
| Wine | 0.520 |
0.638 |
0.628 |
0.552 |
0.556 |
|
0.553 |
0.574 |
| Vehicle | 0.395 |
|
0.396 |
0.396 |
0.399 |
0.396 |
0.400 |
0.399 |
| Segment | 0.261 |
0.294 |
0.271 |
0.286 |
0.450 |
0.318 |
0.338 |
|
| Ionosphere | 0.654 |
0.683 |
0.655 |
0.690 |
0.591 |
0.662 |
0.689 |
|
| Pima | 0.642 |
|
0.646 |
0.577 |
0.496 |
0.630 |
0.661 |
0.570 |
| Musk | 0.552 |
0.614 |
0.546 |
0.565 |
|
0.560 |
0.585 |
0.639 |
| Balance | 0.561 |
|
0.583 |
0.570 |
0.507 |
0.591 |
0.569 |
0.546 |
| Yeast | 0.366 |
0.369 |
0.363 |
0.370 |
0.364 |
0.371 |
0.383 |
|
The average wPFM@20/5 with standard deviation of EDML, K-EDML and their comparison clustering methods which on test data
The rank of average wPFM@20/5 of proper kernel selection on K-EDML and their comparison clustering methods on training/test data
Tables 5 and 5 present the five-fold cross-validation evaluation results in average and standard deviation of each clustering algorithm from 2000 trial on training and test data. Observation indicates as follows: First, ITML, LMNN, GMML, GBLMNN, and the proposed method improve the clustering performance from the baseline clustering, i.e., KMN and K-KMN, due to the benefit of distance metric learning; Second, the benefit of kernelization technique can be seen from every pair of the algorithm, i.e., KMN and K-KMN, LMNN and GBLMNN, and EDML and K-EDML, the kernel integrated technique yield a higher clustering result than the one without kernelization because the properties of the data that is non-linearly separable. Third, although, EDML is not a non-linear kernel, it still achieved acceptable high results compare to both linear and non-linear DML which is a benefit from directly improve cluster validity index. Fourth, the proposed K-EDML overcomes or at least comparable to other clustering methods in eight datasets and obtain the highest clustering score in five datasets which is the benefit of the unification of kernelization and directly improve cluster validity index as an objective function. Fifth, despite the highest results from other methods in some dataset, they tend to perform well in only some specific data, while the proposed method performs well in six datasets.
Then, we ranked the clustering evaluation results in Tables 5 and 5. By mergeing EDML to the K-EDML because EDML can be viewed as a special case of K-EDML, the ranking is presented as Table 6. As a results, K-EDML secures the top 5 in all dataset and overcomes all other unsupervised and semi-supervised clustering methods in this paper with average ranking 1.8 and 2.1 for training and test sample. These results clearly illustrated the performance and robustness of the proposed method.
The rank of average standard PFM of proper kernel selection on K-EDML and their comparison clustering methods with the number of clusters is equal to the number of classes on training/test data
Lastly, to make this experiment more practical, the number of clusters is set to equal the number of classes in an evaluation process. Then, standard pairwise F-measure (PFM) which can be seen equivalent to wPFM@#class/0 is used as the measurement criterion. Then the trained distance metric
Conclusion
We proposed evolutionary distance metric learning (EDML) and kernelized evolutionary distance metric learning (K-EDML) for semi-supervised clustering, wherein any set-based or pairwise-based clustering validity index can be optimized utilizing a variant of differential evolution (DE) algorithm. The experiments show that at first GOjDE achieved better search performance than other evolutionary algorithms such as PSO and RGA. Second, K-EDML addressed the drawback of EDML in non-linearly separable input space and illustrated the benefit of kernel function to the proposed K-EDML method due to its superior results comparing to other clustering algorithms for semi-supervised clustering. Third, smoothing of the neighborhood clusters in a cluster validity index can improve visualization of neighboring micro-clusters.
Lastly, this research can proceed in many ways, for example, improve the computational efficiency of EDML and K-EDML in the higher dimensionality problems, e.g., eigenvalue optimization [63], reinforcement learning [2, 3] and aggregated DML [27]; and utilize more label information, e.g., multiple-kernel learning [8], utilize hierarchical information [6], and integrate deep learning technique to learn a distance metric [20, 31, 62]. Moreover, applying the proposed methods to other field is also a candidate goal, e.g., classification and image retrieval.