
Abstract
Since drug-target data have neither class labels nor the cluster number information, they are not suitable for clustering algorithms that require predefined parameters determined by comparing clustering results with real class labels. Density peaks clustering (DPC) is a density-based clustering algorithm that can determine the number of clusters without requiring class labels. However, the predefined cutoff distance of local density limits its wide application. Therefore, this paper proposes an improved local density method based on a cutoff distance sequence that overcomes the limitations of DPC and can be successful applied to drug-target data. We also introduce multiple-dimensional scaling based on drug and target similarity and perform intuitive graph analysis of the two most significant differentiation features. Drugs of the Enzyme, GPCR, Ion Channel, and Nuclear Receptor 4 standard datasets are identified as 6, 6, 3, and 5 clusters by an improved algorithm, respectively, and similarly, their targets are identified be 5, 5, 8, and 4 clusters. Drug-target data clustering results of the improved algorithm are more reasonable than the results of the fast K-medoids and hierarchical clustering algorithms.
Keywords
Introduction
Bringing a new drug to the market is a highly challenging and complex process in terms of time and cost. The experimental determination of drug-target interaction (DTI) is a time-consuming, labor-intensive process with a relatively poor success rate and is limited to small-scale research [1]. Drug repositioning [2] and network pharmacology [3] have provided a theoretical basis for using computational methods to predict new drugs based on the interaction data of drug-target. The hypothesis is that similar drugs interact with the same targets, and similar targets interact with the same drugs [4]. Drug repositioning, the process of finding new uses outside the scope of the original medical indications for existing drugs [5], is considered a promising strategy with the benefit of providing a more rapid route to clinic than through the traditional drug discovery approaches because of the use of existing knowledge about drugs. The availability of public biomedical databases along with the development of computational methods have made it possible to provide useful frameworks to partially overcome the limitations of the traditional experimental approaches [6] and help in finding a new association for the existing drug-target interaction data. Therefore, drug-target interaction prediction via many mathematical models and computational algorithms to aid drug development and drug design is a low-cost and efficient method in the pharmaceutical industry.
Cluster analysis of drug-target interaction data, to some extent, can improve the prediction performance of computational methods [7, 8, 9, 10]. Generally, clustering algorithms are categorized into hierarchical, partition-based, density-based, and grid-based algorithms [11]. The partition-based algorithms, such as K-means and K-medoids [12], need to prespecify the number of clusters. The best known density-based algorithm is the density-based spatial clustering of applications with noise (DBSCAN) [13], which requires predefined
In 2014, Rodriguez and Laio [20] proposed a density-based clustering algorithm called clustering by fast search and find of density peaks (DPC), which only depends on the distance between points. DPC can determine the number of clusters independently using decision graph and identify arbitrary shape clusters, as well as deal well with noise points. It is based in the assumptions that cluster center points are surrounded by neighbors with lower local density and that they are relatively distant from any points with higher local density. DPC has been widely applied to many fields, including biological data [21], social circle clustering [22], image clustering [23] and so on. It seems that DPC can directly solve the clusters number problem and cluster drug-target interaction data, but the local density and distance of each point in DPC are defined with the prespecified parameter cutoff distance
There are two feasible methods to determine the optimal parameter. One heavily depends on user experience and prior data knowledge, and the other requires clustering evaluation indexes via repeated experiments. However, the majority of evaluation indexes require real data class labels, which greatly limits these algorithm applications.
For drug-target interaction data, there are no class labels or prior class information. DPC and its improved algorithms can still not be used directly. Therefore, this paper proposes an improved DPC clustering algorithm that can be successfully applied to drug-target interaction data clustering. We use a cutoff distance sequence to improve DPC and propose the clustering by fast search and find density peaks based on sequence (DPCS) algorithm to cluster drug-target interaction data. The main contributions of this paper are summarized as follows.
An improved local density calculation method is proposed based on a cutoff distance sequence that avoids predefined parameter limitations. Drug-target interaction data have neither class labels nor cluster number information, and hence, clustering algorithms requiring predefined parameters are inapplicable. However, DPCS was successfully applied to drug-target data, and the number of clusters in Enzyme, Ion Channel, GPCR and Nuclear Receptor datasets were determined. DPCS clustering with satisfying outcomes tends to be more reasonable compared with fast k-medoids (FastK) [24] and hierarchical clustering (HC) [25]. Since the original drug feature was the compound structure and the target was a specific amino acid sequence, the data were not convenient for intuitive graphical interpretation. We introduce multiple-dimensional scaling (MDS) based on drug and target similarities, and we provide an intuitive graph analysis of the two most significant differentiation features.
The remainder of this paper is organized as follows. Section 2 describes the related works. Section 3 briefly introduces DPC. Section 4 describes the proposed DPCS algorithm in detail. Section 5 verifies DPCS’s performance. Section 6 analyzes drug-target interaction data with DPCS algorithm. Finally, Section 7 concludes the paper.
Many studies have attempted to overcome DPC’s limitations and have proposed improved algorithms.
The first aspect is to improve local density, assignment strategy, or both. Du et al. [26] used fuzzy neighborhood relationships to define the local density, and then developed FNDP algorithm. Jia et al. [27] proposed an enhanced fast search and find of density peaks clustering (E-FDPC) algorithm to select hyperspectral bands and embedded learning rules based on exponential function to adjust cutoff distance in local density computing. Tao et al. [28] proposed F-DPC using the data field theory to adaptively select the
The second aspect is improving clustering center selection, application, distance measure, clustering efficiency and so on. Jiang et al. [38] developed an enhanced DPC enhanced algorithm, called GDPC, with an alternative decision graph based on gravitation theory and nearby distance to identify centers and anomalies accurately. Moreover, they tried to overcome some weakness, such as varying densities and irregular shapes, and proposed the DPC-LG algorithm [39] to improve GDPC based on logistic distribution and gravitation. Xu et al. [40] proposed a density peaks clustering algorithm based on grid (DPCG), which improves the efficiency using the CLIQUE clustering algorithm to calculate the local density. Xu et al. [41] proposed two prescreening strategies, grid-division and circle-division, to find cluster centers for a large-scale dataset fast.
DPC introduction
Assume that
DPC has the following two important variables: local density
where
and the other uses the Gaussian kernel local density,
where
DPC suggests that center points are surrounded by neighbor points with lower local density, and they are a relatively large distance from any points with higher local density. Therefore, those points where
Definitions, process and explanation
DPCS calculates the local density using a cutoff distance sequence to overcome requiring a prespecified parameter. To obtain the cutoff distance sequence, we first define the maximum cutoff distance
Thus,
where
From Eq. (7), the proposed
Example 2D dataset
Table 1 shows an example 2D dataset containing 10 points, where
Cutoff distance sequence for the dataset from Table 1
Let us examine the number of points in the neighborhood of each point under every cutoff distance. Table 3 shows
Cutoff neighbor numbers for object
There is a special phenomenon in Table 3 that neighbors values may be the same, corresponding to different cutoff distances. This is because the number of points in the neighborhood of
Two-dimensional dataset from Table 1.
In DPCS, on the one hand, each point in the dataset contributes to the local density rather than fixed neighborhoods as in DPC, which considers differences between datasets as much as possible. On the other hand, the contributions of farther points to the local density should be weaker, as differences between points within the dataset are considered.
The proposed improved local density Eq. (7) has no predefined cutoff distance. Therefore, compared with DPC, DPCS does not need this input item.
Complexity analysis
Clustering efficiency can be estimated from the time complexity of the algorithm. DPC, FKNNDPC, DPCS, the distance matrix, local density
All three algorithms calculate the distance matrix and object distance
Performance verification of DPCS
Datasets
We tested DPCS performance on 6 classic datasets for clustering accuracy (ACC) [42] and adjusted mutual information (AMI) [43]. We also compared the outcomes with DPC and FKNNDPC state-of-the-art algorithms. All three clustering algorithms were implemented in MATLAB, and we provide the decision graph and clustering results. Six classic datasets for performance testing and validation were chosen from various sources, as detailed in Table 4.
Experimental datasets
Experimental datasets
Aggregation [44]: seven non-Gaussian distributed clusters with significant shape differences. This is a typical dataset for clustering aggregation. Flame [45]: different data classes have inconsistent size and shape and semi-encircling. R15 and D31 [46]: R15 data are distributed on a ring generated by 15 similar Gaussian distributions, and D31 data are generated by 31 similar Gaussian distributions. The D31 annular distribution is somewhat weaker than that of R15. Spiral [47]: three spiral strip datasets and classical verification data for density-based clustering. S1 [48]: fifteen inconsistent cluster shapes with almost overlapping boundaries.
In addition, to verify the ability of the three algorithms to deal with noise, we add Gauss noise (
The experimental datasets were clustered using DPC, FKNNDPC and DPCS. Figures 2–7 show the DPCS decision graphs and corresponding clustering results. Finally, the evaluation indexes comparison results of three algorithms are listed in Table 5, and the corresponding predefined parameters of DPC and FKNNDPC are also given.
In the DPCS clustering of aggregation, 7 points near the diagonal are selected as center points in the decision graph Fig. 2 (a). The clustering result is given in Fig. 2b. Although there are 7 clusters, with 4 large (3 ellipsoidal clusters and an inner concave cluster) and 3 small clusters, 7 center points are identified, and all points are clustered successfully.
Aggregation dataset DPCS outcomes.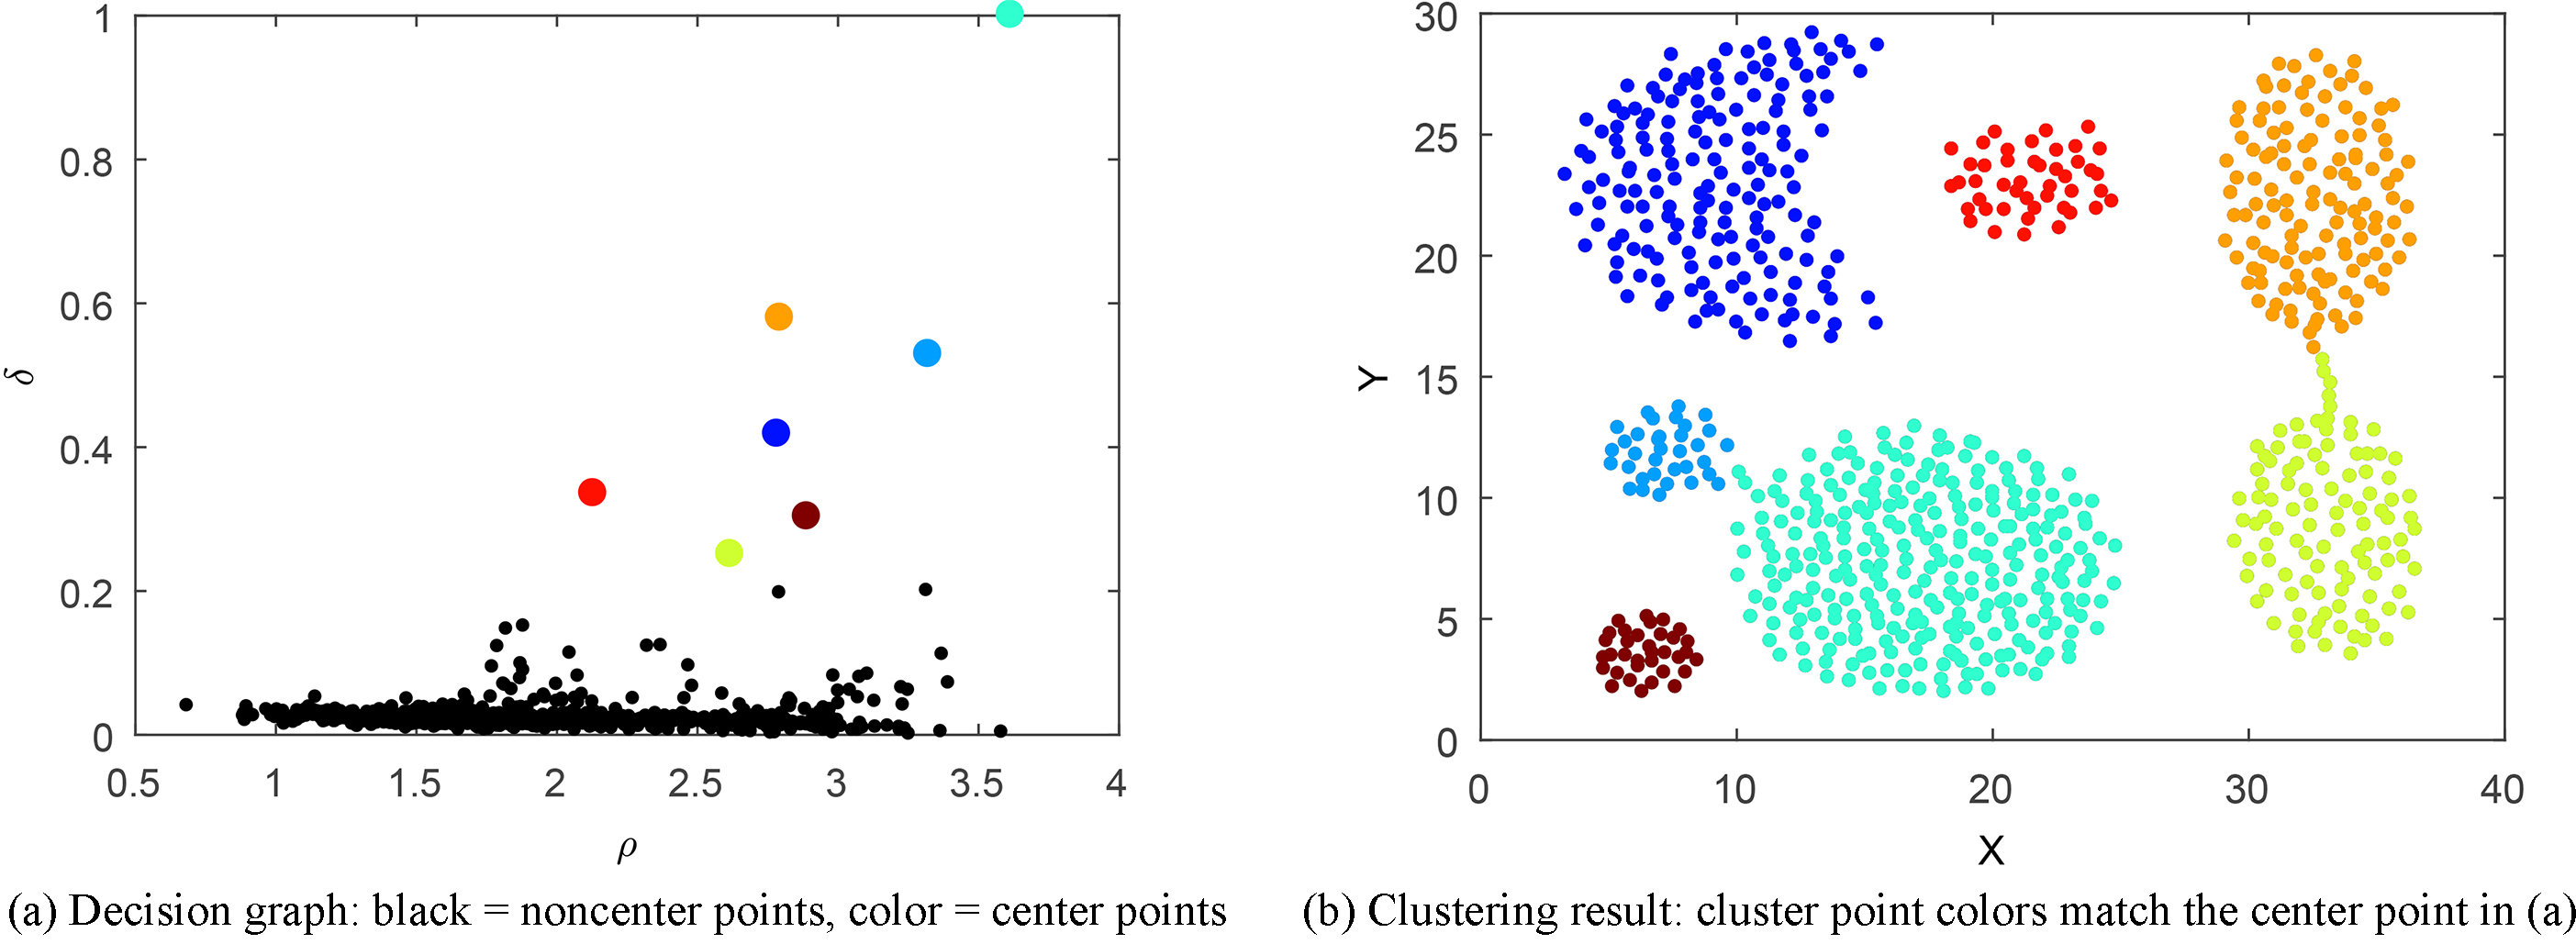
The semi-encircling shape of Flame is more obvious than those of the others. The decision graph in Fig. 3a shows that the difference between the center points and the noncenter points identified by DPCS is very significant. The clustering result in Fig. 3b shows that the two clusters are separated completely.
Flame dataset DPCS outcomes.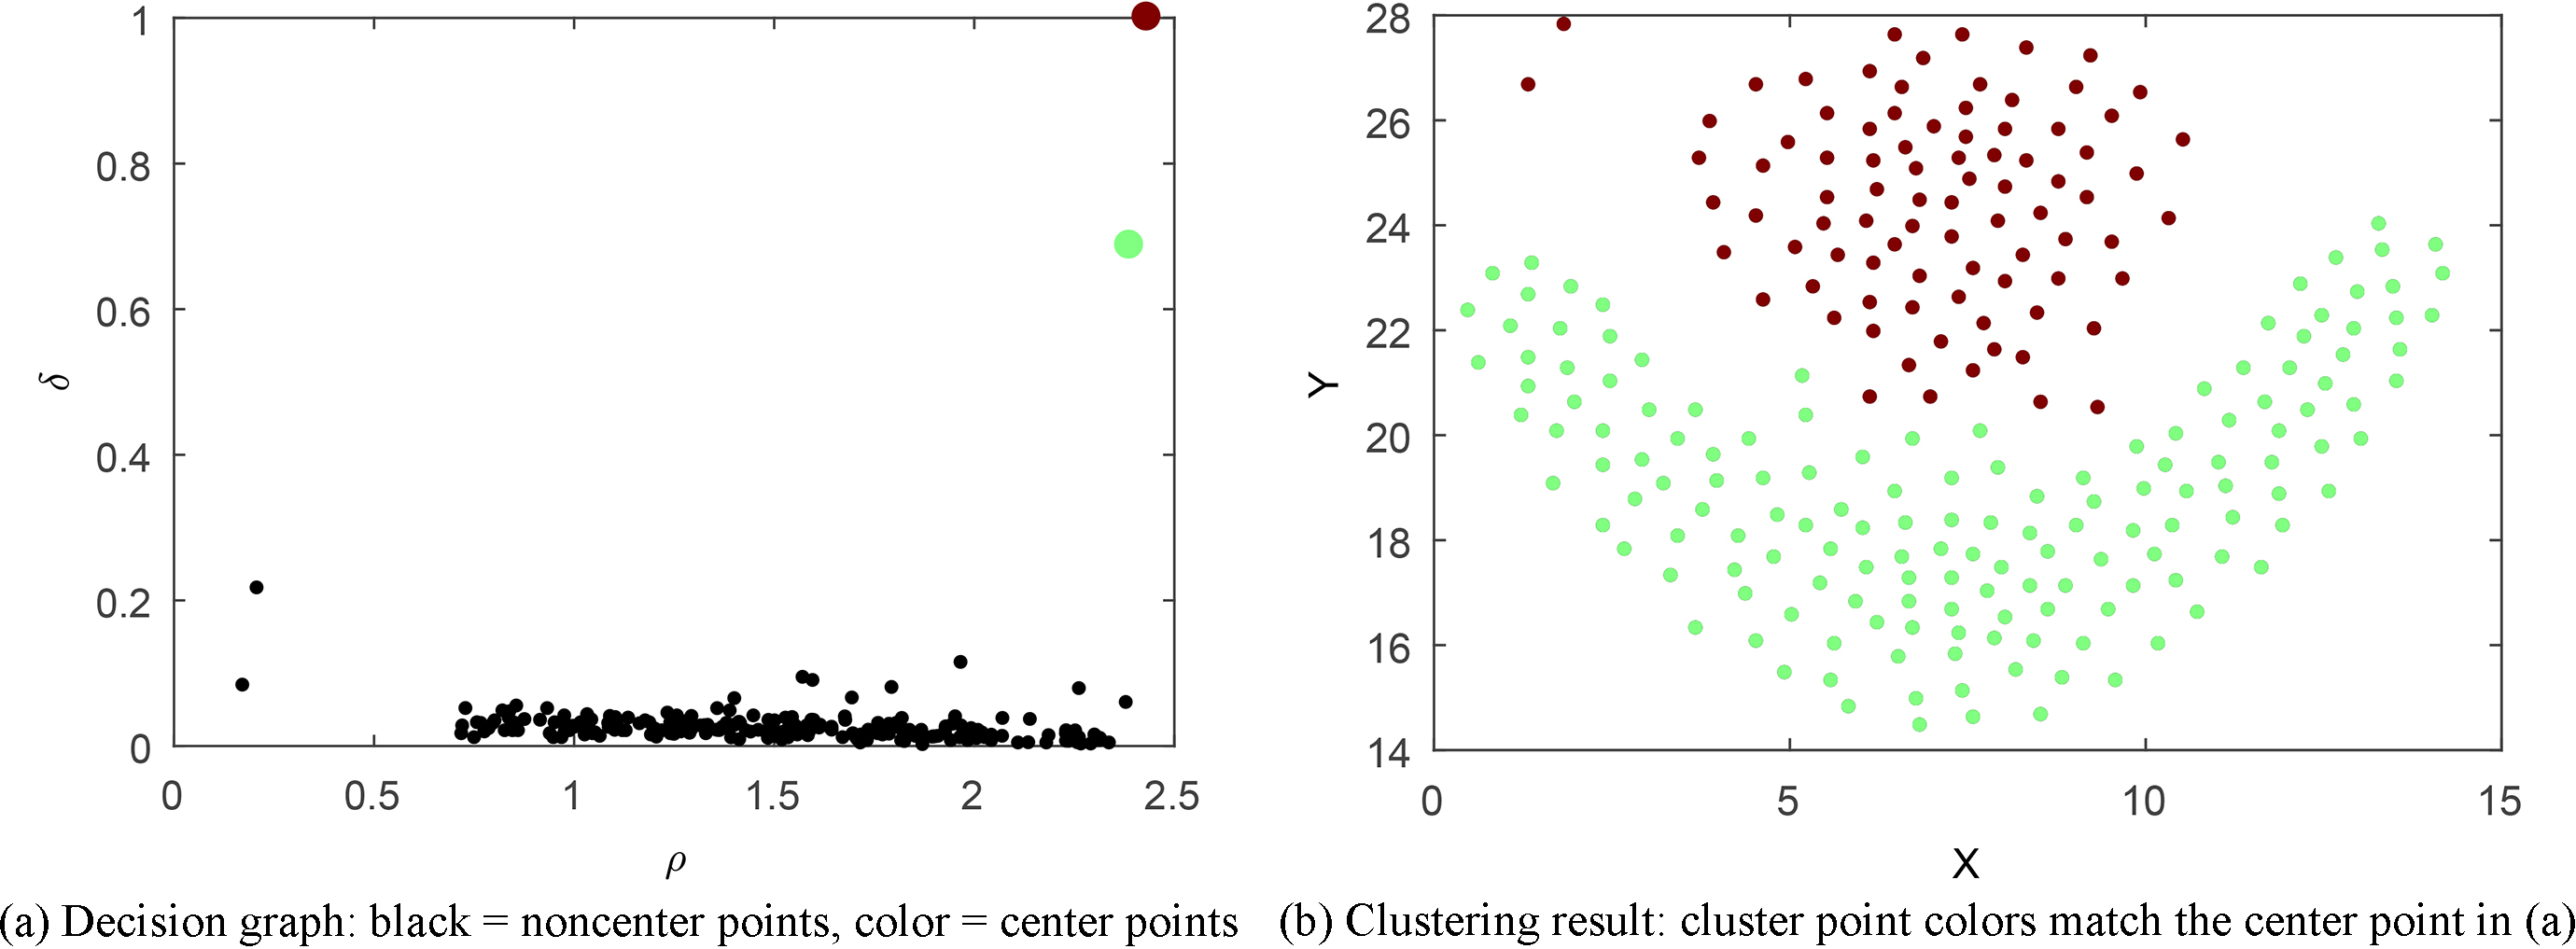
When the number of clusters increases, DPCS also obtains good clustering performance. The decision graphs in Figs 4a and 5a of R15 and D31, respectively, show that the distinction between center points and noncenter points is very obvious. The clustering results in Figs 4b and 5b also show that no clusters are split, and the clustering result of DPCS is perfect.
R15 dataset DPCS outcomes.
D31 dataset DPCS outcomes.
Spiral is a dataset that must be validated by any density-based clustering algorithms. Its special spiral shape leads to a great challenge for the nondensity-based algorithm to separate them completely. The 3 center points are easily selected from the decision graph in Fig. 6a of DPCS. The three spiral lines are separated completely in the clustering result in Fig. 6b, and no point is clustered into the wrong cluster.
The points of S1 distribute into different shapes (circle, ellipse, rectangle, strip, etc.), and the boundary points of different clusters are almost overlapping. The decision graph Fig. 7a of DPCS shows that 15 center points are significantly separated from noncenter points. Therefore, the number of clusters and center points are easily selected. The clustering result in Fig. 7b shows that DPCS can identify the points in each cluster correctly.
Clustering performance metrics on the datasets from Table 4
Spiral dataset DPCS outcomes.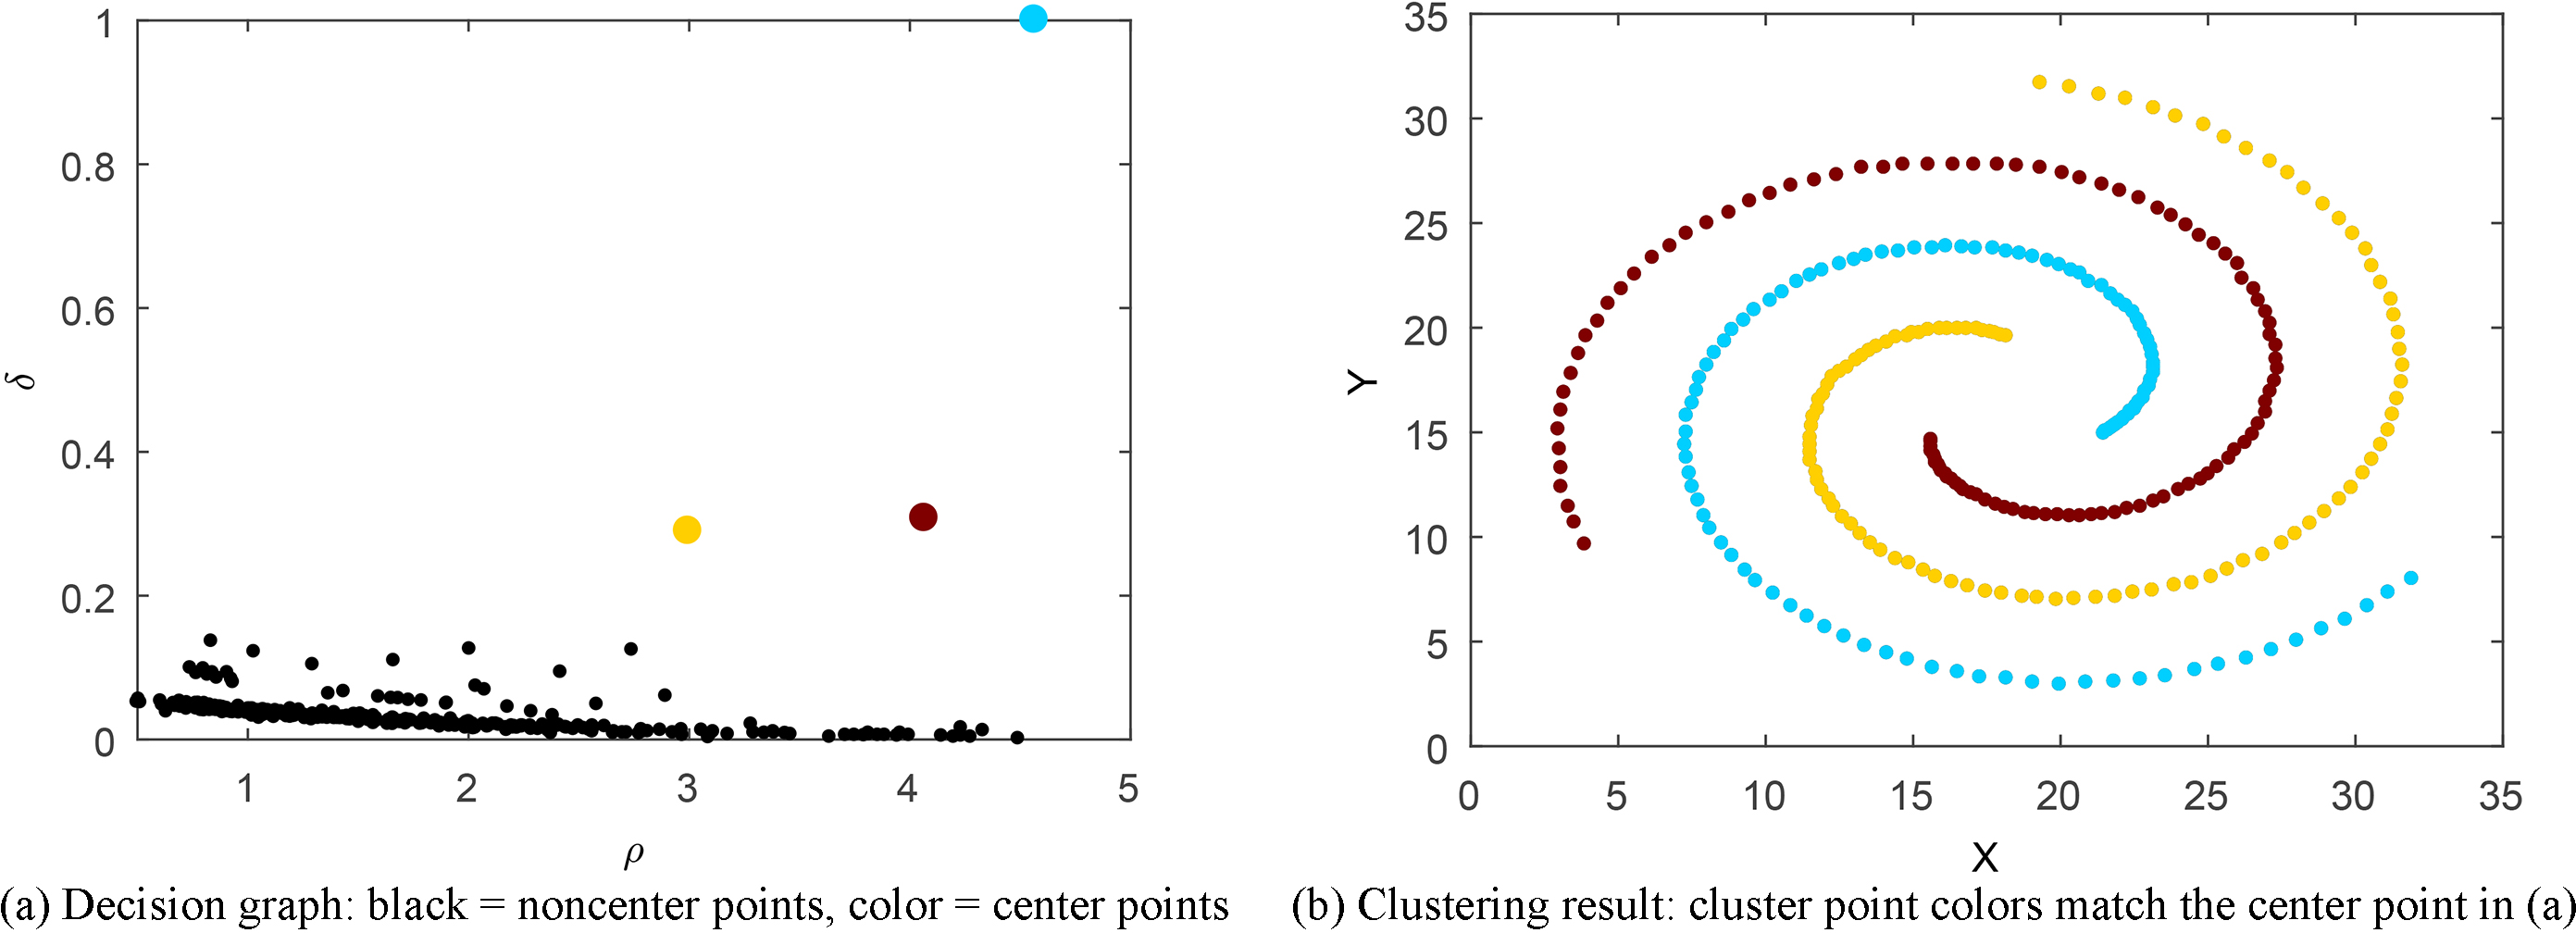
S1 dataset DPCS outcomes.
Since we improved the definition of local density, we pay more attention to the identification of center points in the decision graph. Figures 3–7 show that DPCS finds large differences between center points and noncenter points, which makes it clear to determine the number of clusters and select the appropriate center points. However, Fig. 2 (a) shows two almost parallel noncenter points on the bottom right side of the light green center point. Nevertheless, DPCS still identified the appropriate center and noncenter points correctly.
Both DPC and FKNNDPC exhibit high clustering performance, with only small differences that can hardly be seen by eye in the clustering results. However, clustering evaluation indexes highlight these slight differences. Table 5 shows the evaluation indexes for the 6 datasets, where the optimal value is marked in bold type. DPC achieves the highest clustering accuracy for 5 of the 6 datasets, and both FKNNDPC and DPCS achieve the highest clustering accuracy for 3 of the 6 datasets. Although it appears that DPCS clustering performance is inferior to DPC, the different Aggregation and S1 datasets show that the DPC and DPCS clustering accuracies are very close (the difference in accuracy is less than 0.01). Therefore, DPCS and DPC have relatively the same clustering performance. More importantly, the greatest DPCS advantage is that users do not need to supply predefined parameter(s). This makes DPCS particularly good for clustering analysis of datasets without prior knowledge. Hence, DPCS has high performance and is more competitive than DPC and FKNNDPC for clustering analysis, and we propose DPCS to cluster drug-target data.
Table 6 shows the evaluation indexes for the 6 datasets with Gauss noise (
Clustering performance metrics on the datasets with Gauss noise from Table 4
Drug-target interaction datasets
Enzyme dataset decision graphs.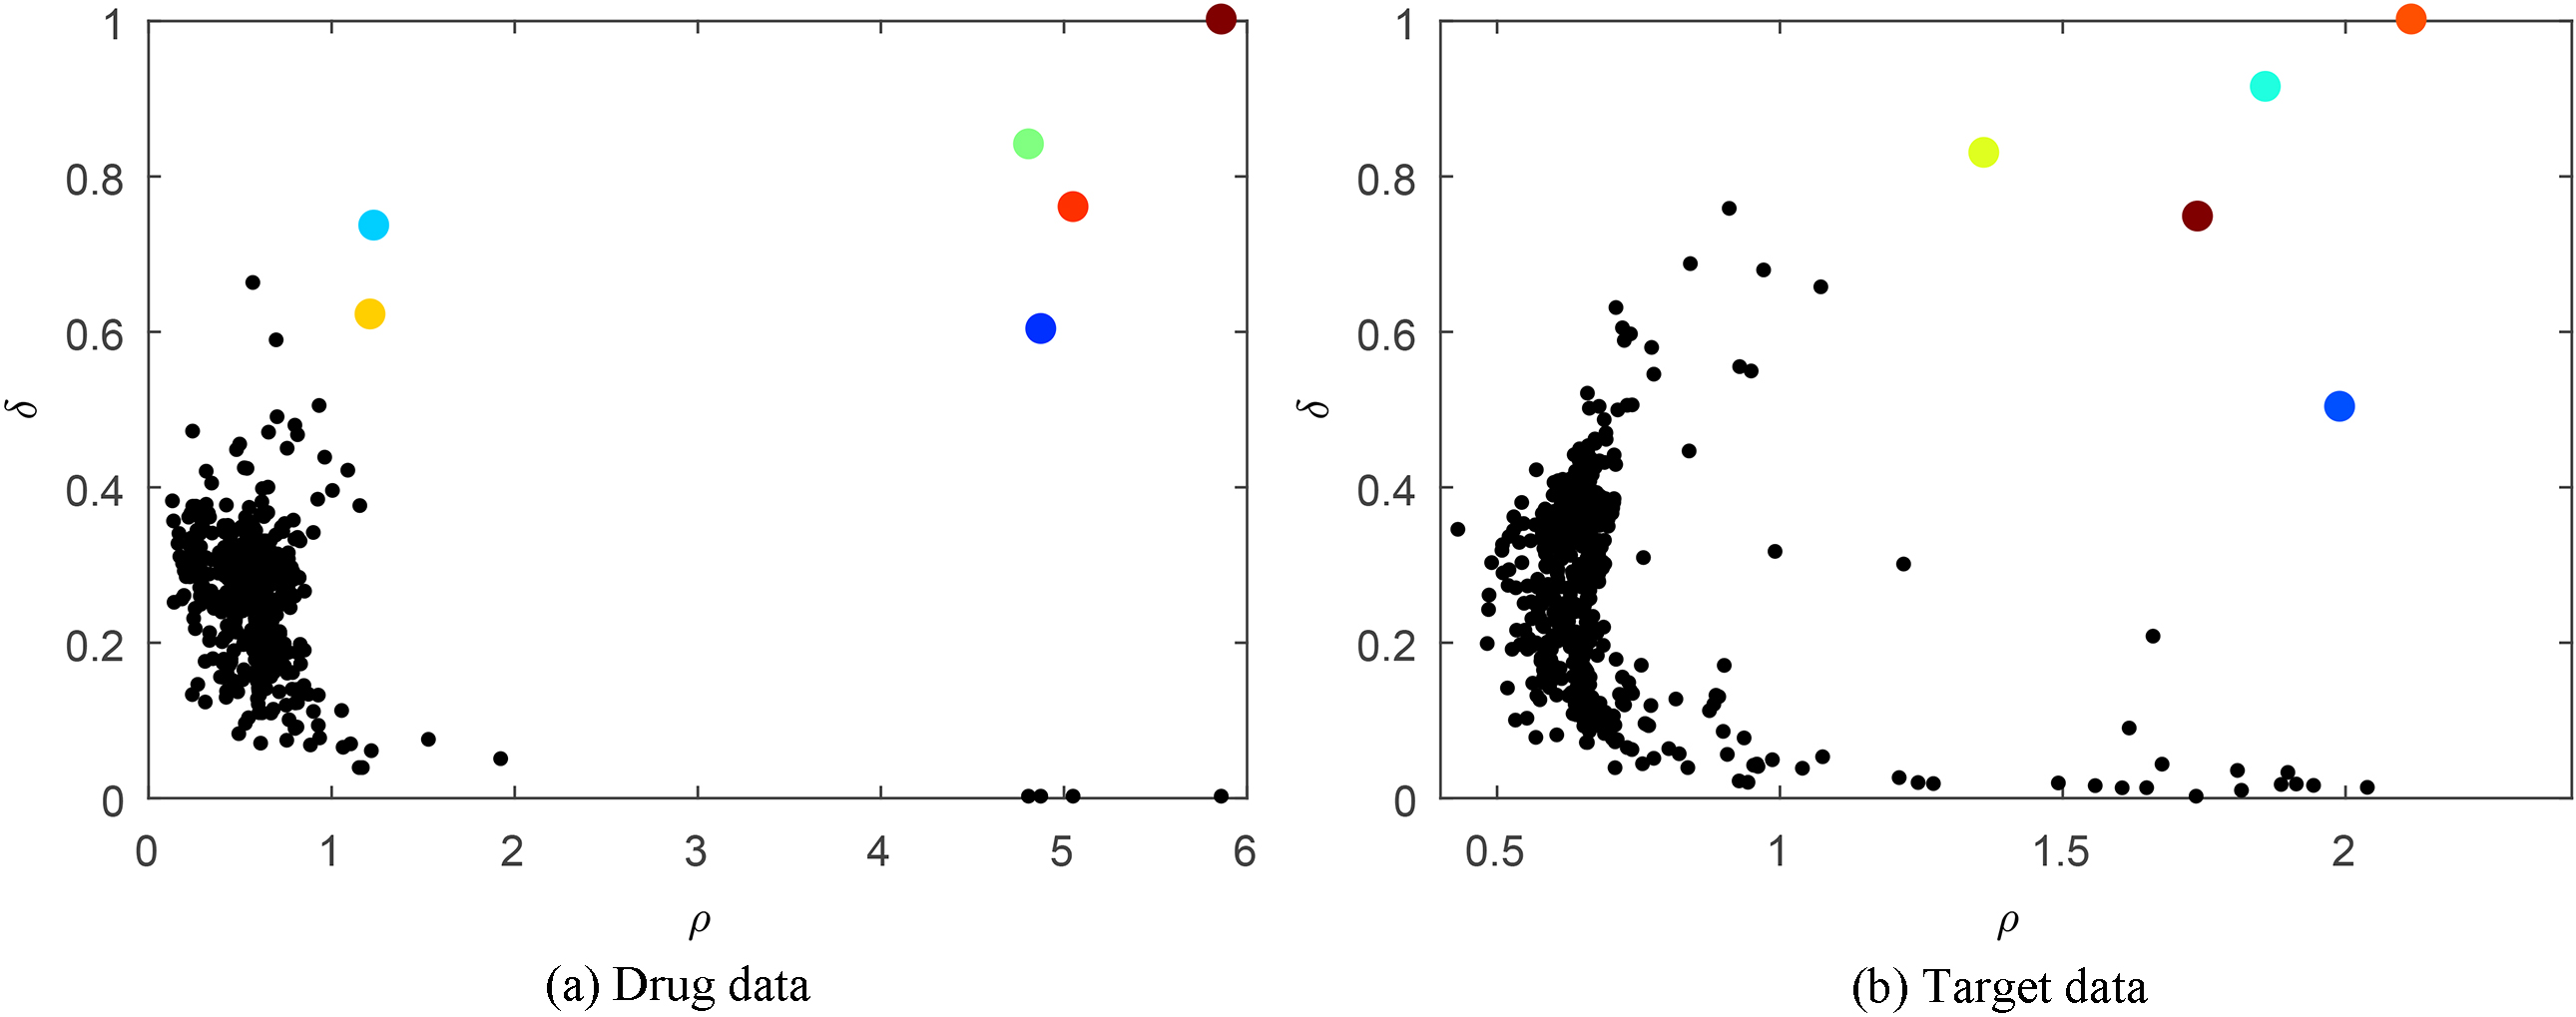
Drug-target interaction datasets
Table 7 shows four drug-target datasets published by Yamanishi et al. [49] with drug-drug and target-target similarity as well as drug-target interaction relationships. They are standard datasets for many studies predicting drug-target interaction [50, 51, 52, 53]. The interactions between drugs and targets are obtained from the KEGG BRITE [54], BRENDA [55], SuperTarget [56] and DrugBank [57]. The chemical structures of the compounds come from the DRUG and COMPOUND sections in the KEGG LIGAND database [54], and chemical structure similarities between compounds are computed using SIMCOMP [15]. Amino acid sequences of the target proteins are obtained from the KEGG GENES database [54], and sequence similarities between proteins are computed using a normalized version of Smith-Waterman scores [16].
GPCR dataset decision graphs.
Ion Channel dataset decision graphs.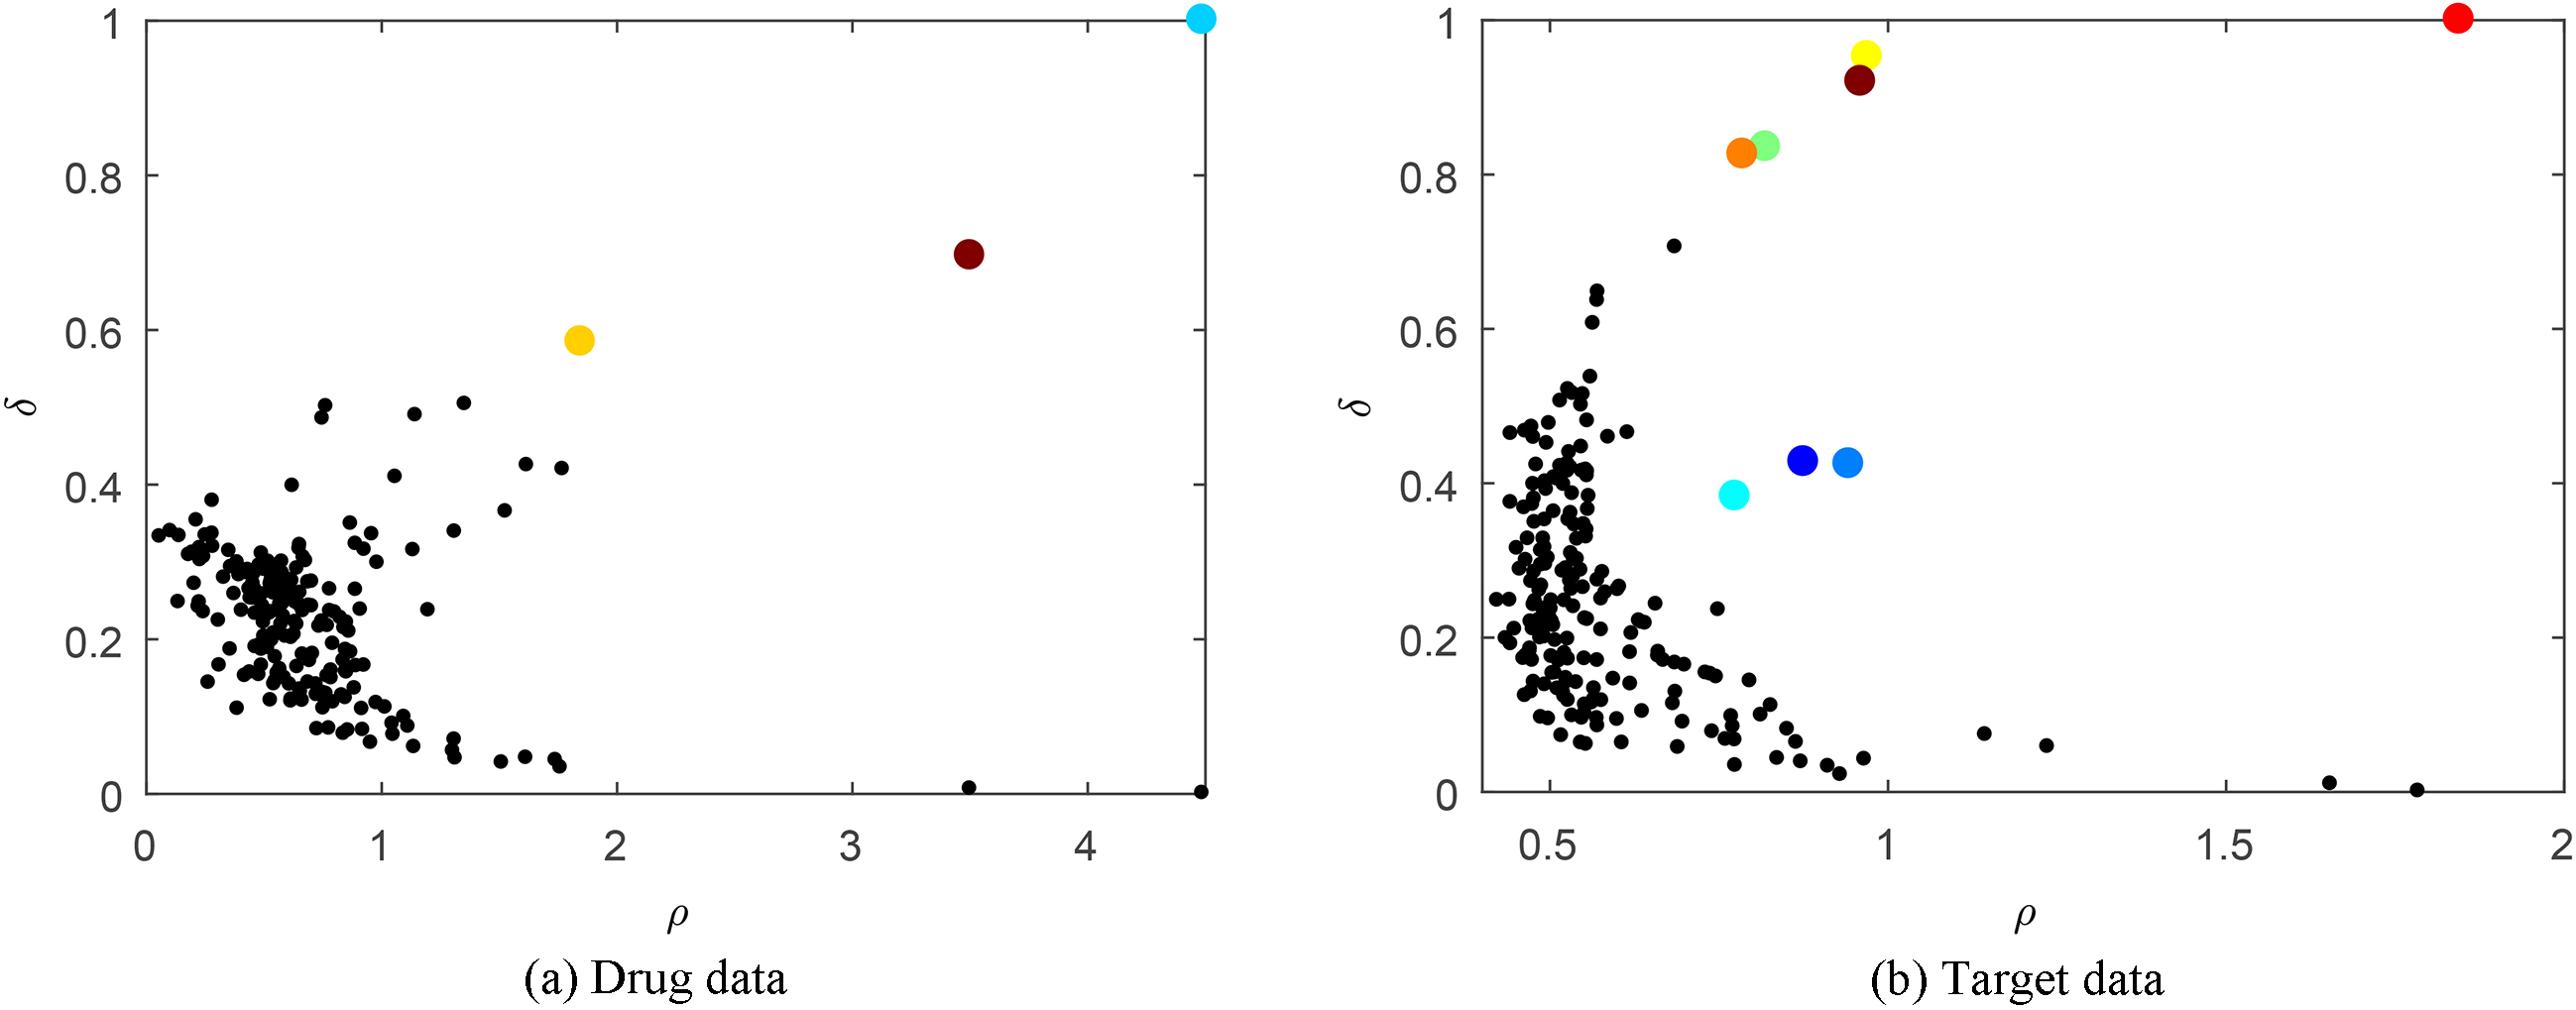
Since there is no class label information in the drug-target data, users cannot judge the number of clusters using prior knowledge. Therefore, algorithms such as DPC and FKNNDPC that need to determine predefined parameter based on class label are unsuitable, whereas the DPCS algorithm proposed here does not require a predefined parameter and is suitable for clustering and analyzing drug-target data.
We use DPCS to cluster the four drug and target datasets and compare the outcomes with FastK [24] and HC [25]. We first use DPCS to determine the number of clusters and identify the corresponding center points and then use the DPCS number of clusters as the predefined parameter for FastK and HC. The number of points within each cluster are then extracted using the clustering algorithms.
Clustering results for drug-target datasets shown in Table 7
Clustering results for drug-target datasets shown in Table 7
Nuclear Receptor dataset decision graphs.
The drug-target datasets provide similarity matrices, whereas the clustering algorithms require distance matrices. Therefore, we use
Nuclear Receptor clustering.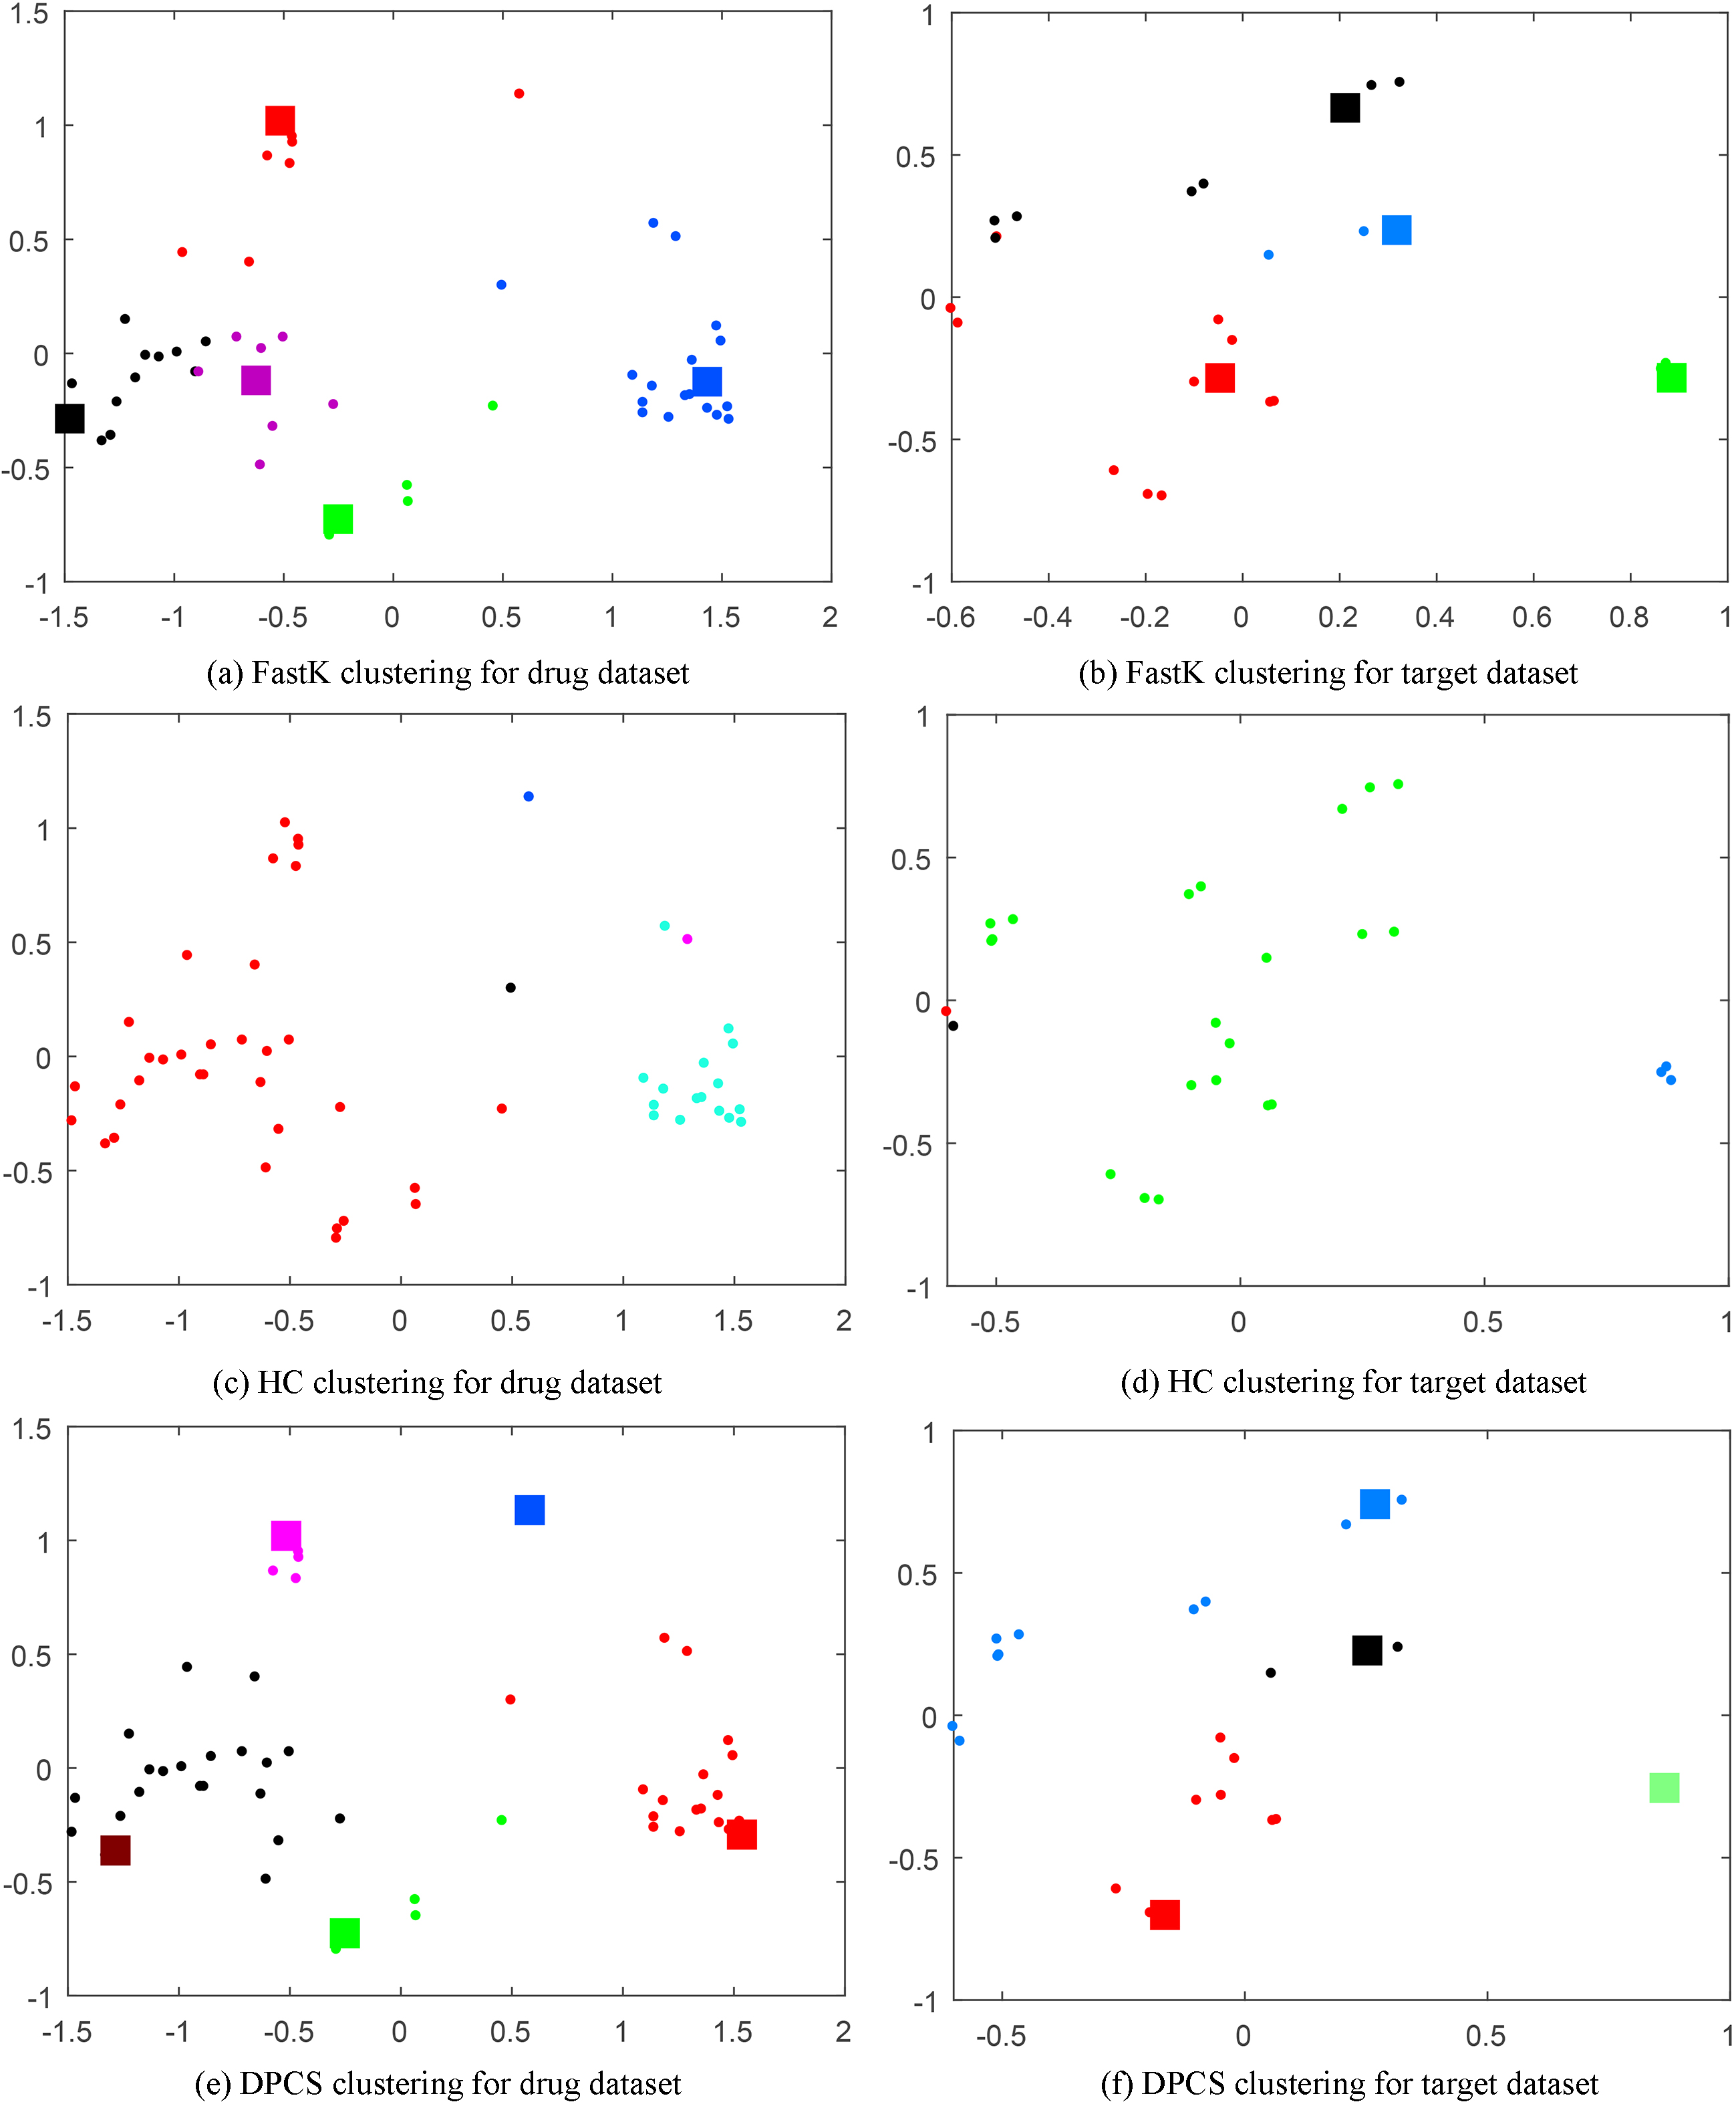
The number of drugs and targets in GPCR is less than that in Enzyme. Figure 9 shows that, aside from the 6 center points (Fig. 9a, two points are overlapping, and the number of center points can be seen in Table 8) shows that the drug data are centralized, whereas target data (see Fig. 9b) are more dispersed. DPCS selects 7 center points for drug and 5 for target data.
Figure 10 shows that the Channel drug data center points are easily distinguished, and DPCS selects 3 points, whereas 8 center points are selected for the target data. Nuclear Receptor has the least number of samples. Figure 11 shows that DPCS selects 5 drug and 4 target data center points, even though there is no centralized trend to the target data point distribution.
Table 8 shows FastK, HC, and DPCS clustering metrics based on the number of clusters from Figs 8–11. The number of drugs or targets are shown in the Number of objects column. HC clustering for the Enzyme, GPCR, and Nuclear Receptor datasets exhibits isolated clusters, and the Ion Channel dataset has a seriously unbalanced numbers of points in each cluster. FastK and DPCS provide more balanced clusters than HC, with no isolated clusters across all four datasets. Thus, it is unlikely that isolated clusters conform to the actual data situation. Many FastK and DCPS clusters have similar numbers of drugs or targets, e.g., FastK cluster with 30 and DPCS cluster with 31 objects for Enzyme drug data, FastK clusters with 9, 5, and 33 objects, and DPCS clusters with 9, 7, and 34 objects for GPCR target data. These similar results from the different clustering algorithms increase their credibility.
To further analyze the algorithm cluster results, we used the Nuclear Receptor dataset as an example to perform MDS and selected the two most significant differentiation features for intuitive graph analysis.
Figure 12 shows the three algorithm clustering results, where the large square represents the center point, and points in the same cluster are marked in the same color. Since there are no center points in HC, Fig. 12c and d do not show square marks. The purple, black, and blue drug points (Fig. 12c) and the red and black target points (Fig. 12d) are isolated clusters. Although FastK drug clustering (Fig. 12a) shows the black, purple, and red clusters are somewhat closer to each other, DPCS clustering gathers these points into the same cluster (Fig. 12e, black points). FastK target clustering (Fig. 12b) shows the red cluster contains two points near coordinates
Thus, DPCS clusters the points more reasonably without requiring predefined parameters.
Conclusion
This paper investigated the problem of drug-target data clustering and proposed the clustering by fast search and find of density peaks based on a sequence (DPCS) algorithm to overcome the limitation of requiring a predefined cutoff distance. We experimentally compared DPCS with the DPC and FKNNDPC algorithms for 6 classical datasets, showed that the improved local density calculation without requiring a predefined parameter easily and correctly identified center points in the decision graph, providing excellent clustering performance.
We also applied the proposed DPCS clustering algorithm to four common standard drug-target datasets and compared it with FastK and HC algorithms. Without prior information, DPCS determined an appropriate number of clusters for each dataset and identified the corresponding center points. DPCS clustering was more reasonable than FastK and HC, providing more accurate auxiliary information for drug-target interaction prediction. An intuitive graph analysis of the two most significant differentiation features used in the MDS confirmed the conclusion.
Footnotes
Acknowledgments
This work is supported by the National Natural Science Foundation of China (61571164, 61671188, 61871020, 61532014, 61571163 and 61671189), the Key Science and Technology Plan Project of Beijing Municipal Education Commission of China (KZ201810016019), the Fundamental Research Funds for Beijing University of Civil Engineering and Architecture (X18197 and X18203) and the National Key Research and Development Plan Task of China (2016YFC0901902-5).
Supplementary materials
The drug-target datasets are available at