This paper made improvements on clustering by fast search and find of density peaks (CFSFDP) algorithm and extended this algorithm to fuzzy numbers (FN-CFSFDP algorithm). Using FN-CFSFDP algorithm, classical information included in the samples are extended to fuzzy sets, and fuzzy samples can be clustered by searching the density peak. Firstly, by means of error analysis, improved Euclidean distance between fuzzy numbers was defined, and some key parameters or operating quantities mainly including cut-off distance and Gaussian Kernel function of fuzzy samples were introduced in detail. Next, 76 random simulations in total were performed on four sets of samples under different conditions with different -values, different sample sizes, index numbers, cluster numbers and fetching rules. Moreover, Kappa coefficients in above simulations were calculated. Finally, both advantages and disadvantages of the proposed FN-CFSFDP were concluded and some recommendations for improvement were put forward, which can provide insightful guidance for further investigations of fuzzy clustering algorithms on fuzzy sets.
Clustering is an important human behavior. The key content of clustering is to divide a data set into several clusters in accordance with certain standard such as distance or density so as to minimize the difference among the data objects in a same cluster but simultaneously maximize the difference among the data objects in different clusters. Currently, clustering has been extensively investigated and successfully applied in many domains such as pattern recognition, data analysis, image processing, market research, customer classification and the classification of Web documents [1]. As shown in Table 1, the corresponding clustering algorithms can be roughly classified into six types. Each type includes a lot of different clustering algorithms and only some representative examples are listed in Table 1 for reference.
Classification of some common clustering algorithms
Classification results of some common clustering algorithms
For lack of space, only a small portion of clustering algorithms are listed in Table 1. Readers interested in clustering algorithms can read the papers wrote by Xu and Wunsch [27]; in particular, the readers who are familiar with Chinese can read the monograph that was wrote by Zhang [28]. A lot of common new clustering algorithms proposed in recent years were described minutely in this monograph. This article proposed a clustering algorithm for samples with fuzzy numbers, namely, a fuzzy numbers-based clustering algorithm by fast search and find of density peaks (hereinafter referred to as FN-CFSFDP algorithm). We’ll focus on it in later sections.
Including the Introduction, this paper also includes six sections. In Section 2, we introduces the related works of FN-CFSFDP algorithm proposed in this article. In Section 3, the related knowledge of fuzzy number was introduced as the preparation of further analysis. In Section 4, the improved Euclidean distance between fuzzy samples was first introduced via error analysis, then, some key parameters or operating quantities including the threshold of the distance between fuzzy samples and Gaussian Kernel function of the fuzzy sample were defined, and the detailed clustering procedures on fuzzy set using FN-CFSFDP algorithm were determined based on CFDFDP algorithm, after that, we analyzed the maximum time complexity of FN-CFSFDP and compared FN-CFSFDP algorithm and CFSFDP algorithm in several aspects. In Section 5, 4 sets and 76 times of random simulations in total were carried out on the fuzzy set with different sample numbers, indexes, 6 times random simulations in the first 3 sets are obtained the clustering accuracies were 74.00%, 44.00%, 71.67%, 71.67%, 71.00% and 71.00%, respectively; in addition, Kappa coefficients in random simulations under different parameter were calculated for evaluating and analyzing clustering results and the invalidation in automatic identification of cluster numbers. In the fourth set of random simulations, we got different mean values and variances of clustering accuracies and Kappa coefficients. There are series of conclusions: (1) The maximum mean value of clustering accuracy is equal to 65.07% when -parameter is equal to 1.00%; (2) The minimum mean value of clustering accuracy is equal to 57.30% when -parameter is equal to 3.00%; (3) The minimum variance of clustering accuracy is equal to 155.800 when -parameter is equal to 1.00%; (4) The maximum variance of clustering accuracy is equal to 239.623 when -parameter is equal to 1.50%; (5) The maximum mean value of Kappa coefficient is equal to 0.4760 when -parameter is equal to 1.00%; (6) The minimum mean value of Kappa coefficient is equal to 0.3595 when -parameter is equal to 3.00%; (7) The minimum variance of Kappa coefficient is equal to 0.0350 when -parameter is equal to 1.00%; (8) The maximum variance of Kappa coefficient is equal to 0.0567 when -parameter is equal to 1.50%; (9) The maximum mean-clustering accuracy of datasets is equal to 75.67 in the 10th group; (10) The minimum mean-clustering accuracy of datasets is equal to 40.19 in the 7th group; (11) The maximum mean-kappa coefficient of datasets is equal to 0.6350 in the 10th group; (12) The minimum mean-kappa coefficient of datasets is equal to 0.1029 in the 7th group; (13) The algorithm has a certain degree of parameter adaptability and clustering stability; (14) Overall, the clustering accuracy and kappa coefficient of FN-CFSFDP algorithm are lower than those of CFSFDP algorithm in an experimental comparison with 70 times classical CFSFDP clustering. After that, we proposed an original quantitative evaluation method for parameter adaptability and clustering stability, on this basis, we evaluated average level of parameter adaptability and clustering stability for FN-CFSFDP algorithm comprehensively in the fourth simulation. Finally, in the last section, both advantages and shortcomings of the proposed FN-CFSFDP algorithm were concluded in detail, which can provide research thought and direction for further investigation.
Related works
According to the membership between sample and cluster, clustering algorithms can be roughly divided into two types – classical clustering and fuzzy clustering. Classical clustering is a kind of data-based hard classification, in which samples and clusters satisfy two-valued logic relationship. Using classical clustering, each object to be identified should be strictly assigned to a cluster, i.e., a sample can only belong to or not belong to a cluster. In other words, it is an either/or classification. However, many objects in real life do not possess strict properties. For example, whether 3 a.m. is in the morning or at night? Whether a 50-year-old male is an old people or a youth? Whether 3 hamburgers in the breakfast are too much or too less for Jack? If a student leaves his/her left foot outside the classroom but moves the right foot in the classroom, whether he/she is inside or outside the classroom? All these questions have no explicit boundaries. According to Zadeh’s theory [29], above questions have the extension of fuzzy concept [30]. Fuzzy clustering should be conducted on these questions or objects. Unlike classical clustering, fuzzy clustering is a kind of soft classification for data. In brief, according to the definition, fuzzy clustering can be applied on the samples which may belong to or not belong to a certain cluster. For example, fuzzy clustering algorithm is appropriate to the sample set in which a sample has a 70% probability of belonging to Cluster A and simultaneously a 30% probability of belonging to Cluster B. FCM and PCM as listed in Table 1 are two typical fuzzy clustering algorithms; in particular, FCM is the most common clustering algorithm that was proposed by Ruspini in 1969 [31]. Afterwards, Dunn and Bezdek extended Ruspini’s thought in 1974 and 1981, proposed the basic idea of determining fuzzy classification by minimizing an appropriately defined function and successfully derived an iterative algorithm used for calculating the membership function of the examined cluster [32, 33]. Using FCM, the sum of the membership grades of each sample to all clusters equals to 1. Under this constraint, the clustering results using FCM are not completely consistent with visual membership grades. Moreover, FCM is quite sensitive to noise and abnormal samples. For overcoming the shortcomings, Krishnapuram and Keller proposed a probability-based fuzzy clustering algorithm (PCM) [34]. Owing to the ignorance of above sum-to-1 constraint, the membership grades of noise and abnormal samples are quite small when using PCM, which can thus enhance noise-resistance capability of the clustering center. Accordingly, PCM is more robust than FCM. However, PCM is sensitive to initial conditions and cannot adequately solve the questions with serious noise. In order to reduce the sensitivity to noise, Pal et al. developed PFCM algorithm on the basis of FCM and PCM [35], Yang and Wu proposed PCA algorithm [36], while Zhang and Leung put forward IPCM algorithm [37]. Other scholars also proposed a lot of improvement algorithms, which are not detailedly introduced in this paper.
Using any a clustering algorithm, two factors – sample type and membership – should be taken into account. However, for FCM, PCM, PCA and IPCM algorithms, although they fall into the type of fuzzy clustering (i.e., the membership between sample and cluster is fuzzy), the sample information is still classical. According to both sample type and membership, clustering algorithms can be divided into four types, as shown in Table 2.
Type of clustering algorithms
Sample type
Membership
Classical
Fuzzy
Classical
TYPE 1
TYPE 3
Fuzzy
TYPE 2
TYPE 4
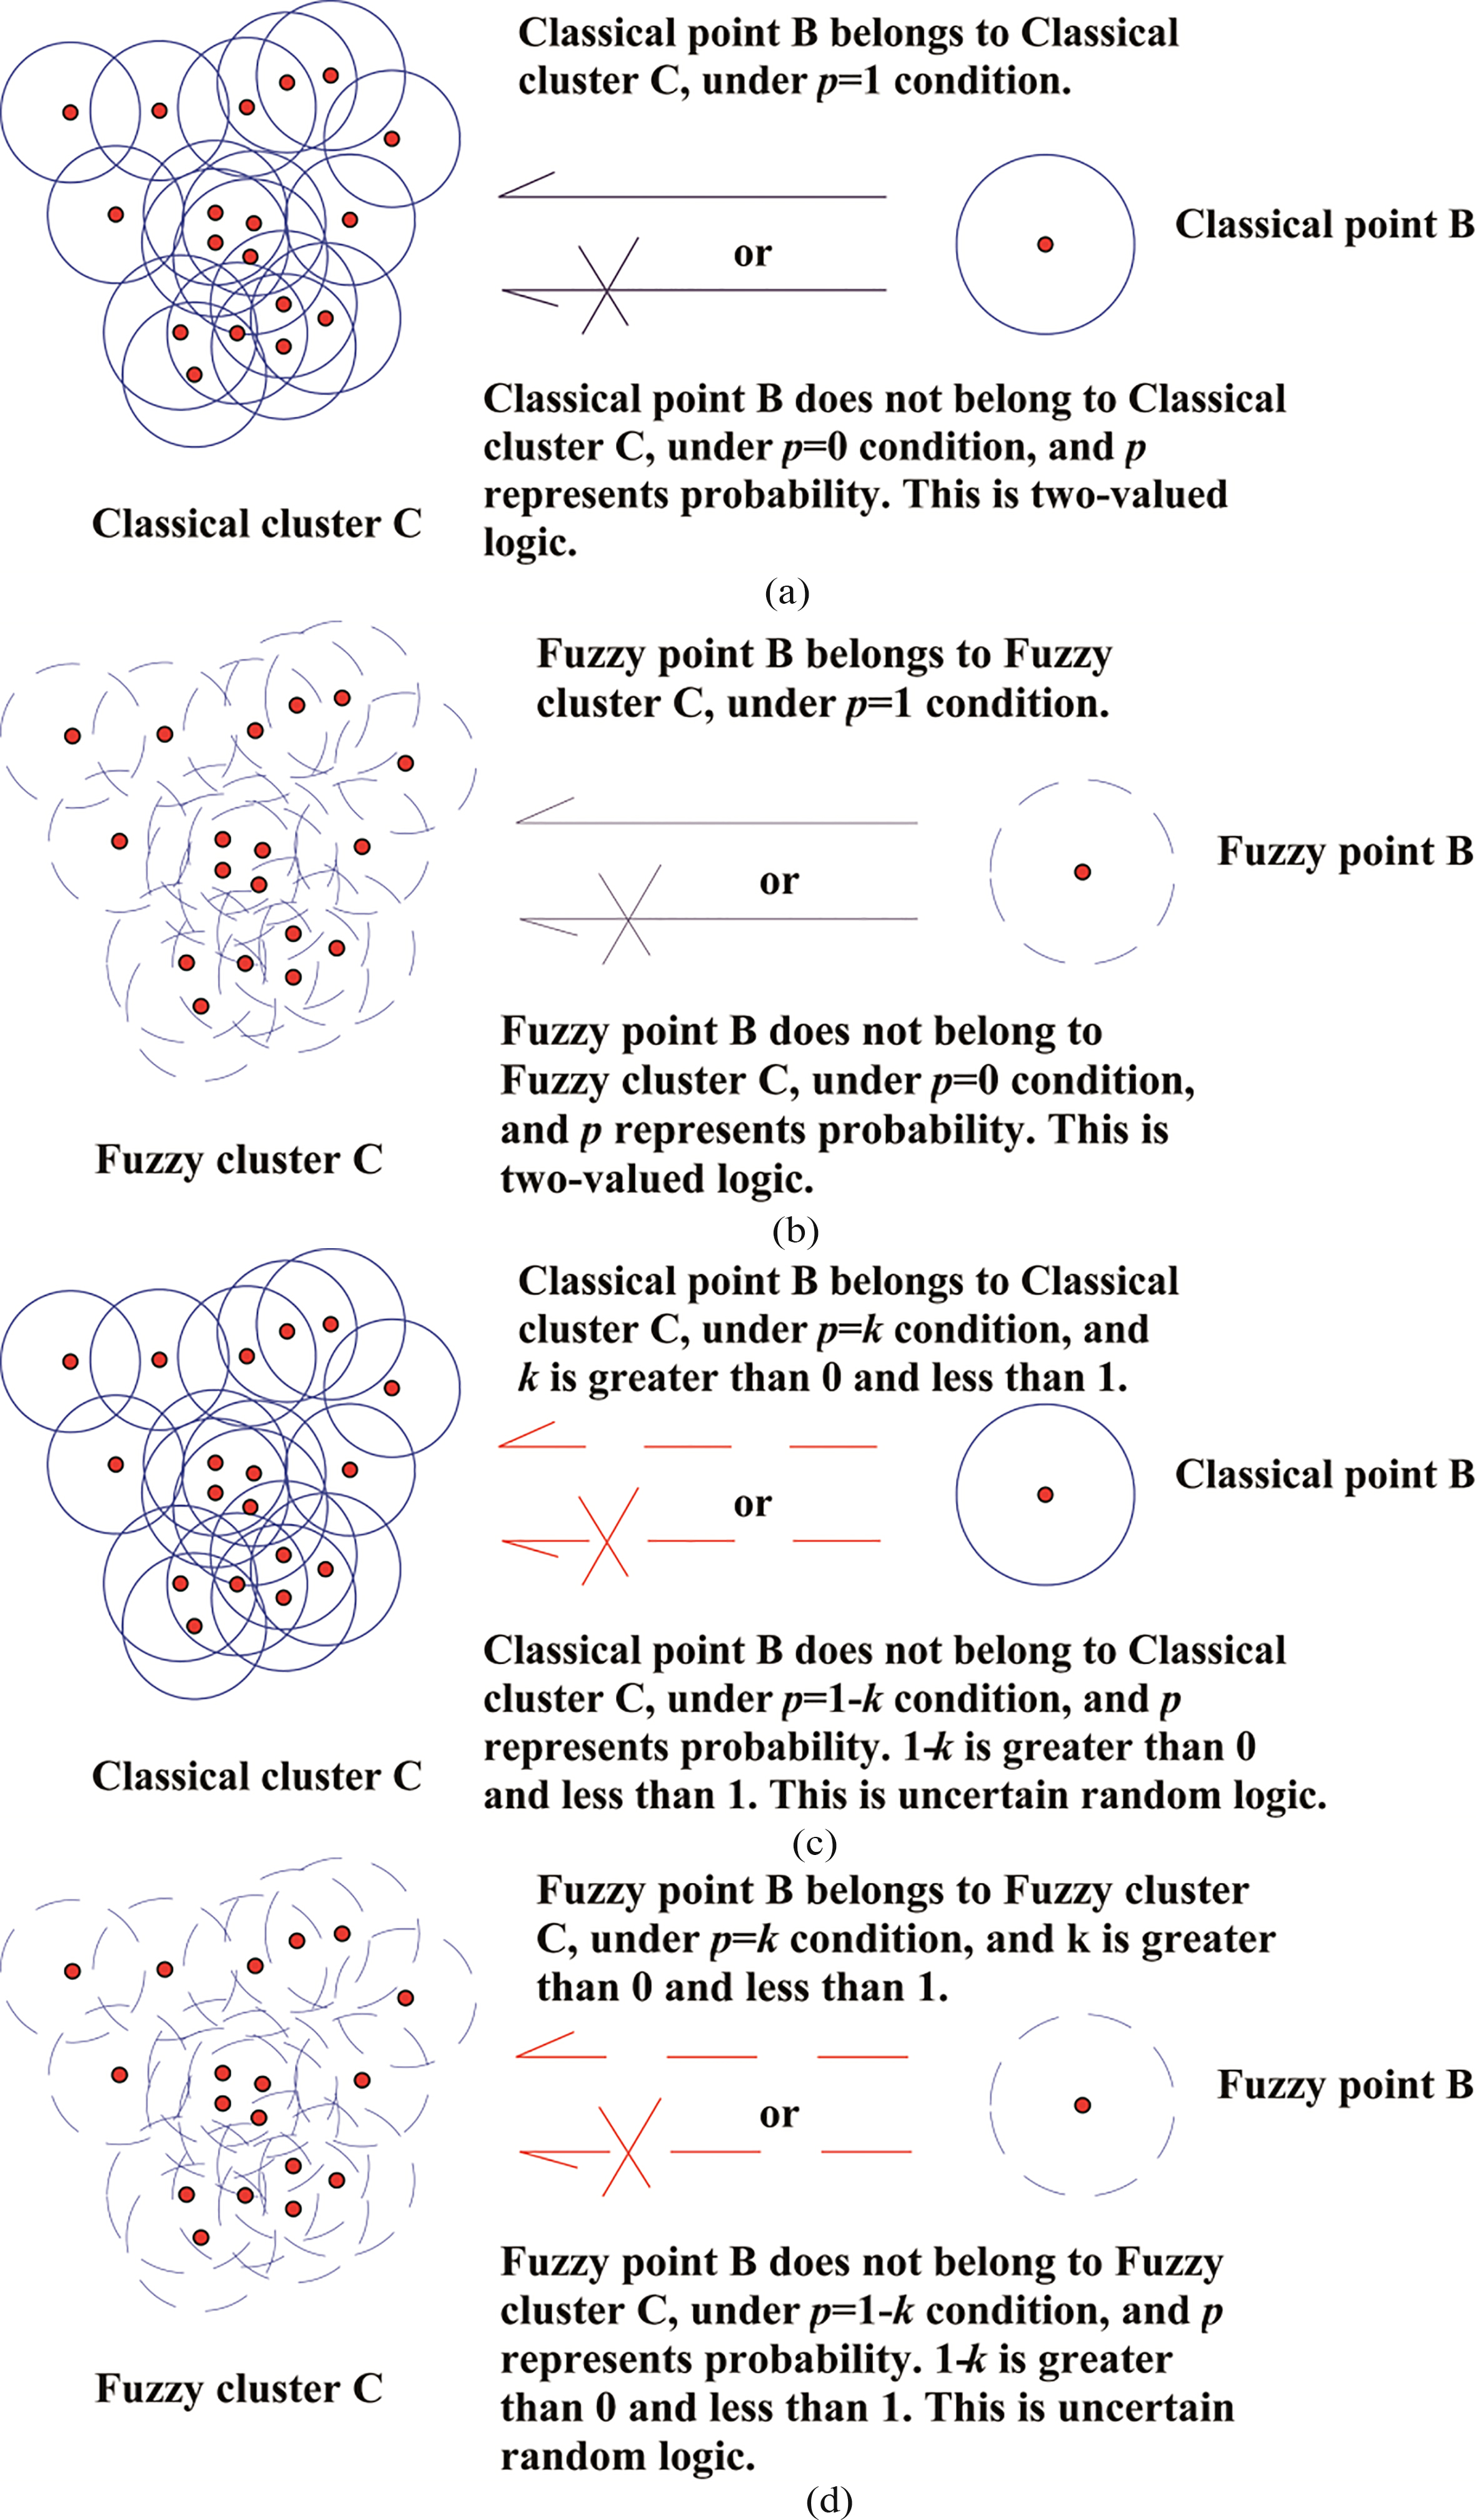
As listed in Table 2, the clustering algorithms in TYPE 1 are applicable to classical samples, in which both sample information and membership are established on classical set; the clustering algorithms in TYPE 2 are applicable to fuzzy samples, in which sample information is established on fuzzy set while the membership is established on the classical set; the clustering algorithm in TYPE 3 are applicable to fuzzy samples, in which sample information is established on fuzzy set while the membership is established on classical set; the clustering algorithms in TYPE 4 are applicable to fuzzy samples with fuzzy membership to clusters. Accordingly, K-means, BIRCH and DBSCAN algorithms can be regarded as the algorithms in TYPE 1 while FCM and PCM fall into the type of TYPE 2; by contrast, the clustering algorithms in TYPE 3 and TYPE 4 were rarely investigated in spite of some studies on the clustering of uncertain data. For example, Kriegel and Pfeifle proposed FDBSCAN algorithm in combination with probability density function [38]. On the basis of DBSCAN clustering algorithm, Tepwankul and Maneewongwattana defined measurement distance and deviation using probability, sample expectation and density and thus put forward U-DBSCAN algorithm [39]. Erdem and Gundem divided a 2D data set into sub-data sets and acquired final clusters by combining these sub-data sets [40]. These algorithms mainly depend on probability or dimension reduction. Although the word ‘Fuzzy’ appears in the related literatures, these algorithms were developed on classical sets rather than fuzzy set and thus can only be regarded as the clustering on uncertain data. In narrow sense, fuzzy clustering refers to a kind of clustering algorithms based on fuzzy mathematics, which generally uses the related knowledge of fuzzy set rather than pure dependence on the knowledge of probability or interval number on classical set. Therefore, almost no studies have been performed on fuzzy clustering algorithms on narrow Fuzzy set. In order to illustrate characteristics of 4 types-clustering in Table 2 vividly, we can draw an example diagram for relationship between clusters and samples. In this diagram, solid and dashed circular point respectively represent classical sample and fuzzy sample, so we call them ‘Classical Point’ and ‘Fuzzy Point’, as shown in Fig. 1.
Four different types of clustering in different logics. a. Classical point and classical cluster in two-valued logic. b. Fuzzy point and fuzzy cluster in two-valued logic. c. Classical point and classical cluster in uncertain random logic. d. Fuzzy point and fuzzy cluster in uncertain random logic.
In practical applications, on account of asymmetry of information and the limitations of objective measure, people sometimes cannot acquire very accurate data. For example, a tractor manufacturing enterprise needs to finance approximately 5 million dollars; Marry is approximately 170 cm tall; Vivian spends approximately 13.5 s in the 100-meter dash. All these data are fuzzy. In order to solve this kind of problems, the concept of fuzzy number in fuzzy mathematics was thus proposed. Based on CFSFDP algorithm proposed by Rodriguez and Laio in [16], a novel clustering algorithm for the fuzzy samples including multiple fuzzy numbers under multiple indexes was investigated in this study; moreover, the effectiveness of the proposed algorithm was validated by random simulation results. Some people may ask why we choose the CFSFDP algorithm as the basic algorithm instead of other algorithms. Take DBSCAN algorithm as an example, DBSCAN algorithm and CFSFDP algorithm are both belong to density-based clustering algorithms, and DBSCAN algorithm has no requirement for any shapes of data sets, discovering clusters with arbitrary shape easily. Also, it can effectively identify noise points and outliers. These are many advantages in DBSCAN algorithm. On the other hand, DBSCAN algorithm also has the following disadvantages [41, 42]: (1) Poor adaptability for parameters and poor robustness; (2) The ability to deal with high dimensional data is not strong enough; (3) For the datasets with uneven density distribution, the clustering results are not accurate enough. In contrast, CFSFDP algorithm does not require complex parameter settings, no requirement for shape of clusters. It could not only handle high-dimensional data more effectively than DBSCAN algorithm, but also handle sparse data and low dimensional data more effectively [43]. And it can automatically identify the number of clusters and find out centers of clusters clearly [44]. In a word, CFSFDP algorithm is more universal, lower computational complexity and higher stability than DBSCAN algorithm. In addition, CFSFDP algorithm, one of newly discovered clustering algorithms, came out in 2014 and has great expansibility. For all these reasons above, CFSFDP algorithm is chosen as the basic algorithm in this paper. According to the classification method in Table 2, the proposed algorithm can be classified into TYPE 3. After introducing the related works, we will introduce FN-CFSFDP algorithm in detailed.
Related concepts of fuzzy number
This study focused on fuzzy numbers for clustering. The definition of fuzzy number was first derived on the basis of fuzzy set. Next, some concepts of Fuzzy set will be first introduced.
Definition 1. (Classical set) For a domain of discourse , is a subset of . If , and can be exclusively satisfied, can be regarded as a classical set. For the domain of discourse , the subset can only be determined by the following characteristic function :
where . The characteristic function will then be extended to the range of fuzzy set ([0, 1]).
Definition 2. (Fuzzy set) Assuming is a mapping from the domain of discourse to a closed interval [0, 1], if , can be satisfied, it can be regarded that determines a fuzzy subset in the domain of discourse ; further, is a fuzzy set, represents the membership function of or the membership grade of to the fuzzy set .
Definition 3. (Continuous fuzzy set) If the fuzzy subset is an infinite set in the domain of discourse , in above Definition 2 is a continuous fuzzy set. According to Zadeh expression method, can be described as:
It should be noted that is only a kind of expression pattern rather than integral sign in ordinary sense.
Definition 4. (Convex fuzzy set) Assuming the domain of discourse is in Euclidean space and is a fuzzy subset in , the necessary and sufficient conditions for a convex fuzzy set in can be written as:
where , denotes the membership function of or the membership grade of to the fuzzy set , and .
Definition 5. (Regular fuzzy set) As regard to , a fuzzy subset in , if A is a regular fuzzy set, when and only when , .
Definition 6. (Fuzzy number) If the domain of discourse is a real number field and the fuzzy set in is a regular convex fuzzy set (i.e., can simultaneously satisfy both Definitions 4 and 5), can be regarded as a real number. If A is also an infinite set, A can be regarded as a continuous fuzzy number. Discrete fuzzy number is a special form of continuous fuzzy number, i.e., if A is an infinite set and satisfies certain conditions, A can also be regarded as a discrete fuzzy number [45].
As stated above, a discrete fuzzy number is a special form of a continuous fuzzy number. Unless otherwise specified, the involved formulas in clustering are applicable to continuous fuzzy numbers, which will be abbreviated as fuzzy numbers hereinafter (i.e., the mentioned fuzzy numbers are all continuous fuzzy numbers in this paper).
Some common fuzzy numbers mainly include triangular fuzzy numbers, trapezoidal fuzzy numbers, normal fuzzy numbers and Cauchy fuzzy numbers. Besides, interval numbers are also a kind of special fuzzy numbers, while fuzzy numbers are the generalization of interval numbers [30]. Subsequently, the clustering procedures are detailedly described on the basis of CFSFDP, and a lot of important operating quantities are also defined.
Clustering steps, maximum time complexity and compare of FN-CFSFDP
In this section, the detailed procedures of the proposed FN-CFSFDP algorithm and the definitions of a lot of important operating quantities are described. As stated above, FN-CFSFDP algorithm was proposed based on the framework of CFSFDP algorithm, and the procedures are almost identical to these using CFSFDP. However, the samples for clustering are fuzzy numbers established on fuzzy sets, and many operating quantities mainly including the calculation parameters, kernel function, the distance between fuzzy samples and the threshold of distance are different from those when using CFSFDP. All these operating quantities should be redefined.
Step 1. Initialization and pre-treatment.
Set the parameter for the determination of the threshold (i.e., the cut-off distance)
According to a general method proposed by Rodriguez and Laio in [16], should be set so that the number of mean adjacent samples around each sample accounts for approximately 1.00% 4.00% of total number of samples. Here, the adjacent sample refers to the rest of samples with a distance from the sample of less than . In addition, and the value of should be determined in accordance with specific circumstance.
Calculate the distance between two fuzzy samples ( and ) and set ()
For a sample, if the included information of multiple indexes is described by fuzzy numbers, the sample can be regarded as fuzzy sample. For fuzzy samples under indexes, each fuzzy sample in the fuzzy sample set can be treated as a multi-fuzzy-vector and each element in the vector is a fuzzy number, and accordingly, the -th fuzzy sample can be expressed as . According to the definition as described in Ref. [46], Euclidean distance between the fuzzy numbers of two fuzzy samples ( and ) under the -th index, denoted as and , can be calculated as:
where the domain of discourse ; and denotes the common integral fields of the membership functions of fuzzy numbers and to the fuzzy samples and under the j-th index (). represents the integral field that the membership function of the fuzzy number , denoted as , can be expressed, while represents the integral field that the membership function of the fuzzy number , denoted as , can be expressed. In other words, the membership functions of two fuzzy numbers and in can only be expressed in .
Intuitively, aiming at calculating the distance between two fuzzy samples and , the distance between M fuzzy samples should be separately calculated under N indexes; then, by means of certain operator aggregation, i.e., Eq. (4) can be integrated using the operator , the following expressions can be derived:
In spite of easy understanding, the calculated distance can increase the error. Here, a new distance, named improved Euclidean distance, is defined, which can lead to smaller error. The conclusion will be proved in detail later. Next, the definition of improved Euclidean distance is described. For the domain of discourse , is a bounded interval. For N indexes, it can be determined an interval . Assuming that and represent maximizing and minimizing in Zadeh operator, i.e., and , the range represents the maximum common integral field. In addition, if the common integral fields including P indexes ( is a bilateral unbounded interval or a unilateral unbounded interval, an unbounded interval can be regarded as the unlimited extension of a bounded interval. By taking a bilateral unbounded interval as an example, when and , . For covering all cases, denotes the common integral fields of two fuzzy samples under the j-th index, the improved Euclidean distance between two fuzzy samples ( and , denoted as , can be calculated as:
Equation (6) takes full consideration of the distance between two fuzzy samples ( and ) under indexes, i.e., the distance between finite countable fuzzy numbers.
Next, error analysis is conducted on Eqs (5) and (6). The total error equals to the sum of system error and random error. As regard to Eq. (5), assuming that , and denote total error, system error and random error, respectively, the following expression can be acquired:
For Eq. (6), assuming that , and denote total error, system error and random error, respectively, the following expression can be acquired:
It should be noted that all errors are nonnegative. For comparing and , since random error cannot be artificially controlled and it is assumed that , only and should be compared. Assuming that denotes the error of , in view of the fact that , the common integral field can be denoted as under the j-th index. Apparently, in accordance with the properties of integration, the definite integral values in non-domain regions all equal to 0, i.e., as regard to a single index, the error only exists in the domain of discourse within defined common integral field of the membership function, while the definite integral values in the domains of discourse outside the common integral field are all 0. Accordingly, the following expression can be derived:
It can be easily observed that , and therefore, , which suggests that the calculated error based on improved Euclidean distance as defined in Eq. (6) is smaller than that as defined in Eq. (5). Similarly, it can be proved that . Therefore, the distance between two fuzzy samples is calculated by improved Euclidean distance when using FN-CFSFDP algorithm. After the definition of distance, the threshold value (i.e., the cut-off distance) should be determined.
Determinate the threshold value
According to Eq. (6), the improved Euclidean distances between any two among fuzzy samples under indexes were calculated. On account of and , there exist non-repetitive distances in total. In ascending order, . The following expression are set as:
where and denotes the integer of after rounding off.
Calculate the density of fuzzy samples and generate the subscript sequence in descending order
Next, using Gaussian kernel function, the density of fuzzy samples can be calculated as:
where . After the arrangement of in descending order, .
Calculate the special distance between any two among fuzzy samples and find the corresponding fuzzy sample in accordance with the serial number
The distance set of fuzzy samples is acquired by arranging the distances , according to the descending order of the subscript . can be defined as:
When , denotes the minimum distance between the sample and the samples with greater densities in descending order of density (). It should be noted that denotes improved Euclidean distance. When , if are all calculated, denotes the maximum of (). After are all calculated, a new set is denoted as for the convenience of further calculation since it does not need to sort. and have identical elements. The fuzzy sample corresponding to can be found, and is the serial number of the fuzzy sample among all samples with greater densities in the fuzzy sample set that is closest to .
Step 2. Determination of the serial number of the cluster center , where denotes the fuzzy sample as the center of the -th cluster.
Next, the cluster center, denoted as , can be calculated in accordance with the comprehensive value of and . can be calculated as:
This study also assumes that denotes the cluster where the cluster center is located, denotes the mark symbol and denotes the fact that the -th fuzzy sample in belongs to the -th cluster. The following definition is made:
where represents that the fuzzy sample is the cluster center; represents that the sample belongs to the k-th cluster. If the number of clusters is unknown in advance, the cluster number can be automatically identified based on ; if the number of cluster is required in advance, the corresponding number can be set in accordance with actual condition, i.e., can be set as a positive integer.
Step 3. Classification on the fuzzy samples that are not the cluster centers.
When dealing with a fuzzy sample , if the distances between and the samples with greater densities are identical, should be randomly distributed to the cluster where is located. The classification on the fuzzy samples that are not the cluster centers is traversed in the order of density. Specially, non-center fuzzy samples are more likely to be classified into the cluster with greater density, and therefore, each cluster can be expanded layer by layer with the use of .
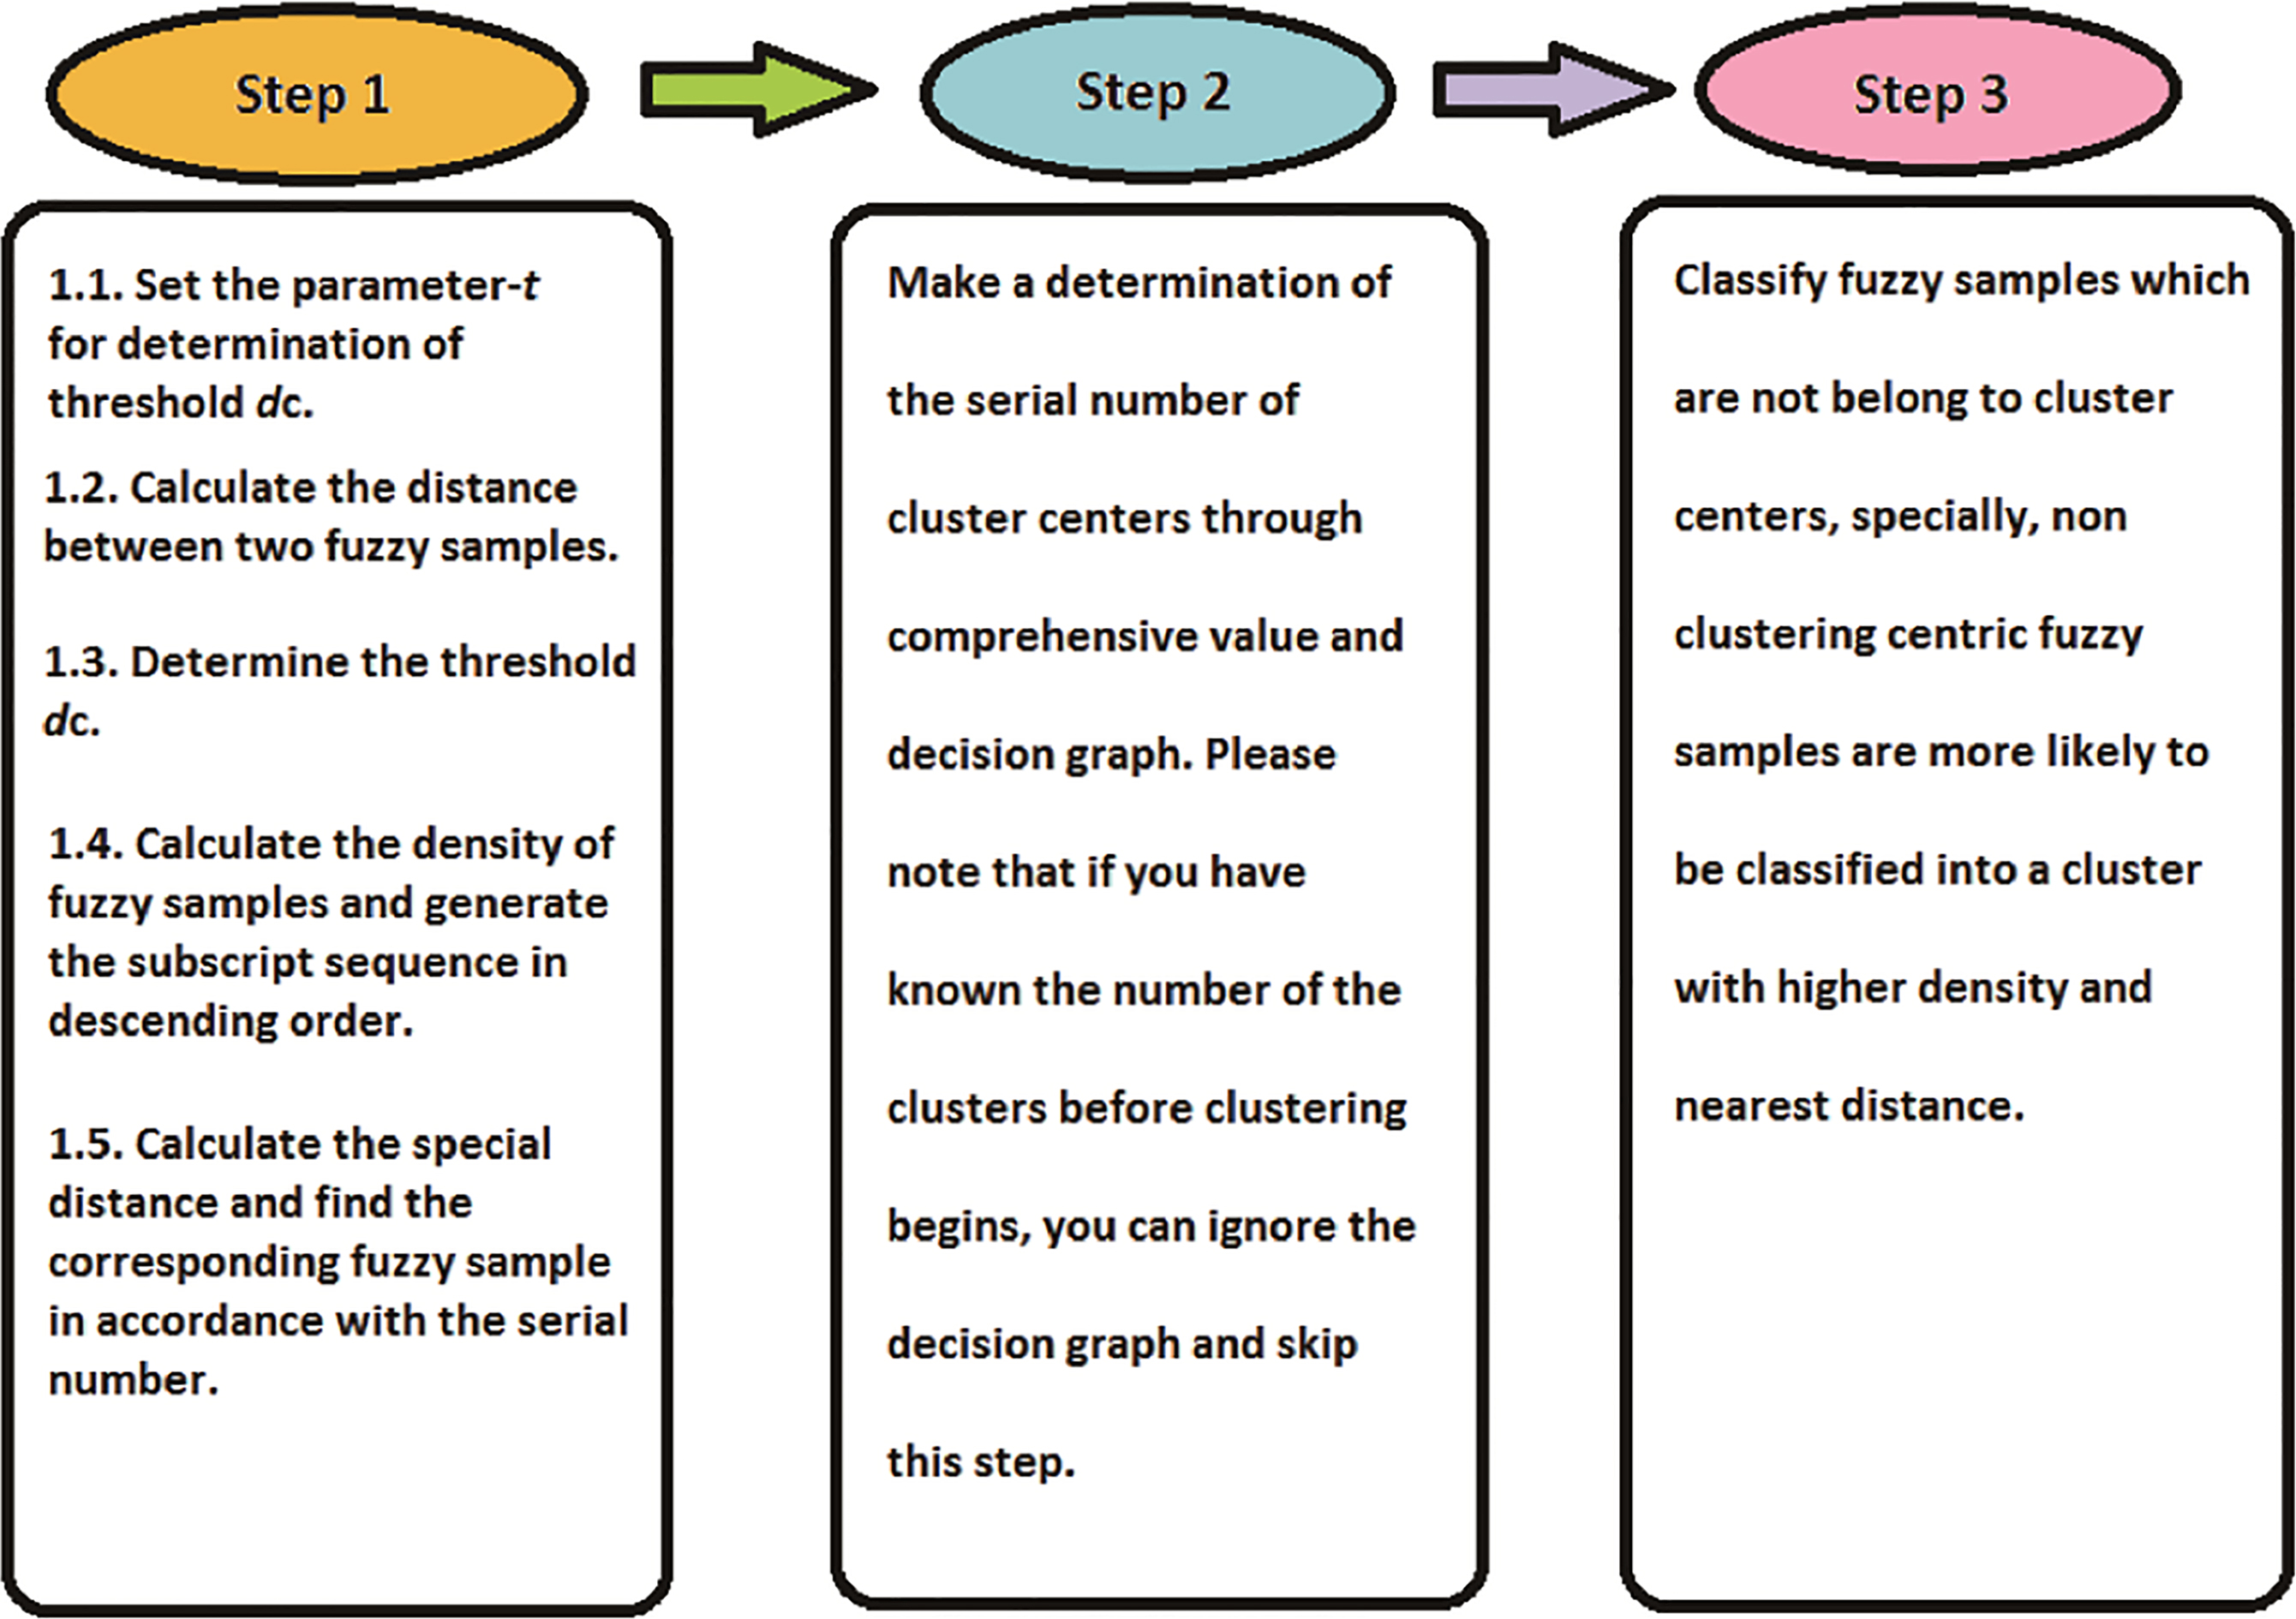
We can use a flowchart to summarize the whole steps of FN-CFSFDP algorithm, as shown in Fig. 2.
Flow chart of clustering steps in FN-CFSFDP algorithm.
To further illustrate the steps of FN-CFSFDP algorithm, we give more detailed pseudo code than front flow chart, as shown in Table 3.
Detailed pseudo code of FN-CFSFDP algorithm
Algorithm: FN-CFSFDP
Input:
// Fuzzy sample set
// -parameters
Output:
// Clustering results of k clusters
1: for each fuzzy sample do
2: for each fuzzy sample do
3: for each fuzzy index do
4: ;
// Calculate all the Improved Euclidian distance
5: end for
6: end for
7: end for
8: for each fuzzy sample do
9: for each fuzzy sample do
10: for each fuzzy index do
11: ;
// Calculate number of non-repetitive distances
12: ;
// Order non-repetitive distances in ascending
13: ;
// Calculate the threshold
14: end for
15: end for
16: end for
17: for each fuzzy sample do
19: for each fuzzy sample do
20: for each fuzzy index do
21: for each fuzzy non-repetitive distances do
22: ;
// Calculate all density of fuzzy samples
23: ;
// Order all densities in descending
24: end for
25: end for
26: end for
27: end for
27: for each fuzzy sample do
28: for each fuzzy sample do
29: for each fuzzy index do
30: for each descending ordered subscript do
31: ;
// Calculate all special distance of fuzzy samples
32: end for
33: end for
34: end for
35: end for
36: for each fuzzy sample do
37: ;
// Calculate all comprehensive values of
38: end for
39: for each fuzzy sample do
40: ;
// Clustering and marking cluster centers
41: ;
// Classifying samples from non-clustering centers
42: end for
Consider the algorithm with the least efficiency, we can analyze the maximum time complexity of FN-CFSFDP algorithm. Input M fuzzy samples in turn, repeating execute M times, the maximum time complexity of this step is ; Maximum time complexity of input -parameter is ; is calculated in three layers-loop statement, two layers for choosing any two fuzzy samples, another layer for choosing any index, therefore, the maximum time complexity of is ; The maximum time complexity for calculating number of non-repetitive distances is ; Ordering non-repetitive distances in ascending needs a maximum time complexity of for different sort orders. Sort (*) function is used in the R language to sort, no matter what sorting method the Sort (*) function uses, the maximum time complexity of any sort will not exceed , therefore, the maximum time complexity of this step is ; Calculating threshold requires and -parameters, because both two have been worked out in the previous steps, and no need to recalculate, so we can get directly. The maximum time complexity of this step is ; if we calculate fuzzy density separately, it needs four layers-loop statement. Fortunately, three layers-loop for calculating have been worked out in previous clustering steps and need not recalculate, at this time, only one layer-loop of fuzzy non-repetitive distances is needed. In this case, the maximum time complexity of this step is , and represents number of non-repetitive distances; After calculating density, a descending order is also made according to the density as , and still consider the worst case, the maximum time complexity of this step is ; Similarly, calculation of the special distance needs labels in accordance with the serial number after the density descending order, however, the descending order has been worked out in previous clustering steps and no necessary be repeated. There is only one-layer loop statement in this step, so the maximum time complexity is ; The calculation of comprehensive values requires and , and both of them have been worked out in the previous steps, also there is no need for loop statement, so the maximum time complexity of is ; ‘Classifying samples from non-clustering centers’ is a process of classifying non-clustering centric fuzzy samples into fuzzy clusters by samples with larger density than non-clustering centric fuzzy samples and nearest distance between them. The process involves sorting of density and distance which have been worked out in previous steps, so there is no requirement of resorting them. And only one layer-loop statement in this step, therefore, the maximum time complexity is . We list the maximum time complexity of key parameters and steps in FN-CFSFDP, as shown in Table 4.
Maximum time complexity of key parameters and steps
Key parameters and steps
Maximum time complexity
Classifying fuzzy samples from non-clustering centers
Because the whole FN-CFSFDP algorithm is executed in sequential structure, so the maximum time complexity of FN-CFSFDP algorithm is . We can also compare the similarities and differences between the two algorithms of FN-CFSFDP and CFSFDP, as shown in Table 5.
Comparison between FN-CFSFDP algorithm and CFSFDP algorithm
Algorithm name
FN-CFSFDP
CFSFDP
Object type
Fuzzy numerical type
Numerical type
Object state
Fuzzy uncertainty
Definite
Object shape
Uncertain fuzzy
Definite classic with any shapes
Mathematical basis
Fuzzy set theory
Classic set theory
Membership between objects and clusters
Belong to or not, two-valued logic
Belong to or not, two-valued logic
Ability to deal with high-dimensional data
Good
Good
Clustering measure
Improved Euclidian distance
Distance or similarity degree
Threshold
Related to -parameters
Related to -parameters
Time complexity (maximum)
After all procedures of the proposed FN-CFSFDP algorithm were introduced, random simulation is then performed on several sets of data for validating the effectiveness of the proposed FN-CFSFDP algorithm.
Random simulation, evaluation of parameter adaptability and clustering stability
Since the membership functions of some commonly-used triangular and trapezoidal fuzzy numbers are all piecewise functions, the improved Euclidean distances should be piecewise calculated. In order to reduce the calculation amount, this study assumes that the information under each index can be described by normal fuzzy numbers, and therefore, the fuzzy samples are normal fuzzy samples. For normal fuzzy samples under indexes, each fuzzy sample in the normal fuzzy sample set can be treated as a multivariate normal fuzzy vector or a multivariate normal fuzzy point . This study also assumes that the information of any a normal fuzzy sample under any an index can be described by normal fuzzy numbers. For and , the related expression can be written as , and the corresponding membership function is . For the domain of discourse , the membership function can be described as:
where and are two parameters of the membership function . A normal fuzzy number can be determined after and are determined. This is necessary for the generation of normal fuzzy numbers in simulation. The parameters can be acquired by many means. The method of acquiring parameters or relevant information required in the simulation is generally defined as fetching rule. The related rule can be arbitrarily specified in accordance with personal preference, which can also be set as random generation. In this study, by means of random generation, the fetching rule follows random probability distribution for generating random numbers.
In the first set of simulation, 200 normal fuzzy samples were used and each sample includes two indexes – Index A and Index B, i.e., 200 and 2. These samples were artificially divided into two clusters in advance, i.e., 2, 4.00%. The first 100 samples are in a cluster; the parameters and in the membership function corresponding to the first index are from two normal distributions ( and ), while the parameters and in the membership function corresponding to the second index are from two normal distributions () and ). The rest 100 samples are in the other cluster; the parameters and in the membership function corresponding to the first index are from two normal distributions () and ), while the parameters and in the membership function corresponding to the second index are from two normal distributions ( and ). Here, the distribution can be arbitrarily set since it only represents a kind of fetching rule. Table 6 lists the relevant information in the first set of simulation, in which R denotes the fetching rule and T denotes the parameter type.
Relevant information in the first set of simulation
200
Index
2
Index A
Index B
2
Normal fuzzy numbers
Normal fuzzy numbers
4.00%
Cluster 1
T
R
Cluster 2
T
R
Domain of discourse
The second set of simulation includes 300 normal fuzzy samples in total ( 300), in which each sample has three indexes ( 3), namely, Index E, Index F and Index G. These 300 samples were first artificially divided into three clusters ( 3). Let -parameter equals to 3.00%. The first 100 samples are in a cluster; the parameters and in the membership function corresponding to the first index are described by two normal distributions ( and , the parameters and in the membership function corresponding to the second index are described by two normal distributions ( and , and the parameters and in the membership function corresponding to the third index are described by two normal distributions ( and . The middle 100 samples are in another cluster; the parameters and in the membership function corresponding to the first index are described by two normal distributions ( and , the parameters and in the membership function corresponding to the second index are described by two normal distributions ( and , and the parameters and in the membership function corresponding to the third index are described by two normal distributions ( and . The rest samples are in another cluster; the parameters and in the membership function corresponding to the first index are described by two normal distributions ( and , the parameters and in the membership function corresponding to the second index are described by two normal distributions ( and , and the parameters and in the membership function corresponding to the third index are described by two normal distributions ( and . Table 7 lists the relevant information in the second set of random simulation, in which R denotes the fetching rule and T denotes the parameter type. For simplifying the expression, and denote the fetching rules of and in the membership function corresponding to the normal fuzzy number in the -th cluster under the -th index, respectively, where and .
Relevant information in the second set of simulation
300
Index
3
Index E
Index F
Index G
3
Normal fuzzy numbers
Normal fuzzy numbers
Normal fuzzy numbers
3.00%
Cluster 1
T
R
Cluster 2
T
R
Cluster 3
T
R
Domain of discourse
It should be noted that Table 7 is similar to Table 6 in terms of content, which is only listed for comparison of the simulation information. According to above-described clustering procedures, the programs were compiled with R language for clustering. In accordance with the definition proposed by Al-Shammary [47], clustering accuracy on the data set using the algorithm can be calculated as:
where denotes the number of real classes of the dataset, denotes the number of samples that are accurately classified in the -th class and denotes the number of samples in the data set. A greater is indicative of more favorable clustering performance. Table 8 lists the related clustering parameters and results.
Clustering parameters and results
(%)
Clustering accuracy (%)
The first set of simulation
4.00
1.3710
74.00
The second set of simulation
3.00
8.4610
44.00
The clustering accuracy of the first set of samples reaches up to 74.00% while the clustering accuracy in the second set of simulation is only 44.00%. Apparently, the clustering performance in the first set of simulation is superior to that in the second set of simulation. Because of random fetching rule, clustering accuracy may fluctuate to certain degree. Next, the fetching rule can be changed so as to perform random simulations under different fetching rules.
In the third set of simulation, 300 normal fuzzy samples were used ( 300) and each sample include three indexes ( 3), namely, Index H, Index V and Index W. The first 100 samples are in a cluster, while the parameters and in the membership function corresponding to the three indexes are described by two normal distributions and . The middle 100 samples are in another cluster, while the parameters and in the membership function corresponding to the three indexes follow the exponential distributions and . The rest 100 samples are in another cluster, while the parameters and in the membership function corresponding to the three indexes follow the uniform distributions and . Table 9 lists the corresponding information in the third set of simulation, in which R and T denotes the fetching rule and parameter type, respectively.
Relevant information in the third set of simulation
300
Index
3
Index H
Index V
Index W
3
Normal fuzzy numbers
Normal fuzzy numbers
Normal fuzzy numbers
1.00%, 2.00%, 3.00%, 4.00%
Cluster 1
T
R
Cluster 2
T
R
Cluster 3
T
R
Domain of discourse
According to above information, the parameters were set as follows: 1.00%, 2.00%, 3.00% and 4.00%. Four simulations in total were conducted on the third set of samples, and the related clustering accuracy and Kappa coefficient were calculated [48]. After rounding off, the values of and clustering accuracy were corrected to two decimal places, and values of Kappa coefficient were corrected to four decimal places, as shown in Table 10.
Clustering parameters and results
(%)
Clustering accuracy (%)
Kappa coefficient
1.00
0.55
71.67
0.5750
2.00
0.62
71.67
0.5750
3.00
0.67
71.00
0.5650
4.00
0.71
71.00
0.5650
It can be observed from Table 10 that the clustering accuracy reaches 71.67% at 1.00% and 2.00%, and the clustering accuracy reaches 71.00% at 3.00% and 4.00%. Apparently, the value of can affect the clustering accuracy. In this study, Kappa coefficient was introduced for evaluating the clustering performance. According to the evaluation criterion proposed by Landis and Koch [49], Kappa coefficient can be classified into 6 levels so as to accurately access clustering consistency. Table 11 lists the evaluation criterion based on the calculated Kappa coefficient.
Evaluation criterion based on Kappa coefficient
Kappa coefficient
Non-accidental consistency degree
0.00
Poor
0.00 0.20
Slight
0.21 0.40
Fair
0.41 0.60
Moderate
0.61 0.80
Substantial
0.81 1.00
Almost perfect
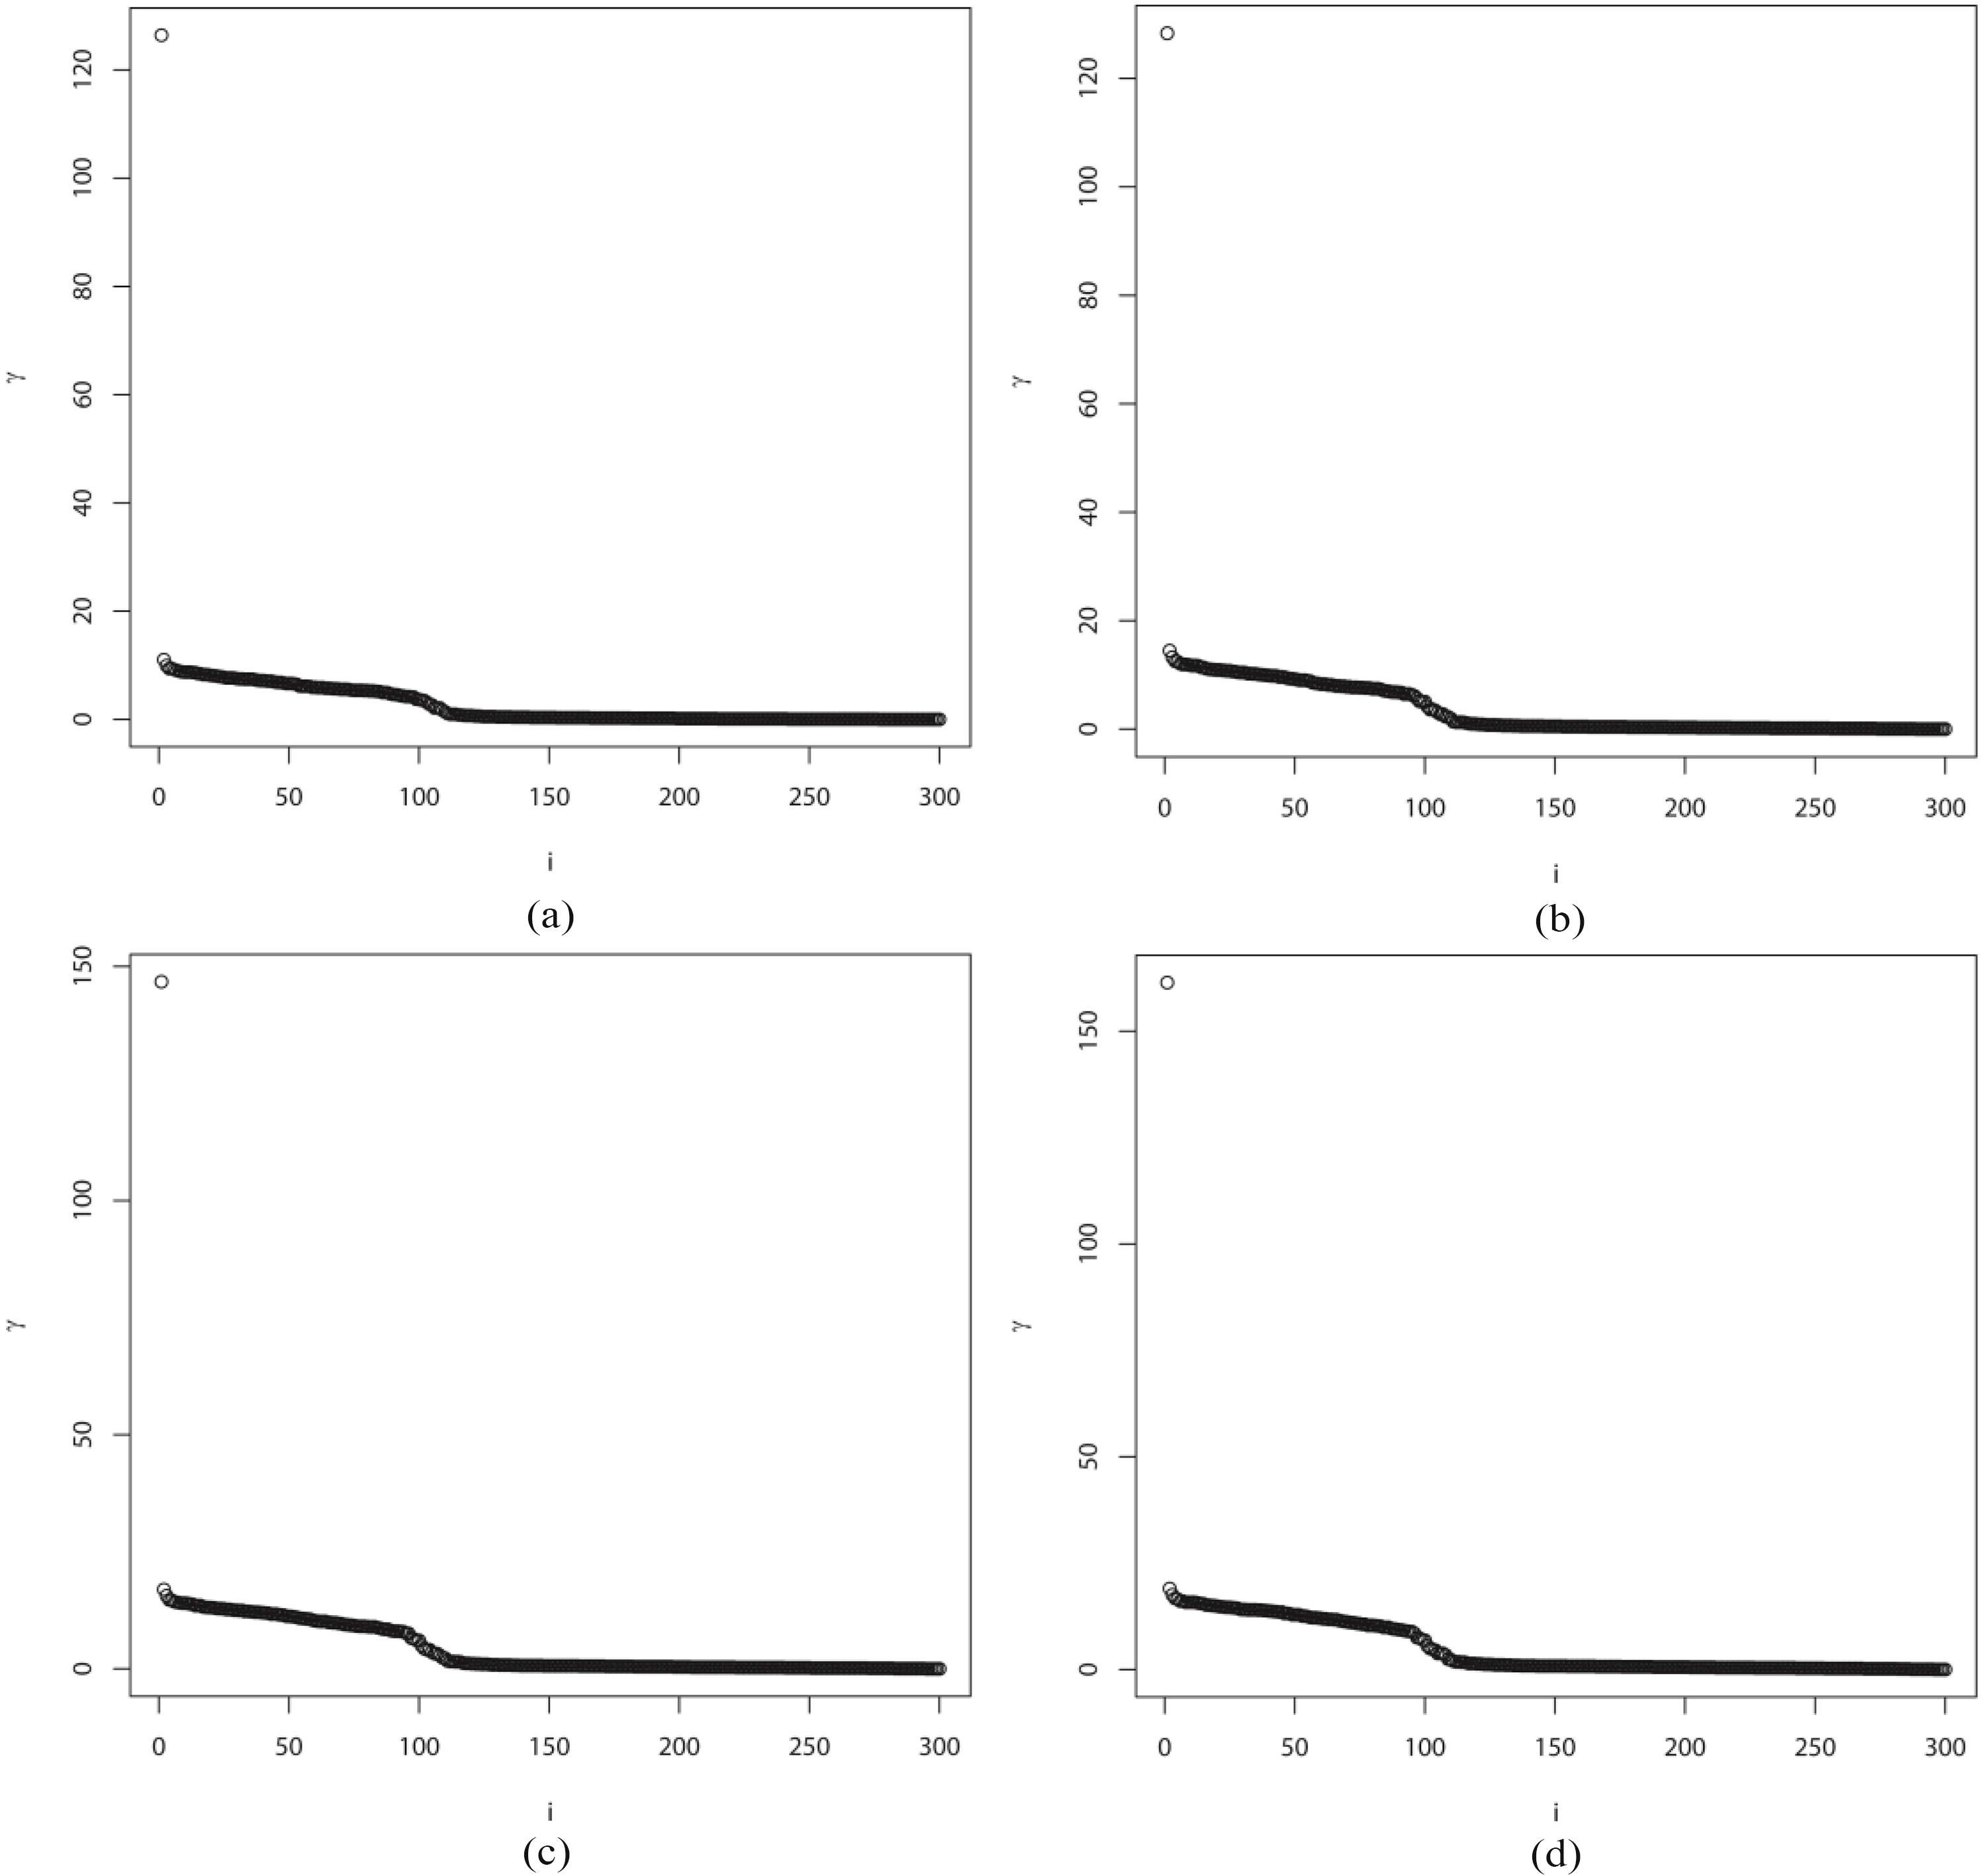
According to above evaluation criterion based on the calculated Kappa coefficient, the clustering performances when was set as different values were moderate. The clustering is not poor; unfortunately, the clustering performance doesn’t reach the level of ‘Substantial’ or ‘Almost Perfect’. The reason why Kappa coefficients not the best level is that FN-CFSFDP algorithm has extended the classical clustering objects to the fuzzy numbers on fuzzy sets. Regardless of the concept of fuzzy number, the question will be analyzed simply form the perspective of calculation. Although 300 fuzzy samples were used in the third set of random simulation, the fuzzy numbers corresponding to each index in any fuzzy samples have infinite states when using FN-CFSFDP. If all states were taken into account, each one in 900 fuzzy numbers of 300 fuzzy samples under 3 indexes includes infinite amount of information. Under such huge amount of information, moderate clustering consistency is not easy. On the other hand, it can be found that automatic identification method of cluster number when using CFSFDP fails when using FN-CFSFDP. In this study, the variation of was plotted. Under four different parameters, the variation curves of exhibit similar tendency and only one obvious jump point, as shown in Fig. 3, in which denotes the number of .
Decision graph under different -parameters. a. Decision graph under 1.00%. b. Decision graph under 2.00%. c. Decision graph under 3.00%. d. Decision graph under 4.00%.
As shown in Fig. 3, only a jump point can be easily observed. Using CFSFDP, the number of clusters can be automatically identified in accordance with the number of the jump points of . Following this rule, only a cluster can be found in the clustering results. Because of small , the calculated based on is also small and the density peak is small; therefore, for the identification of cluster number is also small. Only a great jump point can be observed, and the values of corresponding to the rest samples exhibit slight difference. Accordingly, the other jump points cannot be observed by naked eyes. CFSFDP has certain shortcomings in automatically identifying the number of clusters. It is a pity that this problem has not been successfully addressed using FN-CFSFDP algorithm, which is expected to be improved in further studies.
In order to further verify the effectiveness of FN-CFSFDP algorithm, we still follow the fetching rules, fuzzy number types, number of samples, number of index and specified number of clusters in the third set of simulation (as shown in Table 6). On the other hand, because in previous three sets of simulations, t-parameters were only integers. In order to make the granularity of -parameters smaller and make FN-CFSFDP algorithm more diversified, in this set of simulation, we extend the range of -parameters as follows: 1.00%, 1.50%, 2.00%, 2.50%, 3.00%, 3.50% and 4.00%. On this basis, there are 10 groups of random simulated fuzzy datasets in total. Each group under different -parameters was carried out 7 times. We calculate clustering accuracy and kappa coefficient of each random simulated result. Moreover, mean value of clustering accuracies, variance of clustering accuracies, mean value of kappa coefficients, and variance of kappa coefficients are calculated out in different -parameters, and the result is shown in Table 12 (including Table 12(a) to (g)). SNFD represents ‘Serial Number of Fuzzy Datasets’; CA represents ‘Clustering Accuracy’; MCA represents ‘Mean of Clustering Accuracy’; VCA represents ‘Variance of Clustering Accuracy’; KC represents ‘Kappa Coefficient’; MKC represents ‘Mean of Kappa Coefficient’; VKC represents ‘Variance of Kappa Coefficient’.
Clustering in 10 fuzzy datasets under different 7 -parameters
Through the above results in sub tables, the highest clustering accuracy is 79.00%, and the lowest is 34.33% in 70 random simulation tests; When 1.00%, the average clustering accuracy is the highest, which equals 65.07%; When 3.00%, the average clustering accuracy is the lowest, which equals 57.30%; When 1.00%, the variance of clustering accuracy is the lowest, which equals 155.800, and clustering accuracy is the most stable; When 1.50%, the variance of clustering accuracy is the highest, which equals 239.623, and clustering accuracy is the most unstable. On the other hand, the maximum Kappa coefficient is 0.6850, and the minimum is 0.0150 in 70 random simulation tests; When 1.00%, the average Kappa coefficient is the maximum, which equals 0.4760 and achieves a moderate non-accidental consistency degree. It makes clear that clustering effect of algorithm is moderate under non-accidental condition; When 3.00%, the average Kappa coefficient is the minimum, which equals 0.3595 and achieves a fair non-accidental consistency degree. It makes clear that clustering effect of algorithm is fair under non-accidental condition; When 1.00%, the variance of Kappa coefficient is the lowest, which equals 0.0350 and makes clear that clustering effect of algorithm is most stable under non-accidental condition; When 1.50%, the variance of Kappa coefficient is the highest, which equals 0.0567 and makes clear that clustering effect of algorithm is most unstable under non-accidental condition. Besides, according to the results of random simulation, for same fuzzy datasets, we can find that different -parameters do not necessarily lead to different clustering accuracies and Kappa coefficients. In addition, we also calculated mean of clustering accuracy for each fuzzy dataset and mean of Kappa coefficient for each fuzzy dataset under 7 -parameters, as shown in Table 13 (including Table 13(a) to (j)). SNFD represents ‘Serial Number of Fuzzy Datasets’; CA represents ‘Clustering Accuracy’; KC represents ‘Kappa Coefficient’. MCAFD represents ‘Mean of Clustering Accuracy for Fuzzy Datasets’; MKCFD represents ‘Mean of Kappa Coefficient for Fuzzy Datasets’; MKCECP represents ‘Mean of Kappa Coefficient-Evaluation of Clustering Performance’ (Refer to the evaluation standard in Table 11).
Different 7 -parameters in 10 fuzzy datasets
SNFD
(%)
CA (%)
MCAFD (%)
KC
MKCFD
MKCECP
(a) First fuzzy datasets with different 7 -parameters
1
1.00
53.67
63.67
0.3050
0.4550
Moderate
1.50
53.67
0.3050
2.00
67.76
0.5150
2.50
67.76
0.5150
3.00
67.76
0.5150
3.50
67.76
0.5150
4.00
67.76
0.5150
(b) Second fuzzy datasets with different 7 -parameters
2
1.00
79.00
58.62
0.6850
05486
Moderate
1.50
79.00
0.6850
2.00
79.00
0.6850
2.50
79.00
0.6850
3.00
56.00
0.3400
3.50
58.67
0.3800
4.00
58.67
0.3800
(c) Third fuzzy datasets with different 7 -parameters
3
1.00
50.00
53.95
0.2500
0.3093
Fair
1.50
49.00
0.2350
2.00
52.67
0.2900
2.50
52.67
0.2900
3.00
52.33
0.2850
3.50
52.33
0.2850
4.00
68.67
0.5300
(d) Fourth fuzzy datasets with different 7 -parameters
4
1.00
45.00
45.00
0.1750
0.1750
Slight
1.50
45.00
0.1750
2.00
45.00
0.1750
2.50
45.00
0.1750
3.00
45.00
0.1750
3.50
45.00
0.1750
4.00
45.00
0.1750
(e) Fifth fuzzy datasets with different 7 -parameters
5
1.00
70.67
67.90
0.5600
0.5186
Moderate
1.50
71.67
0.5750
2.00
66.33
0.4950
2.50
67.00
0.5050
3.00
67.00
0.5050
3.50
66.33
0.4950
4.00
66.33
0.4950
(f) Sixth fuzzy datasets with different 7 -parameters
6
1.00
70.00
71.71
0.5500
0.5757
Moderate
1.50
72.00
0.5800
2.00
72.00
0.5800
2.50
72.00
0.5800
3.00
72.00
0.5800
3.50
72.00
0.5800
4.00
72.00
0.5800
(g) Seventh fuzzy datasets with different 7 -parameters
(g) Seventh classical datasets with different 7 -parameters
7
3.00
67.00
65.29
0.5050
0.4836
Moderate
3.50
67.00
0.5050
4.00
67.00
0.5050
(h) Eighth classical datasets with different 7 -parameters
8
1.00
53.33
66.81
0.3000
0.5021
Moderate
1.50
55.00
0.3250
2.00
55.00
0.3250
2.50
83.33
0.7500
3.00
79.67
0.6950
3.50
70.67
0.5600
4.00
70.67
0.5600
(i) Ninth classical datasets with different 7 -parameters
9
1.00
100.00
100.00
1.0000
1.0000
Almost perfect
1.50
100.00
1.0000
2.00
100.00
1.0000
2.50
100.00
1.0000
3.00
100.00
1.0000
3.50
100.00
1.0000
4.00
100.00
1.0000
(j) Tenth classical datasets with different 7 -parameters
10
1.00
65.00
90.00
0.4750
0.8500
Almost perfect
1.50
65.00
0.4750
2.00
100.00
1.0000
2.50
100.00
1.0000
3.00
100.00
1.0000
3.50
100.00
1.0000
4.00
100.00
1.0000
As shown in sub tables of Table 13, in the 10th group of datasets, the maximum mean-clustering accuracy is equal to 75.67%; In the 7th group of datasets, the minimum mean-clustering accuracy is equal to 40.19%; In the 10th group of datasets, the maximum mean-kappa coefficient is equal to 0.6350; In the 7th group of datasets, the minimum mean-kappa coefficient is equal to 0.1029. In some datasets, different values have little or no effect on the clustering accuracy and Kappa coefficient. Therefore it can also indirectly illustrate that FN-CFSFDP algorithm has certain parameter adaptability and clustering stability. If a clustering algorithm clusters one dataset under different values of one parameter, and different clustering results are obtained for the same one dataset, this only shows that the algorithm is very sensitive to this parameter. This sensitivity will affect the application of algorithm and cause a certain extent of clustering instability. Conversely, when a parameter changes its value, clustering accuracy and kappa coefficient just change a little, or no change at all, this phenomenon shows that the clustering algorithm is not sensitive to the change of parameter under the same datasets. Parameters will not affect or even affect the results of clustering in this state. CFSFDP algorithm has better clustering stability and parameter adaptability itself, and FN-CFSFDP algorithm has this advantage too.
For further comparison, from aspects of clustering accuracy and kappa coefficient, we make an experimental comparison between FN-CFSFDP algorithm and original CFSFDP algorithm in document [16]. Because the simulation for FN-CFSFDP algorithm uses normal fuzzy numbers, but the clustering objects are classical data for original CFSFDP algorithm with great difference, in this case, we are willing to reduce differences but unable to create an identical simulation. Thus, only the experimental background can be as close as possible, for example, fetching rules, sample size, index size, etc. We still referring to experimental background of the third simulation, and also installing the following simulation background: 300 samples, 3 indexes, 3 appointed clusters with 100 samples each cluster and several fetching rules. The first 100 samples in 3 indexes generated by normal distribution . The middle 100 samples in 3 indexes generated by exponential distribution . The last 100 samples in 3 indexes generated by uniform distribution . Similar to the fourth set of simulations, a total of 10 classical datasets are generated randomly, each classical dataset will be clustered one time separately in different -parameters as follows: 1.00%, 1.50%, 2.00%, 2.50%, 3.00%, 3.50% and 4.00%. After clustering, we calculate clustering accuracy for per clustering, kappa coefficient, mean of clustering and mean of kappa, using Euclidean distance as a measurement, the results as shown in Table 14 (including Table 14(a) to (j)). SNCD represents ‘Serial Number of Classical Datasets’; CA represents ‘Clustering Accuracy’; KC represents ‘Kappa Coefficient’. MCACD represents ‘Mean of Clustering Accuracy for Classical Datasets’; MKCCD represents ‘Mean of Kappa Coefficient for Classical Datasets’; MKCECP represents ‘Mean of Kappa Coefficient-Evaluation of Clustering Performance’ (Refer to the evaluation standard in Table 11).
Comparing the results of Table 14 with Table 13, obviously, the clustering accuracy and kappa coefficient of FN-CFSFDP algorithm are lower than those of CFSFDP algorithm overall. This is because FN-CFSFDP algorithm applies to continuous fuzzy numbers, especially normal fuzzy numbers in random simulation. Each fuzzy number has multiple states, as continuous fuzzy numbers, each normal fuzzy numbers contains infinite states, every state as a form of classical number (it is a fuzzy number essentially) and participate in the definite integral computation of improved Euclidian distance. Relative to fuzzy numbers, one classical number has just one classical state itself, in this case, the amount of information involved in classical computation is much less than that of fuzzy computation. Meanwhile, there is no definite integral computation in original Euclidian distance, comparatively, the classical calculation is much simpler and smaller error.
Back to the topic of parameter adaptability and clustering stability for FN-CFSFDP algorithm, we can also formulate a set of standard for evaluating parameter adaptability and clustering stability to quantify the degree of both. Let be the clustering accuracy of -th clustering under -th datasets and -parameter. Suppose that the -th datasets is clustered times, and represents number of which appearing in times clustering, define the expression , which satisfies:
. Similarly, let be the Kappa coefficient of -th clustering under -th datasets and -parameter. Suppose that the -th datasets is clustered times, and represents number of which appearing in times clustering, define the expression , which satisfies:
. The comprehensive efficacy function of parameter adaptability and clustering stability of -th datasets under -parameter is defined as:
Obviously, satisfies . The quantitative evaluation of parameter adaptability and clustering stability can be carried out according to the value of , as shown in Table 15.
Values of comprehensive efficacy function and evaluating standard
Value of comprehensive efficacy function
Evaluating standard
0.00 0.33
Poor
0.34 0.66
Moderate
0.67 0.99
Strong
1.00
Almost perfect
Evaluating results for 10 fuzzy datasets
SNFD
VCEF
CER
1
0.7143
Strong
2
0.5714
Moderate
3
0.2857
Poor
4
1.0000
Almost perfect
5
0.4286
Moderate
6
0.8571
Strong
7
0.8571
Strong
8
0.2857
Poor
9
0.5714
Moderate
10
1.0000
Almost perfect
This is just an original evaluation standard, not an axiom. Actually, different evaluation standards can also be formulated according to specific problems and needs. According to the above evaluation standard, for 10 groups of fuzzy datasets, comprehensive evaluation results of parameter adaptability and clustering stability are shown in Table 16. SNFD represents ‘Serial Number of Fuzzy Datasets’; VCEF represents ‘Value of Comprehensive Efficacy Function’; CER represents ‘Comprehensive Evaluating Result’.
Thus, the geometric mean of 10 groups of fuzzy datasets is 0.5995, and arithmetic mean is 0.6571. Comprehensive average level for Parameter adaptability and clustering stability of 10 groups of fuzzy datasets is moderate. On this basis, it is reasonable to consider that FN-CFSFDP algorithm has certain parameter adaptability and clustering stability. If we can make the number of -parameter greater than or equal to 30 and the number of datasets greater than or equal to 30, that is, both two satisfy the large sample condition of statistics, the results of comprehensive evaluation will be more credible.
Conclusions and prospects
For satisfying the clustering requirements on the samples with fuzzy information, this paper proposed a novel clustering algorithm for fuzzy numbers on fuzzy set by retaining the advantages of CFSFDP. However, there still exist two shortcomings in FN-CFSFDP algorithm. Firstly, using FN-CFSFDP algorithm, the samples are fuzzy numbers established on fuzzy set, but the membership between sample and cluster still performs clustering and classification in classical mathematical way. In fuzzy mathematics, the calculations among multiple fuzzy sets or fuzzy numbers mainly including fuzzy close degree, fuzzy degree and fuzzy distance transforms from fuzzy to classical, and finally, the calculated results are classical values. Although above transformation is reasonable in fuzzy mathematics, a certain amount of information may be lost. In addition, samples generally include infinite information, which may lead to the decline in clustering accuracy to certain degree compared with the results using CFSFDP. Secondly, the shortcoming in automatic identification of cluster number using CFSFDP has yet to adequately addressed when using FN-CFDFDP algorithm. In view of the above shortcomings, further improvements can be attempted as the following two aspects. On the one hand, the relation between sample and cluster can be defined on fuzzy set, and developing FCM clustering algorithm on fuzzy numbers so that both samples and memberships can be established on fuzzy sets, which can may reduce the loss of information. Secondly, the identification of geometrical images by naked eyes should be abandoned and a novel quantitative mathematical method should be formulated, so that even tiny difference can be identified using mathematical method.
Overall, the greatest contribution in this study is to extend the clustering objects in classical sets to fuzzy sets, which can provide direction for further investigating clustering problems on fuzzy sets.
References
1.
HanJ.W.KamberM. and PeiJ., Clustering analysis, in: Data Mining: Concept and Technique, MK imprint of Elsevier, New York, 2012, pp. 478–490.
2.
MacqueenJ., On convergence of K-means and partitions with minimum average variance, Annals of Mathematical Statistics36(3) (1965), 1084–1084.
3.
KuangL. and ZhangL.C., A scheduling algorithm based on CLARA clustering, in: Proceedings of the International Conference on Green Energy and Sustainable Development, 2017, pp. 1–7.
4.
NgR.T. and HanJ.W., CLARANS: a method for clustering objects for spatial data mining, IEEE Transactions on Knowledge and Data Engineering14(5) (2002), 1003–1016.
5.
BarniM.CappelliniV. and MecocciA., A possibilistic approach to clustering-comments, IEEE Transactions on Fuzzy Systems4(3) (1996), 393–396.
MaR.N.WangX.L. and DingJ.D., Multilevel core-sets based aggregation clustering algorithm, Journal of Software24(3) (2013), 490–506.
8.
GuhaS.RastogiR. and ShimK., Rock: a robust clustering algorithm for categorical attributes, Information Systems25(5) (2000), 345–366.
9.
WilcoxH. et al., Simulation tests of galaxy cluster constraints on chameleon gravity, Monthly Notices of the Royal Astronomical Society462(1) (2016), 715–725.
10.
StratmanB. et al., Identification of critical inspection samples among railroad wheels by similarity-based agglomerative clustering, Integrated Computer-Aided Engineering18(3) (2011), 203–219.
11.
LorbeerB. et al., Variations on the clustering algorithm BIRCH, Big Data Research11 (2018), 44–53.
12.
LinY. et al., Application of B-KFCM algorithm in the clustering of load in substations, in: Proceedings of the International Conference on Electrical and Electronic Engineering, 2014, pp. 51–56.
13.
BenmouizaK. and CheknaneA., Density-based spatial clustering of application with noise algorithm for the classification of solar, in: Proceedings of 2016 8th International Conference on Modelling, Identification & Control, 2016, pp. 279–283.
14.
KanagalaH.K. and KrishnaiahV.V.J.R., A comparative study of K-means, DBSCAN and OPTICS, in: Proceedings of 2016 International Conference on Computer Communication and Informatics, 2016.
15.
TerrazasG. and KrasnogorN., A genotype-phenotype-fitness assessment protocol for evolutionary self-assembly wang tiles design, Memetic Computing5(1) (2013), 19–33.
16.
RodriguezA. and LaioA., Clustering by fast search and find of density peaks, Science344(6191) (2014), 1492–1496.
17.
RoyP. and MandalJ.K., A delaunay triangulation preprocessing based fuzzy-encroachment graph clustering for large scale GIS, in: Proceedings of 2012 International Symposium on Electronic System Design, 2012, pp. 300–305.
18.
BuZ. et al., CAMAS: a cluster-aware multiagent system for attributed graph clustering, Information Fusion37 (2017), 10–21.
19.
ZakiM.J. et al., CLICKS: an effective algorithm for mining subspace clusters in categorical datasets, Data & Knowledge Engineering60(1) (2007), 51–70.
20.
AghabozorgiS. et al., A hybrid algorithm for clustering of time series data based on affinity search technique, Scientific World Journal (2014), 1–12.
21.
DatN.D. et al., Sting algorithm used English sentiment classification in a parallel environment, International Journal of Pattern Recognition and Artificial Intelligence31(7) (2017), 1–30.
22.
SheikholeslamiG.ChatterjeeS. and ZhangA.D., WaveCluster: a wavelet-based clustering approach for spatial data in very large databases, VLDB Journal8(3-4) (2000), 289–304.
23.
ChrobakM.DurrC. and NilssonB.J., Competitive strategies for online CLIQUE clustering, in: Proceedings of 9th International Conference of Algorithms and Complexity, 2015, pp. 101–113.
24.
LiM.HolmesG. and PfahringerB., Clustering large datasets using Cobweb and K-means in tandem, in: Proceedings of 17th Annual Australian Conference on Artificial Intelligence, 2004, pp. 368–379.
25.
ZanderS.NguyenT. and ArmitageG., Automated traffic classification and application identification using machine learning, in: Proceedings of the 2005 IEEE Conference on Local Computer Networks, 2005.
XuR. and WunschD., Survey of clustering algorithms, IEEE Transactions on Neural Networks16(3) (2005), 645–678.
28.
ZhangX.C., Data Clustering, Science Press, Beijing, 2017, 1–388.
29.
ZadehL.A., Fuzzy sets, Information and Control8(3) (1965), 338–353.
30.
ChenS.L.LiJ.G. and WangX.G., in: Fuzzy sets and membership function, in: The Theory of Fuzzy Sets and Its Application, Science Press, Beijing, 2005, pp. 1–3.
31.
RuspiniE.H., A new approach to clustering, Information and Control15(1) (1969), 22–32.
32.
DunnJ.C., A fuzzy relative of the ISODATA process and its use in detecting compact well-separated clusters, Journal of Cybernetics3(3) (1974), 32–57.
33.
BezdekJ.C., Cluster validity, in: Pattern Recognition With Fuzzy Objective Function Algorithms, Plenum Press, New York, 1981, pp. 95–154.
34.
KrishnapuramR. and KellerJ.M., A possibilistic means algorithms, IEEE Trans on Fuzzy Systems1(2) (1993), 98–110.
35.
PalN.R. et al., A possibilistic fuzzy c-means clustering algorithm, Journal of Cybernetics3(3) (1974), 32–57.
36.
YangM.S. and WuK.L., Unsupervised possibilistic clustering, Pattern Recognition39(1) (2006), 5–21.
37.
ZhangJ.S. and LeungY.W., Improved possibilistic C-means clustering algorithms, IEEE Trans on Fuzzy Systems12(2) (2004), 209–217.
38.
KriegelH.P. and PfeifleM., Density-based clustering of uncertain data, in: Proceedings of the 11th ACM SIGKDD international Conference on Knowledge Discovery in Data Mining, 2005, pp. 672–677.
39.
TepwankulA. and ManeewongwattanaS., U-DBSCAN: a density-based clustering algorithm for uncertain objects, in: Proceedings of 2010 IEEE 26th International Conference on Data Engineering Workshops, 2010, pp. 209–217.
40.
ErdemA. and GundemT.I., M-FDBSCAN: A multicore density-based uncertain data clustering algorithm, Turkish Journal of Electrical Engineering and Computer Sciences22(1) (2014), 143–154.
41.
SmitiA. and ElouediZ., DBSCAN-GM: an improved clustering method based on Gaussian means and DBSCAN techniques, in: Proceedings of the 16th International Conference on Intelligent Engineering Systems, 2012, pp. 573–578.
42.
TranT.N.DrabK. and DaszykowskiM., Revised DBSCAN algorithm to cluster data with dense adjacent clusters, Chemometrics and Intelligent Laboratory Systems120(2) (2013), 92–96.
43.
MaC.L. et al., Research on important places identification method based on improved CFSFDP algorithm, Application Research of Computers34(1) (2017), 136–140.
44.
JiangL.Q. et al., Optimization of clustering by fast search and find of density peaks, Application Research of Computers33(11) (2016), 3251–3254.
45.
WangG.HanY. and LiX., Fixed point theorems of fuzzy integer value mappings and optimization management to balance problem, International Journal of Fuzzy Systems19(3) (2017), 829–837.
46.
ZhuJ.Y., Fuzzy distance and fuzzy degree, in: Non-classical Mathematics for Intelligent Systems, Huazhong University of Science and Technology Press, Wuhan, 2001, pp. 75–81.
47.
Al-ShammaryD. et al., Fractal self-similarity measurements based clustering technique for SOAP web messages, Journal of Parallel and Distributed Computing73(5) (2013), 664–676.
48.
CohenJ., A coefficient of agreement for nominal scales, Educational and Psychological Measurement20(1) (1960), 37–46.
49.
LandisJ.R. and KochG.G., The measurement of observer agreement for categorical data, Biometrics33(1) (1977), 159–174.