
Abstract
GPS location data is rapidly increasing and has become an important part of spatial information technology and its applications. In order to use K-means to discover hidden information behind GPS data, the drawbacks of K-means must be addressed, such as the difficulty of discovering the number of clusters, sensitivity to initial cluster center (seed) selection, and ease of falling into local optima. This paper presents a novel sharing-based niche genetic algorithm (NGA) with a novel initial population approach based on hybrid K-means to obtain the best chromosome which is then used to perform K-means clustering (termed NicheClust). SSE, DB-index, PBM-index, and COSEC are used as fitness functions for NGA. The experimental results demonstrate that NicheClust has high performance and efficiency for three GPS location datasets.
Introduction
Spatial location data applications have transformed the public availability of services, from virtual maps to consumer GPS devices (e.g., GPS-enabled smart phones, GPS-based taxicabs, etc.). Such applications have enriched our lives through location-based services, and have also started to impact the use of geospatial reasoning in sensing and inference across space and time [46, 47]. These changes in spatial data produce a large quantity of geospatial data (or geo-location data [20]) and has been used in many fields (e.g., shared governance, navigation, smart city, site selection, rescue, and logistics) [47, 52, 53, 63]. Typically, geo-location data from GPS devices has the potential to facilitate the understanding of activity behavior, the discovery of interesting relationships, and also determine characteristics of urban areas [16, 20, 26, 32, 38, 58, 62]. Furthermore, location data mining in particular has been often used to explore a city’s population density, land use, social activity, and telecommunications in recent years [32, 34, 44, 56]. In most of the existing GPS location data mining studies that have been conducted [18, 32], such GPS location data is usually divided into a set of stops and moves [49], OD (origin-destination) [26], and MO (move object) patterns [35, 58]. Following this, clustering algorithms are used to find clusters [16, 21, 27, 37, 38] and mine POIs (points of interest) quickly [59]. For example, the work in [58] helped to reduce the cruising time and increase profitability for taxicabs using mobility patterns (MO). The work in [16, 27, 37] exhibited high performance in geospatial data clustering using clustering analysis methods. In [32], the proposed CLARANS clustering technique can identify spatial data structures and can handle point objects and polygon objects. In [57] a variance-entropy-based clustering approach was proposed using the location data of GPS-equipped taxicabs, which was developed to estimate the distribution of travel time between two landmarks (locations) in different time slots.
Data clustering analysis is an unsupervised learning task [2, 15, 54, 55], for which K-means is a commonly-used and partitioning-based clustering technique, perhaps due to its simplicity and speed. However, K-means clustering requires a user to determine cluster numbers as input to the algorithm [22, 41]. Moreover, K-means is prone to the generation of poor quality results if the initial cluster centers (seeds) are not properly chosen [10, 41], and it is difficult to attain the global optimal solution [7, 29, 41]. Therefore, in order to overcome the shortcomings of K-means clustering, NicheClust (niche genetic algorithm with hybrid K-means) is presented in this paper which combines an improved NGA (niche genetic algorithm [28, 51]) with hybrid K-means (canopy-based and K-means++) for GPS location data clustering. NicheClust includes an improved canopy (see Definitions 5–6) and K-means++ (see Definition 7) [5, 30] which are used to generate the initial population without requiring a user to input the number of clusters and randomly select initial seeds, and can be used to handle unequal gene numbers. Also, compared to GenClust [41], the advantage of NicheClust is that it is effective and fast without having the impact of many input parameters, and can maintain population diversity and avoid premature convergence through the change in the number of niches. Typically, the best chromosome with NGA optimization is used to obtain cluster numbers and initial seeds; the number of genes of the best chromosome is the number of clusters and the genes of the best chromosome are considered to be the initial seeds.
To verify the performance of NicheClust, this paper includes comparisons with GenClust [41] and GAK [23] for three GPS location datasets which consist of taxicab trajectory data for Beijing, Shanghai [61] and Nanjing, China for four fitness functions, including SSE, DBI (Davis-Bouldin Index) [13], PBM [33], and COSEC [41]. Three cluster evaluation criteria (separation (SP) [17], stability (S) [17], and silhouette coefficient (SC) [3]) are used to verify the efficiency. The test results indicate that NicheClust achieves better quality clusters than the two existing GenClust and GAK techniques.
Therefore, the main contributions of NicheClust are summarized as follows:
The step-based canopy and K-means++ method is used to generate the initial population. The canopy-based niche partition method in the sharing-based NGA is proposed to maintain population diversity. The novel adaptive crossover and mutation methods are presented to avoid premature convergence. The best chromosome is used to perform GPS location data clustering.
The remainder of the paper is organized as follows: Section 2 gives the related works including location data and clustering algorithms. Sethe necessary definitions foction 3 gives r NicheClust. The NicheClust approach is presented in Section 4. Experimental tests are described in Section 5 and the results presented. Section 6 gives conclusions.
Nowadays, spatial location data has transformed how we access, store, visualize, and make use of geographic data (or geo-location data). Imagine our life without GPS-enabled smart phones, GPS-based cars, or emergency operations without interactive, dynamic maps [46]. A number of transformative spatial data technologies have become deeply integrated into computer science through ideas like spatial databases, spatial statistics, and spatial data mining, helping to answer many kinds of questions humans have always asked [47]. For example, as the proliferation of mobile digital information technologies continues to generate massive geospatial datasets through GPS devices (e.g., trajectory data with GPS location information) about our everyday life [8, 44, 53], these data hide many movement and behavior patterns that can be explored to use in our lives and social development.
Many researchers have a definite interest in analyzing spatio-temporal phenomena; they have considered spatial data patterns, including stops and moves [49], origin-destination (OD) [26], and move object (MO) [35], which can be used to study human activities and movements in space and time in urban areas [16, 20, 26, 32, 38, 58, 62], and to extract various location points behind the information/values (e.g., POI-based recommender applications [59]). For example, in [9] a network-based MO is proposed where the user can control the behavior of the generator by redefining the functionality of selected object classes. On the other hand, spatial data mining techniques have been used to discover interesting relationships and characteristics that may exist implicitly in datasets [32]. In order to obtain these results by considering different aspects of mobility relationships and characteristics, a great quantity of clustering algorithms (e.g., K-means and other algorithms incorporating K-means) have also been presented to mine location datasets and are often required to generate results suitable for users. For example, in [32], the proposed CLARANS clustering technique can identify spatial data structures and can handle point objects and polygon objects. In [57] a variance-entropy-based clustering approach was proposed that was used to handle the location data of GPS-equipped taxicabs, in order to estimate the travel time distribution between two landmarks (locations) in different time slots. However, none of these clustering algorithms are suitable for all types of data, clusters, and applications, nor are all algorithms appropriate for all problems of clusters [2].
In fact, clustering is an important data analysis approach and data mining technique, which is deemed one of the most difficult and challenging problems in unsupervised machine learning [55]. There are many clustering algorithms, which have been roughly categorized into six classes [18]: partition-based (e.g., K-means and variants), density-based (e.g., DBSCAN (Density-Based Spatial Clustering of Applications with Noise) and OPTICS (Ordering Points to Identify the Clustering Structure)), model-based (e.g., Gaussian model and regression model), hierarchical-based (e.g., LINK, CURE, Chameleon), graph-based (e.g., spectral clustering), and grid-based (e.g., flexible grid-clustering [4], and grid-growing clustering [61]).
Of these, K-means is a commonly-used technique due to its simplicity and effectiveness. However, K-means requires a user to provide the number of clusters
Preliminaries
Definitions are given in this section which are used to describe the NicheClust algorithm. First, assuming a linear interpolation [50] between sample locations (consisting of longitudes and latitudes), we present Definition 1 of the location data in terms of [16, 27, 38]. Second, the basic clustering of location datasets is defined in Definition 2. This is used in the description of the location dataset’s clustering method. A distance measure between location data points is calculated by the Euclidean distance and the similarity between chromosomes is also calculated by the cosine similarity measure, and are given in Definitions 3 and 4. These concepts are used in the description. Then, the definitions of the improved canopy and niche operation are presented in Definitions 5–8.
An arbitrarily given
A clustering matrix
where
where
If the location data includes
If the given location data includes
within a range value
where POP denotes chromosomes,
The NicheClust clustering algorithm
The basic concepts of NicheClust are presented in the following sub-section and then a formal presentation of the GPS location data clustering technique is given, as shown in Fig. 1.
The main contributions of NicheClust
The key idea of NicheClust is the combination of NGA with hybrid K-means.
NGA chromosome representation
The chromosome of a GA is made up of a sequence of genes that encode, for example, binary digits, integers, symbols and floating-numbers [11]. Here, the genes describe GPS location data points and each chromosome in the population is a potential solution that is used to perform K-means clustering. The chromosomes are acquired via the improved canopy and K-means++. The number of genes of a chromosome is set to be in the range
The NicheClust processing diagram.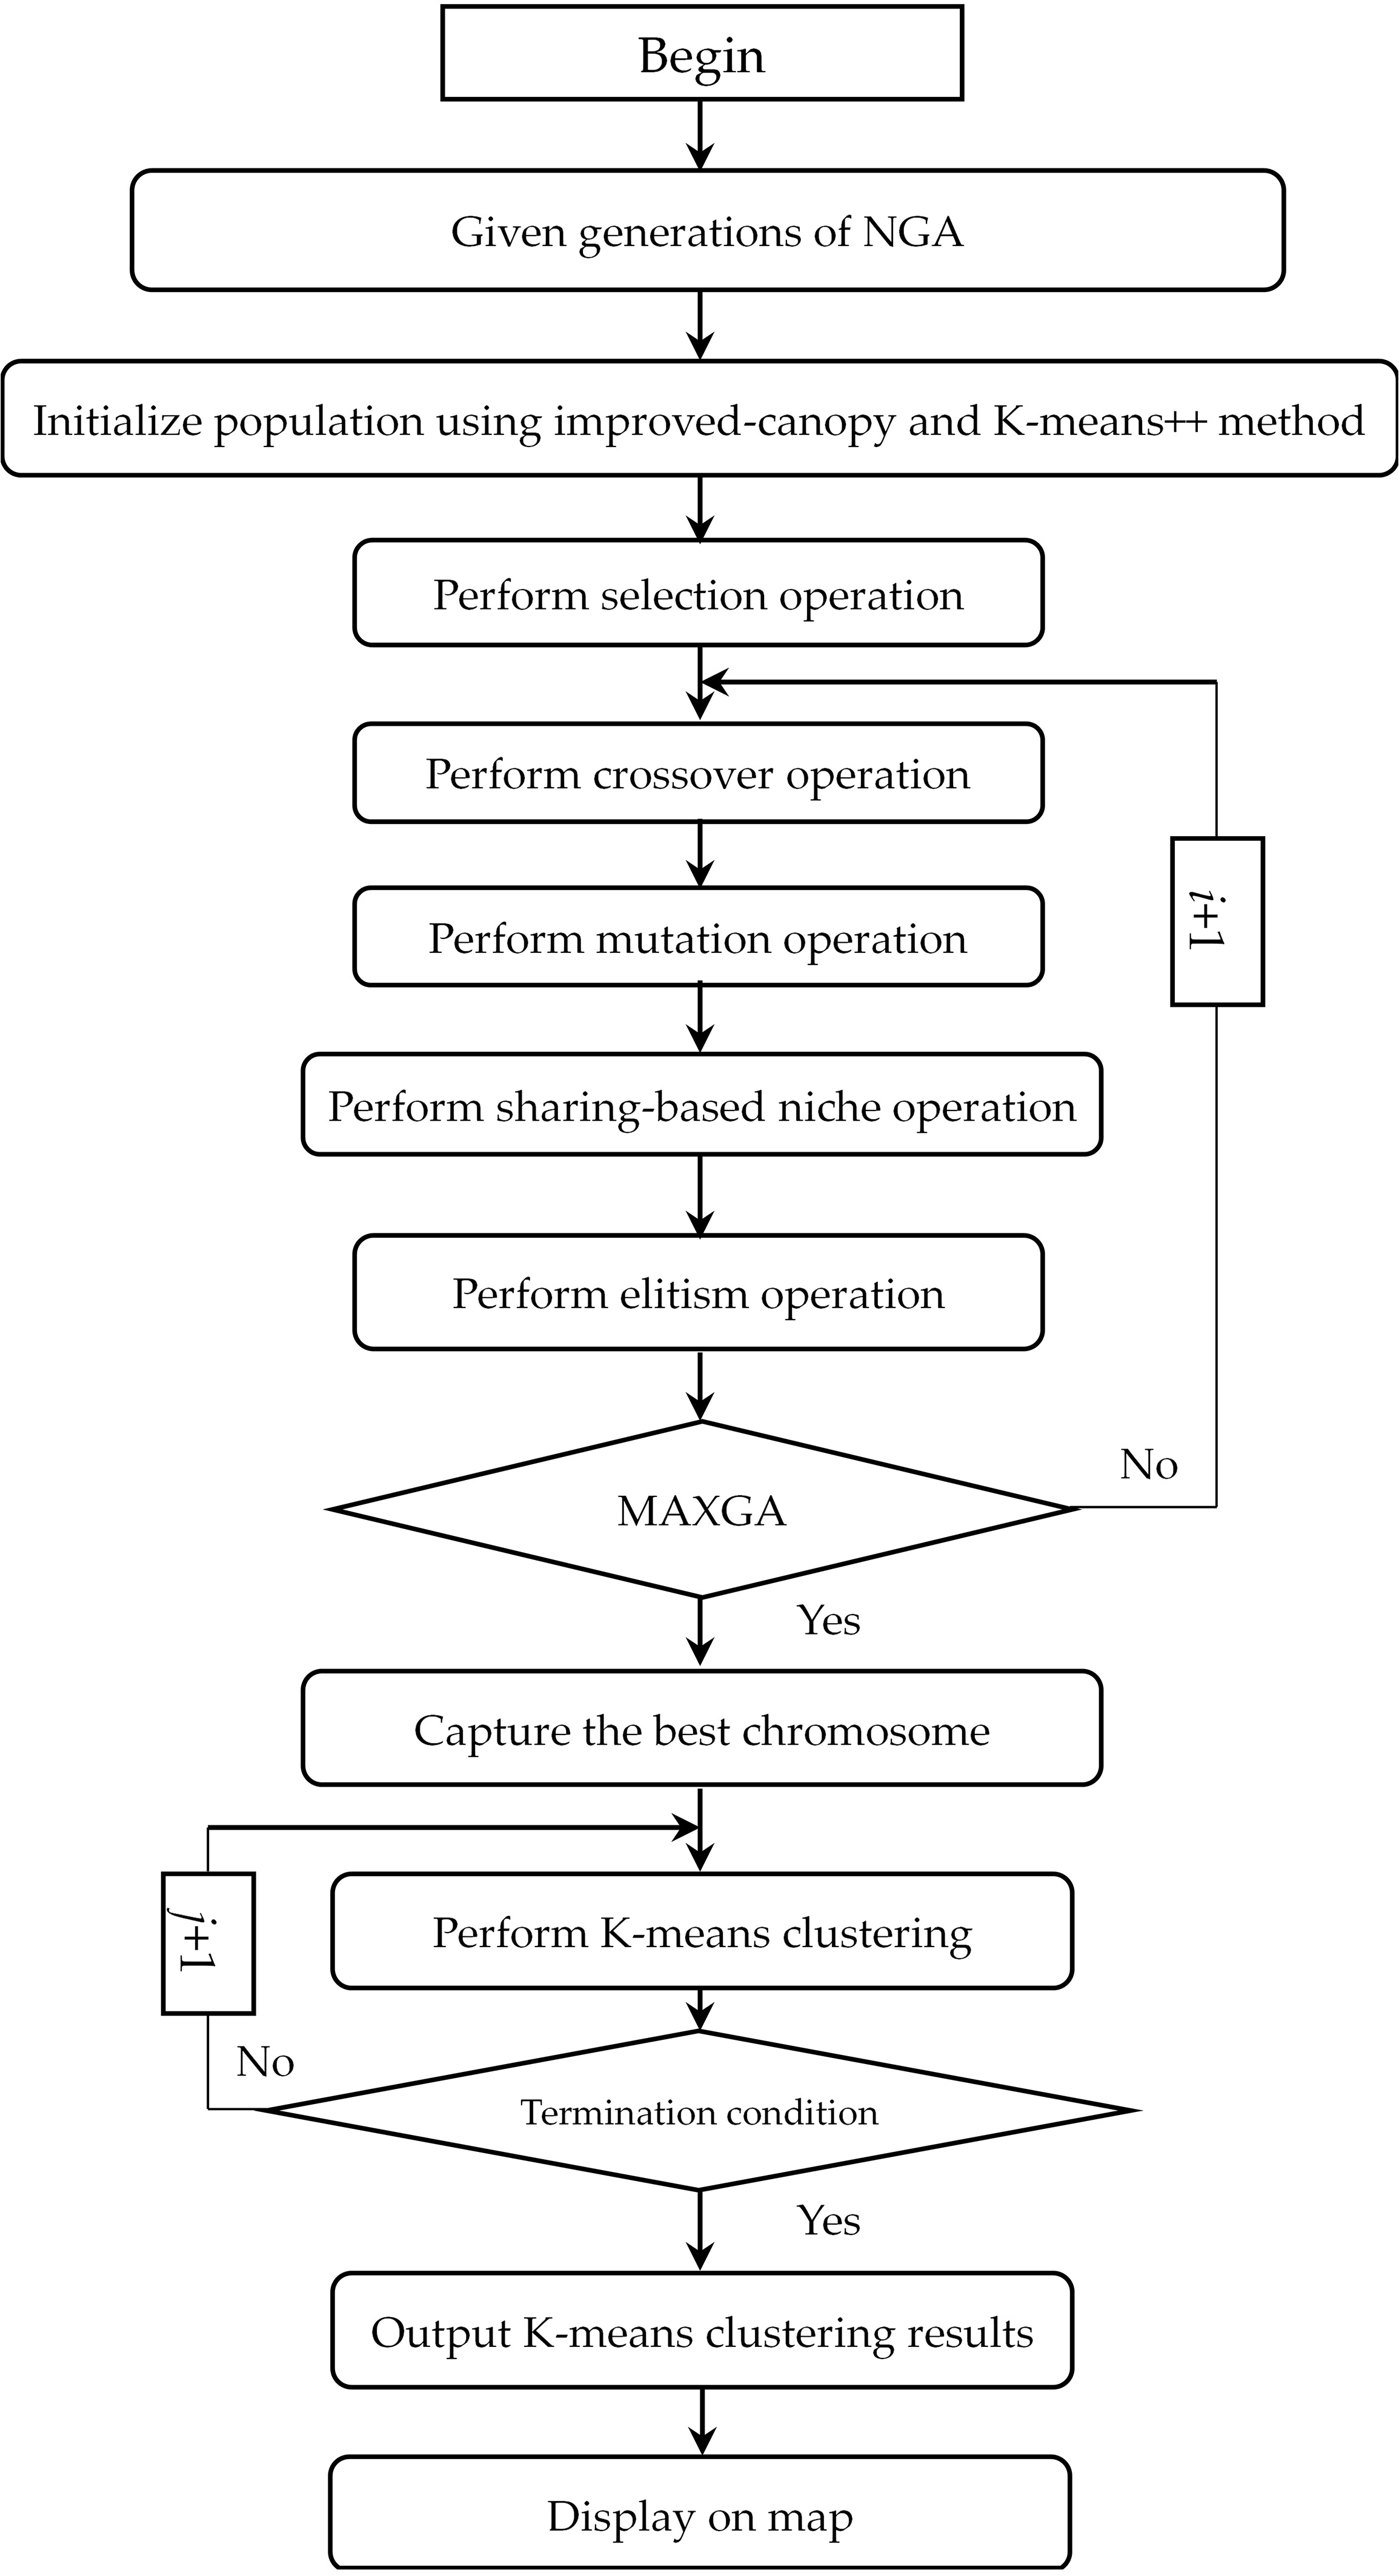
Canopies are usually used to generate the number of clusters, but this can only be a rough estimate [30]. If the density of GPS data points of canopies is high by the given thresholds (with two distance thresholds
Initial cluster centers (Seeds) of NicheClust with K-means++
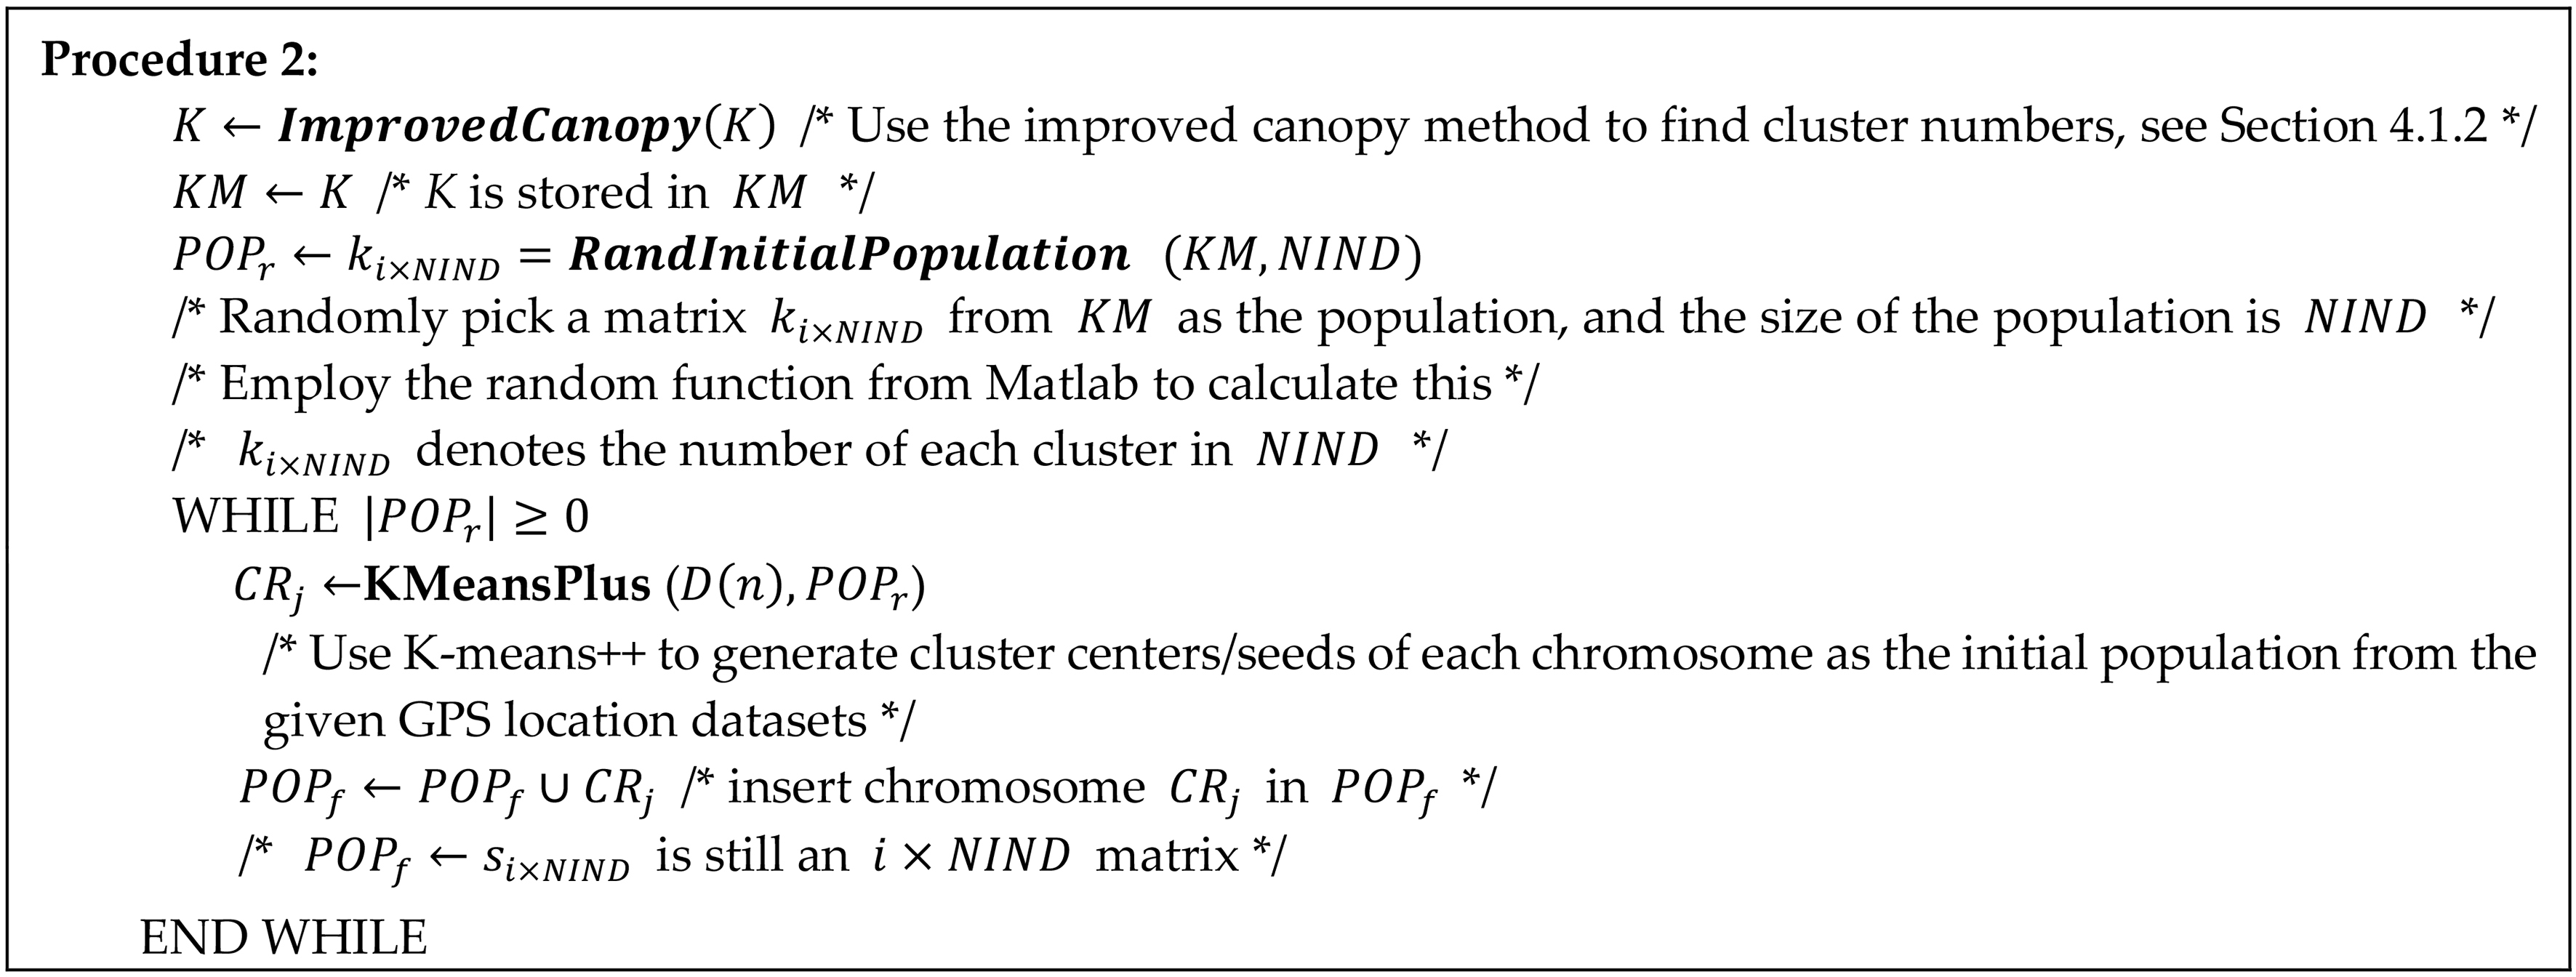
K-means++ is a simple and fast initial seed algorithm, which can be used to improve the quality of K-means clustering [2, 41, 54, 60]. Therefore, the improved canopy method with distance is first used to randomly choose cluster numbers (see Section 4.1.2) and then used as the initial chromosome’s representation. For example, 30 chromosomes are chosen which consist of the different gene numbers of each chromosome with the canopies set (see Section 4.1.2 and Definition 7). Then K-means++ is employed to capture the initial seeds from the GPS location dataset for each chromosome. Finally, the best chromosome will be selected and used for the operation of NGA with the Euclidean distance measure.
Cosine-based similarity for an improved gene rearrangement technique
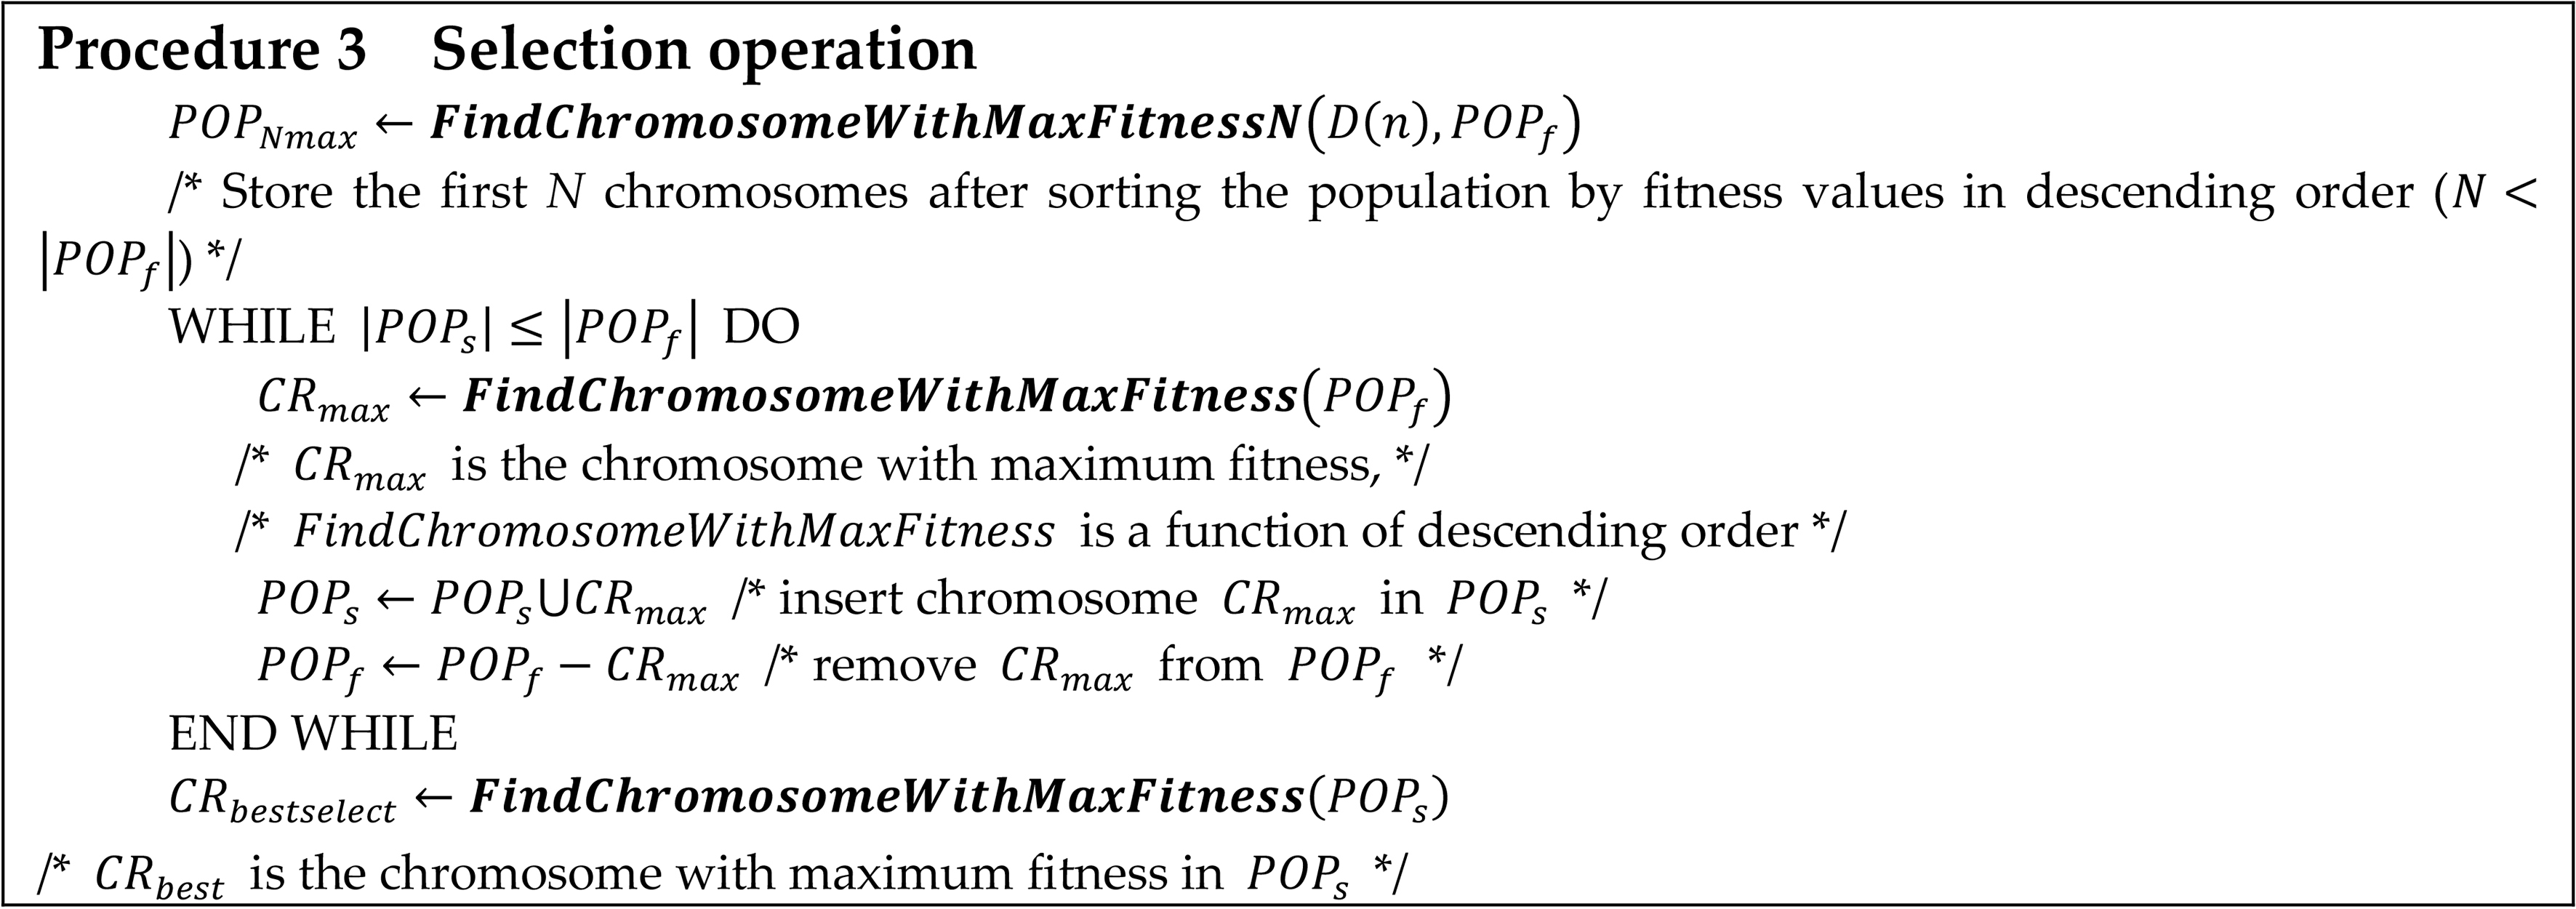
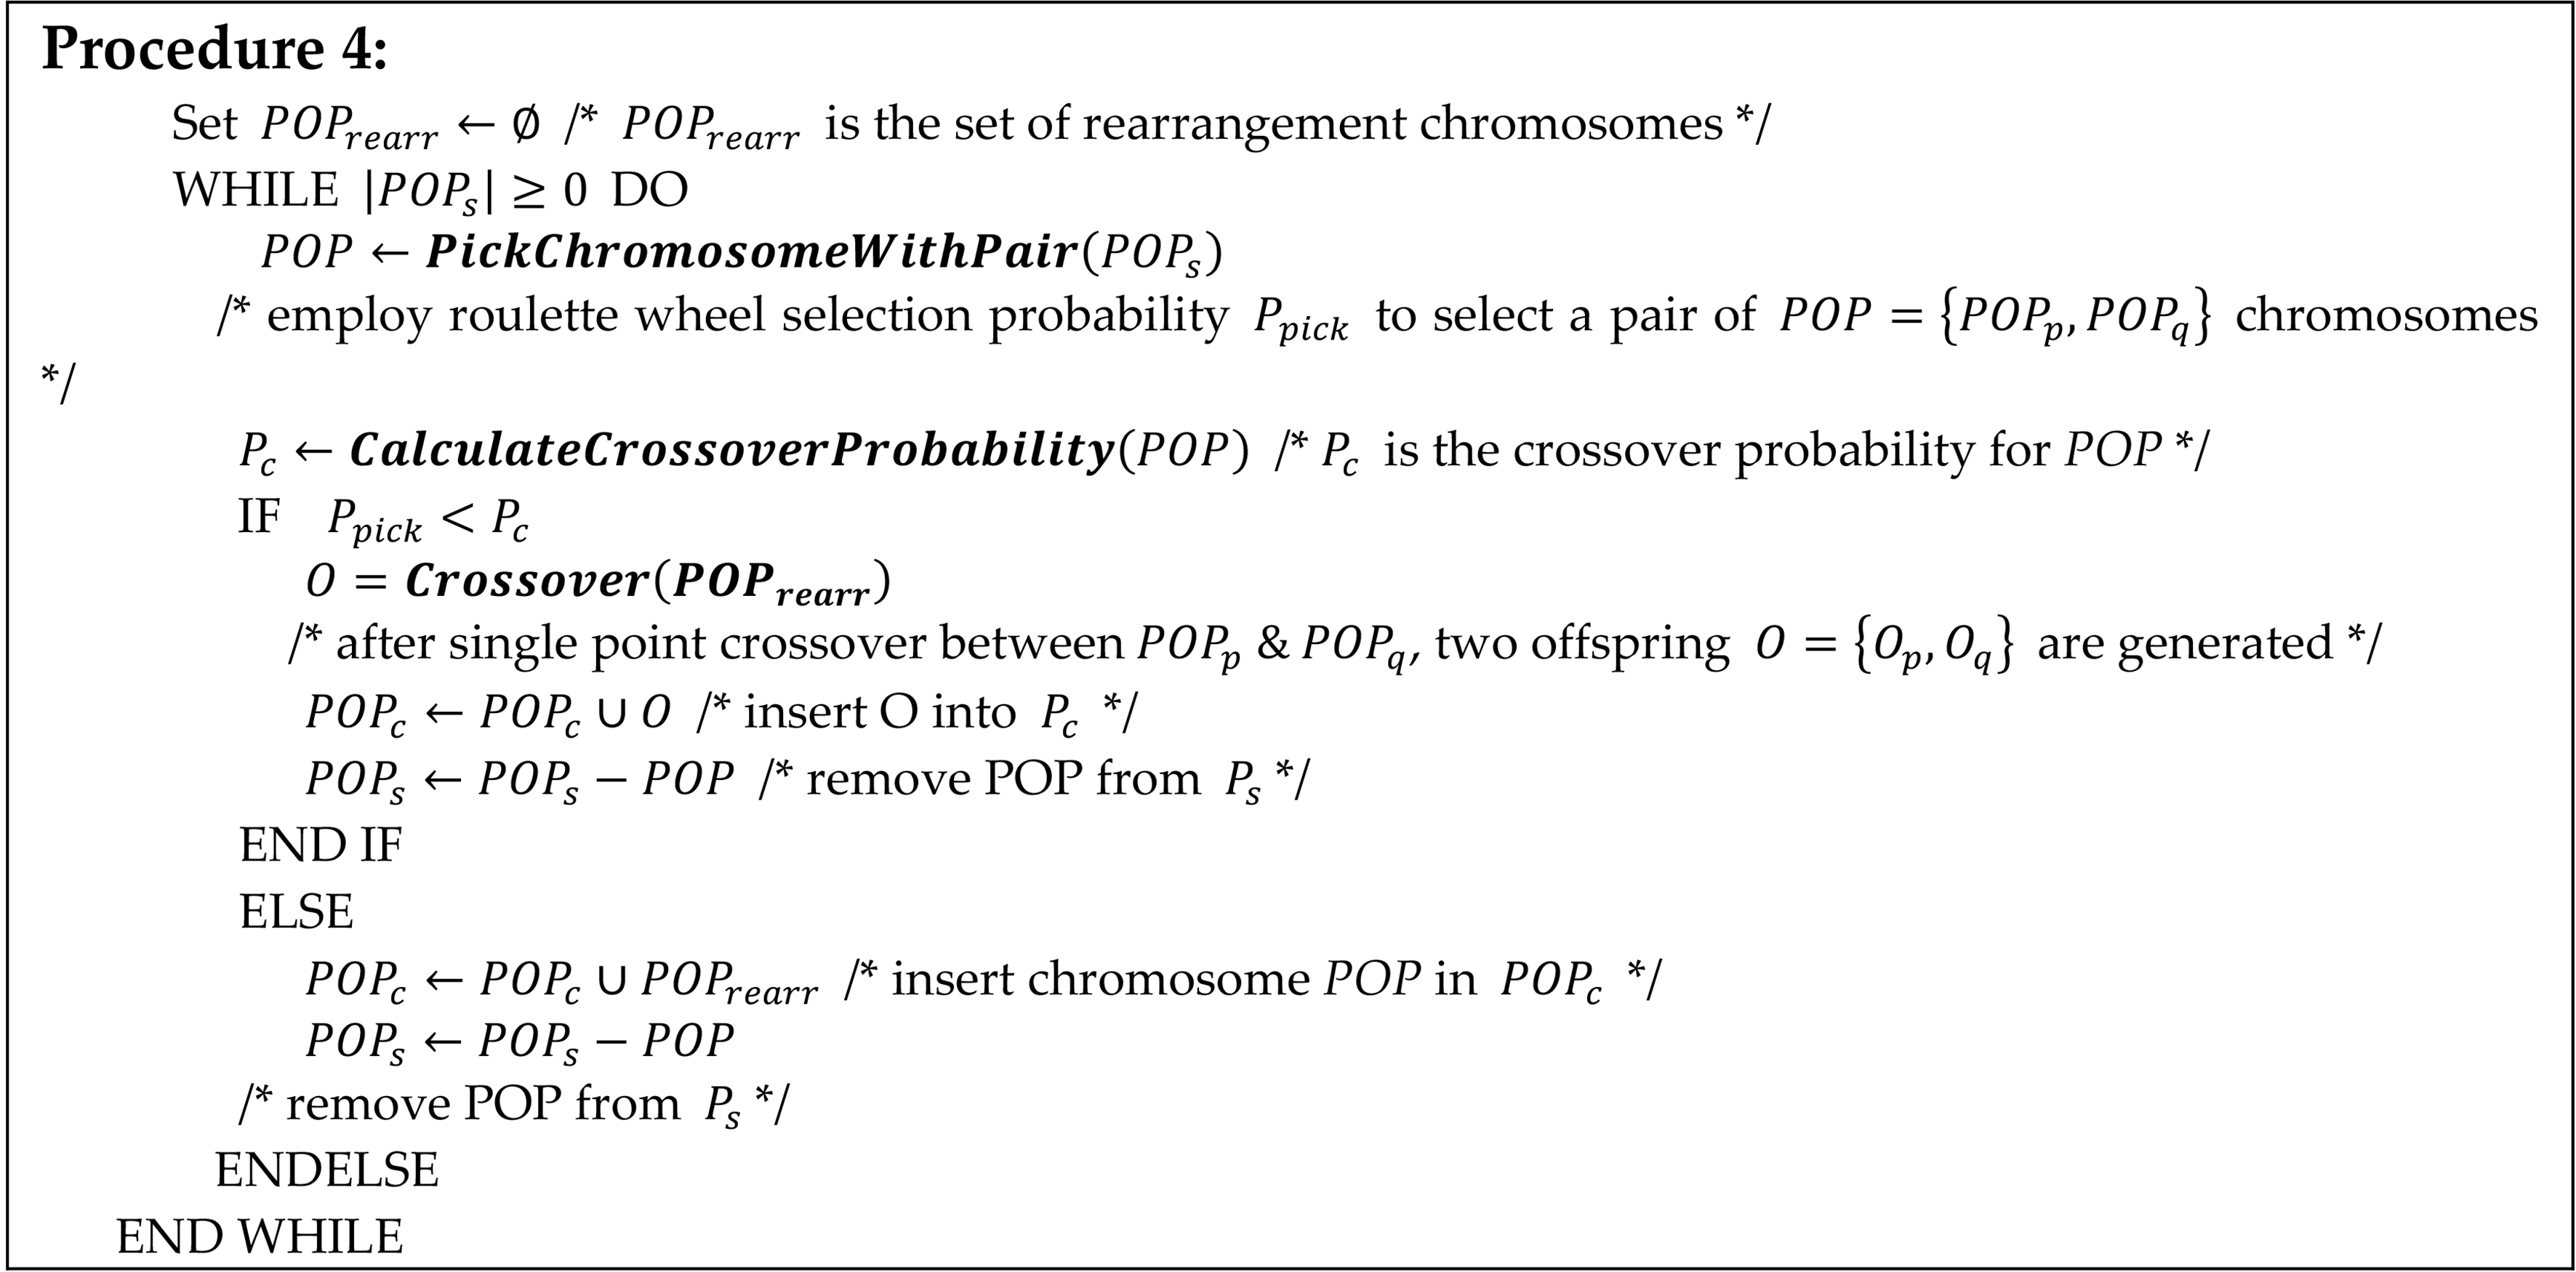
Some existing gene rearrangement methods [11, 48] have been used to handle equal length chromosomes in previous years. The gene rearrangement technique in GenClust [41] can be used to handle unequal lengths of chromosomes, but this only considers gene rearrangement with distance comparison without explaining the structure between reference chromosomes and the target chromosome. Therefore, in this paper, the best chromosome is first selected in terms of its fitness value, and a pair of chromosomes are chosen with an existing roulette wheel method [25, 31] from the initial population where the chromosomes
Niche partitioning based on the improved canopy method
In this paper, a sharing-based niche technique is employed to prevent premature convergence and maintain population diversity. Therefore, the improved canopy method (see Section 4.1.2 and Definitions 5, 6, and 8) is designed to divide the population into a number of niches, and then a sharing-based niche function is presented to readjust the sharing values.
Fitness functions of the NGA
The fitness function is used to control candidate solutions and verify objective measures for NGA [3]. Therefore, some evaluation criteria, including Dunn‘s index (DI), PBM (PBM-index), SSE, Xie-Beni index (XBI), DB-index and COSEC [41] can typically be used as fitness functions [33]. In this paper, SSE, DB-index, PBM, and COSEC are used as fitness functions for NGA [60], and are given in Table 1.
The fitness functions used in NGA
The fitness functions used in NGA
In Table 1,
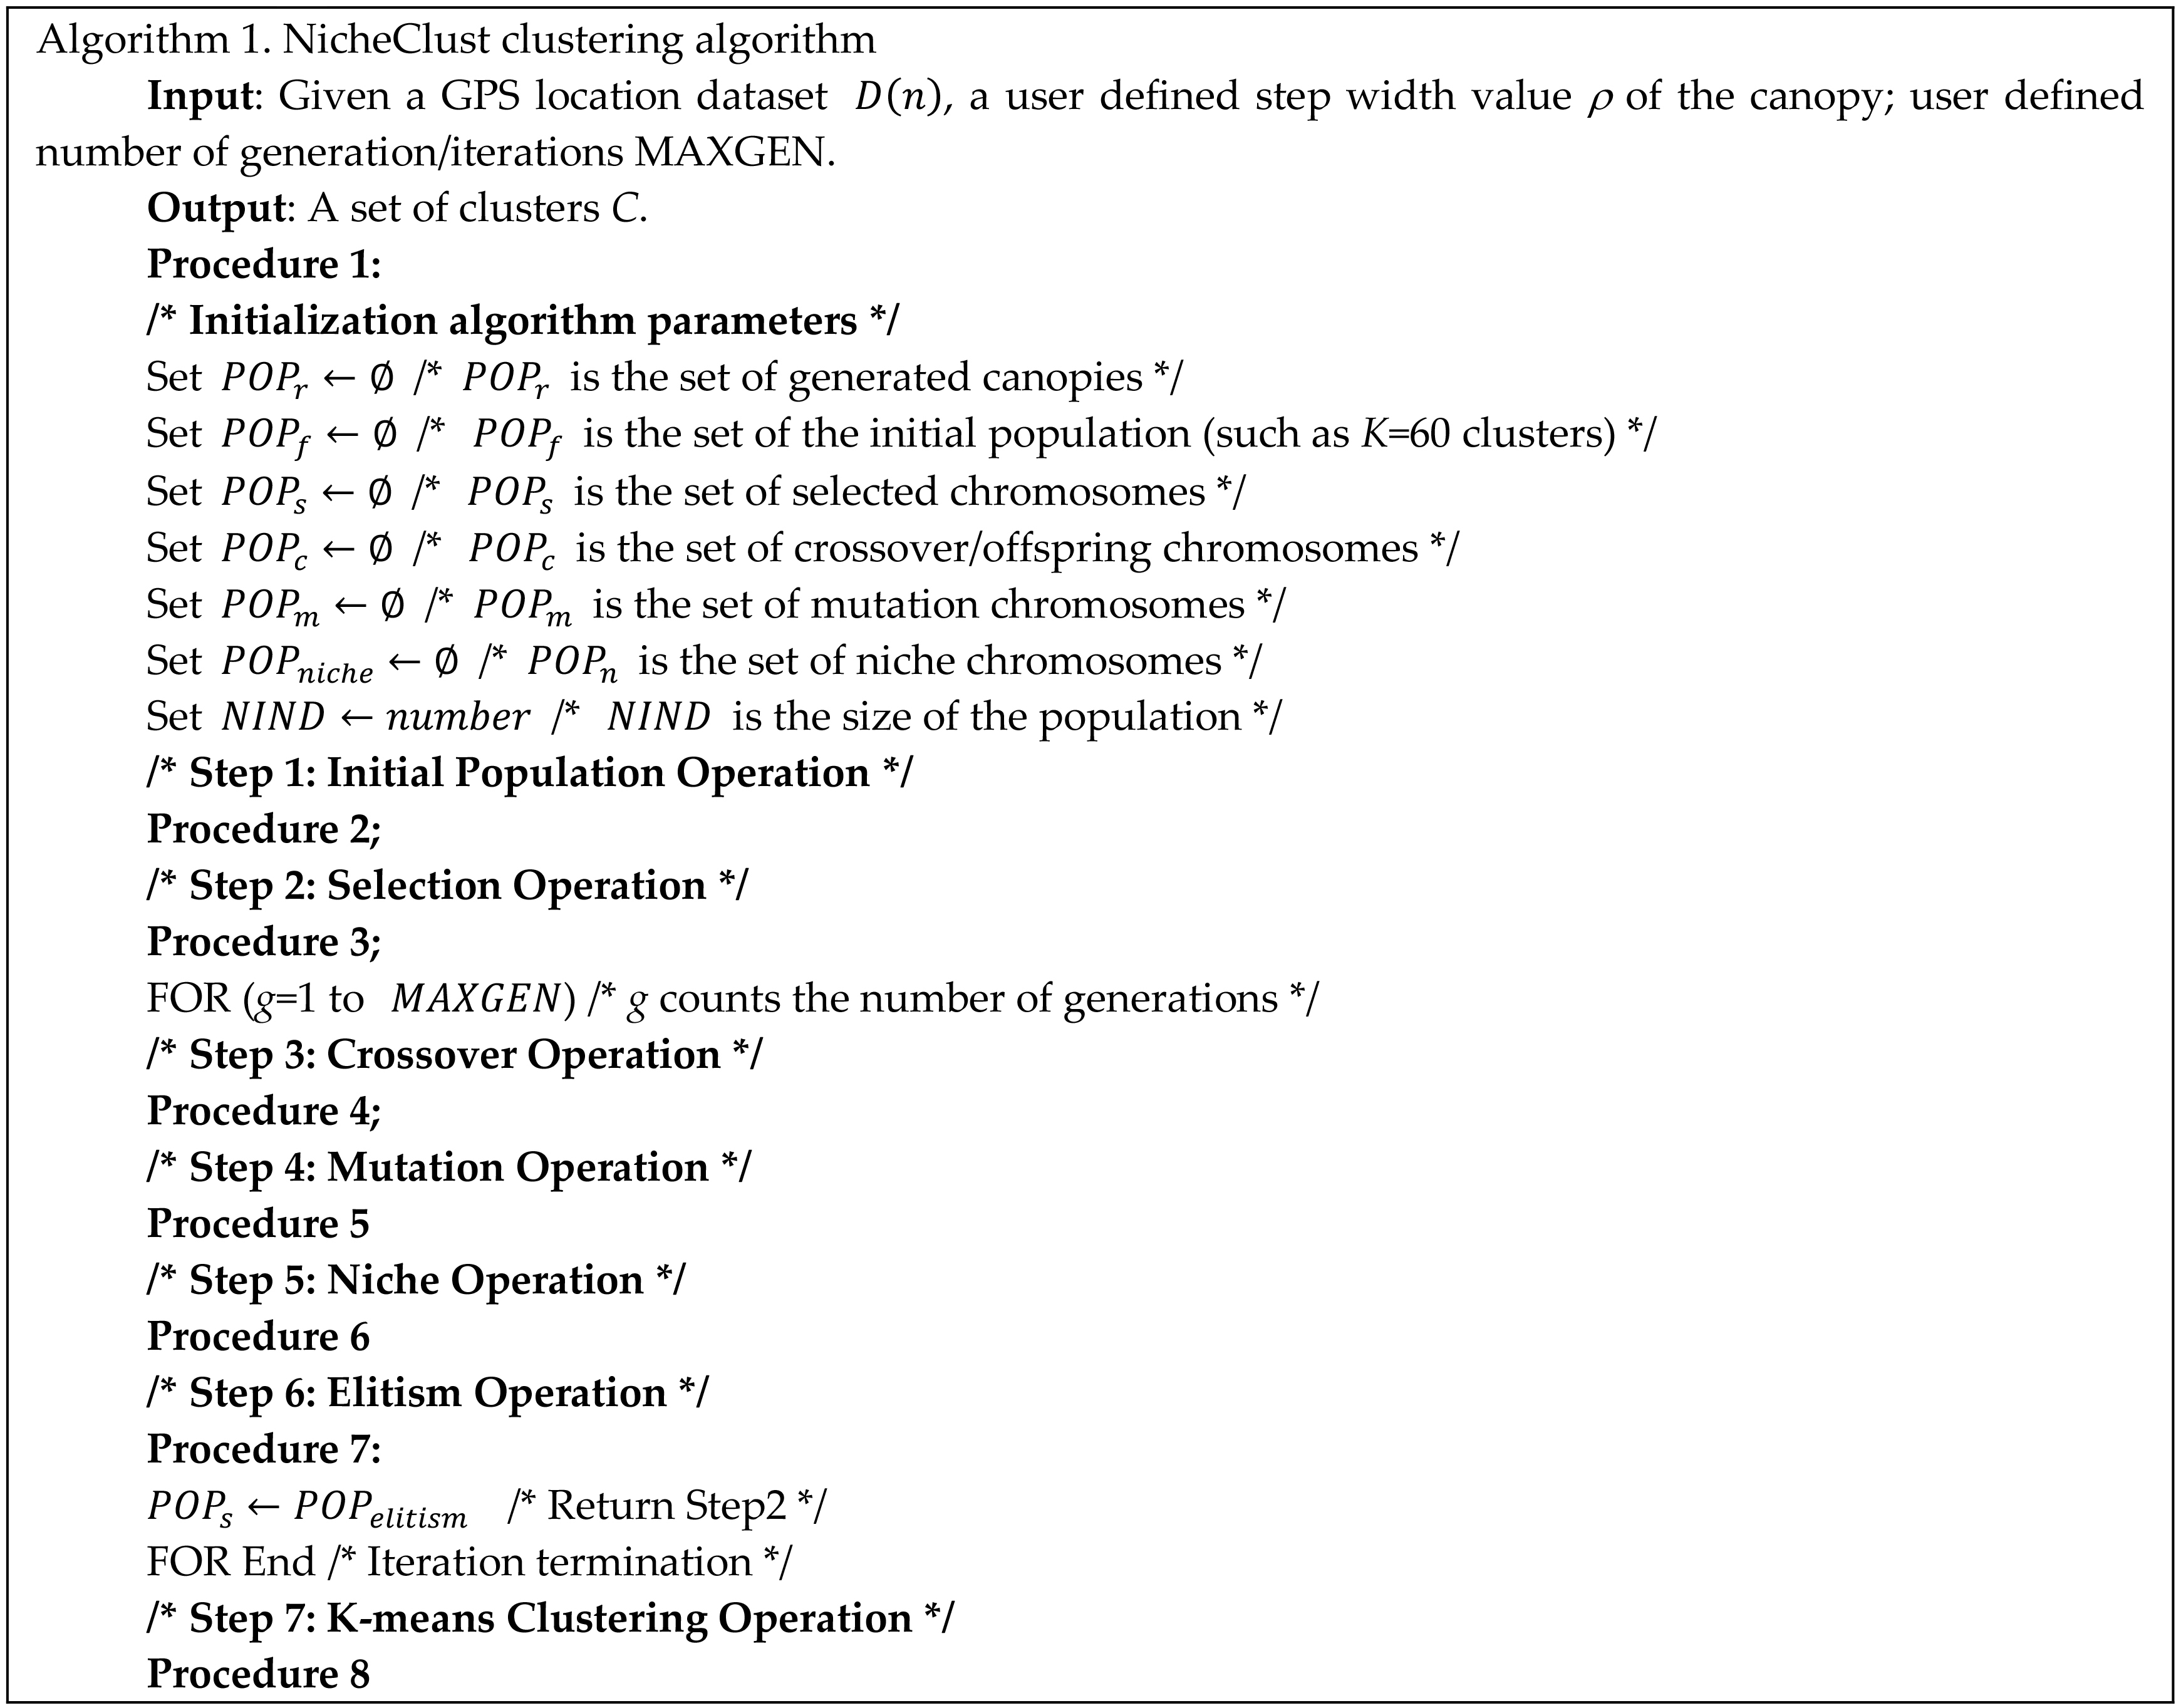
The key steps of the NicheClust algorithm are introduced according to Section 4.1, and are shown in Algorithm 1.
A single point crossover model is presented as:
where
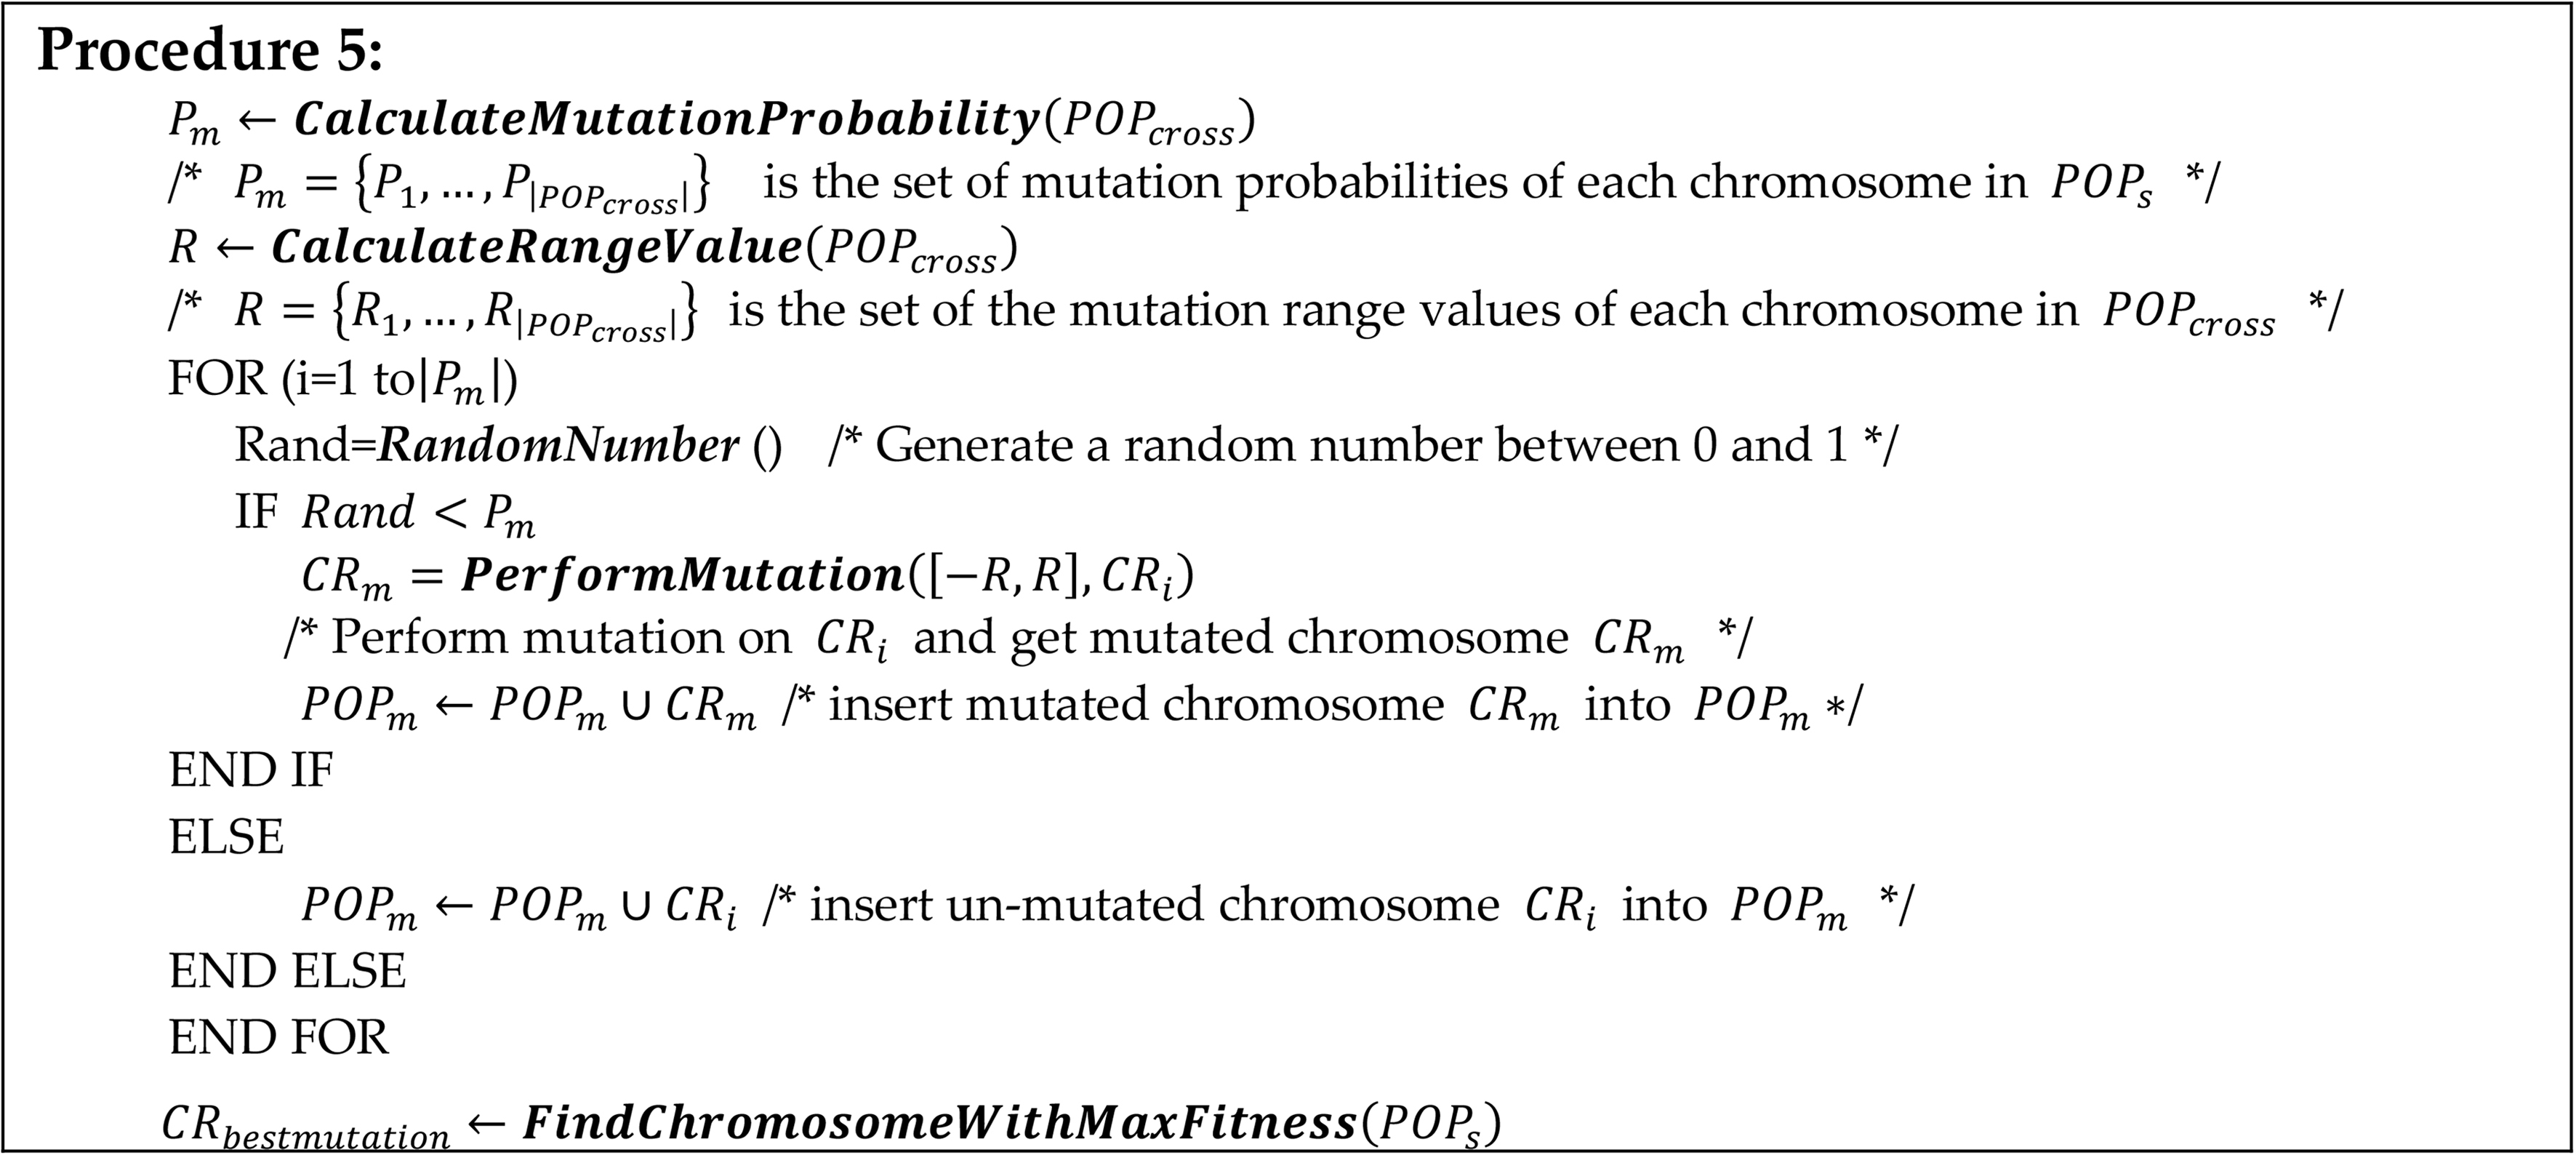
where
where
If the maximum and minimum fitness values of chromosomes in
If the mutation operations have been performed, then the mutated population
where
where
When niche operations have been executed, a niche population
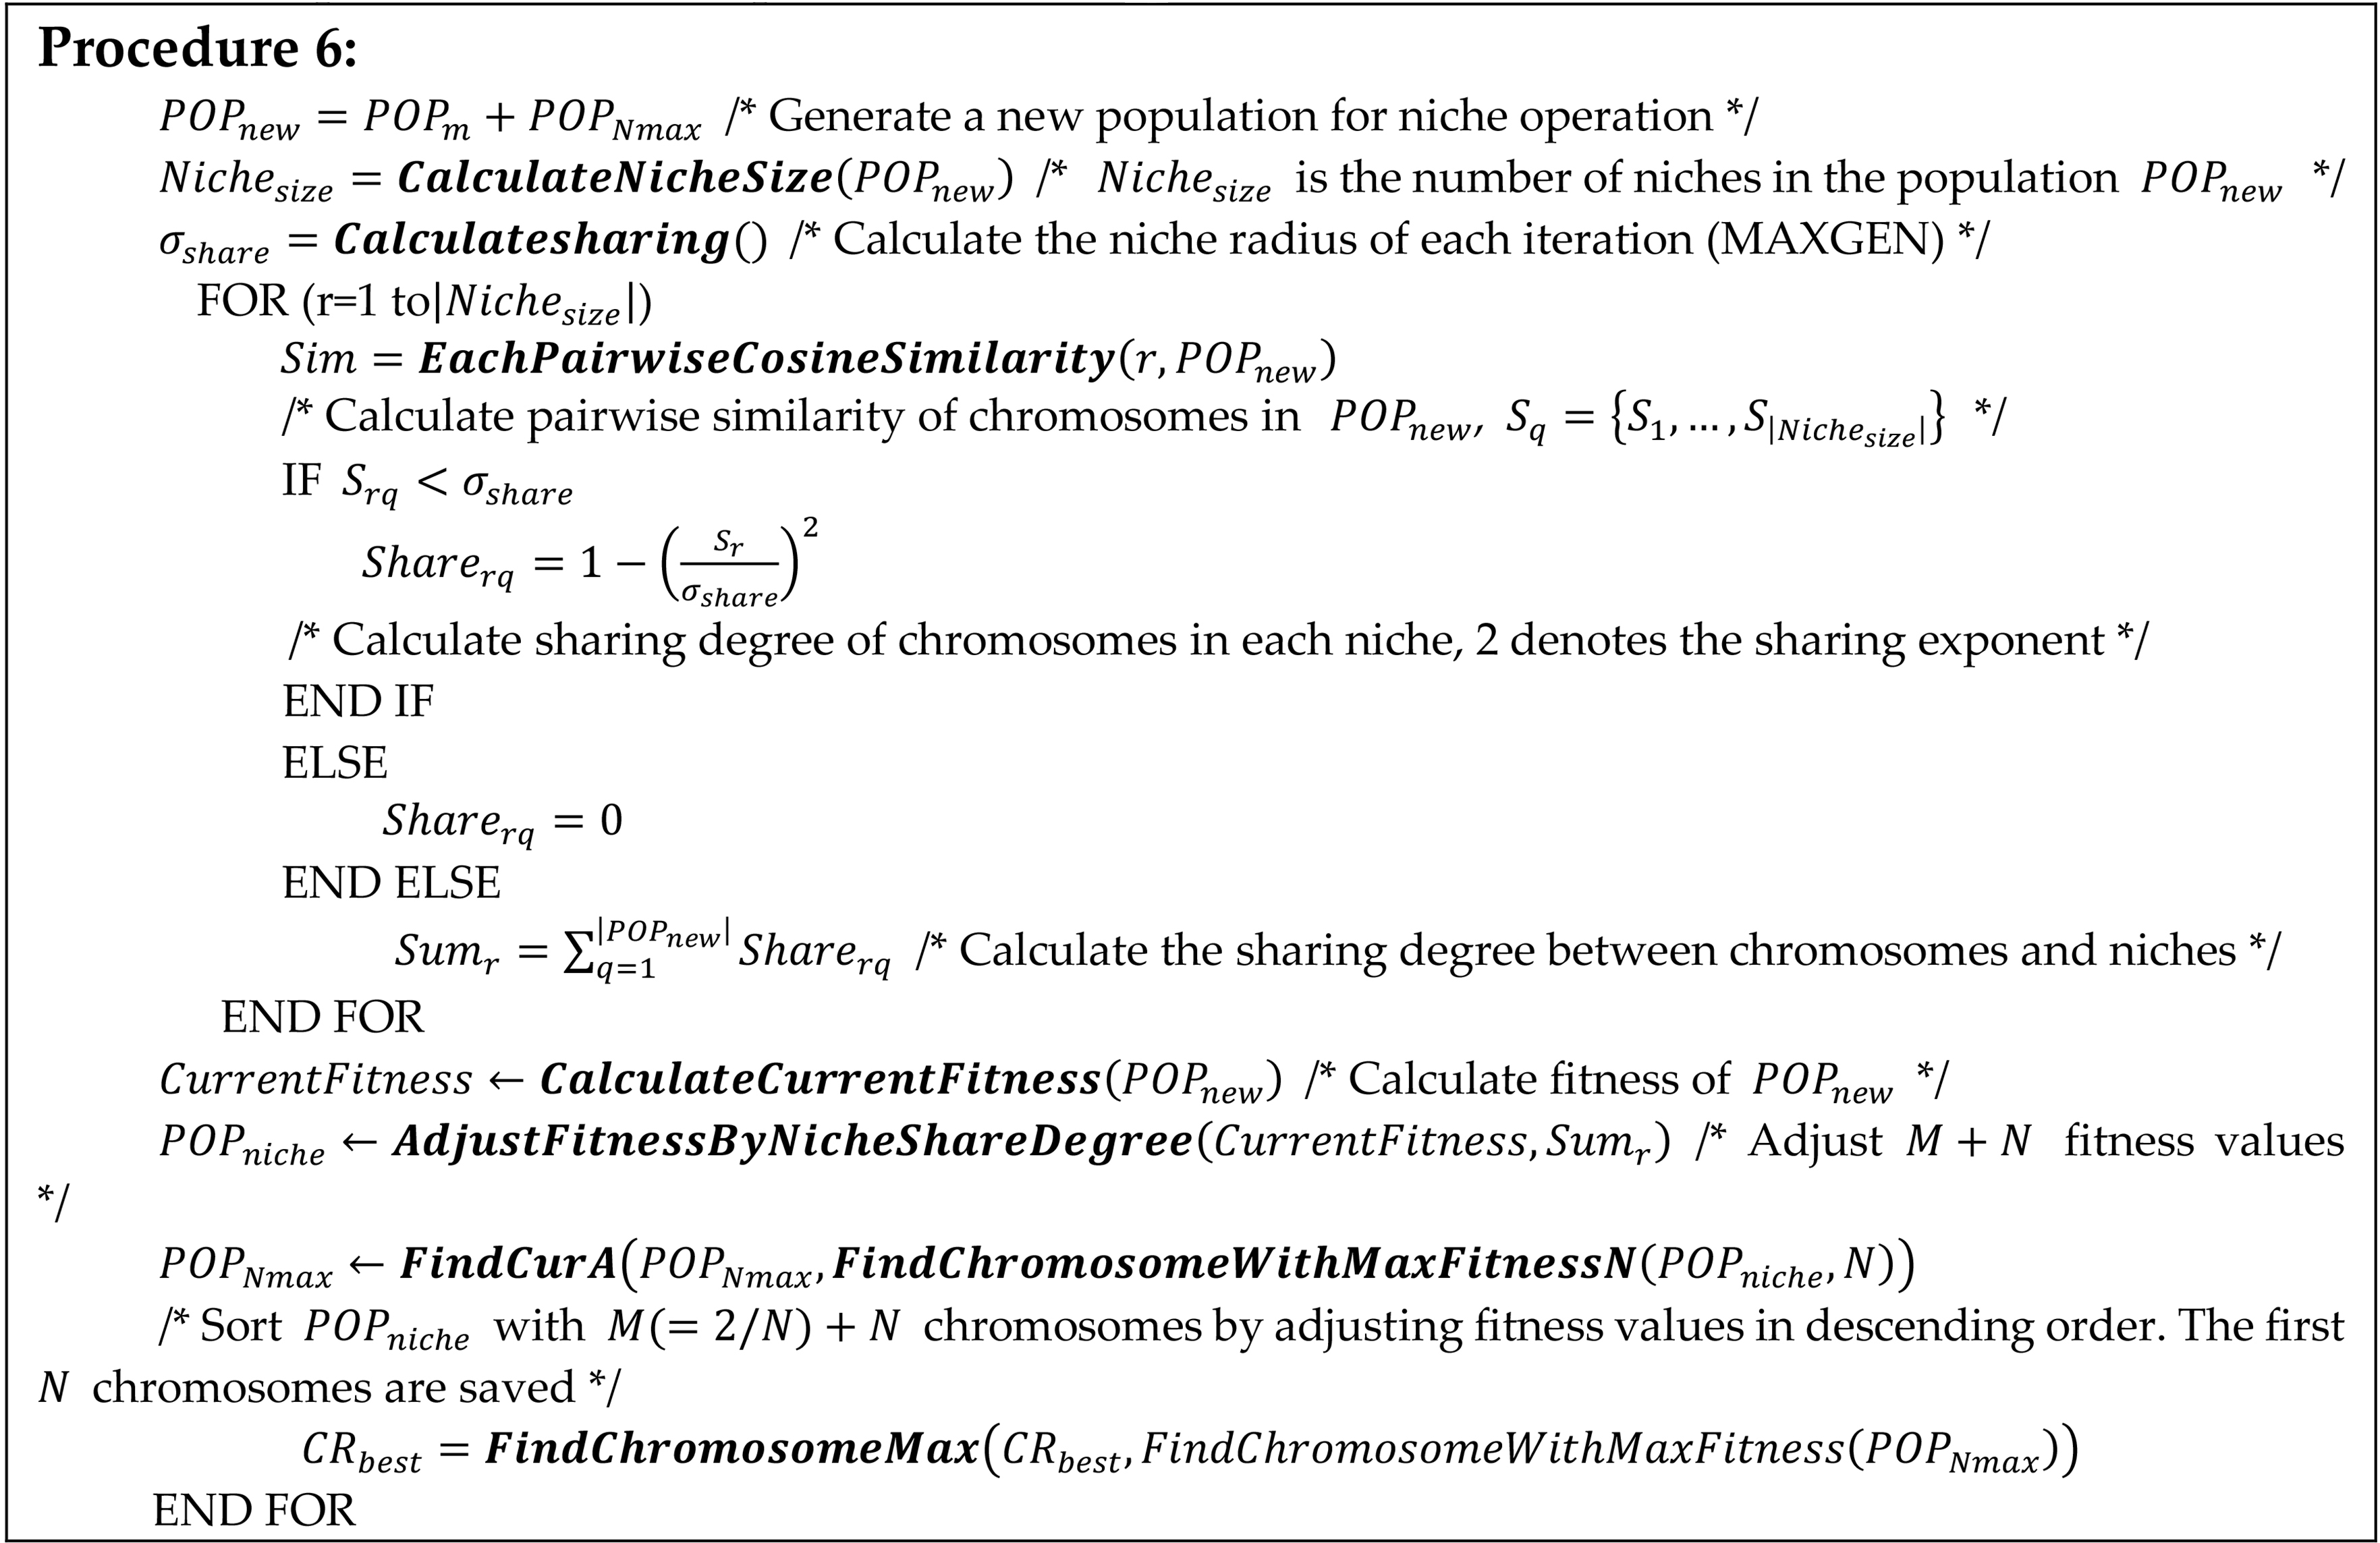
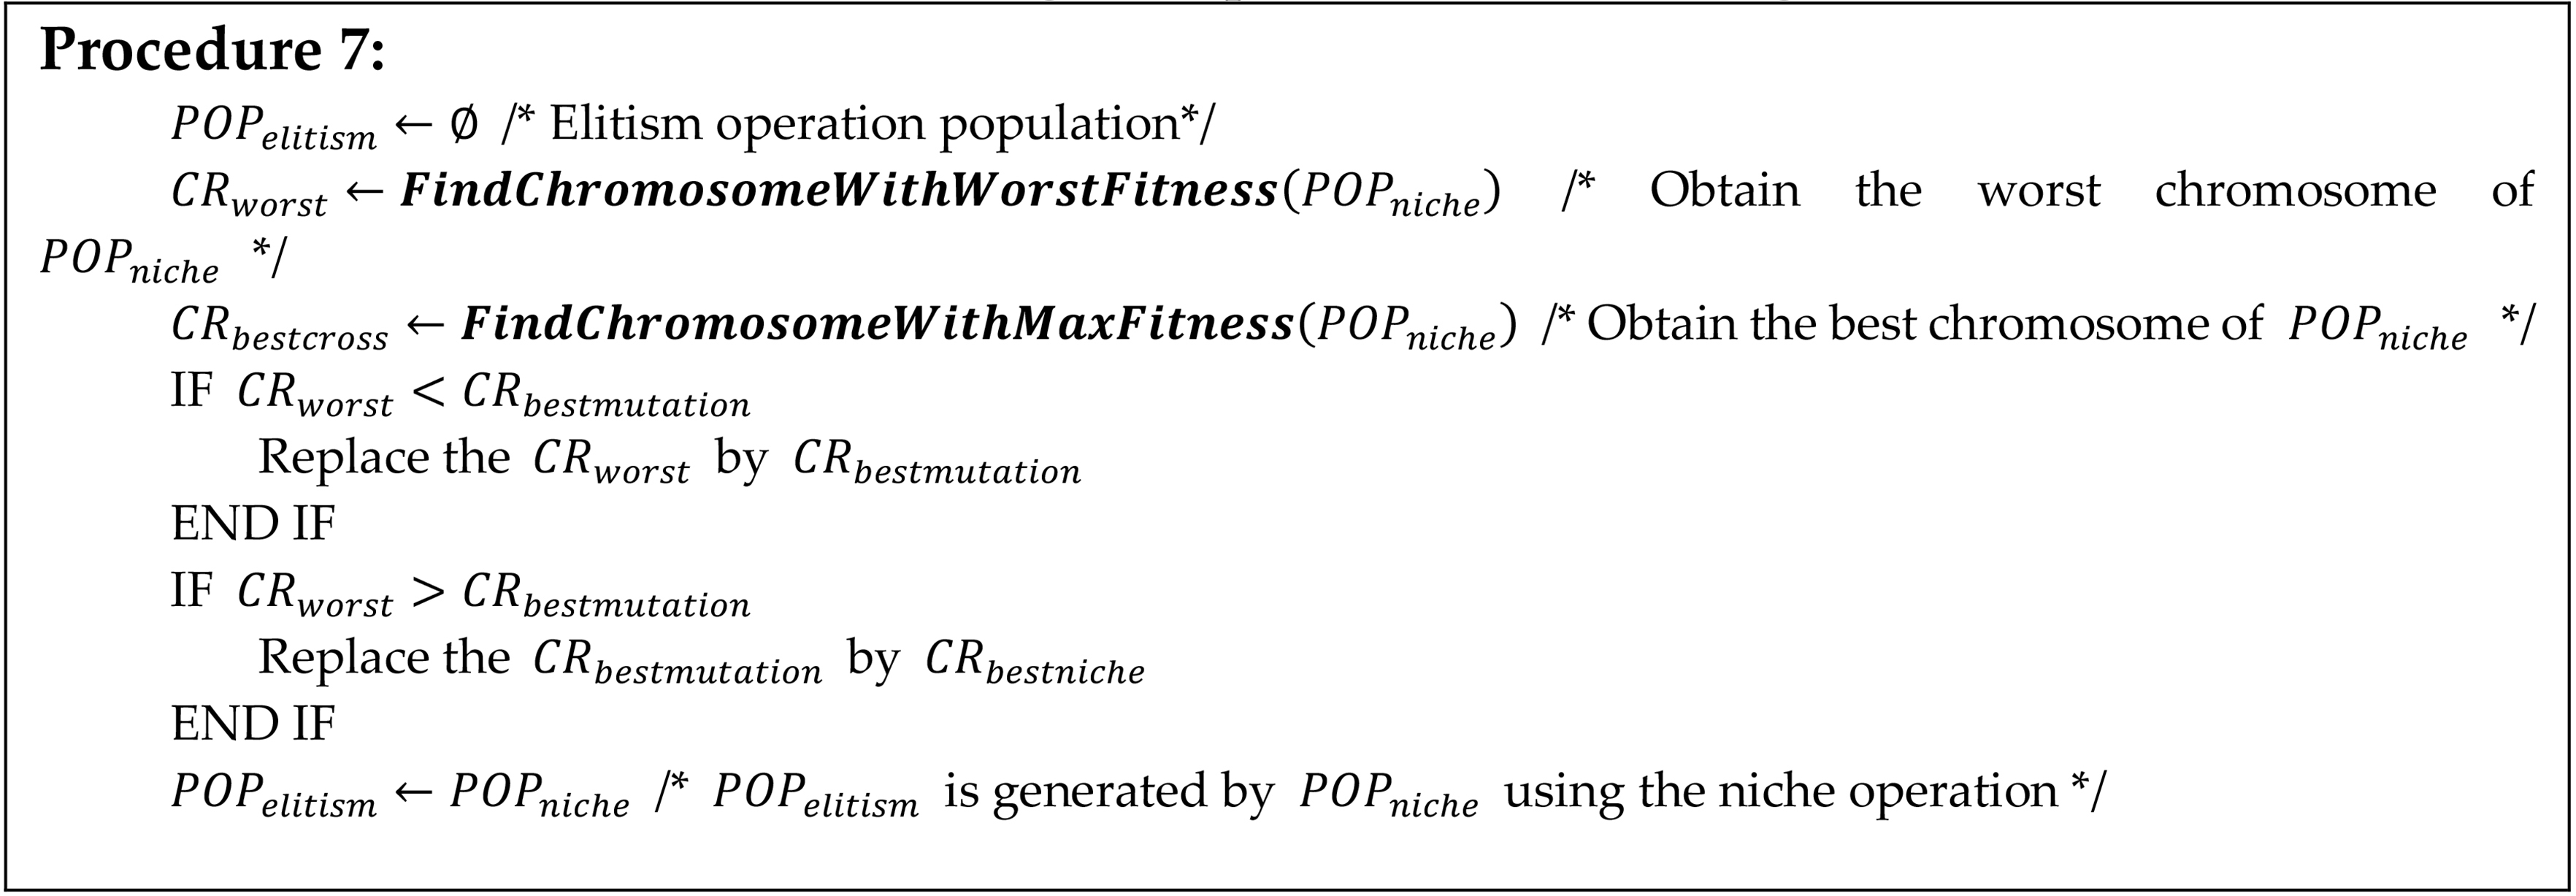
where
Complexity of NicheClust
According to Section 3 and Algorithm 1, the number of data points/records in a given GPS location dataset is
Distribution of GPS location data points: (i) Beijing, China; (ii) Shanghai, China; (iii) Nanjing, China.
To test the effectiveness of NicheClust, three GPS location datasets (Beijing taxicabs, Shanghai taxicabs [61], and Nanjing taxicabs) are utilized for the experimentation, as shown in Fig. 1 and Table 1. The two columns in Table 1 show the number of GPS location data points.
The experimental GPS location datasets
The experimental GPS location datasets
a. Three GA-based clustering results using SSE (i, ii, iii) for three GPS location datasets over 20 independent trials. b. Three GA-based clustering results using DBI (i, ii, iii) for three GPS location datasets over 20 independent trials.
Continued. c. Three GA-based clustering results using PBM (i, ii, iii) for three GPS location datasets over 20 independent trials. d. Three GA-based clustering results using COSEC (i, ii, iii) for three GPS location datasets over 20 independent trials.
The outlier data points of the three GPS location datasets have been cleaned in Table 1. The clustering results based on typical evolutionary criteria are shown in Section 4.3, which includes separation (SP), silhouette coefficient (SC), stability (S), and running times (RT).
All the algorithms (NicheClust, GenClust, and GAK) have the same initialization parameters. The population size of GAK, GenClust, and NicheClust for the GPS location datasets (Beijing, Shanghai, and Nanjing, China) are equal to 60, 40, and 32, respectively. The number of iterations used for NGA is 120. The termination condition for K-means clustering is set to be 10
where
Experimental results
This section compares the performance of NicheClust with the other algorithms. We firstly compare the speed and smoothness of the GA-based clustering algorithms (NicheClust, GenClust, and GAK) for four fitness functions (see Section 3.2) for the three GPS location datasets. For each dataset, 20 independent trials are performed and then their mean values are recorded. The average fitness values of SSE, DBI, PBM, and COSEC obtained by the three algorithms are shown in Fig. 3a–d.
In Fig. 3a–d, the actual average values of the fitness functions (for 20 independent experiments) are presented for the three GPS location datasets. We also compare the clustering convergence speed and smoothness of the three algorithms in order to assess the effectiveness of NicheClust. Figure 3a–d show the average scores, and it can be seen that NicheClust obtains higher scores than GenClust and GAK for SSE, DBI, PBM, and COSEC, and the convergence speed and smoothness of NicheClust is also better than GenClust and GAK. Also, NicheClust requires fewer iterations to reach convergence. In particular, the convergence curves of NicheClust are good and do not fluctuate. The results indicate that NicheClust obtains better clustering than GenClust and GAK for the four fitness functions without being trapped in local optima.
This indicates that NicheClust has better diversity than GenClust in every iteration. The clustering results indicate that the overall efficiency and performance of NicheClust are better than GenClust [41] and GAK [7].
To validate the availability of NicheClust, the best clustering results of NicheClust for the three GPS location datasets are displayed in Amap according to [63]. NicheClust uses SSE, DBI, PBM, and COSEC to generate clustering results and shown in Fig. 4a–d.
a. Clustering results shown on Auto Navi Maps (Amap) for three GPS location datasets for the taxicabs (a, b, c). The figures plot the SSE obtained by NicheClust. b. Clustering results shown on Auto Navi Maps (Amap) for three GPS location datasets for the taxicabs (a, b, c). The figures plot the DBI obtained by NicheClust. c. Clustering results shown on Auto Navi Maps (Amap) for three location datasets for the taxicabs (a, b, c). The figures plot the PBM obtained by NicheClust. d. Clustering results shown on Auto Navi Maps (Amap) for three GPS location datasets for the taxicabs (a, b, c). The figures plot the COSEC obtained by NicheClust.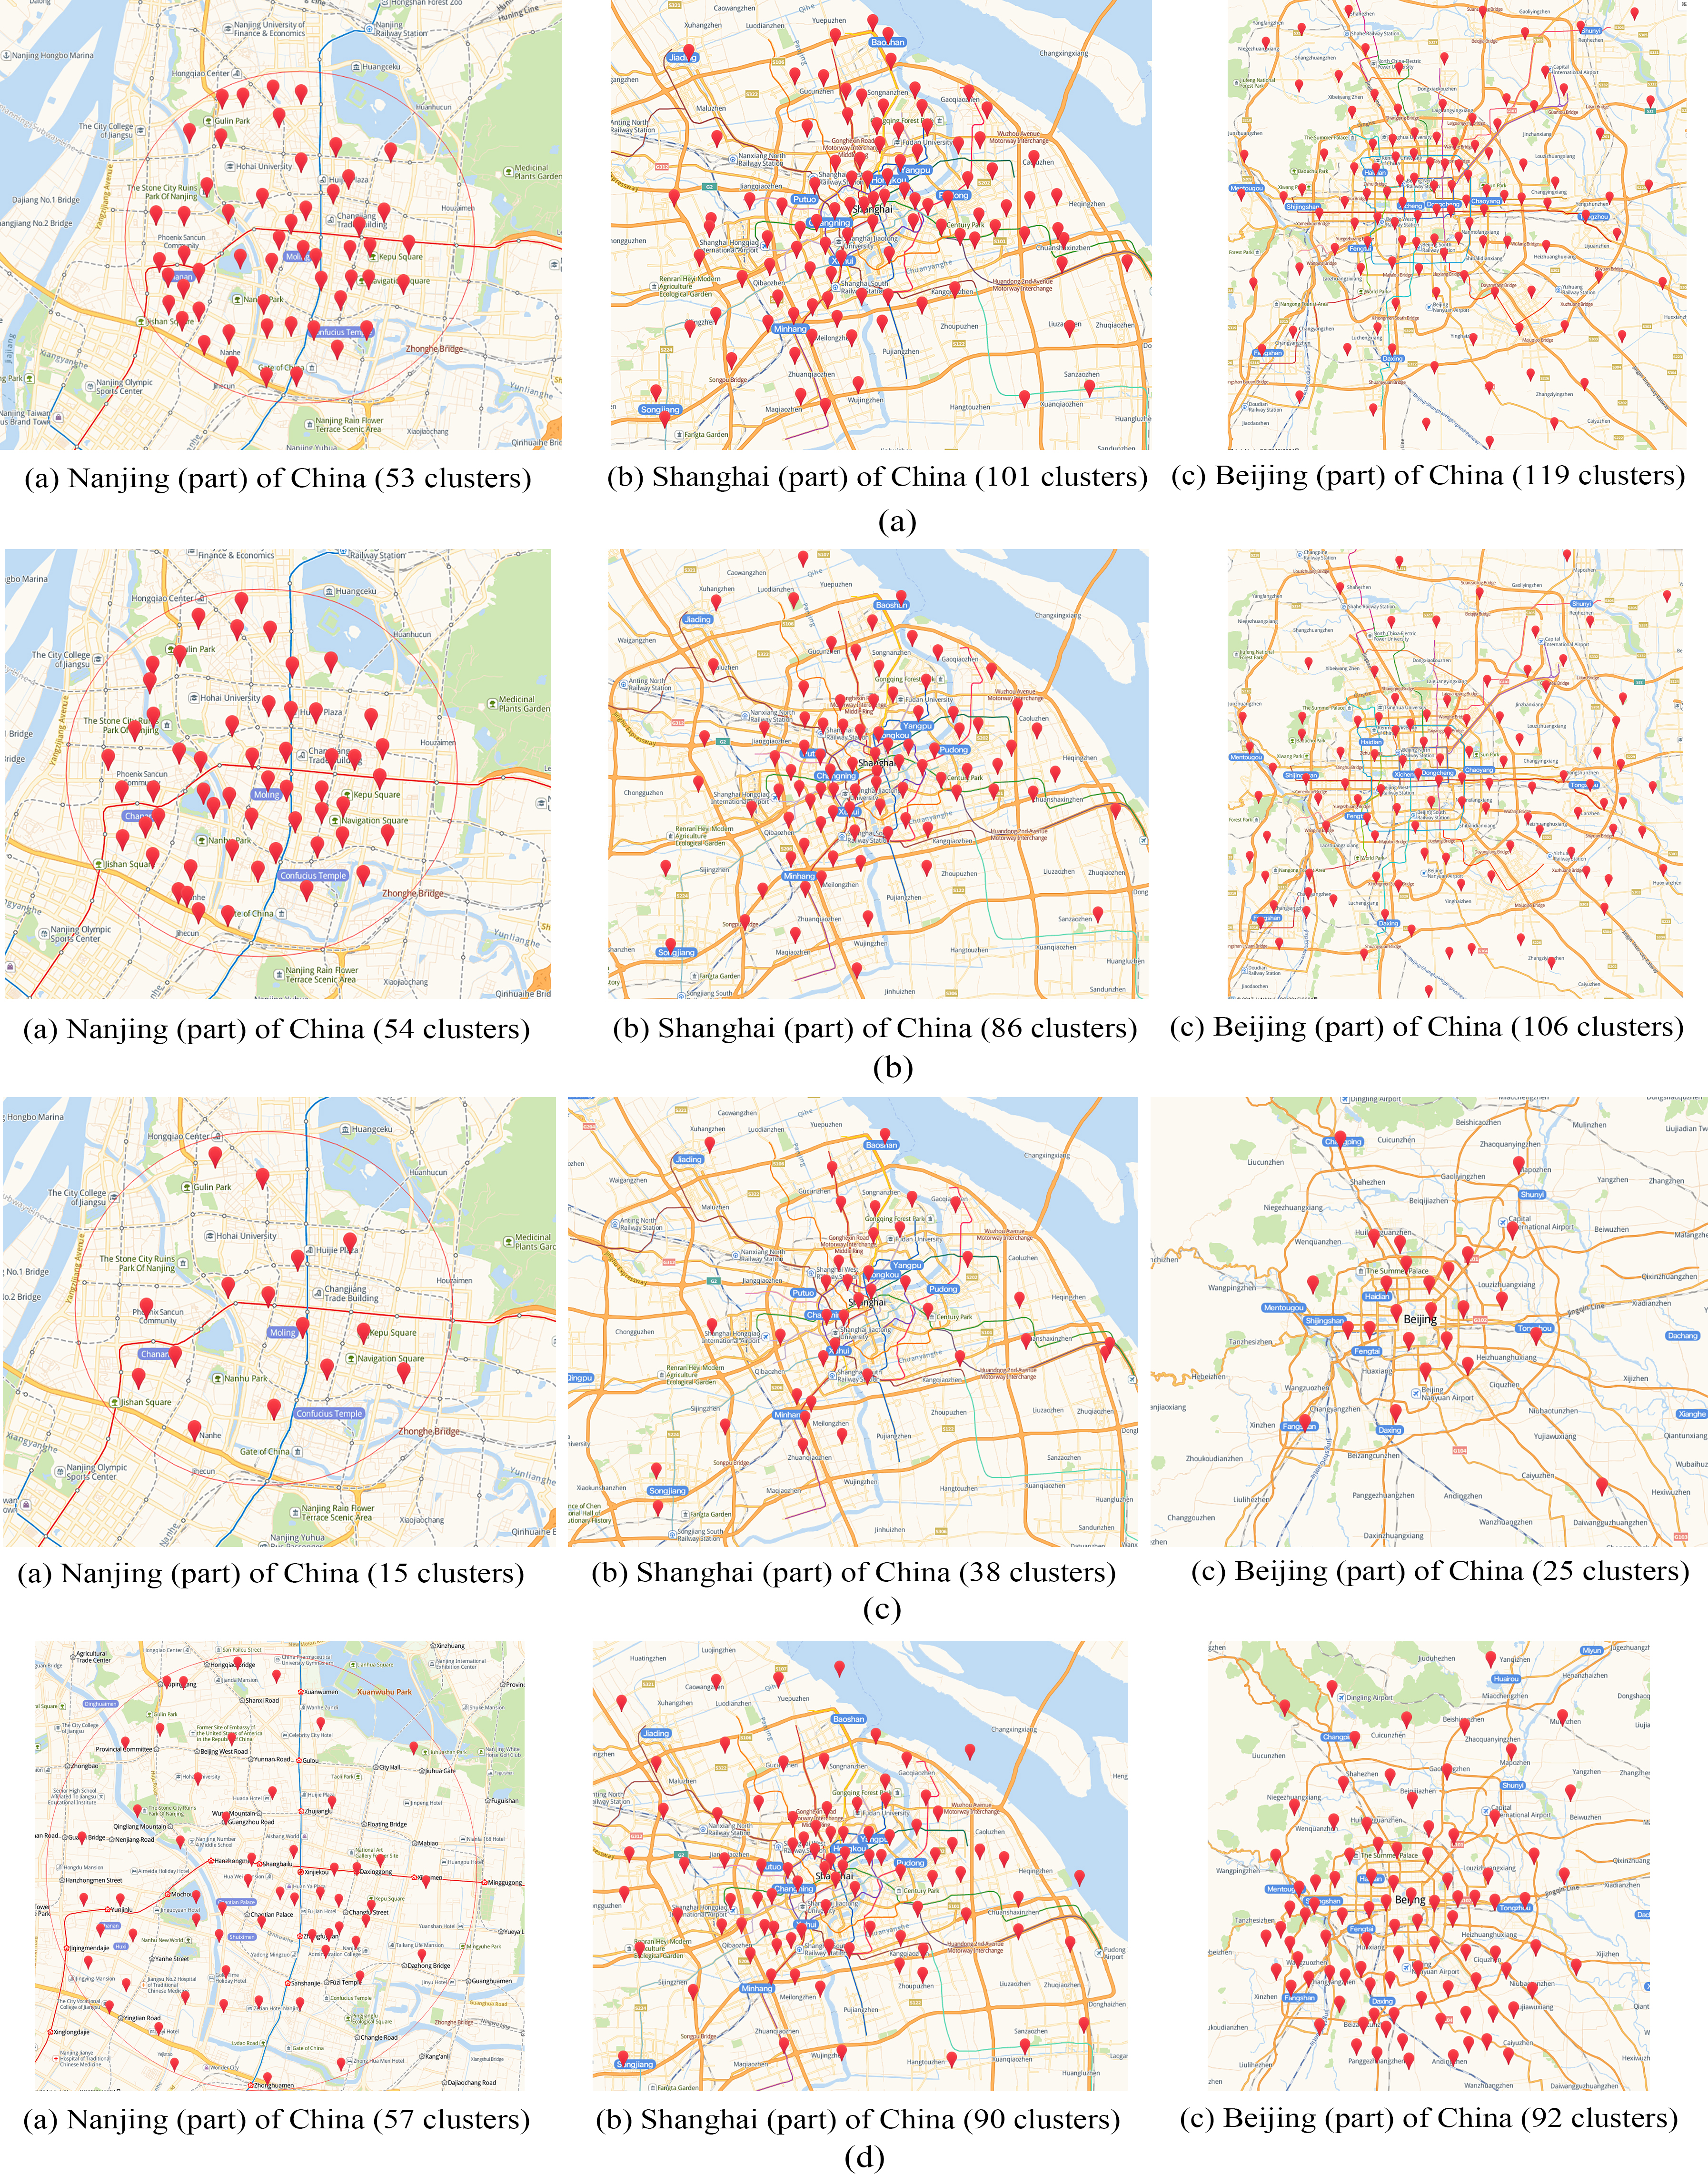
Figure 4a shows that 53, 101, and 119 clusters were obtained for the Nanjing, Shanghai, and Beijing taxicab data, respectively, by NicheClust using SSE. Each cluster center can be used to reflect places with traffic flow information and high-density populations. From Fig. 4b, we obtain 54, 86, and 106 clusters for the Nanjing, Shanghai, and Beijing taxicab data, respectively, by the NicheClust algorithm using DBI. The resulting clusters are distributed in a similar manner to SSE, but the positions of the cluster centers are different. From Fig. 4c, we obtain 15, 38, and 25 clusters for the Nanjing, Shanghai, and Beijing taxicab data, respectively, by NicheClust using PBM. When PBM is used as the fitness function, it reduces the number of clusters, but still reflects the city’s population migration distribution. From Fig. 4d, we obtain 57, 90, and 92 clusters for the Nanjing, Shanghai, and Beijing taxicab data, respectively, by the NicheClust algorithm using COSEC. This clustering result also reflects traffic and population flow information.
To evaluate and validate the performance of the GA-based clustering results (for NicheClust, GenClust, and GAK), several index models are used as evaluation criteria: separation (SP) [17], silhouette coefficient (SC) [3], stability (S) [17], and the run time (RT) in Table 3; the experimental results are given in Table 4.
The evaluation criteria
The evaluation criteria
The SP, S, SC, and the run time (RT) are shown in Table 4. It is evident from this table that these index values and times over 20 runs obtained by the four fitness functions (SSE, DBI, PBM, and COSEC) of the different algorithms (NicheClust, GenClust, and GAK) are better across the three GPS location datasets in Table 2.
Table 4 shows that the results of the three GA-based clustering algorithms are acceptable with regard to the measures of SP and SC. It can also be seen that NicheClust provides the best clustering results based on SP and SC in comparison to GenClust and GAK. Firstly, it is seen that NicheClust often generates compact and dispersed clusters based on SP in comparison to the other algorithms. Secondly, Table 4 provides the average SC index scores, which indicate that NicheClust also has better clustering solutions than GenClust and GAK. NicheClust not only generates compact clusters, but also produces well-separated clusters. Thirdly, in order to compare the execution time of each algorithm for the different fitness functions, three GPS location datasets are used for each algorithm: 1) GAK runs for the longest time and GenClust runs for the least time with SSE; 2) NicheClust runs for the longest time and GAK runs for the least time with DBI; 3) GAK runs for the longest time and GenClust runs for the least time with PBM, but GenClust has only two clusters corresponding to the lesser run time; and 4) GenClust runs for the longest time and NicheClust runs for the least time with COSEC.
Also, Table 4 shows the stability (S) results obtained for NicheClust, GenClust, and GAK for the three GPS location datasets. The stability of the clustering results indicates that higher values have lower output changes and are always preferable [17]. The table shows that the stability obtained by NicheClust is better than that obtained by GenClust and GAK, besides PBM in the GenClust algorithm, for the same GPS location datasets with the different fitness functions. A few of the stability values for GAK are good for small location datasets. However, Table 4 indicates that GAK has the lowest stability values for GPS location datasets with large amounts of data. Finally, the stability values for NicheClust are better than GenClust, except for PBM.
The experimental results show that the overall efficiency and performance of NicheClust is more effective than GenClust and GAK, and it is easy to find cluster centers which reveal people’s activities
Comparison of three GA-based clustering algorithms (the average values of 20 independent experiments) using the four fitness functions on cluster evaluation criteria: SP, SC, S, and RT for the three GPS location datasets
and reflect the city’s traffic information. In particular, the whole clustering process of NicheClust is smooth and it is easy to obtain a global optimal solution. In addition, the NicheClust algorithm can be used to maintain population diversity and obtain global convergence.
To compare the dissimilarity between NicheClust, GenClust and GAK clustering algorithms for the results of SC, SP and stability, according to [63], a nonparametric statistical method (called the Wilcoxon rank sum test (WRST)) is used. The test determines whether the differences between the algorithms are significant when the GPS location datasets are independent. There are two outputs,
The WRST test results of SC, SP, and stability between NicheClust, GenClust, and GAK over 20 independent experiments. A significance level of
In WRST,
Clustering usually provides a common means of identifying structure in a given data set. However, how to estimate the proper number of clusters, find better cluster centers and obtain an optimal solution have been recognized as the most difficult problems in cluster analysis. In this paper, we have presented a novel automatic K-means clustering algorithm based on a niching genetic algorithm with hybrid K-means for clustering problems. The proposed algorithm can determine the number of clusters and the selection of initial seeds, and can avoid local convergence. The evidence of the experimental evaluation and statistical analysis indicate that NicheClust provides solutions of higher quality and better performance with equivalent computational resources for three GPS location datasets. However, NicheClust still has a high computational cost (see Table 4). A novel clustering algorithm based on fuzzy operators with noise will be developed in the future to improve this cost.
Footnotes
Acknowledgments
This paper was supported by the Sichuan Science and Technology Program (2018GZ0177, 2016ZR 0129), the Research and Innovation Team of Universities and Colleges in Sichuan Province of China (15DT0039), Scientific Research and Innovation Team of Sichuan Tourism University (18SCTUTD06), the Provincial Discipline Open Platform Project of Xi Hua University (SZJJ2015-060).