
Abstract
In machine learning, classification involves identifying the categories or classes to which a new observation belongs based on a training set. The performance of a classification model is generally measured by the classification accuracy of a test set. The first step in developing a classification model is to divide an acquired dataset into training and test sets through random sampling. In general, random sampling does not guarantee that test accuracy reflects the performance of a developed classification model. If random sampling produces biased training/test sets, the classification model may result in bias. In this study, we show the problems of random sampling and propose balanced sampling as an alternative. We also propose a measure for evaluating sampling methods. We perform empirical experiments using benchmark datasets to verify that our sampling algorithm produces proper training and test sets. The results confirm that our method produces better training and test sets than random and several non-random sampling methods can.
Introduction
Classification is a supervised learning technique that has wide practical applications in such areas as disease diagnosis, document classification, fraud detection, and customer churn detection. Classification is the problem of allocating new observations to specific categories based on a training set of data containing instances whose category membership is already known. Logistic regression, support vector machine (SVM), decision trees, artificial neural network, k-nearest neighbor (KNN), and Bayesian classifier are all well-known algorithms. Figure 1 summarizes the general building process of a classification model. In the first step, we divide a prepared whole dataset into training and test sets. A portion of the training data is separated into a validation set. A validation set is generally used for parameter tuning to select the best training model. After obtaining the final learned model, we evaluate the performance of the model using the test set. Classification accuracy using the test set (test accuracy) is a typical measure of the performance of a learned model.
Basic classification accuracy statistics from 1000 random sampling trials (SD: standard deviation)
Basic classification accuracy statistics from 1000 random sampling trials (SD: standard deviation)
Development of a classification model.
One problem is that classification accuracy depends on training and test sets. The manner in which these sets are divided affects the quality of the classification model and its performance (test accuracy). A poor model may produce high test accuracy if the test dataset contains well-classified instances. By contrast, a good model may produce low test accuracy if the test set contains confused instances. To illustrate these scenarios, we generate an example dataset with two classes and 499 instances, and then select two random test sets from this generated dataset. Figure 2a shows the distribution of whole data instances within a dataset, and Fig. 2b and c show the distribution of instances of test sets A and B. In Fig. 2, the colors of dots express their classes. We can observe that test set A has clearly separated instances, whereas test set B has some overlapped instances. After building two learning models for the cases shown in Fig. 2b and c using SVM, we performed a classification test. Test sets A and B yielded a classification accuracy of 0.975 and 0.848. However, determining which result best reflects the performance of the developed classification model is difficult. This result reveals that dividing training and test sets is crucial in developing a classification model.
Distribution of instances in an example dataset.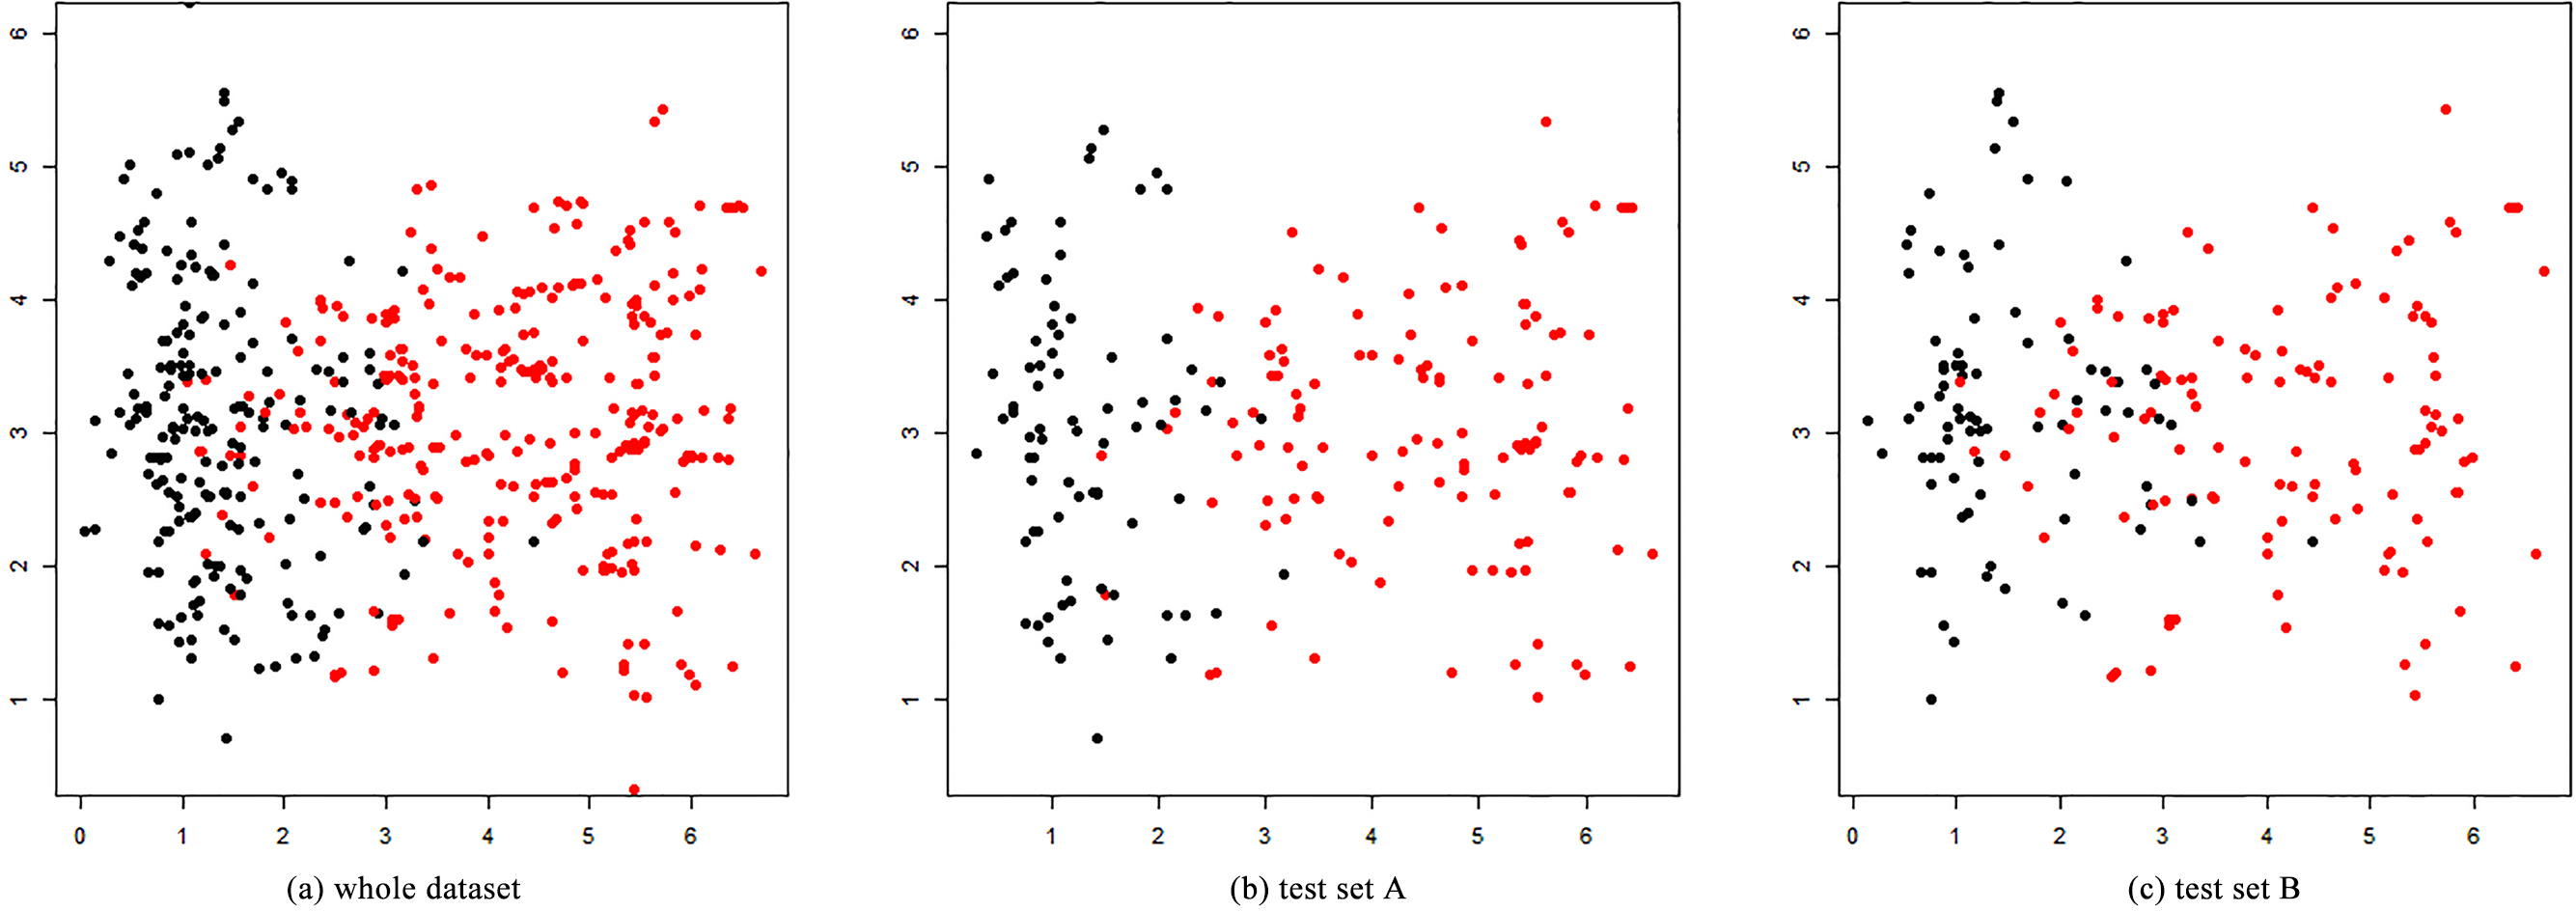
Table 1 gives random sampling statistics for the example dataset. We generate training and test sets 100 times by random sampling and calculate the classification accuracy using an SVM classifier. The mean accuracy of 0.901 may be a proper accuracy of the classification model generated using the example dataset. The table shows that the range of classification accuracy was 0.848 to 0.975, which is quite wide. Therefore, we require an improved sampling method.
Desirable training and test sets should be representative of a whole dataset. In this study, we propose a balanced sampling approach based on the degree of overlap of instances to produce representative training and test sets. In our previous work [1, 2], we showed that classification accuracy strongly depends on overlapped areas of class instances in a target dataset. Therefore, when we divide training and test sets, overlapped areas should be reflected in them. In the Section 3, we describe the degree of overlap in greater detail and propose an approach to divide training and test sets. We also present a measure to evaluate the quality of the generated sets. The proposed method is then compared with previous methods using our evaluation measure. Several previous sampling methods are described in related works section. A k-fold cross validation has been proposed to overcome the overfitting problem in classification. It makes k training models and mean of test accuracies is considered as an evaluation measure for parameter tuning of a model or comparison of different models. The purpose of k-fold cross validation is different from sampling methods. Therefore, we do not compare proposed method and k-fold cross validation.
Random sampling [3, 4] is widely used to divide training and test sets from a whole dataset. However, random sampling does not indicate how and why certain instances are chosen for such sets [5, 6, 7], and sometimes it produces very different evaluations for classification models built on the same dataset. Stratified sampling is a kind of random sampling. It randomly chooses same ratio of instances from each class of a dataset. The goal of stratified sampling is to ensure training and test set have equal ratio of instances from whole classes. Oversampling or undersampling deal with imbalance problems of classes. In some case, class A has lots of instances whereas class B has small instances. In that case, we can choose higher ratio of instances from class B than class A to balance class distribution in a training/test sets. It also a kind of random sampling.
Other methods to generate training and test sets have been proposed. For example, various clustering-based approaches were introduced in [8, 9, 10, 11, 12]. In the first step of these types of methods,
Hudson et al. [11] presented the most descriptive compound method (MDC), and Martin and Critchlow [12] proposed D-optimal designs to divide training and test sets. The goal of MDC is to select a subset of chemical compounds that most effectively represents the compounds in the original population. The information value of a compound is evaluated as the sum of reciprocal values of ranks of distances to other compounds [13]. Algorithm 2 describes the MDC method.
The purpose of the D-optimal design is to select an optimal set of instances for model building. The D-optimal design selects instances such that potential errors in descriptors minimally affect an assumed (usually linear) model. Possible model errors are not considered. Therefore, the selected instances will always be on the outer surface of the space occupied by the candidates. A close distance of any two points does not decrease the D-optimal quality of the design [14]. Algorithm 3 describes the D-optimal method.
Materials and methods
The degree of overlap is a core concept of the proposed balanced sampling. We next introduce the concept of degree of overlap and propose a balanced sampling algorithm based on that concept. To compare the proposed and previous methods, an evaluation measure that we call a mean accuracy indicator (MAI) is introduced.
Two example datasets having three classes.
Overlapping area between two classes in a dataset.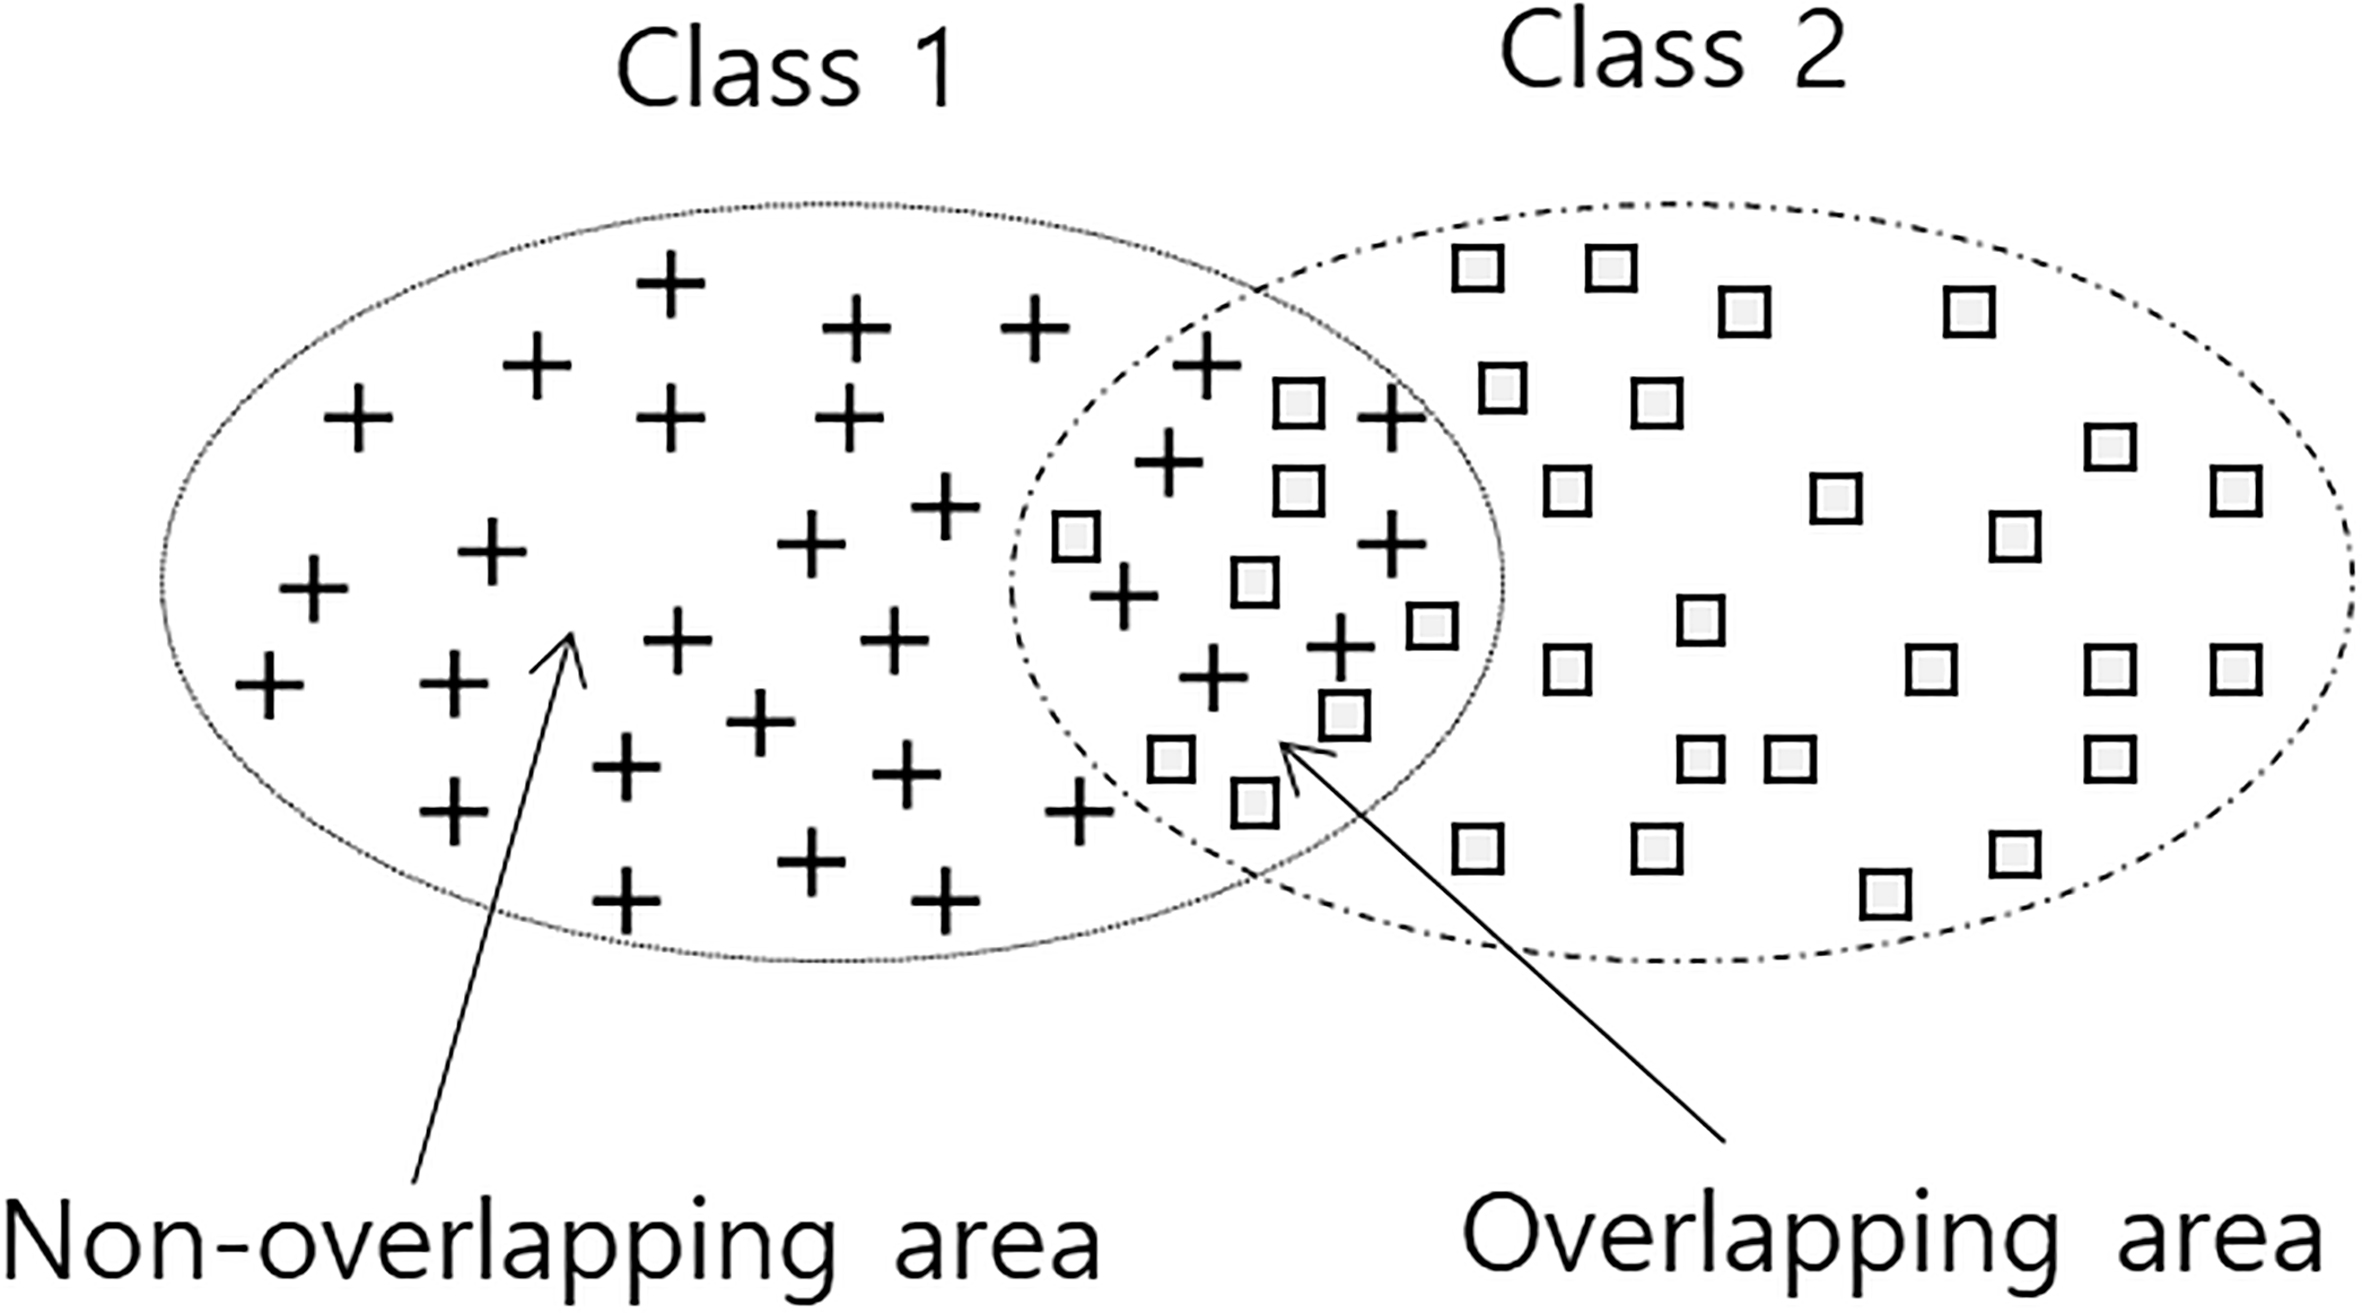
The classification accuracy of a dataset depends on the characteristics of that dataset. Dataset A (Fig. 3a) has three classes, and the instances of each class are clearly separated compare to the instances in Dataset B (Fig. 3b). In other words, the class-overlapping area of Dataset A is smaller than that of Dataset B. We know intuitively that Dataset A produces higher classification accuracy than does Dataset Lee et al. [14] proposed an R-value measure to evaluate the quality of datasets. It is based on the ratio of overlapping areas among classes (categories) in a dataset. Figure 4 presents the concept of an overlapping area. If a data instance is located in an overlapping area, correctly classifying it is difficult. The R-value measures the size of the overlapping area. Based on the R-value, we define the degree of overlap of each data instance. First, we take the
Five-nearest neighbors for center instance (blue rectangle).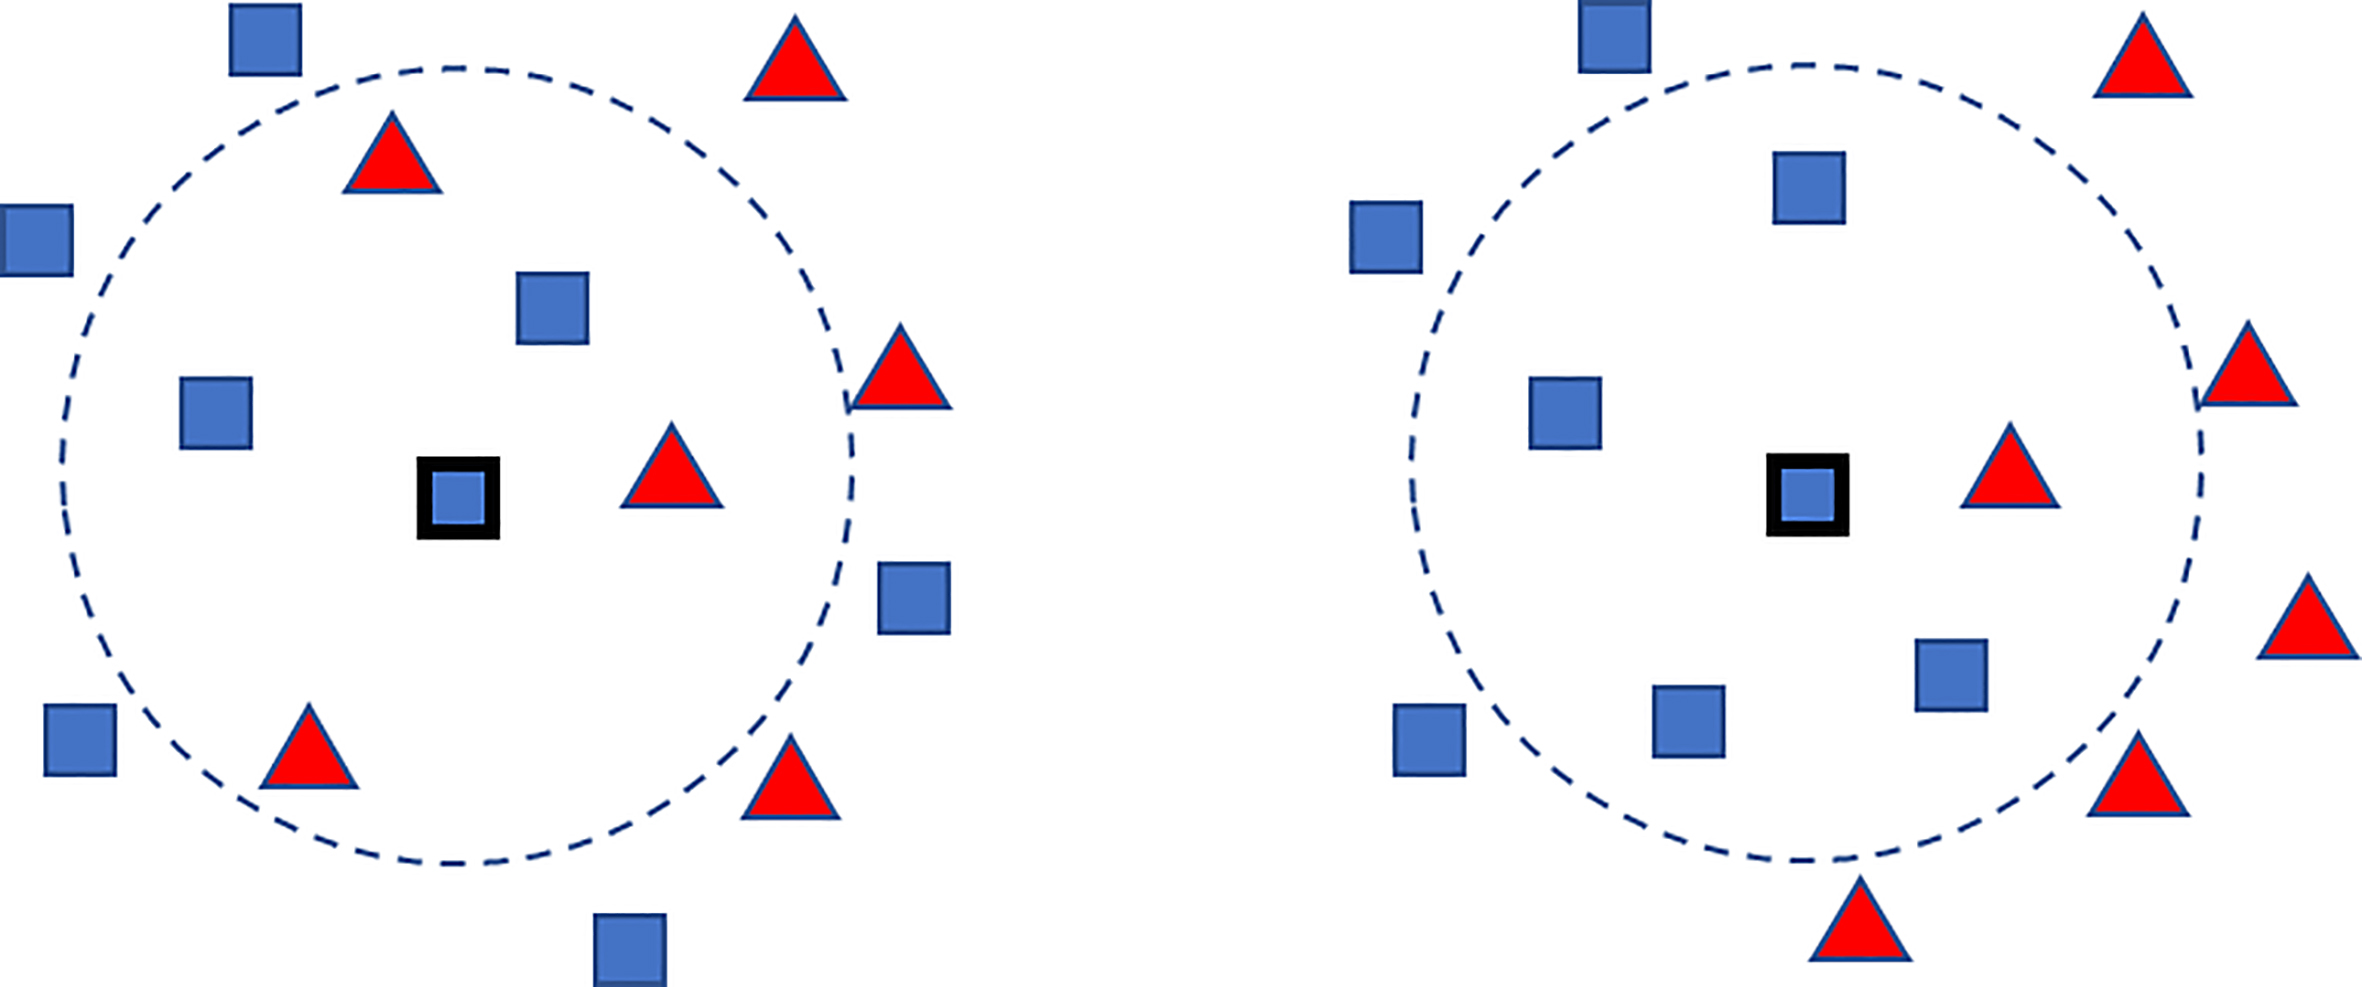
Distribution of degrees of overlap for each instance in Fig. 2a (
Before we provide a formal description of balanced training and test set sampling, we must define the following notations.
DS: given dataset
The procedure for balanced training and test sampling is as follows:
Calculate the DO of every instance From each group, randomly choose
Algorithm 4 contains pseudo-code for balanced training and test sampling.
If we want to develop or choose a sampling method to generate training and test sets, we need to include an evaluation measure in the sampling method. To evaluate the quality of generated training and test sets, we must define – because we cannot directly know what constitutes – desirable ones. However, we may expect that desirable training and test sets should be representative of a whole dataset. In other words, the distribution of instances in training and test sets should be similar to the entire dataset. One-time random sampling may not meet this qualification. If we repeat the random sampling infinitely, the average of the generated test accuracies may converge to a single value. We can determine a proper evaluation value for a given dataset and call it an absolute evaluation value (AEV). From a practical point of view, infinite random sampling is impossible. Therefore, in this study, we performed 100 iterations of random sampling to obtain the AEV. If training and test sets from a sampling method produce a similar accuracy to the AEV, then the method is proper for developing and evaluating classification model. Using AEV, we propose the previously defined MAI as an evaluation measure for a sampling method. Suppose we have a dataset
where test_acc
where ACC refers to the test accuracy derived from model
Summaries of the benchmark datasets
The performance of a sampling method can be measured using an MAI based on a specific dataset and classifier. In our experiments, we tested various datasets and classifiers to compare the proposed and previous sampling methods.
Benchmark datasets, compared sampling methods, and classifiers
To compare the proposed and previous sampling methods, we used benchmark datasets that have various numbers of features (attributes), classes, and instances. The datasets were collected from the UCI Machine Learning Repository (
We compared the proposed method to previous methods such as random sampling, D-optimal, MDC, and clustering-based sampling. For clustering-based sampling, we used the k-means clustering algorithm (where k is the number of classes). To achieve classification accuracy, we tested KNN, SVM, random forest (RF), and C5.0 (C50) classifiers. They were implemented in the R package (
Summary of classifiers and applied parameters
Summary of classifiers and applied parameters
Procedure for calculating MAI.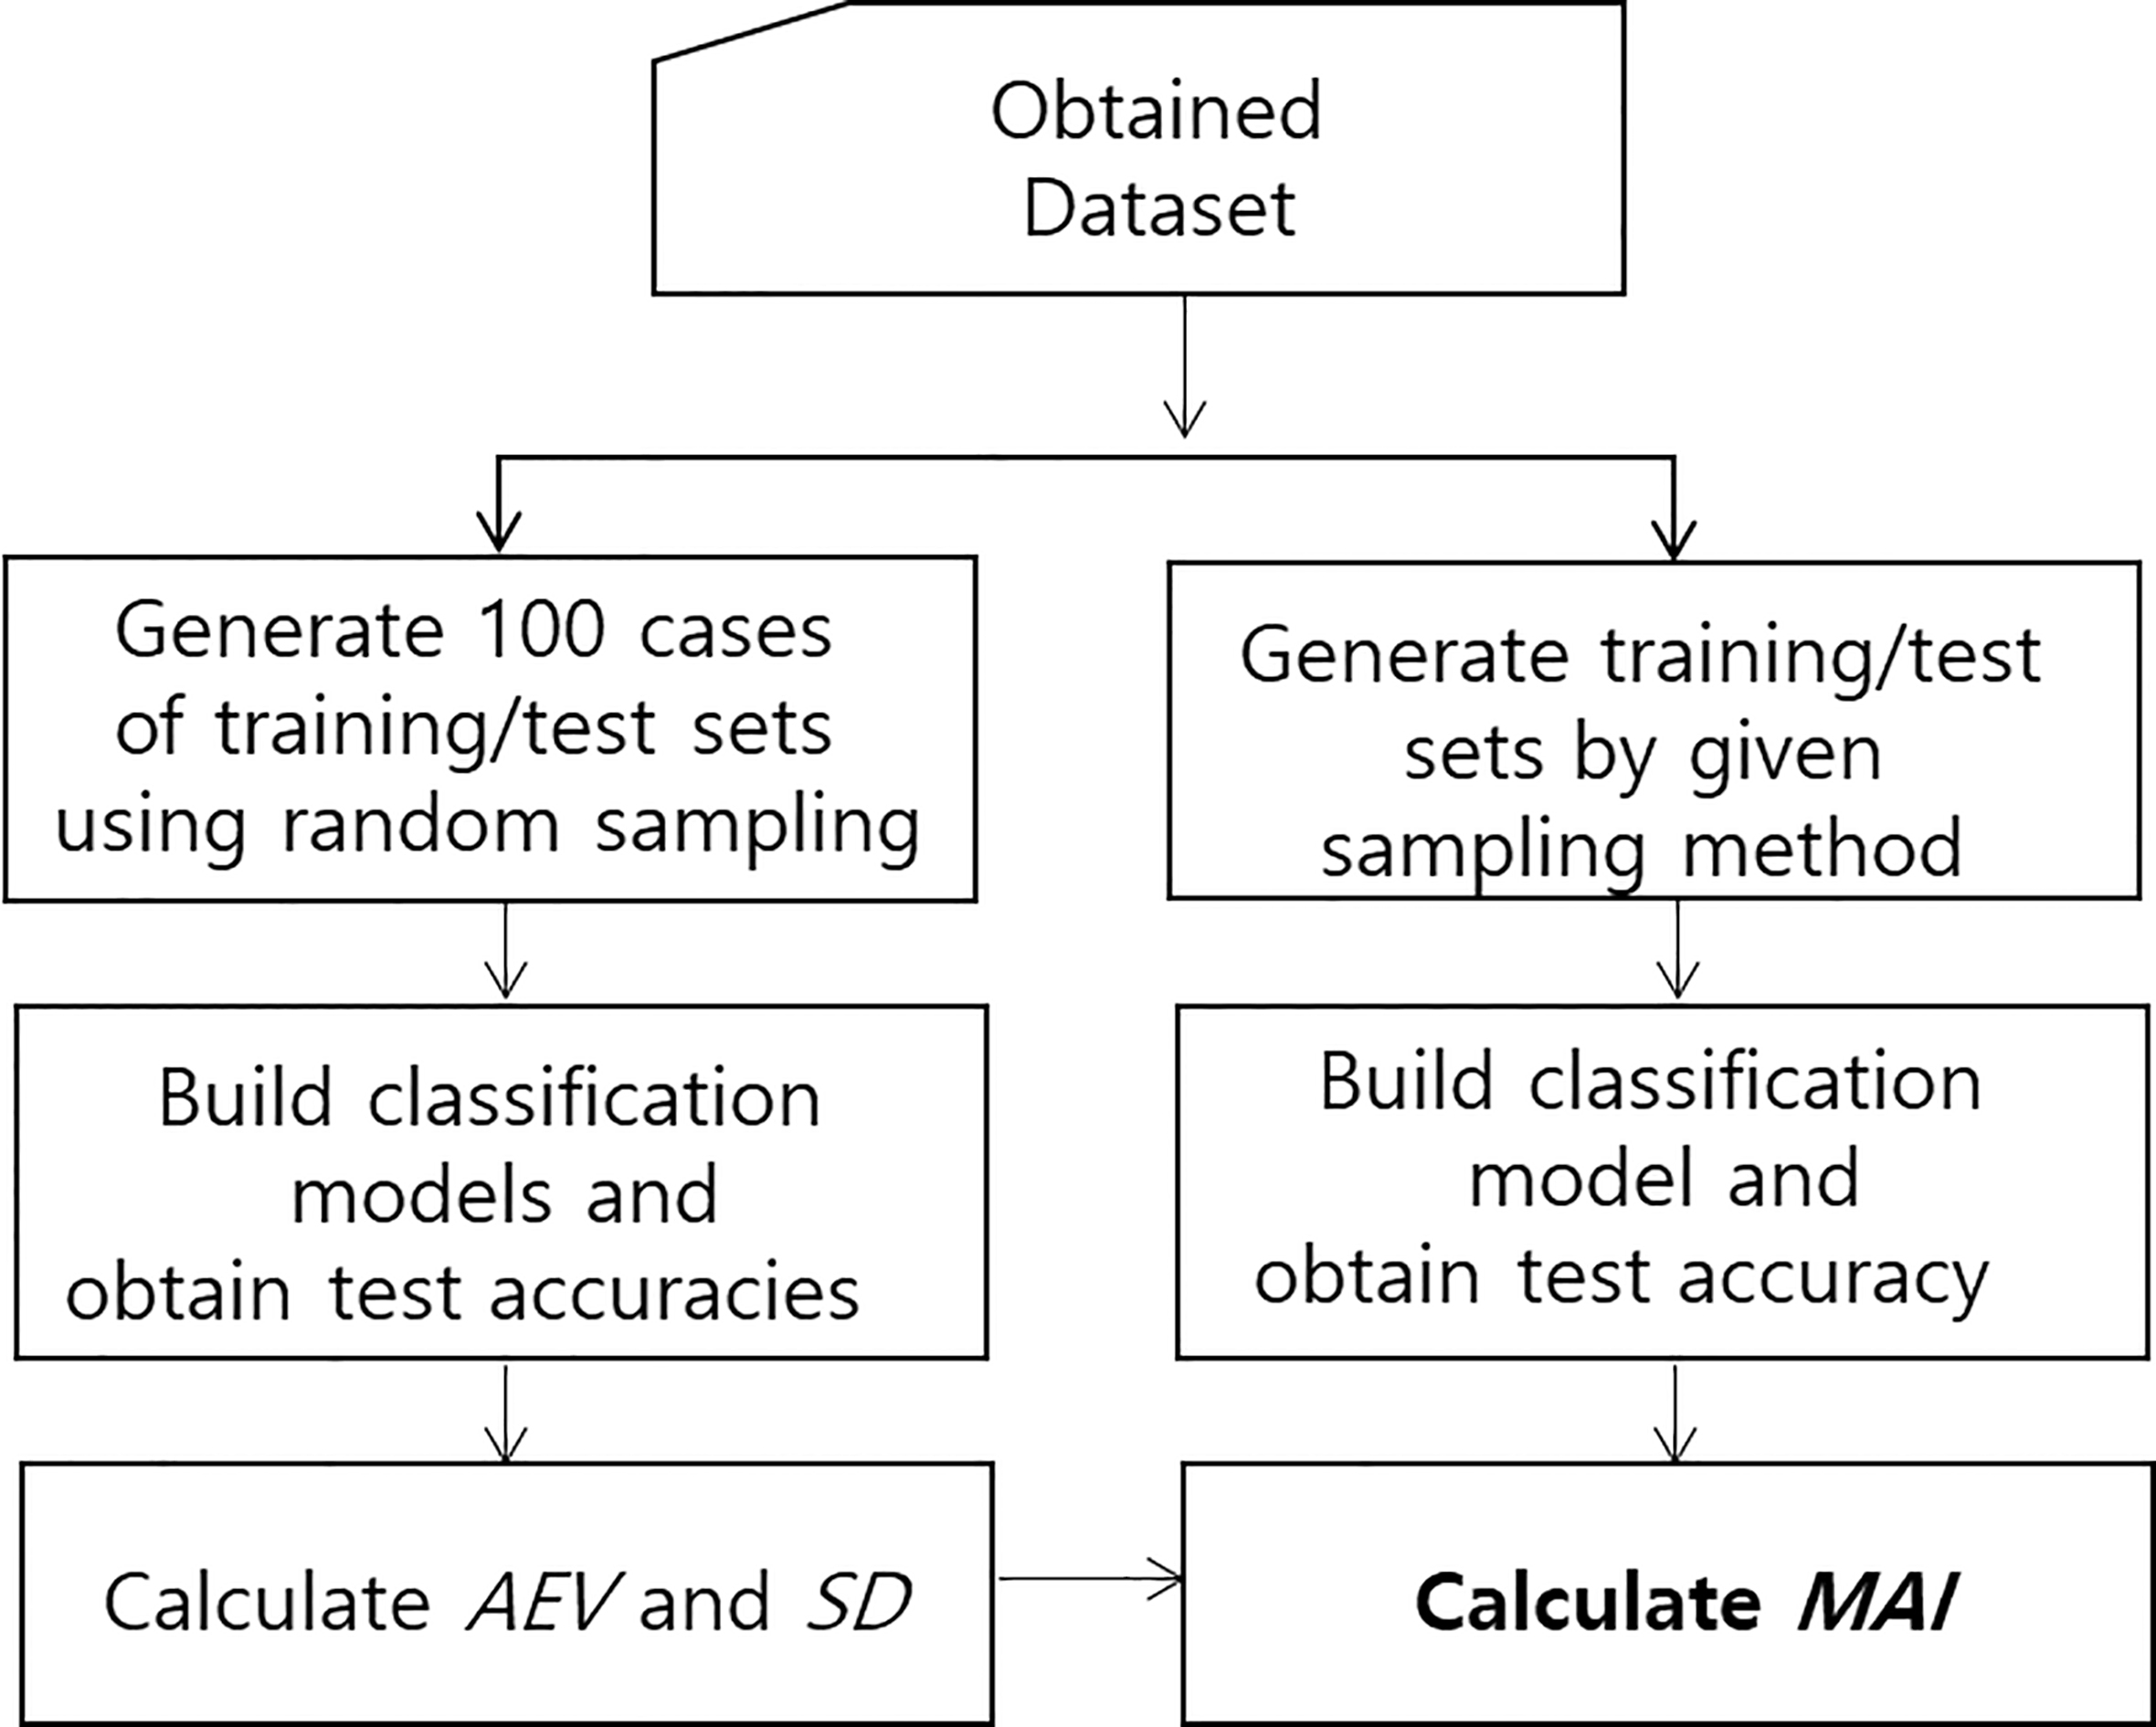
Table 4 lists basic statistics related to our experiment on benchmark datasets. From the 100 iterations of random sampling, we obtained max, min, mean, and SD by four classifiers for a given dataset. We also obtained classification accuracies for the proposed and five previous sampling methods.
Estimation of accuracy using random sampling and split method accuracy (RS: Random sampling, DO: D-optimal, CB: Clustering-based)
Estimation of accuracy using random sampling and split method accuracy (RS: Random sampling, DO: D-optimal, CB: Clustering-based)
Table 5 summarizes MAI values of the proposed and five previous sampling methods with 10 datasets and four classifiers. Based on the definition of MAI, the smaller the MAI value, the better the sampling result will be. The average absolute value of MAI for the proposed method was 0.747, whereas previous methods showed 1.863, 1.647, 2.206, 1.983, and 1.770. As previously mentioned, the ideal value of MAI is 0; that of the proposed method was closer to 0 than were the previous methods. Thus, the proposed method produced better training and test sets than did the previous methods. The SD for the absolute value of MAI for the proposed method was 0.586, whereas the previous methods had SDs of 2.492, 2.692, 2.366, 2.540, and 2.443. This means that the proposed method produced stable results with less variability than did the other methods.
MAI for the proposed and three previous sampling methods (RS: Random sampling, DO: D-optimal, CB: Clustering-based)
Figure 8 is a box plot that shows the results of Table 5. In the box plot, each point refers to a value of
Box-plotted distributions of MAI values.
The goal of dividing training and test sets is to minimize the bias of test accuracy. We want the performance of our developed model to reflect exactly the quality of a given dataset. Some training and test sets overestimate classification models and some underestimate. Our experiments confirmed that the proposed balanced sampling method produces better training and test sets for developing classification models than do previous methods. As previously mentioned, classification accuracy strongly depends on overlapped areas between class areas. The proposed method is based on overlapped areas and thus reduces any bias in classification accuracy. In the case of D-optimal sampling, data in overlapped areas are excluded to obtain a training set and this leads to bias in test accuracy. In the MDC method, the chosen probability of data in dense areas is higher than in sparse areas. It also produces bias in test accuracy.
To examine how the size of a dataset affects data sampling, we split the dataset into two groups. Datasets in which each class has over 500 instances belong to Group A, and all others belong to Group B. Table 6 list the average absolute values of MAI for the two groups of datasets. As we can see, the difference in MAI between the proposed and previous methods in Group B is smaller than in Group A. This reveals that the size of the dataset strongly affects the quality of sampling results. The larger the dataset, the greater the MAI value, which means that the bias in test accuracy increases. In Table 6, the “Diff” column refers to the difference in MAI between the proposed and average of other methods. Table 6 also shows that the proposed method is less affected by the dataset size than are the previous methods.
Average absolute values of MAI for two groups of datasets (RS: Random sampling, DO: D-optimal, CB: Clustering-based)
Average absolute values of MAI for two groups of datasets (RS: Random sampling, DO: D-optimal, CB: Clustering-based)
If a dataset has clearly separated class areas, any sampling method can produce good training and test sets, and the difference in MAI between the proposed and previous methods may be small. For example, the well-known iris dataset (
Average MAI of four classifiers for the iris dataset (RS: Random sampling, DO: D-optimal, CB: Clustering-based)
Stratified sampling and oversampling/undersampling are basically kinds of random sampling. They focus on ‘class balance’ in training/test sets. Proposed method can be easily combined with them. For example, we can apply proposed sampling method to each class instances and merge them by stratified sampling way.
How to divide an obtained dataset into training and test sets considerably affects a classification model. In our study, we proposed a balanced sampling method that showed better performance than did previous methods. Particularly, it was highly efficient in processing large datasets. The proposed MAI measure was helpful in evaluating the sampling method and can be used to develop new sampling methods. Because outlier data instances in our study influenced the classification model, a sampling method should consider outliers, which is a topic for future research. It is also interesting to study how the combination of sampling methods and classification algorithms affects classification accuracy. Sampling methods with considering imbalanced classes is another research topic. The proposed balanced sampling method and MAI calculation algorithm were implemented using R, and the source codes are posted at:
Footnotes
Acknowledgments
This work was supported by the ICT and RND program of MIST/IITP [2018-0-00242, Development of AI ophthalmologic diagnosis and smart treatment platform based on big data].