
Abstract
Among FinTech research and applications, forecasting financial time series data has been a challenging task because this kind of data is typically quite noisy and non-stationary. A recent line of financial research centers around trading through financial data on the microscopic level, which is the holy grail of high-frequency trading (HFT), as the higher the data frequency, the more profitable opportunities may appear. The advancement in HFT modeling has also facilitated more understanding towards price formation because the supply and demand of a stock can be comprehended more easily from the microstructure of the order book. Instead of traditional statistical methods, there has been increasing demand for the development of more reliable prediction models due to the recent progress in Computational Intelligence (CI) technologies. In this study, we aim to develop novel CI-based methodologies for the forecasting task of price movement in HFT. Our goal is to conduct a study for autonomous genetic-based models that allow the forecasting systems to self-evolve. The results show that our proposed method can improve upon the previous ones and advance the current state of Fintech research.
Introduction
Among the research and application areas of FinTech, the forecasting of stock price and returns on investment has been a challenging task because many types of financial time series data are quite noisy and non-stationary in nature [1]. In light of these difficulties, there has been increasing demand for the research and development of more reliable stock market prediction models due to the recent advancement in the areas of big data and machine learning. Most early studies along this line of research tended to employ statistical methods, but when applied to the real-world financial problems, typically these methods become ineffective due to the statistical assumptions adopted, including linearity and normality [2]. In order to tackle nonlinearity and complex characteristics of financial time series data for financial forecasting, various computational intelligence (CI) and machine learning (ML) techniques have been developed, such as evolutionary algorithms (EA), artificial neural network (ANN), support vector machines (SVM) and fuzzy systems.
With recent advancement of information technology in financial applications, the ever-growing, sheer volume of transaction data has been constantly generated every day. This tremendous amount of data provides researchers and practitioners with great opportunities to gain useful insights to construct innovative artificial intelligence (AI) models for investment and trading. In this work, we aim to develop novel methodologies for research and applications in the context of high-frequency trading (HFT). In the next section, we provide a literature survey on the relevant financial and machine learning background for this study.
Related works
Financial background
The advances of computer power and electronic trading nowadays have led to the significant development of automated trading operations. A new breed of automated trading technology, called high-frequency trading (HFT), has emerged and generated financial time series data ranging from the granular data of financial transactions at regular intervals of several seconds, to the price data irregularly spaced with quotes arriving randomly at a tiny fraction of seconds. The data thus gathered comprises most-detailed, microscopic logs for every submitted order to the internal matching engines of financial exchanges, which can be used to reconstruct the Limit Order Book (LOB). As a result, the mechanism of HFT provides plenty of resource for financial modeling in big data research, which is far beyond the capacity of traditional on-hand database management and data processing tools [3].
In the big data era, there is a seemingly endless amount of data produced every day, and financial modeling gets constrained by only the brain power and imagination of the quant at work. Therefore, innovative modeling techniques and tools have to be developed to evaluate thousands (or tens of thousands or even more) of investment vehicles simultaneously for insights not apparent to human eyes. Furthermore, from the point of view of model validation, the characteristics of the HFT data can present researchers with a wealth of information not available in traditional low-frequency datasets. As a result, the sheer volume and diversity of HFT data can make short-term estimation and forecasting more practical.
In HFT research, limit order book data can be used for a variety of tasks, such as the estimation of the future price trend or the regression of price volatility. This kind of microscopic data may be used for the early prediction of anomalous events, including extreme changes in price which indicates potential stock manipulation in the markets, as well. These LOB applications offer valuable instances to assist investors to protect their capital when unfavorable conditions show up in the markets or, conversely, take advantage of them to profit [4]. Therefore, trading through the market microstructure data is the holy grail of high-frequency trading [5].
Over the past several years, HFT has been playing an important role in global financial markets due to the massive increases in trading volumes [6]. Typically, the performance of a HFT forecasting system may be contingent upon how orders in microscopic levels are scheduled, i.e., when and how much a trade shall be placed, and the probability of being filled, etc. Therefore, understanding the dynamics of the micro-structural, order-driven LOB is crucial to HFT modeling and strategy design because it shall shed light on the macroscopic characteristics of price formation and forecasting.
Recent research and advances in HFT modeling have facilitated the understanding towards the nature of price formation because the supply and demand of a stock can be comprehended more easily from the microstructure of the order book. Several studies have been conducted in order to acquire further insight towards the dynamics of the order book data at the high frequency scale. The seminal work of Smith et al. [7] suggested a mean-field approach to study the behavior of the limit order book. Later, Bouchaud et al. [8] investigated how to fit the parameters of laws of order sizes and arrival rates. The direction of the price movement under different states of the first limits of the LOB have been studied, as well [9]. Relevant studies concerning the pressure and effect of volume imbalance on the price at larger time scales have been presented in [10, 11]. Furthermore, the estimation of parameters for HFT can be seen in [12, 13, 14]. More recently, the machine learning-based studies for HFT have been presented, and we provide literature review for several of them in the next subsection.
Review of relevant computational intelligence and machine learning literature
In the past decades, there have been a number of computational intelligence (CI) approaches studied for financial applications ranging from fuzzy systems, artificial neural networks (ANNs), support vector machines (SVMs) and evolutionary algorithms (EAs), to hybrid and ensemble models, along with other approaches [15]. These methods have been recently used to solve a wide range of application problems, including abnormal noise and fraud detection [16, 17], arbitrage [18, 19], bankruptcy detection [20, 21], financial forecasting [22, 23, 24], as well as portfolio optimization [25, 26, 27].
It is worthwhile to mention that the more recently emerging deep learning methods, including Recurrent Neural Networks (RNN), Long-Short Term Memory (LSTM) networks, have been proposed for the prediction of financial time series [28, 29]. In particular, for high frequency trading, Dixon [30] applied RNN to classify the movements of short-term price from the LOB data of the S&P500 E-mini futures. In [31] the LOB data was also studied by the proposed neural networks, together with multilinear methods and smart feature selection for the prediction of the future price movements. In [32, 33], using a large-scale high-frequency LOB dataset, the authors utilized three DL models, including the Convolutional Neural Networks, the LSTM Recurrent Neural Networks, and the Neural Bag-of-Features models, to forecast the mid-price movement, as well.
In order to systematically optimize the network architecture in terms of the number of hidden layers and nodes required, Chung and Shin [34] proposed a GA-based method to optimize the LSTM topology and showed their method offers better performance for daily stock price prediction. There exist other studies that used search algorithms to optimize RNN for financial applications, as well. For instance, Kim and Han [35] optimized the connection weights among layers of the ANN and used the GA for feature discretization to reduce the dimensionality of feature space and determine the optimal range for the connection weights of the ANNs in order to predict the stock price index. Cai et al. [36] combined Particle Swarm Optimization and Evolutionary Algorithm with RNN to estimate missing values in time series data. Rather et al. [37] proposed linear models integrated with the RNN, and used the GA to search for optimal weight of RNN for the prediction of stock returns.
Although there exist many aforementioned CI methods developed for solving various financial problems, a recent comprehensive survey by Aguilar-Rivera et al. [38] indicated that genetic algorithms (GA, a branch of evolutionary algorithms) have remained one of the most popular approaches in CI literature for financial research and application problems. Among several CI-based financial studies, forecasting is a subject that has been extensively investigated, which is typically concerning with the estimation of future values of financial products for investment. For instance, Araújo and Ferreira [23] proposed the GAs to search for optimal linear filters in forecasting applications and showed that their proposed models outperformed the benchmarks.
In addition to the GA-based methods, the class of Genetic Programming (GP) has been used for similar forecasting tasks. For example, Shao et al. [39] proposed an improved GP-based financial forecasting method for Evolutionary Dynamic Data Investment Evaluator [40], which provided a new version of grammar to increase the search space for decision trees. The proposed method was tested against several financial time series and shown to improve the previous version in [40] for financial forecasting.
A recent branch of EA, estimation of distribution algorithms (EDAs), has been also employed in financial research problems. For example, Peralta Donate and Cortez [41] developed a NN-based forecasting model in which a univariate marginal distribution algorithm was proposed for the optimization task. Using the Dow Jones Industrial Average (DJIA) data, the authors compared their method with the ARIMA models, random forest, echo state networks, SVMs, and demonstrated that their proposed method obtained lower mean-squared error than others.
In addition to the aforementioned EA studies, various types of GA-based methodologies have been developed for financial research and applications, and an extended survey is provided in [38]. However, most of these methods that utilize financial time series data employed subsampling techniques by which the sampled data (typically daily price data) was used to reduce the number of features in the dataset, such as the OHLC (Open-High-Low-Close) candles [42] or technical analysis [43]. Although these methods preserve useful information concerning the range of price movement within the specified intervals as well as the market trend and momentum, it ignores potentially important microstructure information.
In contrast, the microscopic price structures in HFT are important because the formation of actual transaction price may be predicted from the limit order book. Therefore, these microstructures shall provide more information than macrostructures for price forecasting in HFT context. Since the review by Aguilar-Rivera et al. [38] indicates that the class of GA is one of the most popular approaches in CI literature for financial applications, we thus aim to develop an advanced CI-based methodology to tackle the forecasting task for HFT. Since our previous work in [44] has presented a study using the GA to optimize simple rule-based HFT forecasting models, which were shown to be more effective than several conventional statistical methods, including several regression-based models. In this study, we intend to extend the work in [44] to develop a more comprehensive, self-evolving autonomous GA-based system for the forecasting task. As our experimental results show later, the methodology we proposed is indeed more effective than that in [44] for the forecasting of price movement in HFT environment.
In a nutshell, the overall proposed self-evolving GA-based methodology in this study is to offer feasible CI-based models for the real-world high-frequency trading applications. We aim to advance the current state of research for the sub-class of AI methods for HFT environment, in order to shed more light on the complex characteristics in HFT problems and provide feasible solutions for the forecasting task in this area.
Methodology
In this study, as discussed in the previous section, we intend to use the micro-structured order book data generated during stock trading to construct our intelligent forecasting models for HFT applications. Before delving into the details of the methods proposed, we provide the financial background for the trading mechanism utilized in Taiwan’s stock market first.
Trading mechanism of stock market in Taiwan
In Taiwan, the major stock trading activities take place at the Taiwan Stock Exchange Corporation (TWSE) where the transactions of a stock currently occur at regular intervals of every 5 seconds and it has been scheduled to adopt the “continuous trading” system in March 2020.1
Please refer to
Current practice (valid before March/23/2020): call auction
The current stock market in Taiwan utilizes a call auction mechanism for stock trading, in which buying and selling orders during a period of time (the current interval for this period of time is 5 seconds) are first collected and matching is conducted to determine the execution price (i.e., transaction price) according to the following call-auction matching rules:
Rule of price priority: Orders are first matched according to their price priority. Rule of time priority: If the orders are of the same price, they will be matched according to their time priority. Rule of maximum trade volume: For each call auction, an execution price is selected for the greatest number of orders to be executed.
Right after matching is completed, a set of information is disclosed to the public, including the executed price and volume, the prices and volumes of both the five highest unexecuted bid quotes and the five lowest unexecuted ask quotes. Therefore, the five best bid/ask prices and volumes observed by the public are for unexecuted orders in the prior call auction. The unexecuted orders, together with the new, subsequent orders from the investors will enter into the system to participate in the next call auction.
Future practice (valid since March/23/2020): continuous trading2
Please refer to http://www.twse.com.tw/en/page/products/trading_rules/mechanism01.html .
Please refer to
Continuous trading is a trading model by which buy and sell orders are matched right after they are placed. In this trading mechanism, matching thus takes place on an order-by-order basis. The execution price is determined according to the following principles:
For the bid side: if a bid order is placed at a price higher than or equal to the lowest price of unexecuted ask quotes, the bid order will be matched against these ask quotes in their ascending order of price, until the bid order is completely satisfied, or until the price of the bid order is lower than the unexecuted ask prices. For the ask side: if an ask order is placed at a price lower than or equal to the highest price of unexecuted bid quotes, the ask order will be matched against these bid quotes in their descending order of price, until the ask order is completely satisfied, or until price of the ask order is higher than the unexecuted bid prices.
As for the principles for order execution priority, continuous trading adopts the same rules of price priority and time priority used by the call auction system. Through the continuous trading mechanism, investors do not have to wait for a particular period of time to know whether their orders are executed. Therefore, the information delay and lack of timeliness caused by the call auction system can be removed, and trading efficiency is improved.
For illustration, Table 1 shows an example of bid and ask quotes prior to matching in the limited order book.
Bid and ask quotes before matching (price in NT$ and volume in lots)
In this example, the second and third columns show the volumes of bid and ask orders for each price. The cumulative bid volume is the sum of all the bid volumes from the highest price to the current price, whereas the cumulative ask volume is the sum of all the ask volumes from the lowest price to the current price. The results are then displayed in the fourth and fifth columns. The sixth column shows the possible trade volume for each price, which is the minimum of the cumulative ask and bid volumes. The seventh column then shows the possible remaining volume.
According to the rule of maximum trade volume, the maximum trade volume occurs at the price of 103.00. As a result, the system determines 103.00 to be the trade price of this auction. The results for the remaining unexecuted bid and ask quotes are shown in Table 2.
Remaining unexecuted orders after matching
Together with the execution price and volume, Table 3 shows the disclosed five best unexecuted bid and ask quote prices/volumes after matching.
Disclosure of information after matching
Through the notations used in [45], we provide the following definitions to formulate the limit order book.
Using the definitions above, the best ask and bid prices at time
In an order-driven financial market, there exist two major types of orders: limit orders (LOs) and market orders (MOs). The Limit Order Book (LOB) contains all buy and sell orders submitted and are awaiting to be executed. Market orders are orders to immediately buy or sell a certain quantity of the stock at the best available price in the limit order book, and thus endowed with the highest priority for execution. Typically, how HFT trading algorithms determine the timing to place an order and the type of order depends on how the price movement is predicted by the model using the current and past supply and demand information in LOB. The reason is that the direction of price movement of a stock results from the intention to buy or sell it by the market participants. The volume posted on both sides of the order book can be then used to measure the volume imbalance to proxy demand and supply pressure in the market. Therefore, the bid and ask orders for the extent of demand and supply may be used to forecast the price movement because the price tends to go up (or down) if the demand is more (or less) than the supply.
In this study, using the publicly disclosed information we intend to develop more advanced systems to improve upon the ones in [44] for the forecasting task of price movement of stocks in HFT environment.
where
In this study, we aim to propose an autonomous GA-based methodology to construct self-evolving models to predict the direction
According to the matching mechanism described previously, the new execution (transaction) price at the next call shall be determined by the unexecuted orders at the current call and other influx of new orders entering into the system before the next call. Since the new coming orders are not disclosed, market participants can only use the execution price and volume, and the five best unexecuted bid and ask quotes at the current moment to predict the direction of price movement in the near future. In order to predict the price movement at the next call, Hu and Chan [46] indicated that if the transaction price is equal to the best bid quote, the execution price at the next call goes up and down with probability of 0.33 and 0.003, respectively. Conversely, if the transaction price is equal to the best ask quote, the execution price at the next call goes down and up with probability of 0.42 and 0.002, respectively. Therefore, Huang and Li [44] utilizes the relationship between the transaction price and the best ask and bid quotes to infer a prediction rule for the future direction of price movement, which is reformulated here using the notations in this paper. The resultant rule, called Rule 1, is described as follows:
The rationale for this rule is when the transaction price is equal to the bid, there are certain buying orders left unfulfilled; so these remaining demand orders may push up the price in the near future (e.g., at the prediction horizon
GA-based preliminary forecasting system using best five ask and bid volumes
Genetic algorithms [47] have been used as a class of optimization algorithms for solving real-world problems in the past two decades. GA typically operate on an evolving population of artificial agents and each agent is comprised of a genotype encoding the solution (a phenotype) to some problem at hand. In the GA, evolution can be simulated through the algorithm to create new generations by applying crossover, mutation and/or other variation operators to promising candidates selected in favor of relatively fit agents. As a result, evolution occurs by iterated stochastic variation of genotypes, and selection of the best phenotypes according to how well the solutions solve a problem. Successive generations are created in the same manner until a well-defined termination criterion is met. The core ingredient of this class of algorithms is thus the production of new genetic structures along the course of evolution, which provide innovations to solutions for the problem to be solved. The pseudo-code for a simple GA is shown in the following [15]:
The GA-based methods have been widely employed to solve optimization problems and applications in computational finance and investment [38], which indicated the GA-based methods have been shown to be useful in stock selection, portfolio optimization, and various financial prediction problems. Motivated by these existing research results and our previous research in [44], in this study we intend to further develop more comprehensive GA-based self-evolving forecasting models that improve upon the ones studied in [44].
In our previous work in [44], we utilized the disclosed five bid and five ask quotes, as well as their corresponding lots (volumes) of a stock, as the inputs to the GA-based model in order to predict the direction of price movement. The extent of the bid strength (
where
In [44] and this study, the volume imbalance is an indicator measuring the difference between a stock’s demand (buying) and supply (selling) strength, which is defined as:
The intuition is that the unexecuted bids designate the remaining demand force for the stock where the higher a bid order, the more likely it is to be matched with new ask orders in the future. Conversely, for the unexecuted ask orders, they remain as the supply force of the stock. The lower an ask order, the more likely it is to be matched with new bid orders. Therefore, various levels of bid and ask orders may have different weight on determining the final transaction price at each moment. In this study, the GA is employed to search for the optimal weights
Typically, volume imbalance is a force potentially leading to the price change. When the demand is more than the supply, the price of the stock tends to go up in the future. Conversely, the price shall decrease if the supply is more than the demand. Here the volume imbalance indicator in Eq. (6) is employed as a prediction rule, called Rule 2, for the price movement as follows:
As opposed to the rationale behind Rule 2 that utilizes the information of all the five bid and ask orders, the transaction price may be determined simply by the top ask and bid orders since they are closest to the final transaction price. Therefore, using only the volumes of the top ask and bid orders, the direction of price movement may be predicted according to the difference of these two volumes. In this study, we propose an alternative, simpler version of volume imbalance indicator for the one used in the previous subsection. The alternative version is a straightforward rule that takes into account this phenomenon as follows:
Using the volumes of the top bid
We then propose a simple rule, using volume imbalance resulted from the top ask and bid orders, for the prediction of price movement, called Rule 3, as shown below:
Avellaneda and Stoikov [48] conducted a study discussing that the transaction price may be determined by the mid-price, which is the average of the top bid and ask price orders, because the difference between the mid-price and the transaction price may show the delicate difference of supply and demand of a stock.
In this study, the mid-price is defined as the mid-point between the best bid and the best ask prices at time
According to [48], we propose Rule 4 in this study for the prediction of future transaction price as follows:
Alternatively, we further propose to extend Rule 4 to take into account the best five bid and ask orders for the prediction of future transaction price. Denote
Then we propose the following prediction rule:
In this study, we propose a more comprehensive, self-evolving forecasting system by the GA for encoding the aforementioned individual rules to extend our primitive work in [44]. The motivation is that we expect, by combining these rules properly, the resultant system can outperform each individual rule alone. Our objective is to allow the GA to search for the optimal combination of prediction rules and parameters for the ultimate models, in order to bring about an autonomous, self-evolving forecasting system. For instance, Fig. 1 shows a version of such an autonomous model concerning how we encode Rules 1 (
Notice that for each rule, we devise a bit (on/off) to turn on or disable the rule. For
Chromosome encoding for the self-evolving, autonomous forecasting system.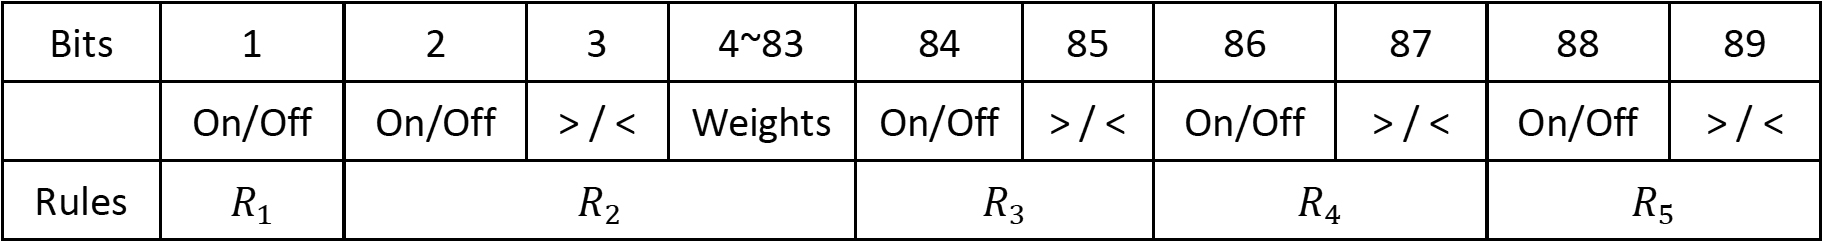
For Rule 2 (
Chromosome encoding for the weighting terms of ask and bid orders.
Once the GA is employed to search for the optimal combination of rules, and parameters
Although the models in [44] can be used to predict the price movement of the next call, the authors also discussed that, in current Taiwan’s stock market, a stock’s transaction price tends to remain stationary over several consecutive calls. For example, consider the stock of the Taiwan Semiconductor Manufacturing Company Limited (TSMC) from Sept./22/2015 through Nov./24/2015. If the call auction system reports that a transaction price is equal to the best bid, one observed that the corresponding transaction prices at next calls actually consisted of 41585, 14982 and 41 occurrences of price remaining stationary, up, and down between two consecutive calls, respectively. Due to the significant portion of stationary price at next calls that impedes the forecasting task as indicated in [44], in this study, we thus propose a different way to compute the precision where the cases of stationary prices are removed.3
Since precision is the major metric to evaluate the performance of the systems in [44], in this work, we also employ precision as the metric for the comparison of this work and that in [44].
In this study, the performance of the forecasting system can be measured by the precision defined as:
where
“When a system predicts the price of a stock to go up at some point in the future, and if the price indeed increases then, a true positive occurs; otherwise, it is a false positive.”
In this study, we employ this measure as the fitness of each chromosome for the GA to search for the optimal forecasting system.
In this work, we provide a comparative study for the following six forecasting models, in which 2 models were studied in [44] and are used here for further comparisons with our new proposed self-evolving, autonomous GA-based models. The six models are described in the following.
In this section we provide experimental results for the performance comparison of our proposed systems described in Section 2. We used the real-time data collected for ten stocks with large market capitalization from the semiconductor and financial industries in the Taiwan Stock Exchange, as shown in Table 4. For each trading day, the market opens from 9:00 am through 1:30 pm. The transaction data is sampled per 5 seconds. Each sample contains the information of ticker, transaction price, number of transactions, volume, the best five ask and bid quotes, etc.
Datasets of the 10 companies used for the study
Datasets of the 10 companies used for the study
For statistical validation, we use in-sample data to learn the model and out-of-sample data to examine the effectiveness of the model. The process of validation is conducted as shown in Table 5 – we use the data of the first several days to train the model, and the remaining data is used for testing. This setup is to provide a set of temporal validations for the effectiveness of the models in many dynamical financial applications, which is different from the regular cross-validation procedure where the process of data being split into two independent sets is randomly repeated several times without considering the temporal order of the data [15].
Temporal validation
In the training phase of each TV, we conduct 50 runs for the GA experiments with population size of 50 individuals, along with one-point crossover, and mutation rates of 0.7 and 0.005, respectively. Furthermore, the best model learned in the training phase for each run will be examined in the testing phase. Therefore, in both training and testing phases, the averaged fitness (precision) of the models can be calculated.
In this study, we also use the datasets extracted from two periods of time (each period accounts for the total of 25 trading days): (1) Sept./15/2015 through Oct./27/2015, during which the Taiwan Stock Exchange Capitalization Weighted Stock Index (TSEC weighted index) went up from 8259.99 to 8701.32, and the broad stock market achieved positive gain; (2) Dec./10/2015 through Jan./14/2016, during which the TSEC weighted index went down from 8216.17 to 7742.88, and the broad stock market achieved negative gain. We selected these two periods of time to examine if our proposed models would be generally effective during the time when the broad stock market makes either gains or losses.
Forecasting performance comparison using United Microelectronics Corporation.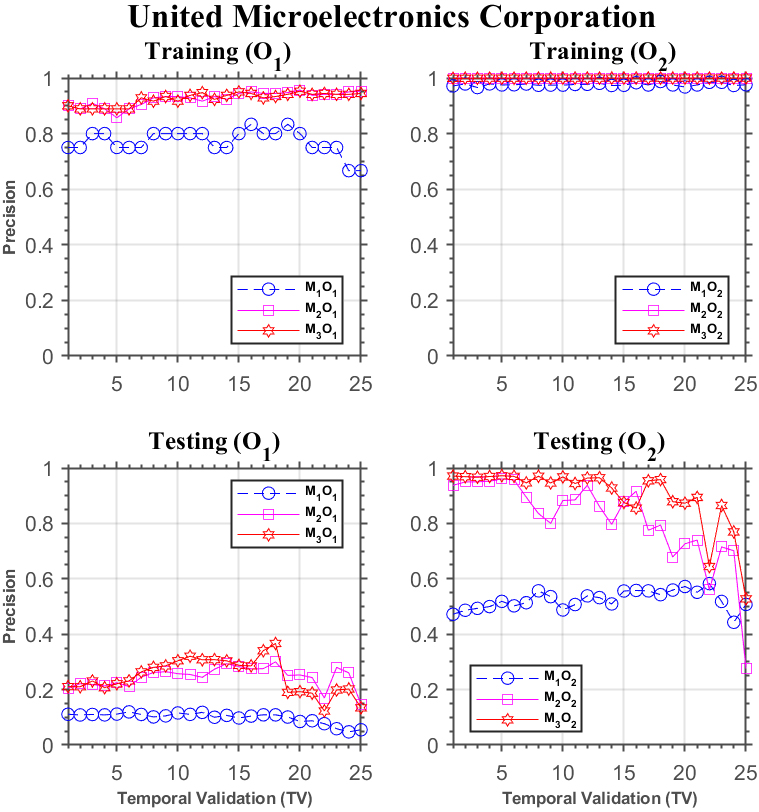
Forecasting performance comparison using Hon Hai Precision Industry Co.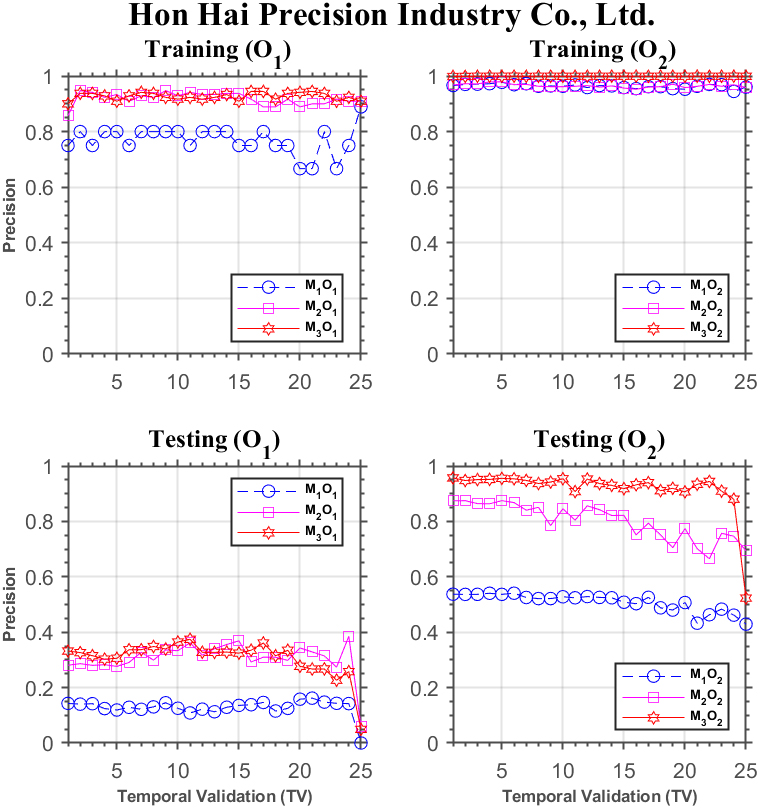
We first present experimental results using the first period of time (Sept./15/2015 through Oct./27/2015). Figure 3 displays a visual gist on the performance discrepancy of the three models investigated in this study using the stock of the United Microelectronics Corporation. The upper two subplots show the results for
Although
We also notice that, under
In Fig. 4, we show the comparison of forecasting performance of the three models for Hon Hai Precision Industries Co., Ltd. In the training phase, the upper two subplots display that the performance of
Forecasting performance comparison using Taiwan Semiconductor Manufacturing Co.
Figure 5 displays the comparison of forecasting performance of the models for Taiwan Semiconductor Manufacturing Company Limited. Similar to the results in Fig. 4, the upper two subplots show that the performance of
Similar performance discrepancy of the three models can be seen for Macronix International Co. in Fig. 6, and AU Optronics Co. in Fig. 7, as well.
Forecasting performance comparison using Macronix International Co.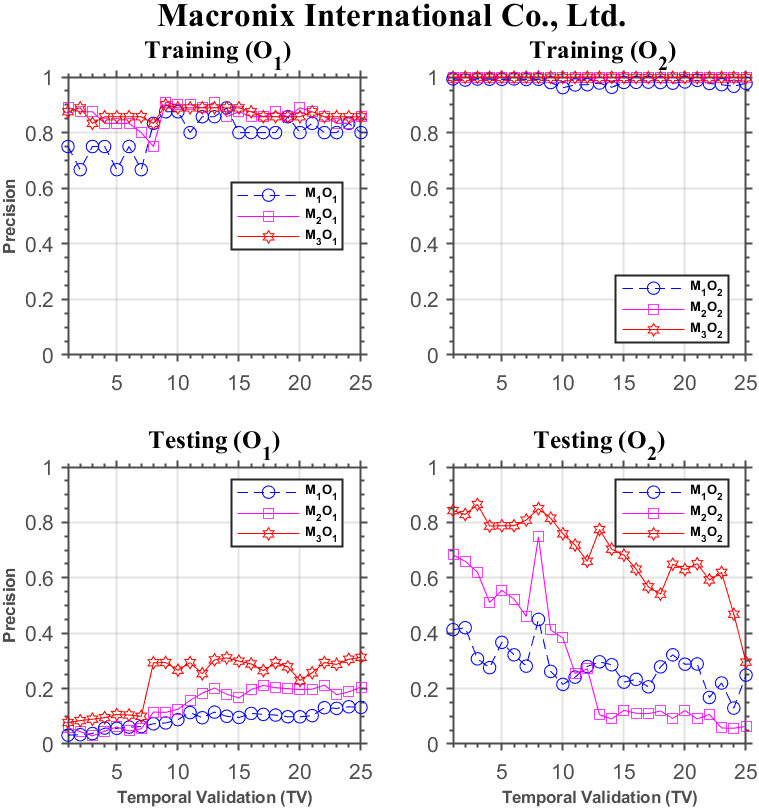
Forecasting performance comparison using AU Optronics Co.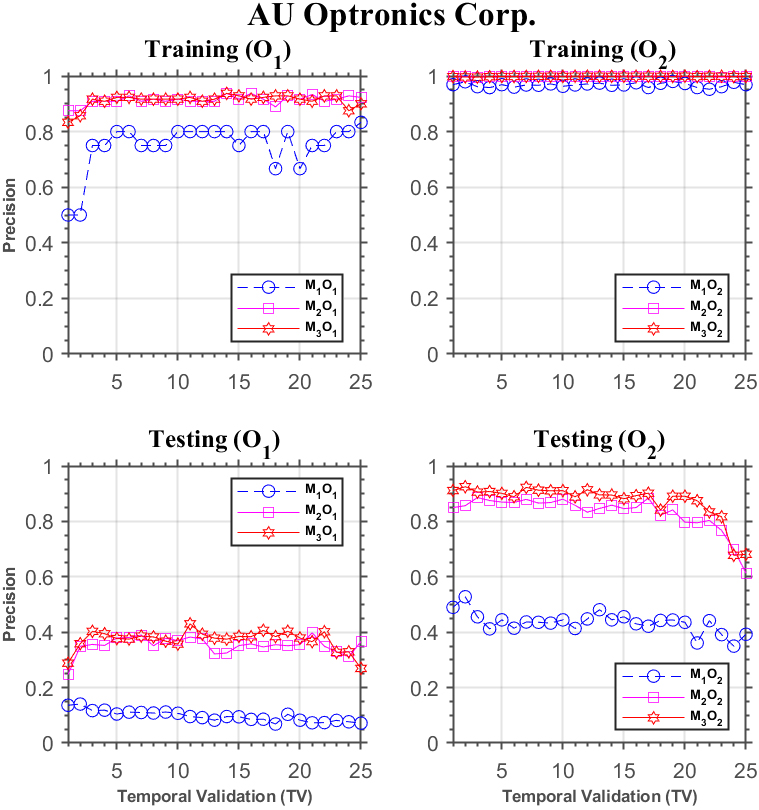
Forecasting performance comparison using Fubon Financial Holding Co.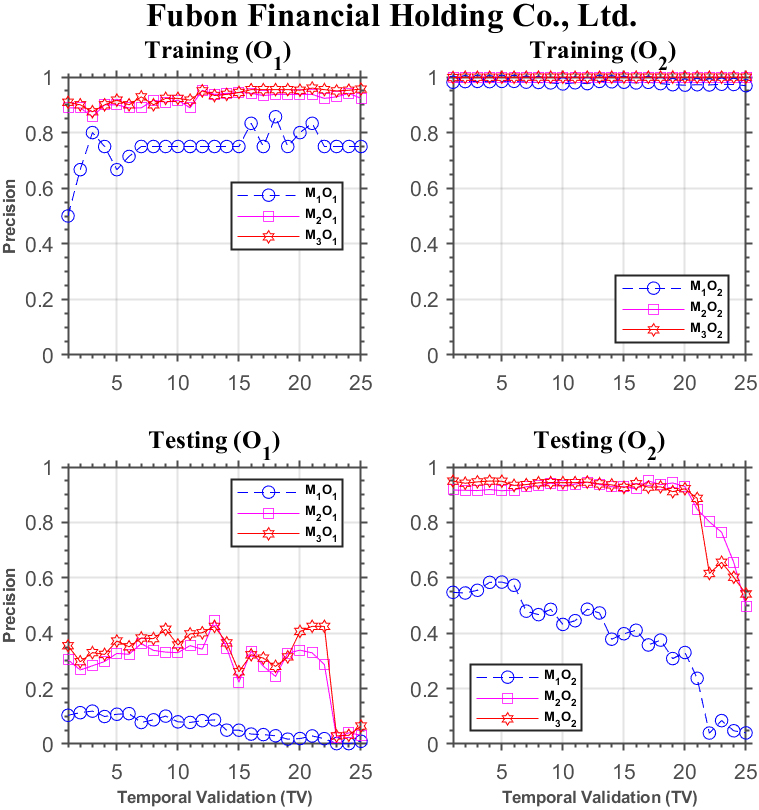
Forecasting performance comparison using E.Sun Financial Holding Co.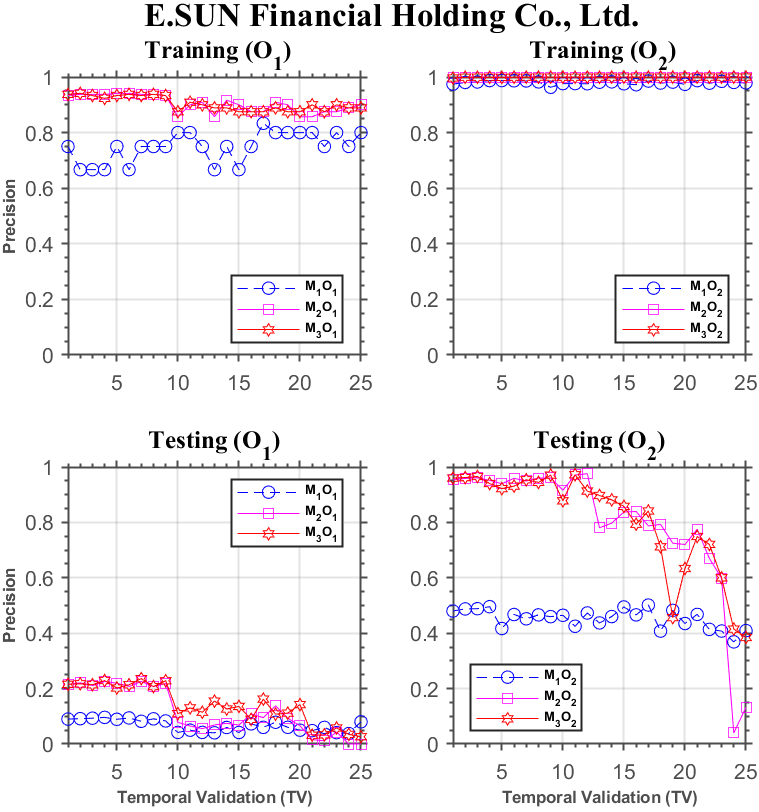
Forecasting performance comparison using Mega Financial Holding Co., Ltd.
Forecasting performance comparison using CTBC Financial Holding Co., Ltd.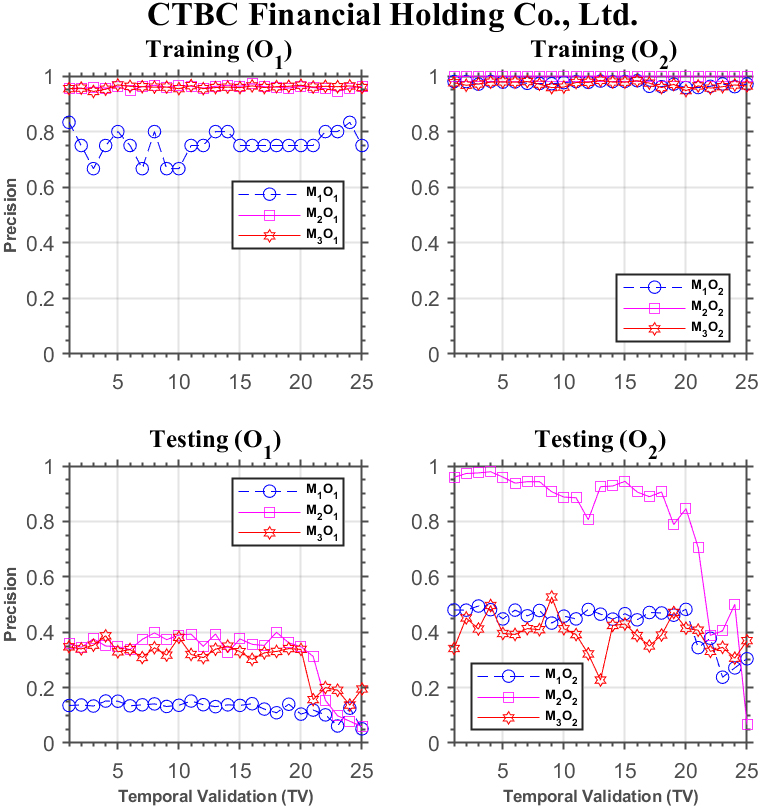
Forecasting performance comparison using ASE Technology Holding Co.
For the four stocks from the financial services sector, the results are displayed in Fig. 8 through 11. For Fubon Financial Holding Co., Fig. 8 shows similar results as those in the previous figures for the training phase. In the testing phase, under
Figure 9 shows the results for E.Sun Financial Holding Co., which are similar to those in the previous figures for the training phase. In the testing phase, under
Figure 10 shows the results for Mega Financial Holding Co., which are similar to those in the previous figures for the training phase. However, in the testing phase, under
Figure 11 shows the results for CTBC Financial Holding Co., Ltd. In the training phase, under
For the second period (Dec./10/2015 through Jan./14/2016), Fig. 13 displays the performance discrepancy of the three models for the stock of the United Microelectronics Corporation. The upper two subplots show the results for
For the testing phase, the bottom two subplots in Fig. 13 display the comparison among
Forecasting performance comparison using United Microelectronics Corporation.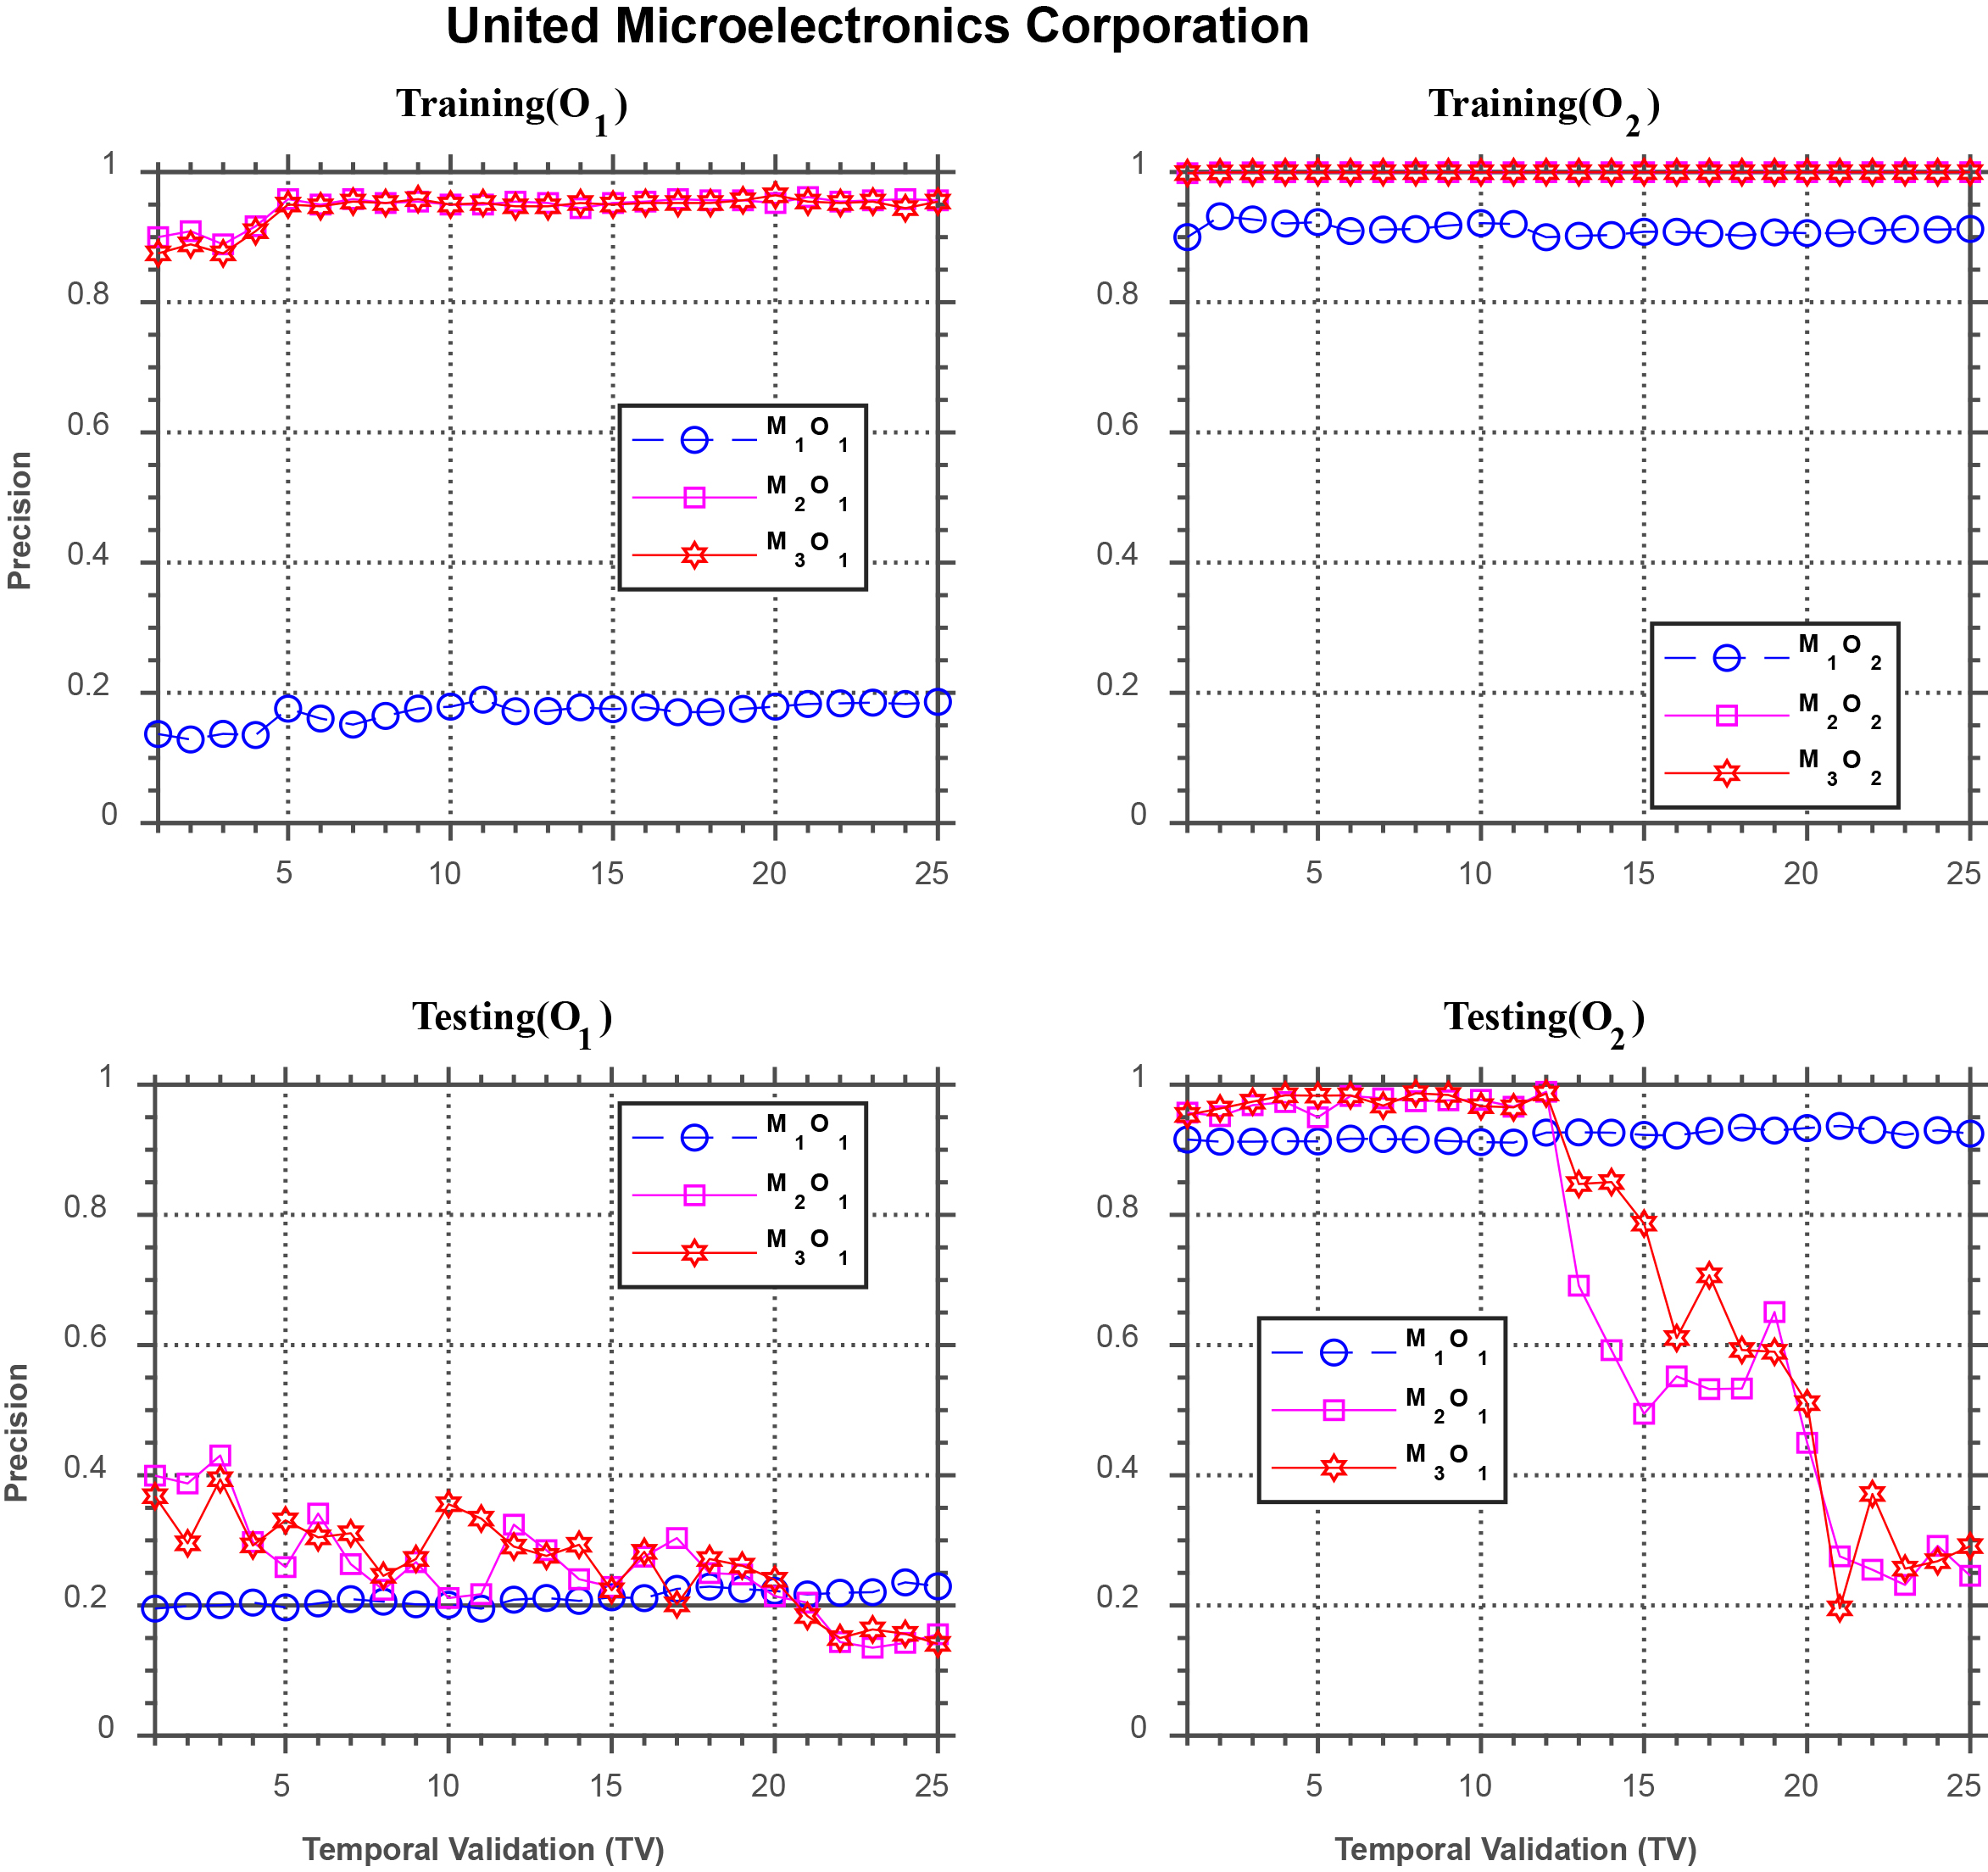
Forecasting performance comparison using Hon Hai Precision Industry Co.
Forecasting performance comparison using Taiwan Semiconductor Manufacturing Co.
Forecasting performance comparison using Macronix International Co.
Forecasting performance comparison using AU Optronics Co.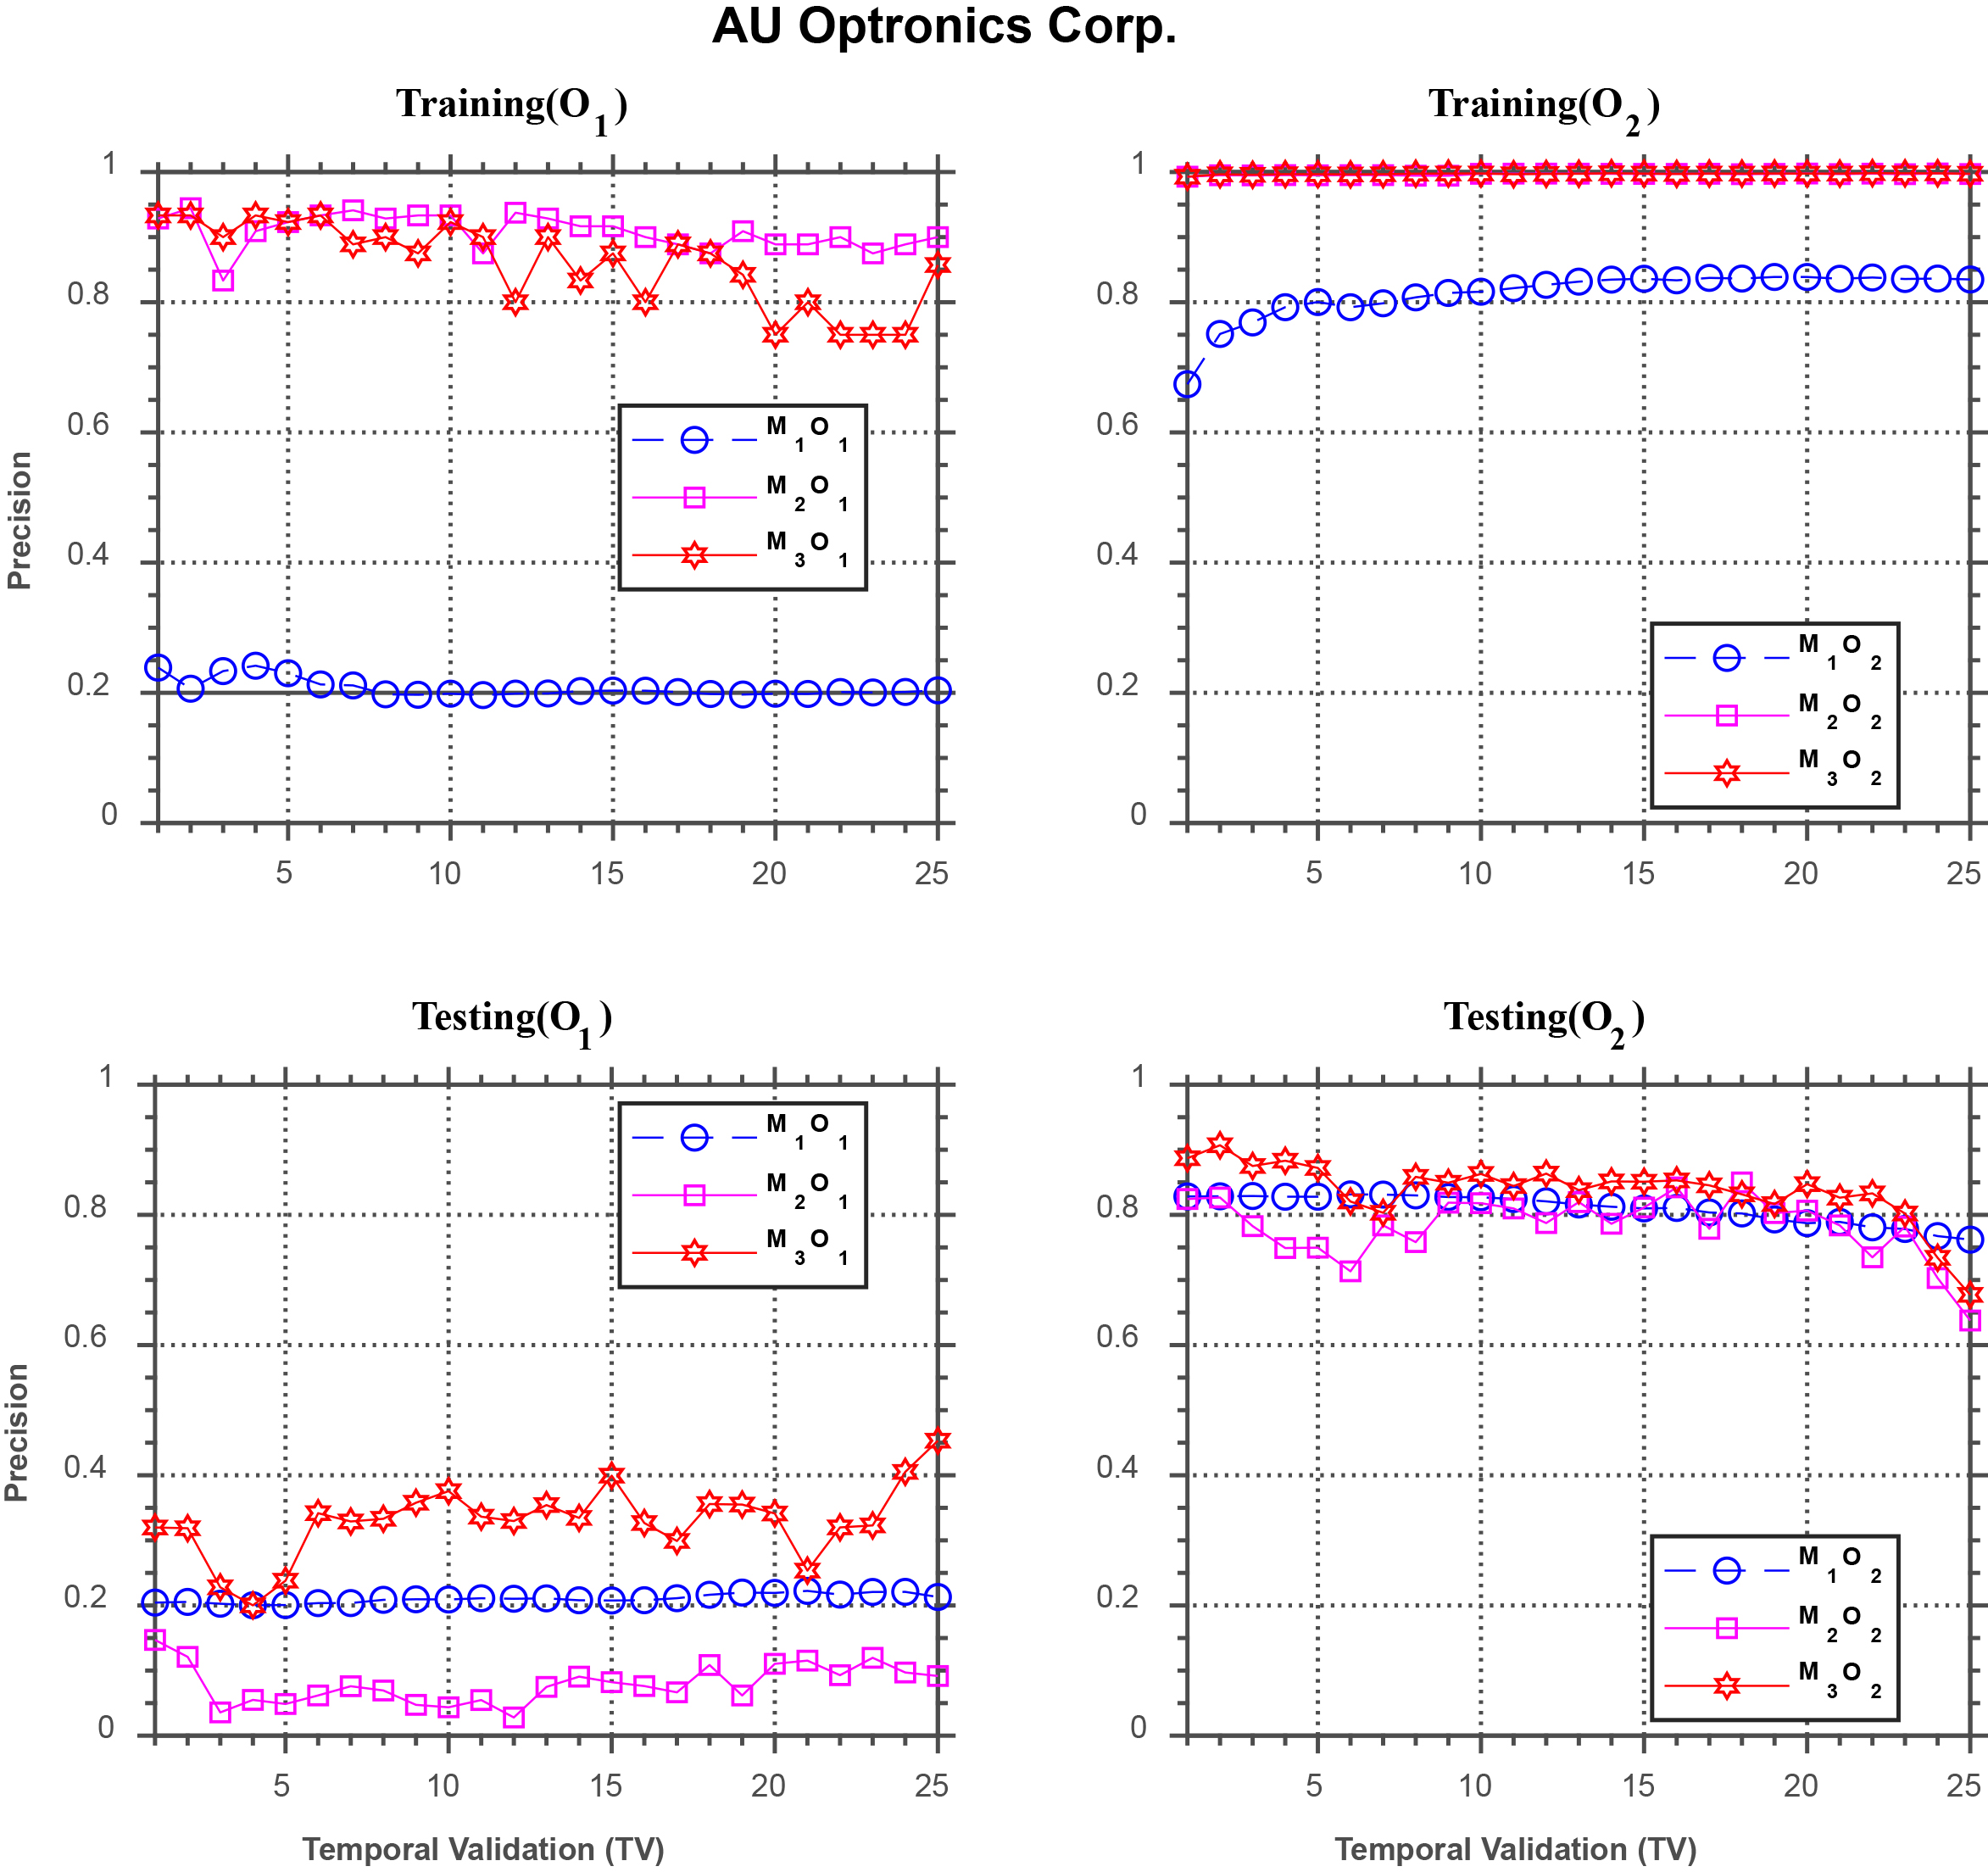
Forecasting performance comparison using Fubon Financial Holding Co.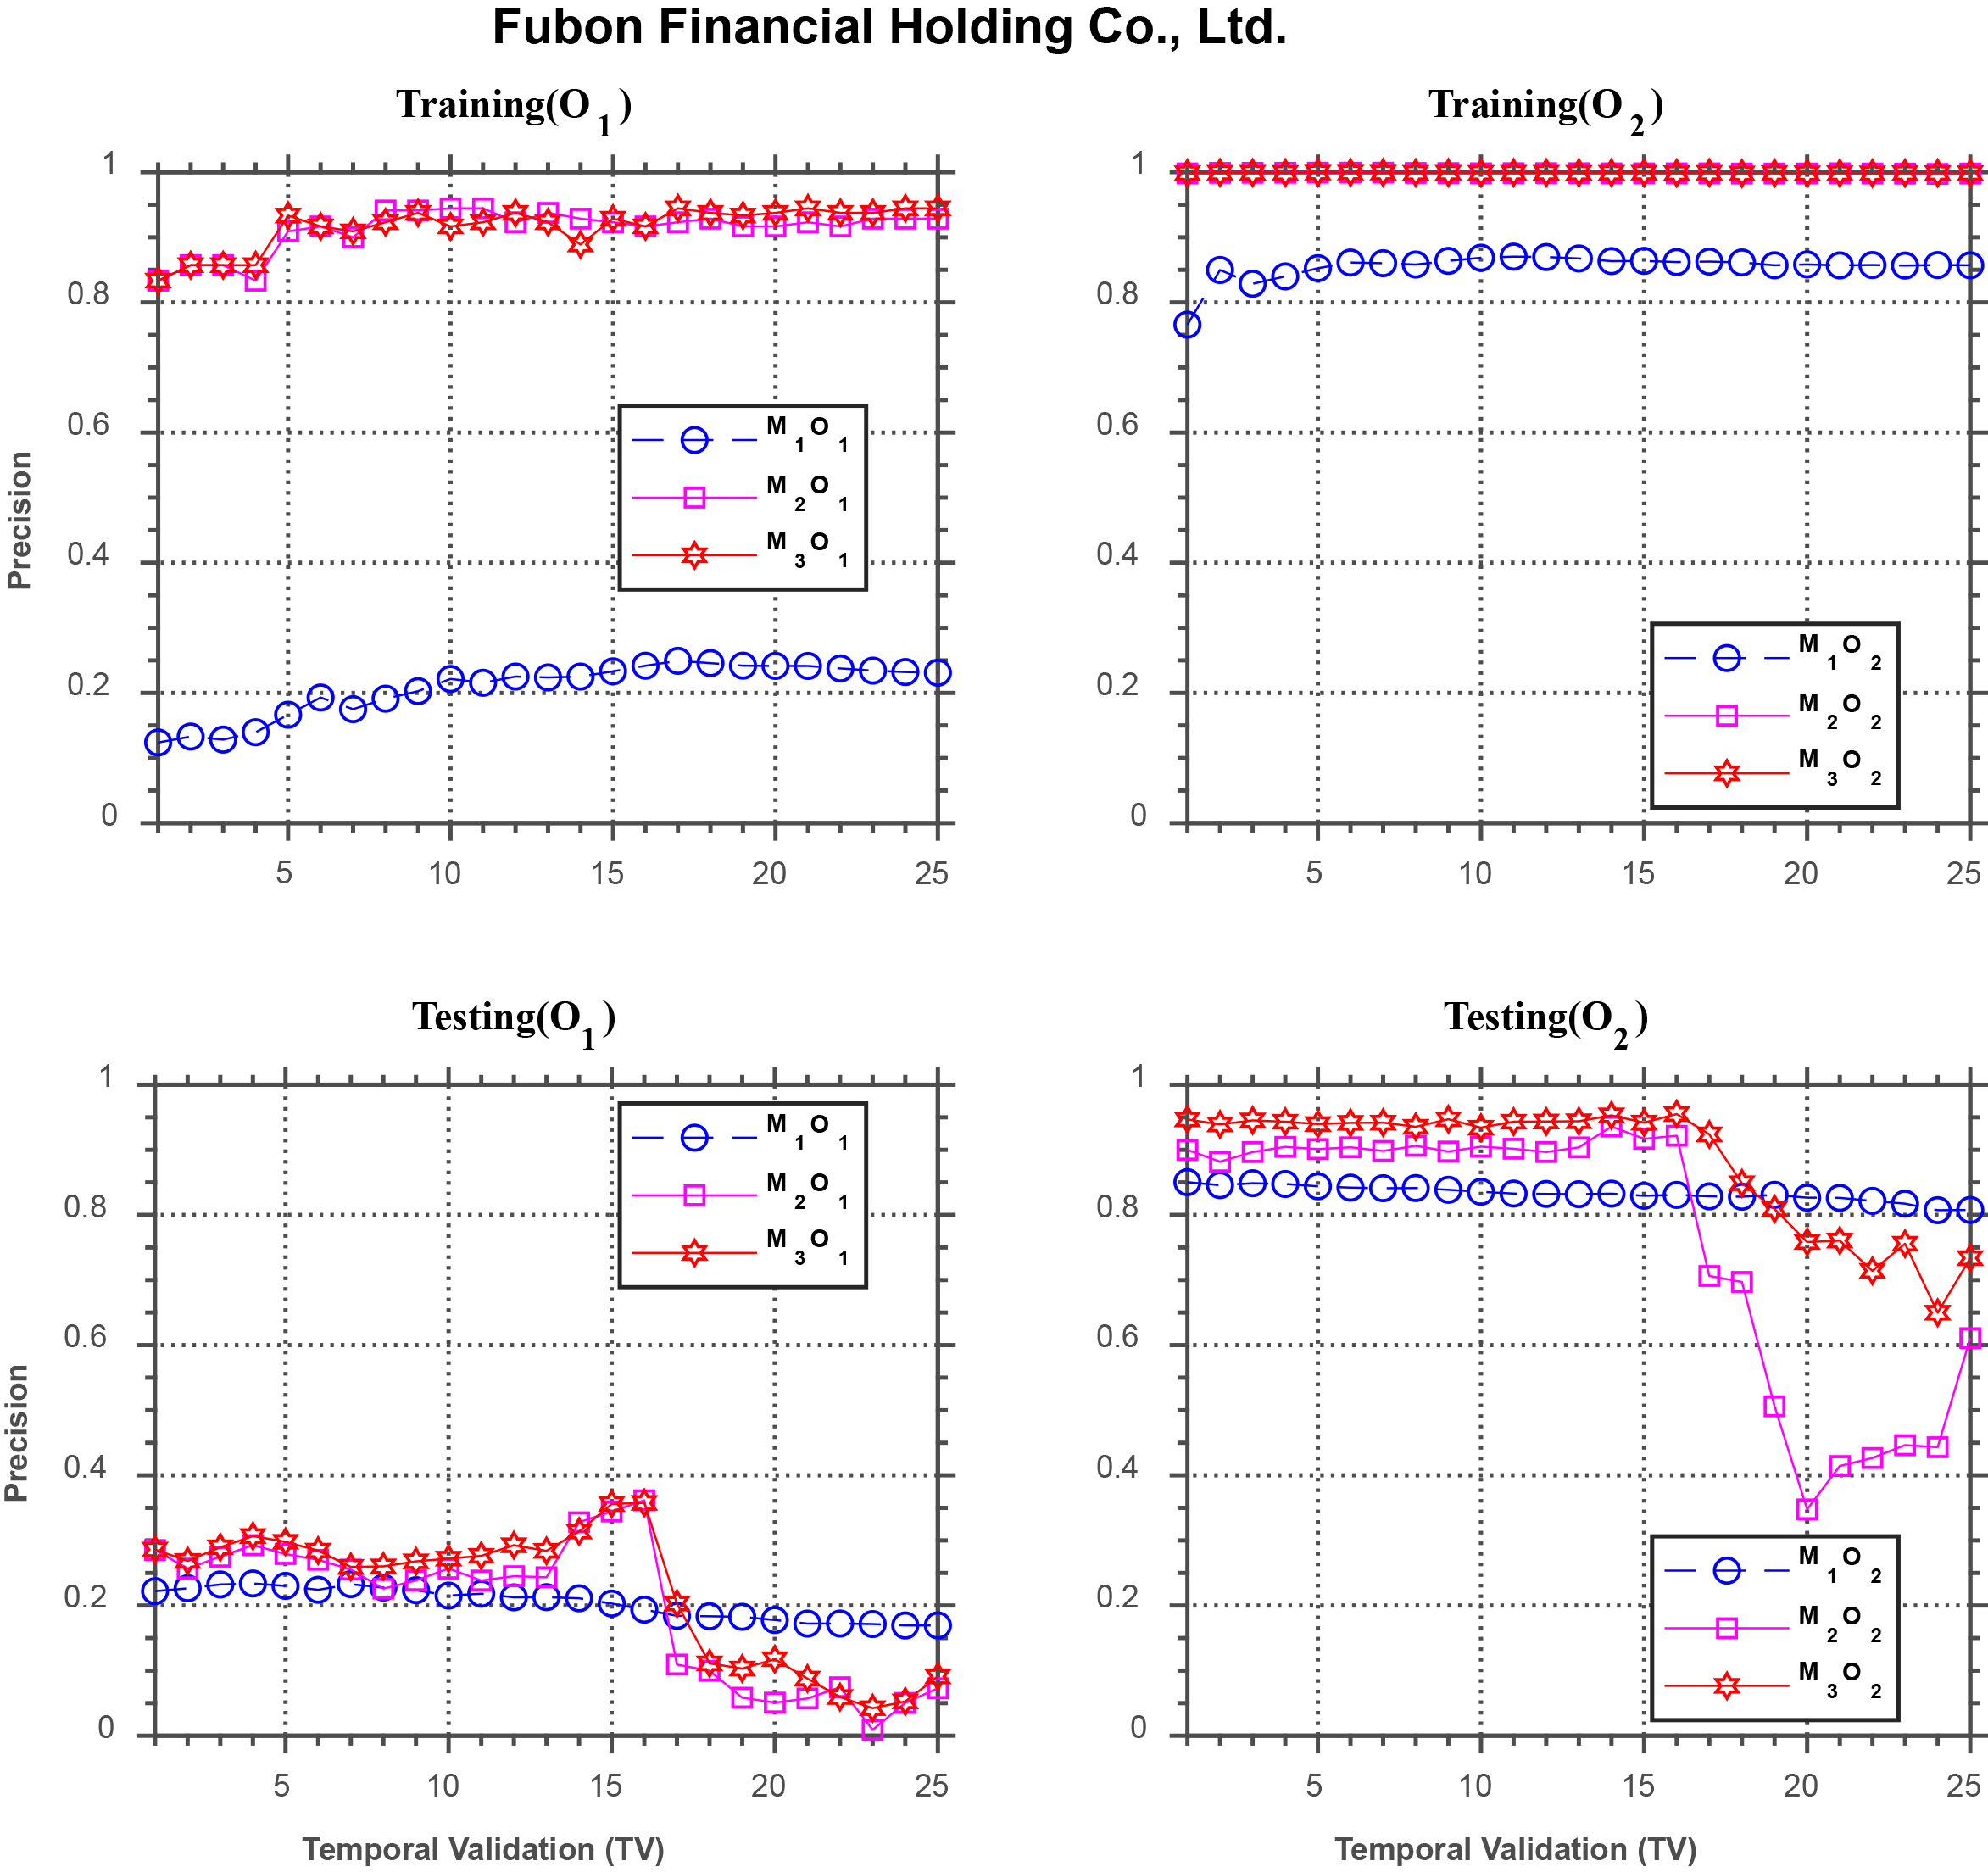
Forecasting performance comparison using E.Sun Financial Holding Co.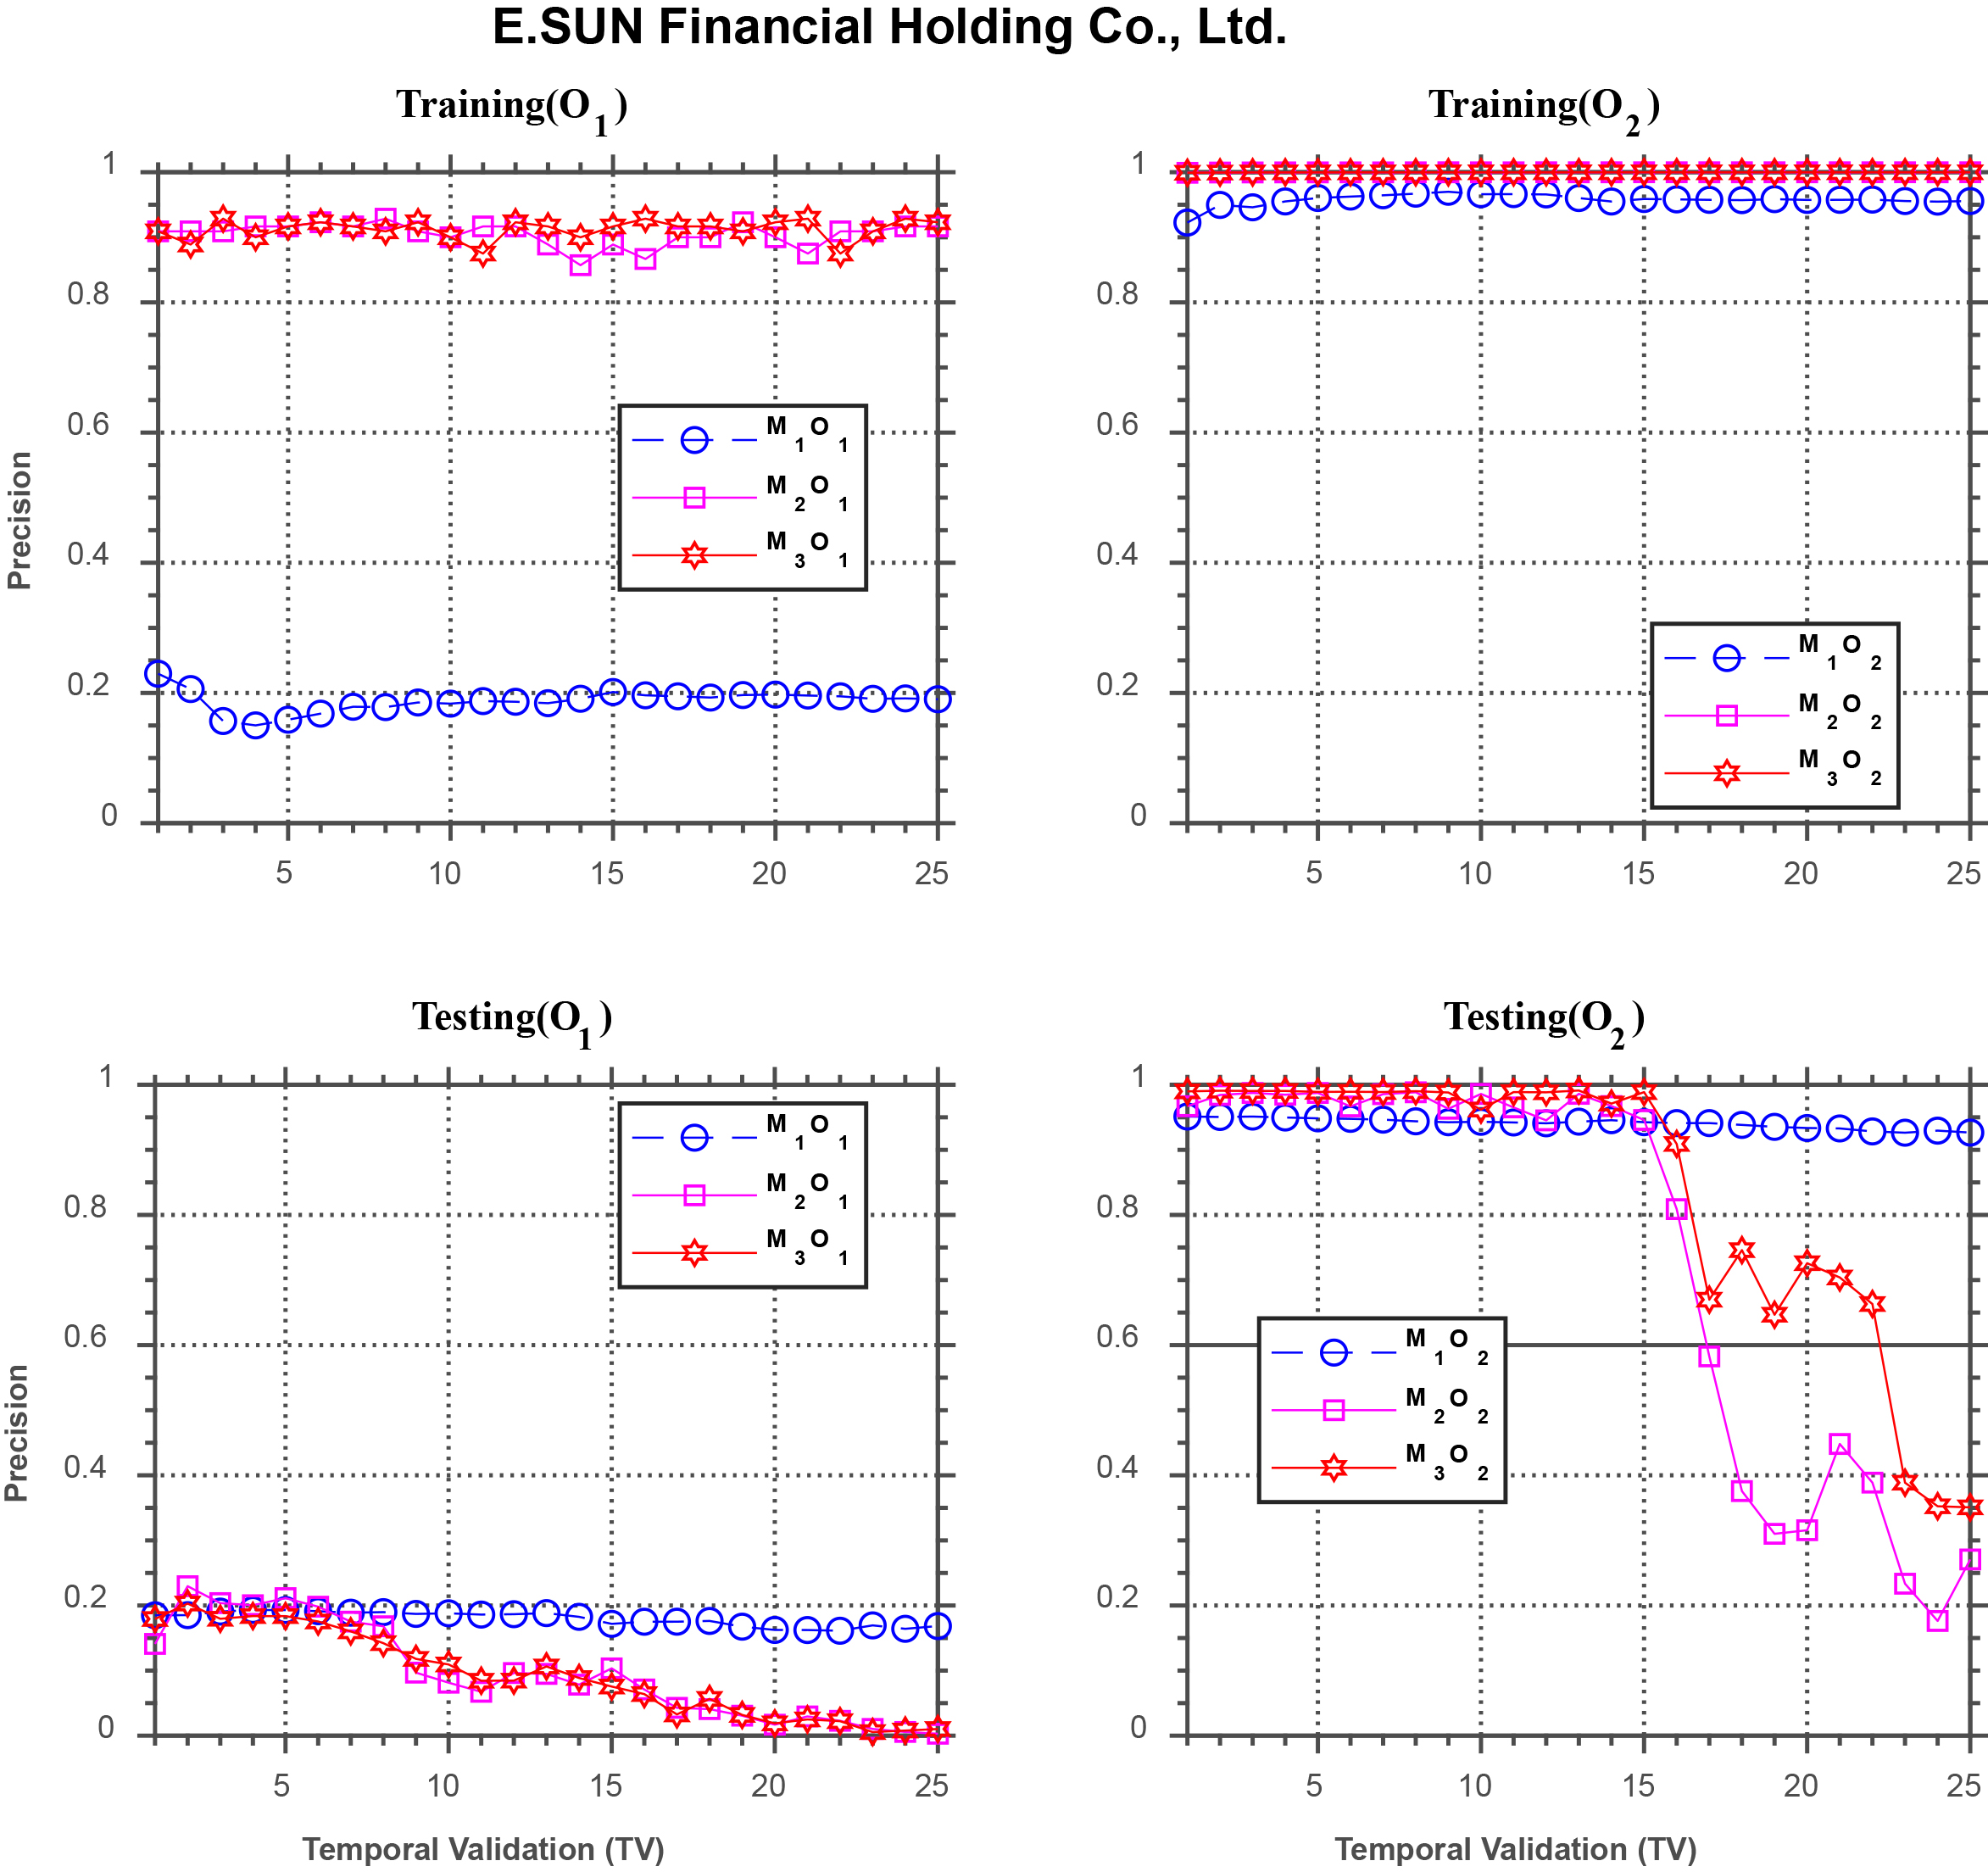
Forecasting performance comparison using Mega Financial Holding Co., Ltd.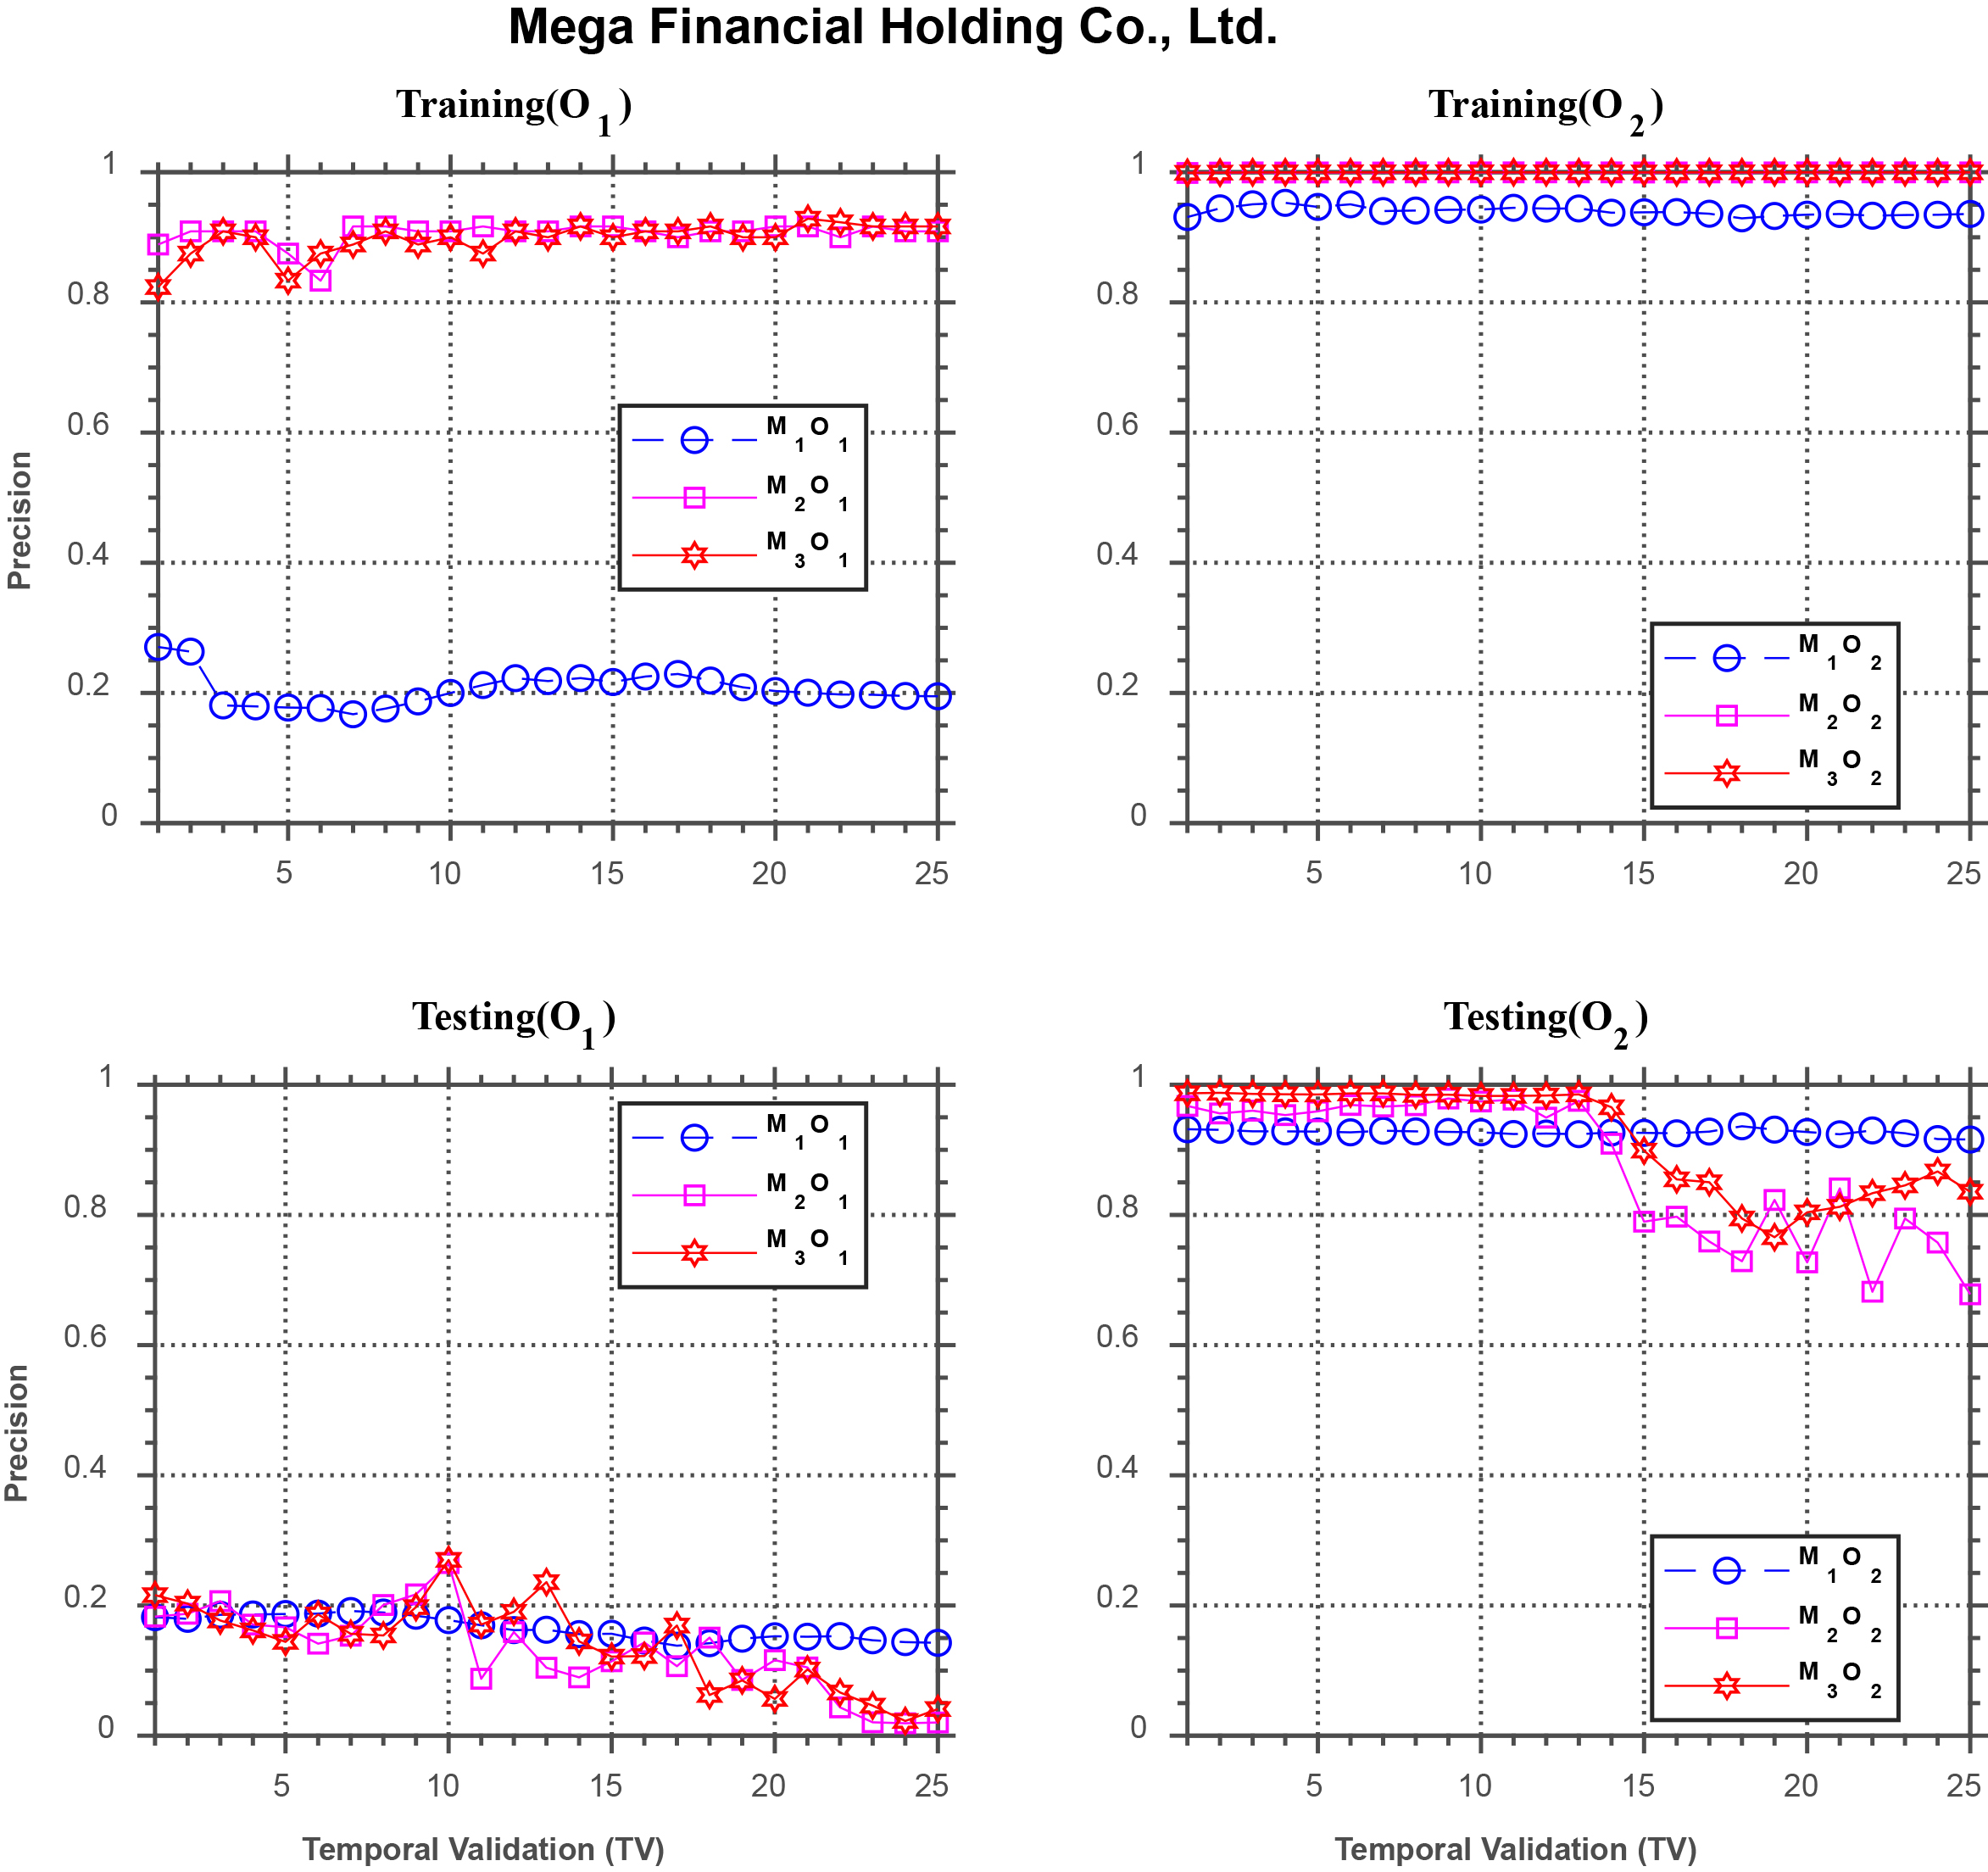
Forecasting performance comparison using CTBC Financial Holding Co., Ltd.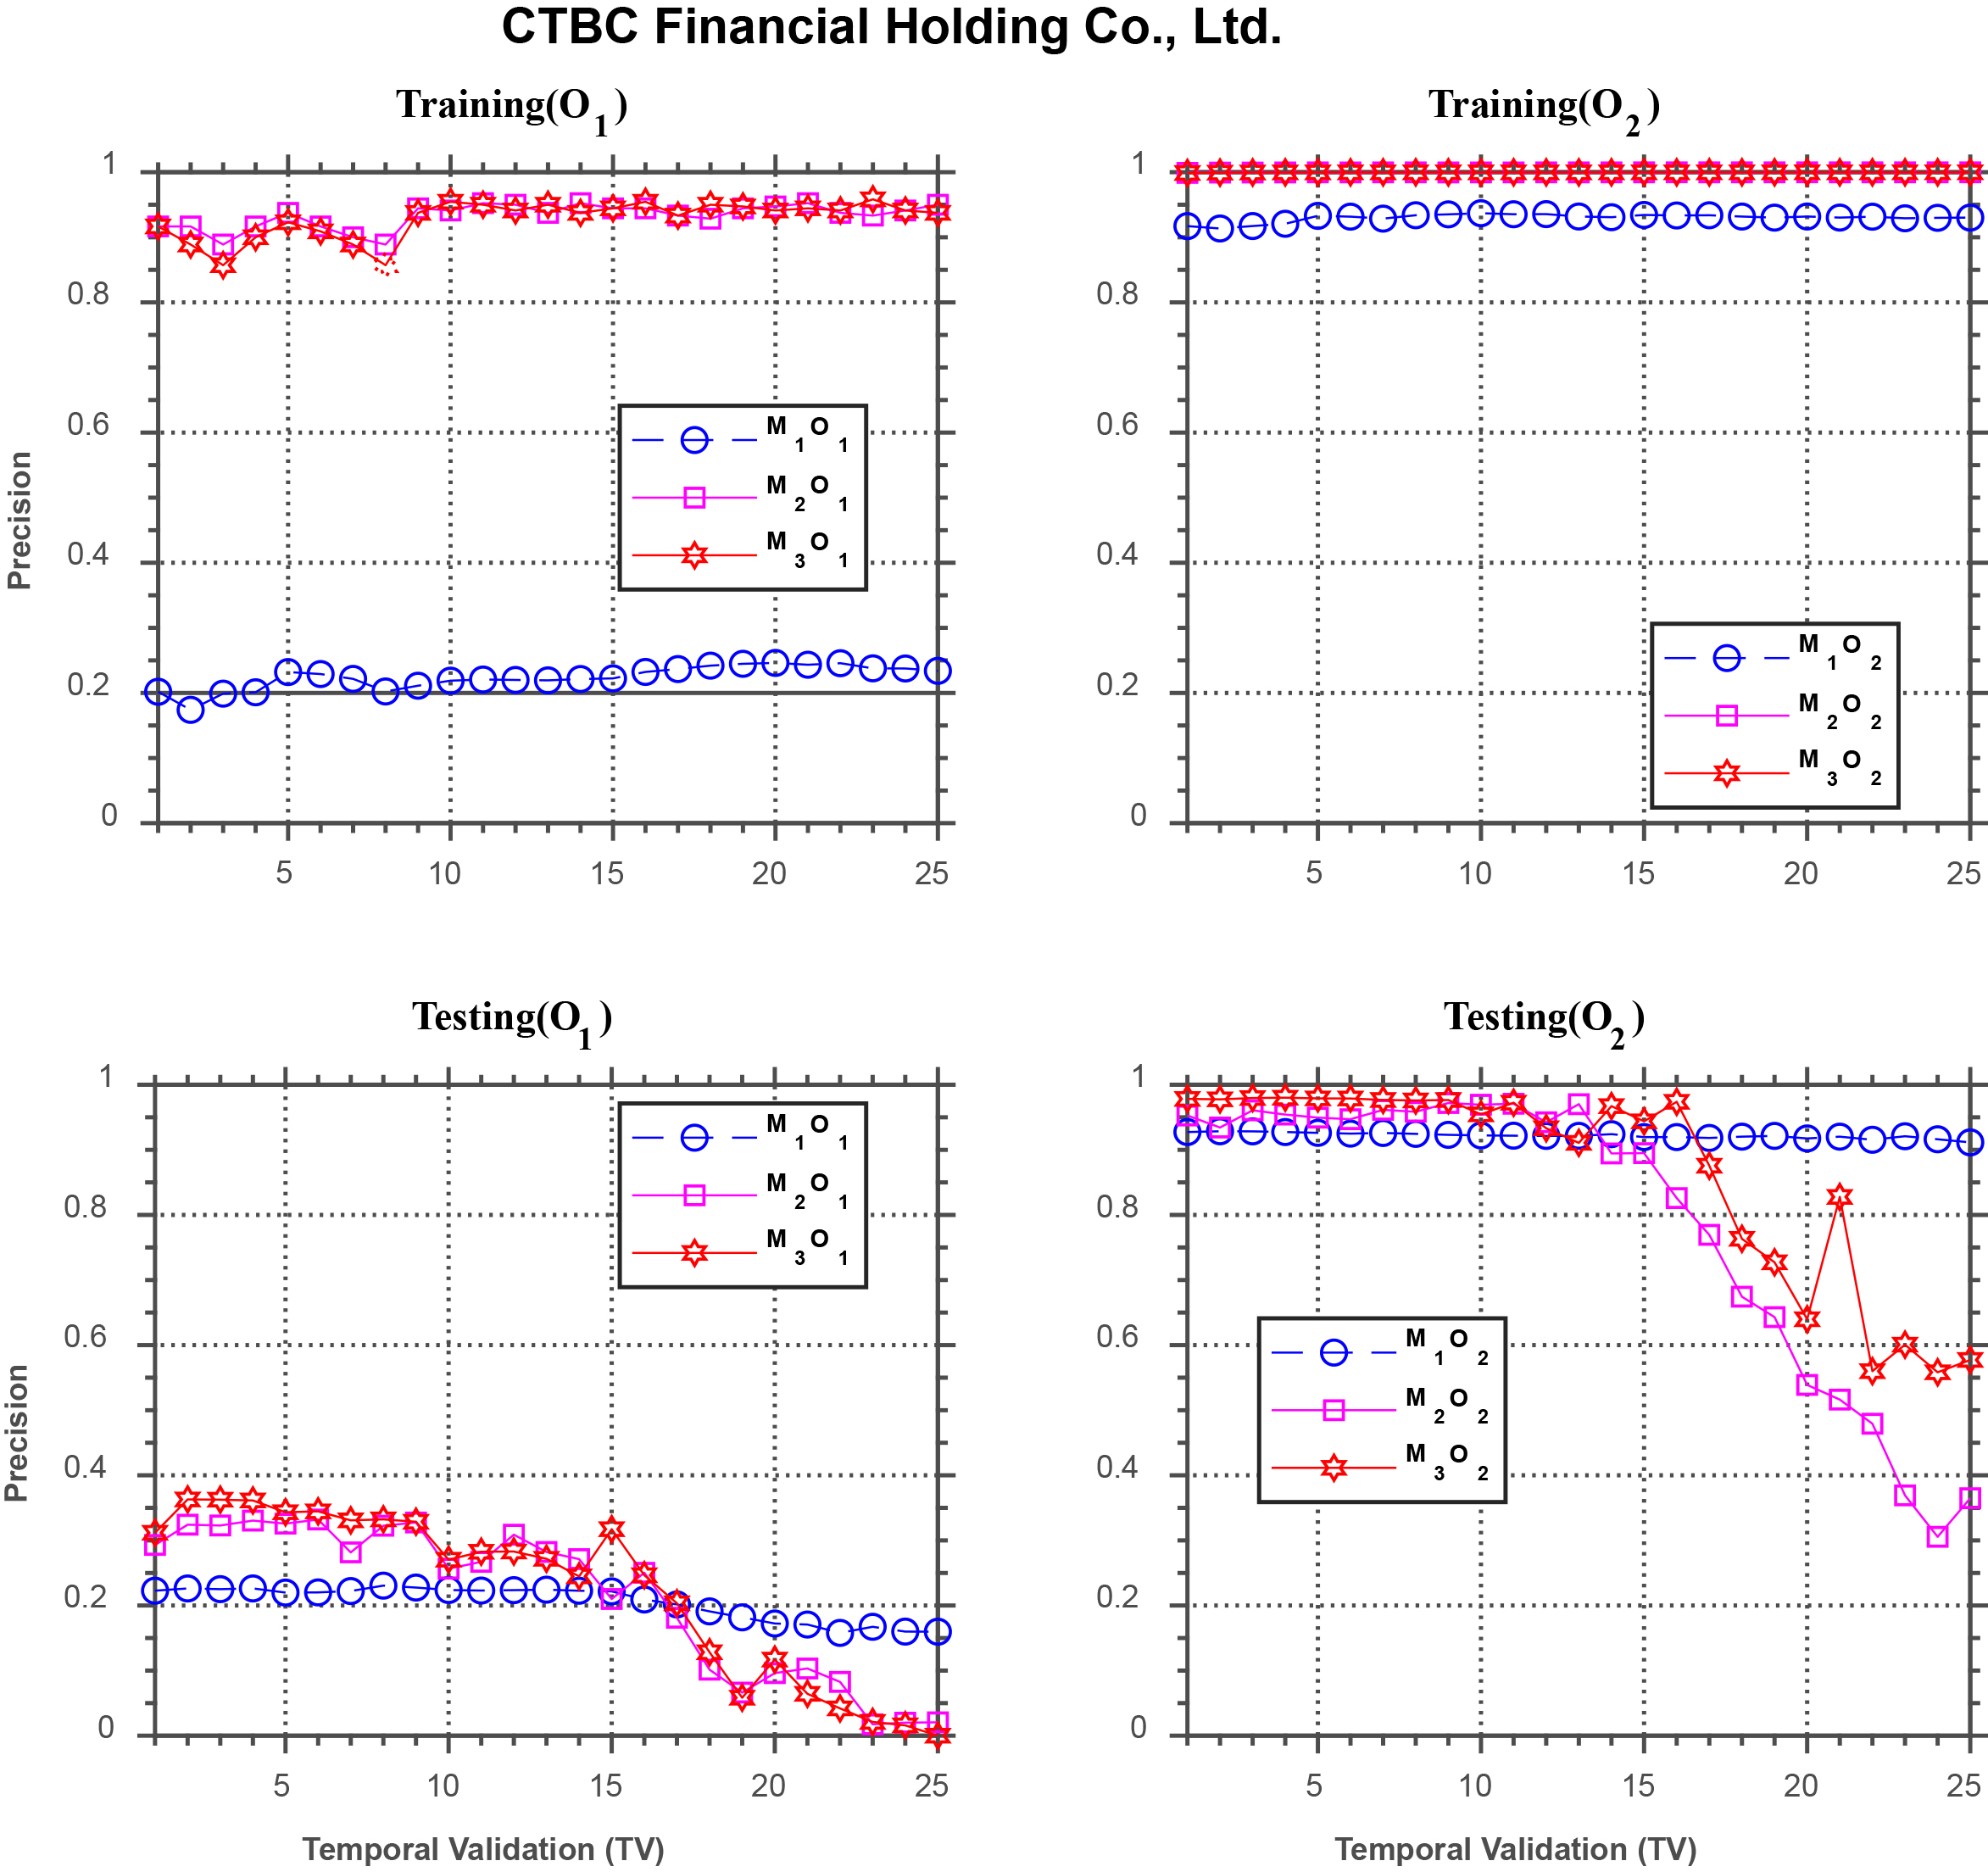
Forecasting performance comparison using ASE Technology Holding Co.
Table 6 summarizes the results from Fig. 3 through 12, which shows the percentage of the three models that deliver the best performance for each stock using out-of-sample data in testing phase. Since it is more important to examine if the learned models from the training are still valid in the testing phase, we hereby focus on discussing the performance of the models in the testing phase.
In Table 6, the best performance for each stock under
Tables 7 and 8 show the mean and standard deviation of the precision of the models for each stock in testing phase under
The percentage of the three models that deliver the best performance for each stock in testing phase
Mean and standard deviation of precision of the models for each stock in testing phase under
Mean and standard deviation of precision of the models for each stock in testing phase under
The percentage of the three models that deliver the best performance for each stock in testing phase
Mean and standard deviation of precision of the models for each stock in testing phase under
Mean and standard deviation of precision of the models for each stock in testing phase under
For period 2 (Dec./10/2015 through Jan./14/2016), the results from Fig. 13 through 22 are summarized in Table 9 as those in Table 6, which shows the percentage of the three models that deliver the best performance in the testing phase. In this table, the best performance is highlighted by the bold fonts. Under
Again, for period 2, Tables 10 and 11 show the mean and standard deviation of the precision of the models in the testing phase. The best performance for each stock is shown as bold-type fonts. Under
Therefore, the results for these ten stocks have shown that
Furthermore, it is worthwhile to investigate which rules have been selected by the GA since such findings shall be important for further investigation into the characteristics of the models generated. We display in Figs 23–25 the number of times each rule being selected in all the 25 TV’s in a complete set of experiment for three stocks (since the results for most of the other stocks are similar, we choose to show the results of only three stocks here for illustration).4
In a complete set of experiment for each system, 50 GA runs are conducted in each TV and a best model is generated out of each run from the training phase for further testing in the testing phase. Since there are 25 TV’s in total, 1250 models will be generated.
Number of times each rule is selected by 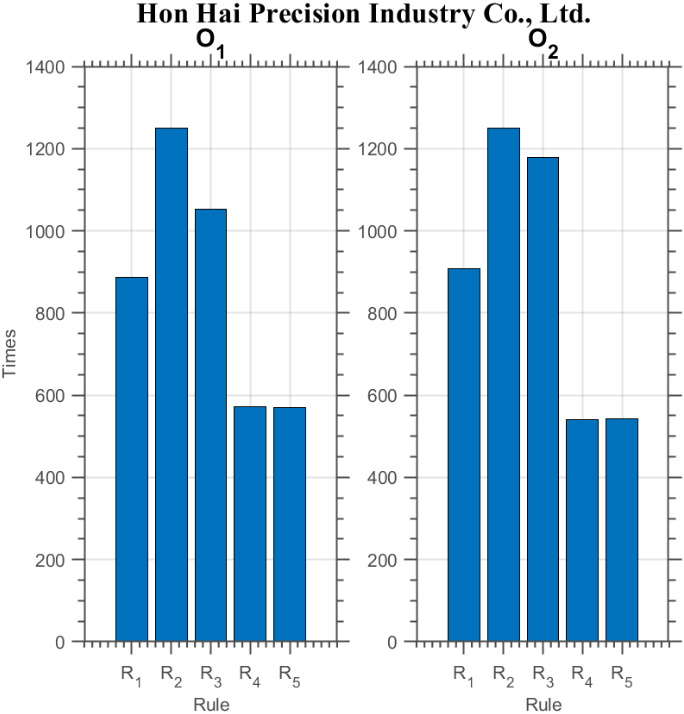
Number of times each rule is selected by 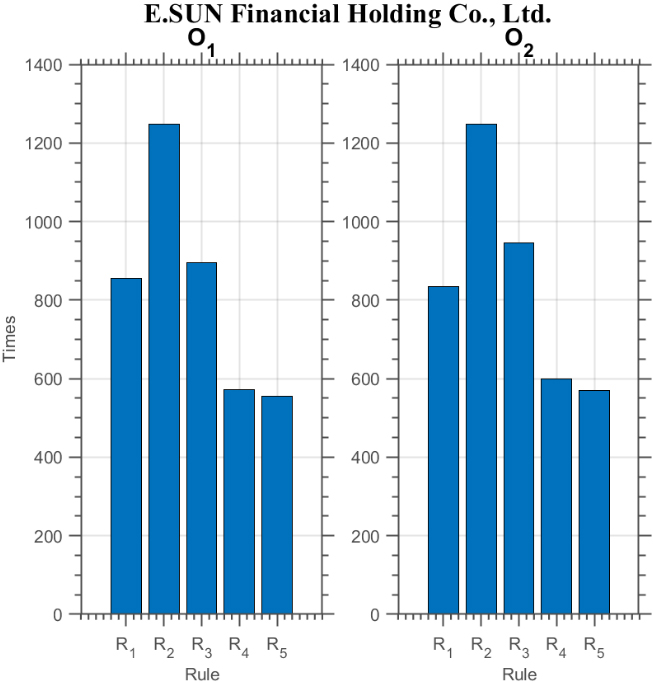
Number of times each rule is selected by 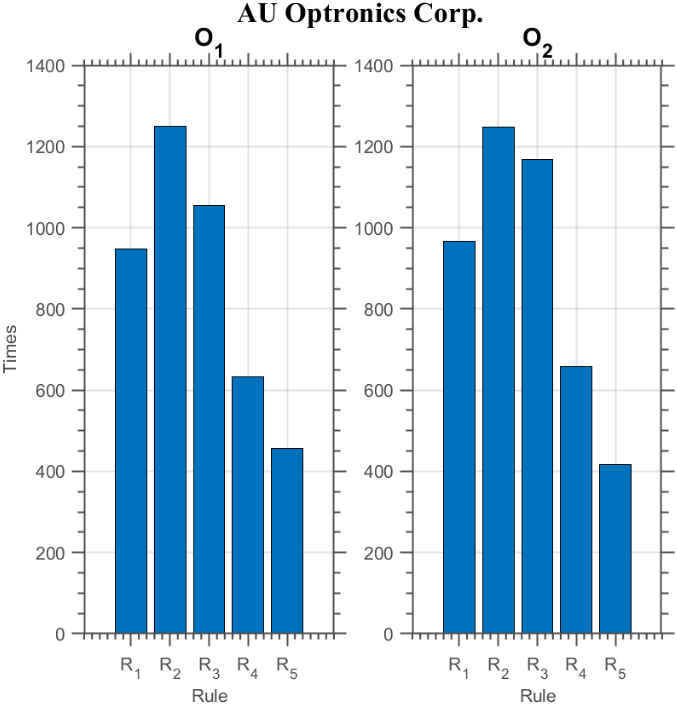
The advancement in the modeling of high-frequency trading has provided certain understanding towards the nature of price formation because the supply and demand of a stock can be comprehended more easily from the microstructure of the order book. In this study, we have developed novel CI-based methodologies for the task of price forecasting in HFT environment. In particular, we proposed autonomous genetic-based models that allow the forecasting systems to self-evolve. Through the GA, optimal combination of individual prediction rules and model parameters can be found, and the experimental results show that our self-evolving models can improve upon the previous methods on the accuracy of prediction for price movement at the microscopic level. In order to further examine the validity of our models, we conducted a statistical validation on the learned models and test them by out-of-sample data. It is shown that our proposed models can lead to better performance in different testing environments of HFT. With these results, we expect the proposed intelligent, self-evolving methodology to advance the current state of the study for price forecasting in HFT environment and enrich FinTech research.
In the future, since there exist several studies that use returns on investment instead of price forecasting for modeling, we thus propose to use returns for modeling as a potential line of research for HFT. Other alternatives are also possible. For instance, although using our proposed observation timing rule
Furthermore, although Rule 2 alone is not an effective forecasting system, with the power of self-evolving system
Although in this study we have been mainly developing forecast models for the call-auction matching mechanism, many components of the proposed method in the current work can be easily extended to the continuous trading environment because both trading mechanisms disclose the same crucial information for the modeling of price forecasting, including the best five bid and ask quotes, transaction price and the volume. Although the stock market in Taiwan will adopt continuous trading for the major trading environment in Year 2020, it will still utilize the call-auction mechanism at the very beginning at 9:00 AM and in the final 5 minutes (1:25 PM through 1:30 PM). Therefore, our current work can be still applied immediately to predict price behavior during these periods of time. In the future, we will further examine the difference between call-auction trading and continuous trading in order to fully extend our current work to the continuous trading system for HFT environment.
Footnotes
Acknowledgments
This work is fully supported by the Ministry of Science and Technology, Republic of China, under grant number MOST 106-2221-E-390-021-MY2.
Conflict of interest
The authors declare no conflict of interest.