
Abstract
Nowadays, computers, as well as smart devices, are connected through communication networks making them more vulnerable to attacks. Honeypots are proposed as deception tools but usually used as part of a proactive defense strategy. Hence, this article demonstrates how honeypots data can be analyzed in an active defense strategy. Furthermore, anomaly detection based on unsupervised machine learning techniques allows to build autonomous systems and to detect unknown anomalies without the need for prior knowledge. However, the unsupervised techniques applied for honeypots data analysis do not value the advantages of these tools’ data, particularly the high probability that they include a large number of previously unseen anomalies with unexpected and diverse patterns. Therefore, in the present work, the aim is to improve the unsupervised anomaly detection in honeypots data by varying the data feature subset and the parameterization of the anomaly detection algorithm. To this purpose, an outlier ensemble with LOF (Local Outlier Factor) as a base algorithm is proposed. The ensemble outperforms existing solutions as depicted in the experiments where a detection rate higher than 92% is achieved.
Introduction
Because computer networks are more and more accessible online, they are confronted with a plethora of security threats. Therefore, for a better defense by means of interacting with intruders, honeypots, a rapidly developing technology [25], whose value lies in being probed, attacked, or compromised [22], are widely used. These tools are of great importance because they gather data related to attackers’ activities allowing in this way the extraction of valuable information and the detection of previously unseen attacks and diverse anomalies before harming any production system. Therefore, robust and appropriate techniques and algorithms for analyzing deeply honeypots data while valuing their advantages are required.
In honeypots data analysis, the majority of previous works is essentially conducted as part of a proactive defense strategy where attack patterns are learned after their occurrence. Thus, in this paper, it is demonstrated how honeypots data can be exploited to be part of an active defense strategy. Furthermore, previous works rely either on supervised or unsupervised machine learning techniques. The promising trend for anomaly detection is the use of machine learning techniques working in an unsupervised fashion. Indeed, these techniques help to build autonomous systems which detect both known and unknown anomalies without the need for prior knowledge or training phase. Nevertheless, with the unsupervised techniques for honeypots data analysis, a small effort has been put in to exploit deeply the advantages of these data because the techniques either search in the full feature space of the data or use approaches that find anomalies as their side-products. Indeed, as it has been demonstrated in [6], anomalies can be hidden in lower-dimensional projections of the data, and these projections can be of different combinations and sizes. Furthermore, when using techniques such as clustering, the main objective is to group similar data points while the outliers are only side-products. Therefore, it is believed that using unsupervised methods which have outlier mining as their primary objective will permit to obtain better results. In the present work, it is referred to these techniques with the term “outlier-based techniques”.
Outlier-based techniques that operate in an unsupervised fashion are numerous [17], and their efficiency has been demonstrated [2]. However, when working with these techniques on high dimensional data, as in the case of honeypots data that contain anomalies of diverse and eventually of unknown patterns, important challenges can be identified: sparsity of the data a.k.a. the curse of dimensionality, outliers that can be hidden in particular data subspaces, the choice among different accurate algorithms, etc. To address these challenges, the ensembles analysis approach has been extended to the unsupervised anomaly detection field, especially to the outlier-based techniques [5, 4]. This approach is known as outlier ensembles, it combines results from different algorithms or iterations of one base algorithm fed with different parameters or applied to different data subspaces. Consequently, in this paper, an outlier ensemble is proposed as a solution for anomaly detection in honeypots data. To the best of our knowledge, there is no work on the use of outlier ensembles techniques for anomaly detection in honeypots data. Our contributions are as follows:
In order to include honeypots in an active defense strategy, a scheme to exploit their data appropriately is introduced. The problem of previously unseen anomalies is addressed by using the outlier-based anomaly detection algorithm LOF. This algorithm works in a completely unsupervised fashion, without any need for prior knowledge or training phase. An outlier ensemble that combines results of several executions of LOF with different parameters and different data subspaces is proposed to tackle the high dimensionality of the data and the anomalies hidden in subspaces. Three different functions are explored to combine the results of the ensemble models. The proposed outlier ensemble has been evaluated and compared to existing solutions.
The rest of this paper is organized as follows: Section 2 introduces the related work. Section 3 presents the proposed solution based on outlier ensembles for honeypots data exploitation and analysis. In Section 4, the experimental results are depicted and discussed. Finally, concluding remarks are given in Section 5.
Since their introduction, honeypots have been progressively gaining importance in network defense strategies. These deception tools allow collecting data that contain information of great usefulness. As can be seen in detail in Table 1, previous works on honeypots traffic data analysis aimed essentially to: (i) gain information about attacks and discover their patterns and root causes [7, 8, 16, 21], (ii) predict attacks [14, 23, 26, 27], and, (iii) detect and classify attacks [1, 9, 19, 18, 20, 21].
Summary of works on honeypots data analysis
Summary of works on honeypots data analysis
Additionally, both supervised and unsupervised machine learning techniques have been used for analyzing honeypots data. Supervised techniques can be found in [1, 7, 9, 23, 26, 27]. In [1], the authors have analyzed traffic from honeypots and production system in order to differentiate between internet normal traffic, anomalies and real attacks. For this purpose, the well-established supervised approaches k-nearest neighbor (KNN), Artificial Neural Networks (ANN) and Decision Trees have been used. The authors in [7] aimed at identifying and quantifying dependencies and distributions within honeynet data by investigating features such as: temporal and spatial distributions, attacked protocols, involved autonomous systems, etc. In [9], SSH attacks occurring in a honeypot are classified as “severe” or “not-so-severe” attacks. For this purpose, Logistic Regression, Support Vector Machine (SVM), J48, Naive Bayes, PART, OneR, and k-Nearest Neighbors have been used. In [23], C4.5, BayesNet, Decision Table, and Naive-Bayes algorithms have been applied to predict potentially vulnerable hosts, hence allowing to define security rules for Software Defined Network (SDN) controllers and to block the subnet of the responsible IP. The authors in [26] analyzed the statistical properties of honeypot-captured cyber-attack data with a framework based on the concept of stochastic cyber-attack process. They confirm that exploiting the long-range dependence (LRD) that is exhibited by these attacks can help to achieve prediction accurately. The LRD has also been exploited in [27] for attacks prediction in terms of attack rate, for this purpose, the extreme value theory, the time series theory, and the gray-box models have been used.
Unsupervised techniques have been applied to analyze honeypots data in [8, 14, 16, 18, 19, 20, 21]. One of the earliest works is presented in [8]. Herein, the authors used the Apriori algorithm to extract association rules and to build clusters with the goal of finding the root causes of attacks occurring on distinct ports sequences. The algorithm has been applied with a set of traffic properties such as the number of destination IP addresses and the number of packets. In [14], sequential rule mining has been used to identify common attack patterns and to derive rules for predicting attacks. Additionally, exploiting a collaborative environment allowed attack prediction in multiple dimensions. To run their experiment, the authors used the alert sharing platform SABU. The authors in [16] proposed a framework for attack patterns discovery in honeypots data. The work emphasized on the temporal correlations between attacks where clustering, with an appropriate measure, was performed on time series of attacks. As explained, the ultimate goal is to help the analyst figuring out if a new imminent attack can be attributed to the very same group of attacks. In [21], the Principal Component Analysis (PCA) has been applied to data from low-interaction honeypots to characterize attackers’ activities by finding and separating dominant groups of activities and finding outliers. In [20], the authors presented a method for detecting new attacks in honeypots traffic. A PCA model is built for the attacks seen in honeypots data, later, new observations are projected onto the residuals of the predefined PCA model and are tested against a predefined threshold. If a large deviation from the model is observed, the observation is considered as anomalous. Finally, recent works [19, 18] used a two-phase algorithm, namely UNADA, to detect and characterize anomalies occurring in honeypots. In the first phase, the authors use an algorithm for change detection in time series to flag anomalous time-slots. In the second phase, they aggregate the flows of the flagged time-slot and describe them with a set of traffic features to perform clustering with DBSCAN and identify small-size clusters and outliers. To avoid the lack of robustness in cluster analysis techniques, the authors used the notions of clustering ensemble with subspace clustering, and multiple clusterings combinations based on evidence accumulations and inter-clustering associations.
As it can be noticed, most works on honeypots data analysis are essentially conducted as part of a proactive defense [7, 8, 14, 16, 21, 23, 26, 27]. However, detecting intrusions and anomalies targeting the honeypots on time is also crucial. Indeed, this can allow triggering early warnings that will help to prevent threat propagation and to avoid the damage of production systems. Furthermore, using supervised techniques as in [1, 9, 23] has a major disadvantage because it is not possible to detect unknown attacks. Additionally, labeled data and model training are required. These issues do not exist with the unsupervised techniques. However, in the aforementioned works that rely on unsupervised techniques, several issues can be noticed. In [20], the method relies heavily on historical data. In [18, 19] as explained by the authors, the data features considered are those characterizing well already encountered traffic anomalies, i.e. known anomalies. And, in [18, 19, 20], the approaches that have been used find outliers as their side-products. However, when mining for anomalies in honeypots data, consideration should be given to the characteristics and to the advantages of these data in order to analyze them deeply with appropriate techniques. Consequently, in this paper and unlike previous works, several aspects for detecting anomalies in honeypots data are taken into account. Firstly, honeypots data consist mostly of anomalies. Therefore, a scheme to exploit them in a completely unsupervised way is proposed. Secondly, data described with a large number of diverse features are used and an appropriate algorithm has been applied because it is highly probable that some of these anomalies are previously unseen. Finally, the ensemble approach is explored in this work because when working on high dimensional data as in the case of honeypots data, the curse of dimensionality is encountered, and because each anomaly is generally characterized by few features only and certain feature subsets can be more relevant than others for detecting some anomalies [10]. Furthermore, since network anomalies are diverse, an algorithm with different parameterizations can detect different anomalies.
In the field of computer networks, an anomalous event can be a consequence of:
Intrusions and attacks such as Denial of Service (DoS) or Distributed DoS (DDOS) attacks, SQL injections, etc. Network failures such as traffic congestion, packets loss, etc.
Traditionally, signature-based intrusion detection systems are used to secure computer networks. With these systems, each time a new attack occurs, security experts design a signature for it and update the database of the intrusion detection system. Therefore, an activity is flagged as anomalous only if it presents a pattern that matches a known attack signature. As it can be concluded, these systems require a heavy human intervention for designing the attack signatures and do not cope with previously unseen anomalies. The second category of systems used for detecting anomalous activities in computer networks traffic is anomaly-based. In this case, normal activities are modeled and any activity that deviates from that model is considered anomalous. These anomaly-based techniques are also non-autonomous and rely heavily on prior knowledge about what constitutes normal behavior.
Honeypots are considered as traps for intruders usually used as part of a proactive defense strategy. Gaining deeper insight and understanding of the attacks after their occurrence is of major importance, however, detecting intrusions and anomalies targeting the honeypots on time, as part of an active defense strategy, is also crucial. Indeed, this would allow early detection of the attacks and triggering early warnings in order to enable human experts to take the necessary countermeasures, essentially preventing threat propagation and avoiding the damage of production systems.
Network traffic gathered with honeypots is different from the conventional network traffic. In fact, depending on the honeypots deployment and the level of their interaction with the intruders, the gathered data can be of tremendous value. Consequently, above-highlighted systems are not sufficient to deal with honeypots data, and, to design a well-suited scheme to exploit these data, their properties should be considered carefully. Firstly, the majority of the honeypots data is illegitimate. Secondly, it is highly probable that previously unseen anomalies occur, and the patterns of these anomalies can be discovered in the data. The main emphasis of our work is placed on the latter consideration, i.e., the detection of anomalous events occurring in honeypots data. However, a scheme to demonstrate how honeypots can be part of an active defense strategy and to address the problem of large amount of anomalous traffic is proposed, since with unsupervised anomaly detection techniques, that are exploited in this paper, it is assumed that anomalies represent a minority of the overall data.
As illustrated in Fig. 1, after gathering the traffic exchanged with the honeypots and pre-processing it, an appropriate conventional signature-based network intrusion detection system can be used to detect known anomalies in the data. After filtering out these anomalies, the remaining data will consist of normal activities and previously unseen anomalies and attacks. Subsequently, our anomaly detection solution can be applied to detect the remaining anomalous events.
Functioning of the scheme for exploiting honeypots data.
The above-mentioned techniques, i.e. the signature-based detectors and the anomaly-based detectors which rely on normal traffic modeling are not able to cope with unknown attacks or need a model of the historical normal behavior. Furthermore, these techniques rely on a heavy human intervention. Due to these disadvantages, in recent years, the trend is for the analysis of network traffic with completely unsupervised machine learning techniques.
In the data analysis field, anomaly detection is the process of finding unexpected patterns in data. These anomalies are also called outliers. When designing or applying an anomaly detection technique, various aspects should be taken into consideration [24] such as the nature of the input data (categorical or continuous, spatial, graph or sequence data), the output of the algorithm that can be either labels or scores, the types of anomalies to detect (point, collective or contextual anomalies), the availability of data labels, etc. Depending on the availability of data labels, machine learning techniques for anomaly detection are categorized into supervised, unsupervised, and semi-supervised. For our anomaly detection in honeypots data, point anomalies are targeted and the detection is made without relying on data labels, i.e. in an unsupervised fashion, and the results are formulated as labels.
Unsupervised anomaly detection techniques have gained a great interest in the research community especially in the field of network security due to their numerous advantages. Firstly, these techniques allow building autonomous systems which do not require a strong human intervention. Secondly, they operate by analyzing only the internal structure of the data, and for this purpose, properties such as distance and density measures are used. Consequently, these techniques work without a training phase and distinguish between normal and anomalous instances without the need for data labels. Finally, the important improvement brought by these techniques is their ability to detect new types of anomalies.
Numerous unsupervised anomaly detection algorithms have been developed, and they rely on the assumptions that anomalies are less frequent compared to normal instances and show rare and nonconforming patterns. Furthermore, several taxonomies were proposed to categorize unsupervised anomaly detection techniques. For instance, in [13] the authors classified unsupervised anomaly detection techniques into nearest-neighbors based, clustering-based, statistical, subspace-based, classification-based and others.
In our case, a nearest-neighbors based algorithm is used, namely LOF [15]. Nearest-neighbors based techniques are preferred to others since their primary objective is to seek for outliers while these deviating points are only side-products of the other techniques such as the clustering-based. Numerous outlier-based algorithms have been proposed in the literature and making choice is not an easy task. However, the efficacy of LOF has been demonstrated, including in the network traffic analysis field [2], and, most importantly, the approach detects outliers lying in neighborhoods with different properties [15].
LOF is a density-based anomaly detection approach that assigns a degree of outlierness to each point in the data. To compute the degree of outlierness, firstly, a
Later, by replacing
Finally, the local outlier factor of a point
The degree of outlierness depends on the number of local neighbors MinPts used to define the local density for each data point and this number is an input parameter of the algorithm. When a data point has a local outlier factor greater than a certain threshold
An emerging and promising technique in the field of unsupervised anomaly detection is outlier ensembles [4, 5]. The notion of ensembles analysis refers to the combination of results from different algorithms or iterations of one base algorithm fed with different parameters or different data subspaces. The main purpose of this approach is to improve the accuracy of the anomaly mining process by combining results from diverse algorithms and to address the curse of dimensionality when feature subspaces are used. Indeed, it has been demonstrated that making a consensus of results from different models can achieve better results than those of the base algorithms, including in anomaly detection [3]. However, when building an ensemble of unsupervised anomaly detection algorithms [4], careful consideration should be given to the diversity of the algorithms used to construct the ensemble, their accuracy and, the combination of their results.
In our case, to improve the unsupervised anomaly detection, an outlier ensemble with LOF as a base algorithm is proposed. Close to our work, the general-purpose feature bagging solution for outlier detection presented in [3]. In [3], diversity is induced by using different sets of features while in our case, the diversity of the ensemble is induced by using different sets of features, but also by feeding the outlier detection algorithm with different subsets of the full set of well-performing values of the parameter MinPts in terms of detection and false alarms rates. It is expected that these different parameters will contribute to improving the accuracy of the detection algorithm. Furthermore, unlike [3], the results of the sequential execution of LOF algorithm are combined with three different functions, from which, the well-performing one, i.e. the one that achieves the optimal detection and false alarms rates, will be retained as our final combination function. The general approach of the proposed parameterization and feature subspace based outlier ensemble (PFSOE) is presented in Algorithm 1.
After collecting traffic traces exchanged with the honeypots, representative data with descriptive features should be extracted and constructed. As can be seen from the general algorithm, our technique uses tabular data
where
Once the data of the current window are normalized, an outlierness score is assigned to each data instance and finally, the decision on whether it is anomalous or not is made.
At each iteration
At the end of the
The choice of a combination function is of tremendous importance [5, 4]. In our case, in order to combine the results obtained from the different models of our ensemble, three combination functions are explored, namely, the averaging combination function, the maximum combination function, and the majority voting combination function. The three functions are defined as follows:
The averaging combination function: herein, the average degree of outlierness
The final degree of outlierness of each data point The maximum combination function: in this case, the maximum degree of outlierness of each data point
As for the averaging function, if the final degree of outlierness
where The majority voting combination function: with this function, the decision on the maliciousness of each point is made at the level of each model of the ensemble. Thus, at the end of the S iterations, a set
where Later, the final decision on the maliciousness of an observation is made by taking into account the decision of the majority of the models and saved in Labels as depicted in the following equation:
where bound is the percentage of the ensemble models to consider as the majority.
In this section, the honeypots data used in the experiments are presented, details are given on how the different parameters of the ensemble were fixed and the experiments conducted in order to choose the appropriate combination function are presented. Finally, the results of the cross-validation and the comparison of the performance of our work are presented and discussed.
Experimental setup
To evaluate the performance of our PFSOE algorithm, our experiments were performed on the Kyoto 2006
Data attributes used in the experiments [12]
Data attributes used in the experiments [12]
Since the major part of the data is attacks, it is assumed that any signature-based intrusion detection system can be used to filter out the known attacks as explained before and depicted in Fig. 1. Therefore, to conduct our experiments, the number of anomalies is reduced by keeping only the unknown malicious events. The properties of the data file before and after the changes were brought are described in Table 3. Furthermore, the number of observations has been adjusted to fit the size of the sliding window of our ensemble.
Properties of the data file used in the experiments
To conduct our experiments, the dataset was split into two equal sets: a training set and a test set. The training set was used in order to fix the range of values for the parameter MinPts and explore the different combination functions. The test set was used for the comparison of our work to existing solutions. In order to have a more reliable estimate of the performance of the algorithm, we have also used 10-fold cross-validation to compare the proposed PFSOE and to choose the range of values for the parameter MinPts and the most accurate combination function.
To evaluate the performance and effectiveness of the proposed ensemble, the following evaluation metrics were used: Accuracy, true positives rate (TPR) and false positives rate (FPR). True positives (TP) are events labeled as anomalous that are indeed anomalies, while false positives (FP) are events labeled as anomalous that are, in reality, legitimate events. Normal events that were labeled as normal are called true negatives (TN), while the anomalous events that were labeled as normal are called false negatives (FN). Accuracy, true positives rate and false positives rate are defined as follows:
Furthermore, to illustrate the performance comparison, the area under the curve (AUC) and the Receiver Operating Characteristic (ROC) curves which depict the TPR as a function of the FPR were used.
In our experiments, the size of the sliding window
Selection of the MinPts values
Several experiments have been conducted to analyze the sliding windows of the training set in order to find the well-performing values of the parameter MinPts. LOF was applied on the sliding windows with a large set of values for MinPts. Furthermore, the algorithm has been applied on different data subspaces. After the manual inspection of the obtained results from each window, the range of well-performing values for MinPts,
Selection of the combination function
In order to combine the results of the ensemble and make a consensus of the different models, three combination functions were explored, namely, the averaging combination function, the maximum combination function, and the majority voting combination function. This experiment has been conducted on the training data. Furthermore, to evaluate the performance of the different combination functions, it has been ensured that all the 49 models were the same when testing the functions, i.e. the same feature subsets and the same sets of values for Minpts in the different iterations were used.
The ROC curves, obtained with a variable threshold, for the TPR and FPR of the PFSOE algorithm executed with the three combination functions, are presented in Fig. 2. And, the AUC of the different combination functions are shown in Table 4. As can be seen, both the majority voting and the averaging functions outperform the maximum function. Indeed, this function causes a high number of false positives because a large LOF value can be assigned to non-anomalous observations by a specific model. From the results, it can also be noticed that the majority voting function outperforms the averaging function. The low performance of the averaging combination function can be explained by looking at the final outlierness scores of the data points. These scores are obtained by averaging the results of the different models which causes loss of accuracy if some models are of low accuracy. The majority voting function doesn’t make any changes in the original scores, and, unlike the maximum combination function, it considers the decision of several models instead of only one model, hence it outperformed the two functions. However, as mentioned earlier, different upper bounds were applied to the majority voting instead of the 50% bound. In the same figure, it can be seen that the function’s bound was set to 50%, 60%, 70%, and 80% and the bound that performed the best is the one set to 70%.
Since better results have been achieved with the majority voting based combination function, it has been retained to make the consensus of the results of the PFSOE.
AUC of the different combination functions
AUC of the different combination functions
ROC curves of the different combination functions.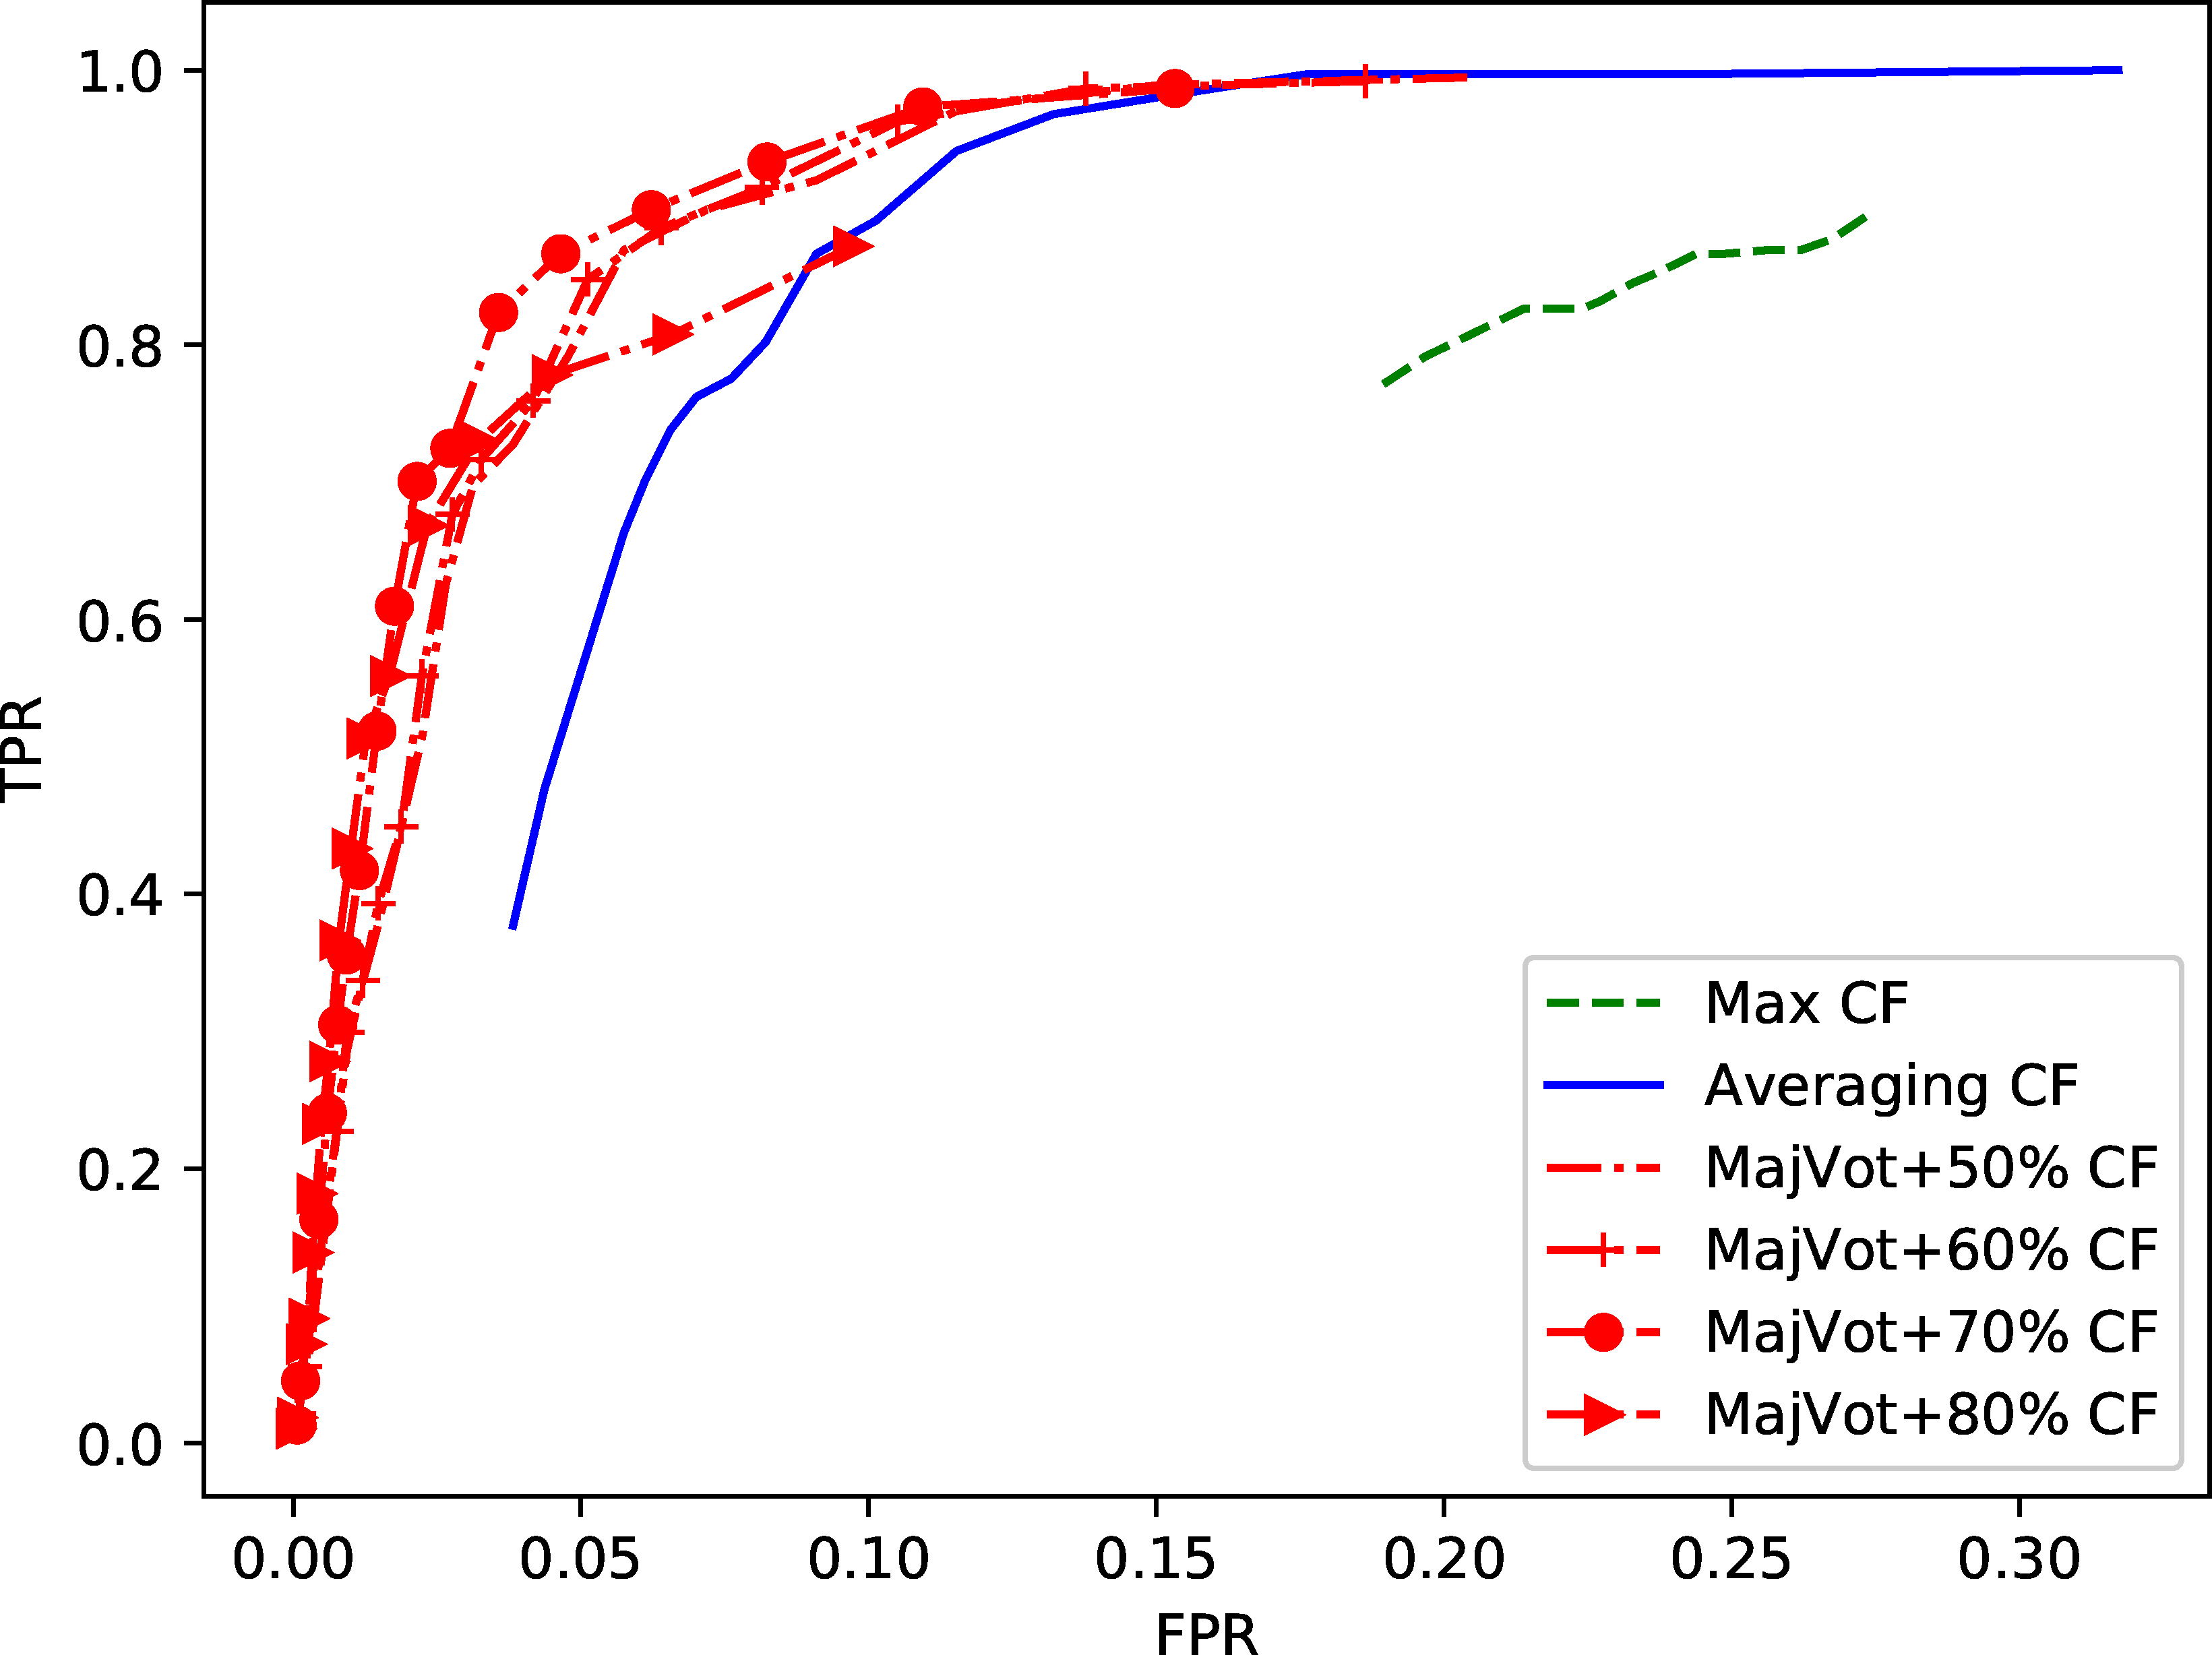
The performance of the proposed outlier ensemble was compared to both the base algorithm LOF [15], and the feature bagging solution presented in [3]. For LOF, the well-performing value of MinPts, i.e.
ROC curves for the different approaches LOF, Feature Bagging and our outlier ensemble (PFSOE). In (a) both LOF and Feature Bagging were applied with MinPts 
Figure 3 shows the computed ROC curves for the TPR and FPR obtained for the different approaches, LOF, Feature Bagging and, the proposed PFSOE. The curves were obtained with a variable threshold. The subplot (a) presents the results of executing LOF and Feature Bagging with the parameter
It should be mentioned that the presented FPR and TPR are those obtained for the overall test set, and are not computed by averaging the obtained FPR and TPR from the different windows. However, in order to ensure a more reliable evaluation of the proposed outlier ensemble, 10-fold cross-validation has been conducted. The training phases of each experiment allowed to confirm that the majority voting combination function with an upper bound set to 70% and the set
Results of the 10-fold cross-validation, LOF and Feature Bagging were applied with MinPts
Results of the 10-fold cross-validation, LOF and Feature Bagging were applied with MinPts
In recent years, honeypots are gaining great interest. Therefore, efficient techniques for analyzing their data are necessary. In this paper, all aspects related to the honeypots data were taken into consideration. Due to the important number of anomalous events that constitute the data, a scheme to exploit them appropriately was proposed. The PFSOE, an outlier ensemble based on LOF for anomaly detection and deep analysis of the data, was presented. The solution works in an unsupervised fashion, therefore it deals with previously unseen anomalies. It also deals with the high-dimensionality characteristic of the data by working on data subspaces. Moreover, the presented outlier ensemble tackles the diversity of the anomalies by searching for the anomalies in different data subspaces and applying the outlier detection algorithm with various parameters. Addressing all these challenges allowed the proposed solution to achieve better results when compared to the base algorithm LOF and an existing general-purpose outlier ensemble. Indeed, a detection rate higher than 92% for 8% of false alarms could be achieved in a completely unsupervised fashion. Additionally, the results of the cross-validation allowed demonstrating the robustness of the outlier ensemble. In the present work, the feature subsets are created randomly. However, as a future work, the aim is to improve the proposed detection method by partially feeding the ensemble with relevant subspaces learned throughout the detection process.
Footnotes
Acknowledgments
This work was funded by the National Natural Science Foundation of China, Grant number 61272420 and 61472189.