
Abstract
Early and precise diagnosis of schizophrenia disorder (SZ) has an essential role in the quality of a patient’s life and future treatments. Structural and functional neuroimaging provides robust biomarkers for understanding the anatomical and functional changes associated with SZ. Each of the neuroimaging techniques shows only a different perspective on the functional or structural of the brain, while multi-modal fusion can reveal latent connections in the brain. In this paper, we propose an approach for the fusion of structural and functional brain data with a deep learning-based model to take advantage of data fusion and increase the accuracy of schizophrenia disorder diagnosis. The proposed method consists of an architecture of 3D convolutional neural networks (CNNs) that applied to magnetic resonance imaging (MRI), functional magnetic resonance imaging (fMRI), and diffusion tensor imaging (DTI) extracted features. We use 3D MRI patches, fMRI spatial independent component analysis (ICA) map, and DTI fractional anisotropy (FA) as model inputs. Our method is validated on the COBRE dataset, and an average accuracy of 99.35% is obtained. The proposed method demonstrates promising classification performance and can be applied to real data.
Introduction
Schizophrenia (SZ) is a complex mental disorder involving abnormal brain functions, such as cognitive impairment, mental impairment, and aberrant sensory awareness [1]. The conventional approach to diagnosing schizophrenia is based on clinical interviews, and there are no standards that can be used for final validation [2]. Recently, vast research has been carried out on the search for biomarkers and designing automated systems that use machine learning tools and various types of neuroimaging techniques to diagnose SZ [3, 4, 5, 6, 7]. Neuroimaging, such as structural and functional magnetic resonance imaging (sMRI, fMRI), positron emission tomography (PET) and, diffusion tensor imaging (DTI), provides essential information to realize the involved anatomical and functional changes in schizophrenia. Researchers have been used the various extracted features from neuroimaging modalities to design a system for automatically diagnose schizophrenia. These features are categorized into voxel and region level categories. Chyzhyk et al. [8] considered the problem of classification of SZ patients with and without a history of auditory hallucinations (AH) and healthy control subjects, by extracting regional homogeneity (ReHo) and fractional amplitude of low-frequency fluctuations (fALFF) as voxel-based features from resting-state functional magnetic resonance imaging (rs-fMRI) data. The voxel-based features are simple and very detailed but generally have very high dimensionality, so usually used in conjunction with feature selection techniques. Many researchers use region-based features. For instance, Rashid et al. [9] for classifying bipolar, schizophrenia, and healthy subjects used static and dynamic functional network connectivity (FNC), which is the temporal correlation between different brain regions extracted from fMRI data. The region-based features have low dimensions and are less sensitive to noise. These features are generally not susceptible to minor changes. Also, disease-related information may locate in a part of a region or in several multiple areas that should be considered. Due to both structural and functional brain impairments in most cases of mental disorders, the combination of neuroimaging data from several sources can provide additional information to improve the diagnosis of the disorder [10, 11]. Previous studies on multi-modal brain disorder classification such as Alzheimer’s disease [12, 13, 14, 15, 16], autism [17, 18], Parkinson’s [19], and schizophrenia [20] have shown promising results in the multi-modal fusion of brain imaging data. Deep learning approaches have recently acquired excellent reliability, especially for extracting useful information for medical image processing and computer vision applications [21]. In medical image analysis, deep learning methods can discover intricate patterns and no need handcrafted features; thus, non-experts can use them for their researches [22]. Suk et al. [23] proposed a stacked auto-encoder (SAE) based method to extract hidden data from FDG-PET, MRI, and clinical scores for classification of AD/MCI/HC. Zeng et al. [24] proposed a deep discriminant auto-encoder network with a sparsity constraint (DANS) model using functional connectivity measures, calculated from multi-site fMRI data for automatic diagnosis of schizophrenia. Kim et al. [25] use whole-brain FC maps as input to a deep neural network (DNN) for the classification of SZ/HC. Hosseini-Asl et al. [26] designed a model based on 3D-CNNs for extracting distinguishing features to diagnosis AD with structural MRI data. Liu et al. [22] proposed a cascaded 3D-CNNs and 2D-CNNs model for AD classification. They built 3D-CNNs on various MRI and PET local patches to generate compact high-level features. Inspired by the success of CNNs in the diagnosis of psychiatric disorders, we present a novel algorithm based on multi-modality and 3D-CNN architecture to learn and to combine the different and multi-level input data. The model uses 3D patches extracted from MRI and handcrafted features extracted from fMRI and DTI as input. We preserve MRI spatial data during the training and design a 3D-CNN model for learning MRI 3D patterns. The network generates automatic features from them. We extract independent component analysis (ICA), and fractional anisotropy (FA) from fMRI and DTI, respectively, as handcrafted features. The model uses a 3D-CNN architecture for each of them to obtain discriminative features. Then two fully connected layers use for feature fusion. Finally, this architecture is complemented by a softmax prediction layer to classify SZ/HC subjects. In summary, the main contributions of this work are as follow:
We represent a framework for the fusion of different source data based on 3D-CNNs for classifying healthy control (HC) and schizophrenia-strict (SZ) subgroups. The model combines different sources and different types of voxel-based features: MRI patches with no need for further processing such as segmentation or registration, ICA measures which simulate fMRI data as a mixture of spatially independent sources and fractional anisotropy as a measure from DTI data. Our proposed model maintains the intrinsic relationships of each feature due to the use of 3D inputs. We found that the fractional anisotropy alone as input to the proposed model is more accurate than the other two used features, and the combination of each of the two features increases the accuracy of the classification. Finally, we demonstrate the fusion of three proposed features can complement each other and enhance the accuracy of diagnosis SZ.
In the recent decade, there has been an increasing interest in employing unimodal analysis and multi-modal fusion with machine learning methods for diagnosis of schizophrenia disorder. Some researchers have focused on the extracted low-level features from uni-modal data. For example, Chyzhyk et al. [27] and Savio et al. [28] used local activity measures such as voxel-mirrored homotopic connectivity (VMHC) and amplitude of low-frequency fluctuations (ALFF) [29] derived from fMRI for diagnosis SZ. Lu et al. [30] employed both voxel-based morphometry (VBM) and region of interest (ROI) analyses extracted from structural MRI for each subject. They classified them into SZ/HC groups with the SVM and recursive feature elimination (SVM-RFE) approach. Liu et al. [31] constructed individual hierarchical brain networks from structural MRI images for the classification of schizophrenia. Qureshi et al. [32] designed a deep learning classification framework with 3D-CNNs based ICA features. Kaufmann et al. [33] calculated functional connectivity measures based on group-level ICA analysis as rs-fMRI features and utilized regularized linear discriminant classifier for classification procedure. Phang et al. [34] utilized time and domain connectivity patterns derived from EEG signals. They proposed a CNN framework for Identifying Schizophrenia subjects. De Pierrefeu et al. [35] computed neuroanatomical features such as the volume of subcortical, voxel-based morphometry (VBM) maps, and the average thickness of cortical parcels from sMRI. Caprihan et al. [36] introduced a principal component analysis based method and applied to DTI data to identify age-matched schizophrenia patients from healthy controls subjects. Deng et al. utilized [37] tractography-based diffusion features to classify first-episode schizophrenia (FES) and healthy individuals. Yan et al. [38] proposed a multi-scale recurrent neural networks (RNN) framework to deal with this issue. Their model used independent components (ICs) calculated from fMRI time courses. Although the diagnosis of schizophrenia by uni-modal neuroimaging imposes less time and cost on the patient, it may reduce accuracy because both brain’s functional and structural changes are not considered. Therefore, some researchers suggest combining the information contained in images obtained by different MRI methods as a way to improve the accuracy of classification. Cetin et al. [20] Combined magnetoencephalography (MEG) and fMRI data by static and dynamic functional network connectivity analyses. They reported classification accuracy improved relative to the use of a single modality. Qureshi et al. [10] combined 12 weighted features (nine structural and three functional) to the diagnosis of schizophrenic patients. They proposed a concatenation method based on hybrid weighted features. Guo et al. [3] constructed ROI-based multi-index vectors by the combination of the functional, structural, and DTI features. These vectors for each ROI consist of 89 functional connectivity (FC) coefficients from fMRI, the volume of grey matter (GM) and white matter (WM) from sMRI and the fractional anisotropy (FA), radial diffusivity (RD) and mean diffusivity (MD). In [39], Liu et al. extracted eight features from sMRI and DTI images via multi brain atlases then a feature selection method applied to select the most discriminative features. Sui et al. [40] proposed a fusion model called ‘mCCA1
multi-set Canonical Correlation Analysis.
joint Independent Component Analysis.
Convolutional neural networks (CNNs)
CNN models are an important class of deep architectures which have been used in many machine learning fields. There are various variants of CNN models used in the literature. However, their essential components are fundamentally the same. Generally, in addition to one input and one output layer, convolutional neural networks also have multiple hidden layers that stacked on top of each other. Typically, CNN hidden layers consist of convolutional layers, pooling layers, rectified linear unit (RELU) layers, activation function, and fully connected layers. The convolution layer has several filters with the predefined size that convolve with the input of the layer to create a feature map for the next layer. The main idea of the convolutional layer is the extraction of visual features such as edges, lines, etc. The convolutional layers can hold spatial patterns and share weights over the entire spatial region, thus expand the generalization ability of the model. The next important layer is pooling that uses to down-sampling the feature maps of the former layer. The output of this layer due to applying max or average activation becomes more robust than small shifts and effectively reduces the size of feature maps. Commonly, several convolutional and pooling layers are repeated successively. The classification part of the network is made of several fully connected layers and generate the final results. Conventional CNN is designed for use on 2D data. However, applying 2D-CNN on 3D data such as video or MRI because of missing information on the third dimension is a challenge. To tackle this problem, Ji et al. designed a 3D-CNN architecture to analyze video for action recognition [42]. So feature maps obtained from both the 2D image and time by performing 3D convolutions. Similar to video data, MRI and DTI data both also have three dimensions; thus, in the proposed method, we utilize 3D convolutions to extract the 3D local patterns of neuroimaging features to help the diagnosis of schizophrenia.
Independent component analysis (ICA)
ICA is a practical method to decompose multivariate observed data into separate components that are statistically independent. ICA is also used as an efficient tool to analyze the hidden spatial and temporal structure contained in the brain imaging data. Figure 1 shows a general ICA model for fMRI data. In the data matrix, each row represents simultaneously 3D volume data, and each column contains data at all-time points from one voxel. All voxels are ordered next to each other to create one long row, at each point in time, which represents the entire three-dimensional brain. Spatial ICA decomposes fMRI data into the mixing matrix and spatially independent component (spatial maps) matrix. Mixing matrix is an M-by-N, where M is the number of time courses, and N is the number of components. The spatially independent matrix is an N-by-V, where V is the voxel number [43]. The goal of the ICA is to calculate the spatially separate component matrix.
Spatial ICA for fMRI data. The rows in the data matrix are contain vectorized spatial scanned volumes. Activation time-courses are in the corresponding column in the mixing matrix, and the rows of the array of the spatial map are vectorized volumes.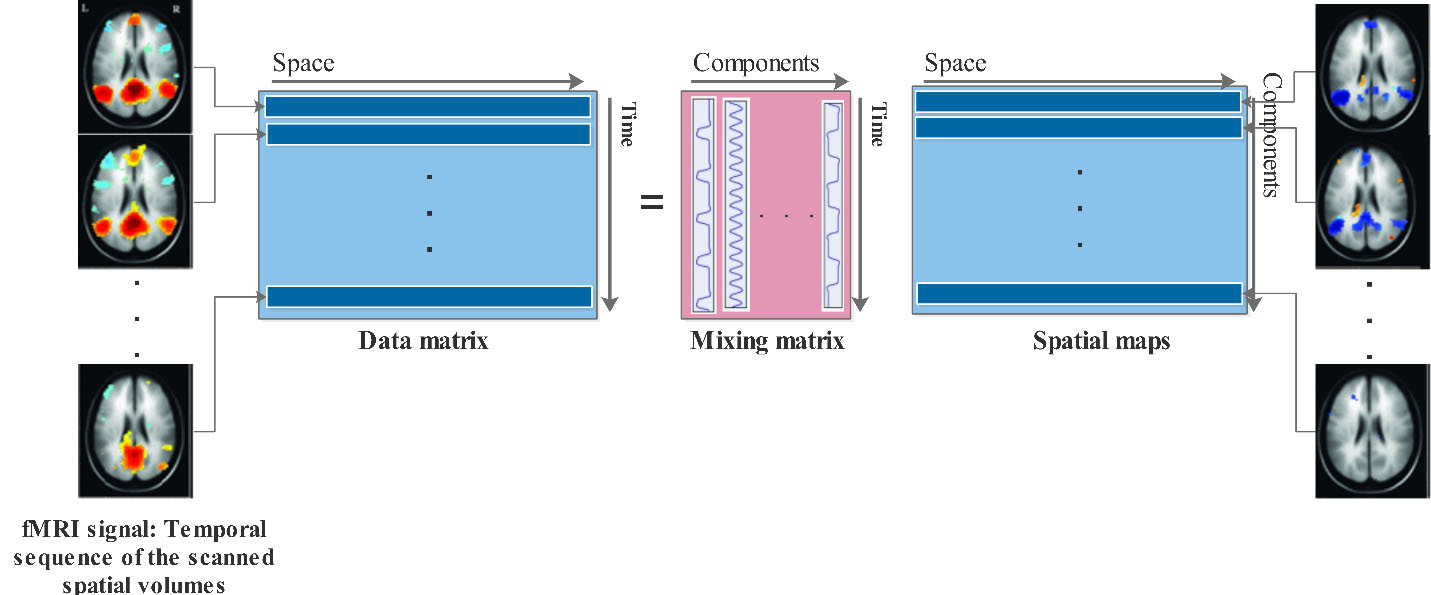
FastICA is One of the most successful approaches for solving ICA problems, especially for biomedical signal processing [44]. FastICA provides an easy way to extract independent components. It is independent of any user-defined parameters and quickly converge to the most accurate solution allowable by the data. We apply the FastICA library3
Proposed architecture based on 3D-CNNs for the fusion of multi-modal data to classify SZ/HC subjects. The inputs of the model are three types of whole-brain 3D features from different sources. The architecture contains three channels. Each channel comprises three layers, including three 3D-CNN layers. Finally, two fully connected and a softmax layer concatenate and classify data.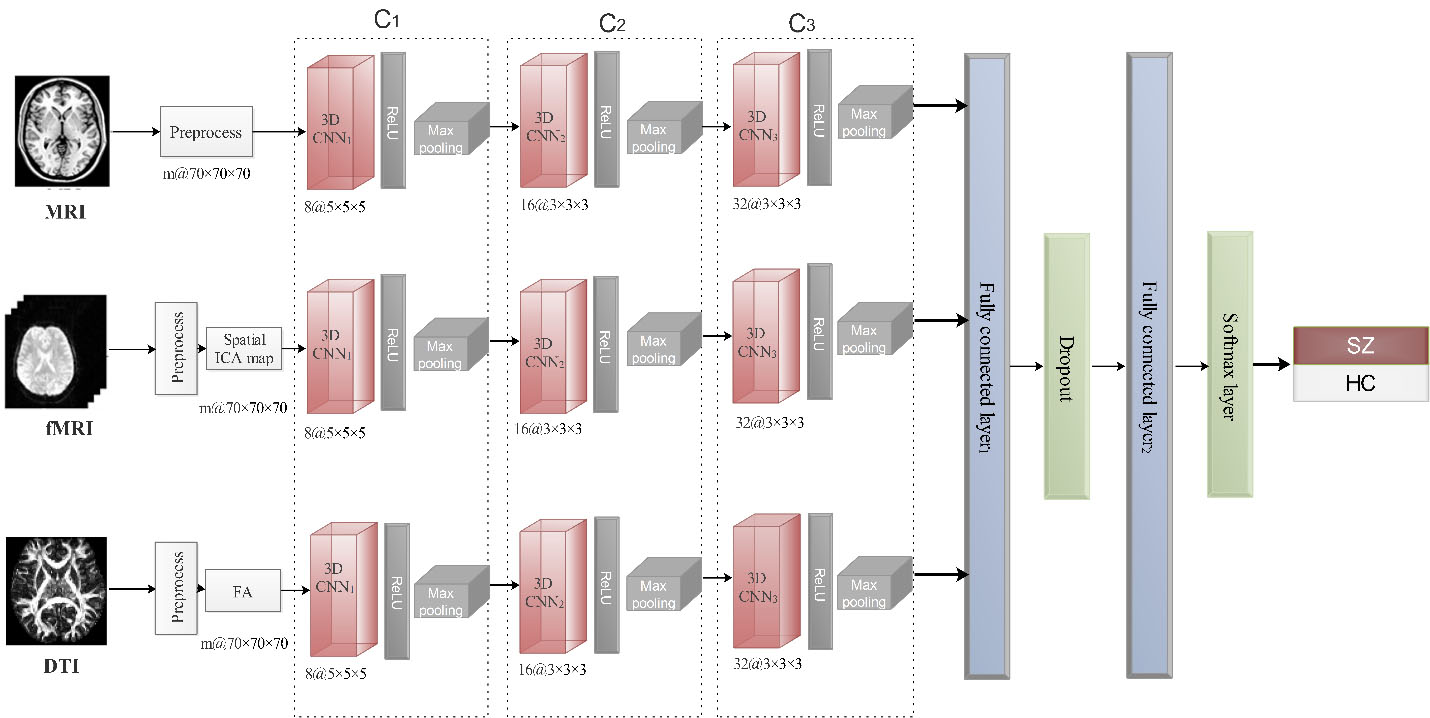
Figure 2 shows our multi-modal 3D-CNN architecture to classify SZ and HC subjects. The model has three similar channel that takes MRI, fMRI, and DTI data as input, separately. After pre-processing all the input data, we extract the desired features. Pre-processing details are described in Section 4.1. To reduce complexity, we consider a cube with a size of 70
Where
Pseudo-Code for Training proposed architecture
Experiment dataset
In this work, we use the ‘Center for Biomedical Research Excellence’4
We use the COBRE data set to evaluate our multi-modality 3D-CNN architecture. To avoid random factors influencing the results, we apply a ten-fold cross-validation manner with eight folds for use in the training step and one fold for each of the validation and the testing steps. We use the validation part to end the training process when obtaining the optimized weight for the model. We implement the proposed model with the TensorFlow library [53] in Python and Google COLAB systems. To evaluate the effectiveness of classification and comparison with the other studies, we calculate the classification accuracy (ACC), the specificity (SPE), the sensitivity (SEN), and the area under the receiver operating characteristic (ROC) curve (AUC) [10] and demonstrate the ROC curves.
Performance of the model with single and multi-modality input
In the first experiment, we evaluate the proposed model on the different individual modalities and the fusion of multi-modalities. We use MRI patches, fMRI (ICA components), and DTI (FA biomarker) as the input of the model in the separate experiments. The multi-modality tests perform as the fusion of MRI-fMRI, MRI-DTI, fMRI-DTI, and MRI-fMRI-DTI. In these tests, we consider three 3D-CNN layers and set other network parameters the same as discussed in the previous section. Table 1 shows the evaluated results of the SZ’s vs. the HC’s subjects. Figures 3 and 4 compare the ROC curves of these experiments.
Comparison of the single and multi-modality
Comparison of the single and multi-modality
Comparison of the ROC curves of single and multi-modality classification.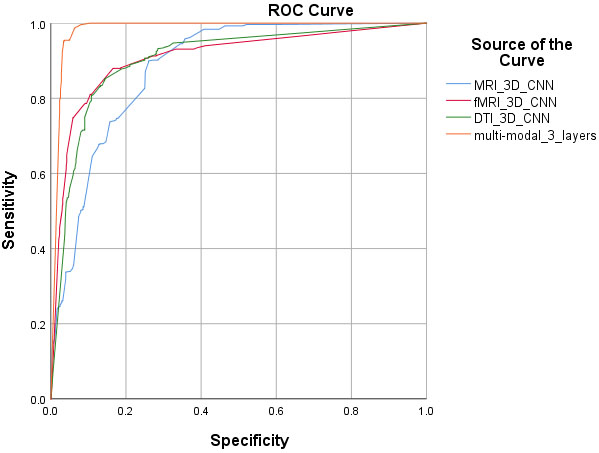
Comparison of the ROC curves of different multi-modalities classification.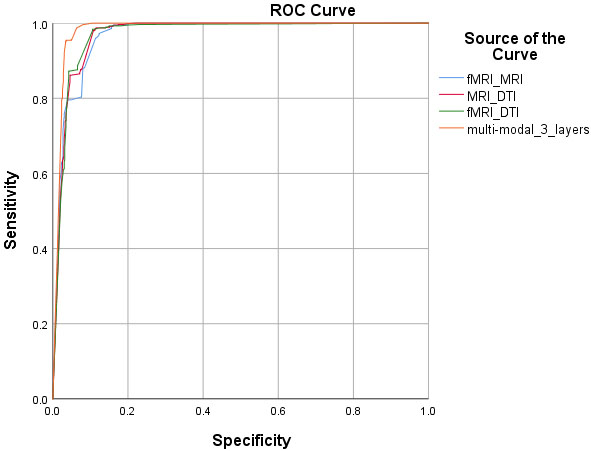
In this experiment, we change the count of 3D-CNN layers for the fusion of “MRI-fMRI-DTI” and compare the model performance. In separate tests, we use 3, 4, 5, and 6 layers of 3D-CNNs for each modality. All network parameters are the same as discussed in Section 4.1. In these tests, we set 32 different (3, 3, 3) convolutional 3D kernels for layers 3 and 4, and 64 convolutional 3D kernels with the size of (5, 5, 5) for layers 5 and 6. Table 2 shows the comparison of their classification performance, and Fig. 5 demonstrates the ROC curve of each experiment.
Our model classification performance with changing in the number of 3D-CNN layers
Our model classification performance with changing in the number of 3D-CNN layers
Our model classification performance with changing in the number of 3D-CNN layers
ROC curves of experiments with the different layer number of 3D-CNNs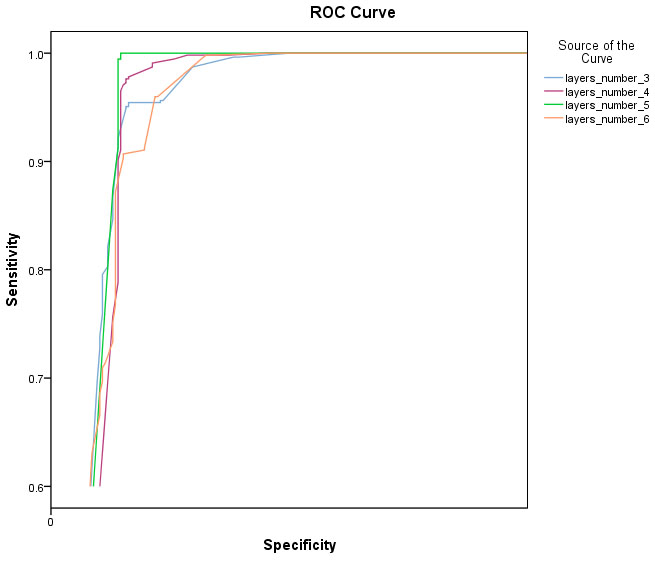
A performance comparison of our 3D multi-modal approach with the presented results in the papers is shown in Table 3. In Section 2, we described the used methods in these articles. It should be noted that different feature extraction and classification approaches and also the different datasets are effective on the obtained results. All these differences make it difficult to compare results. Moreover, differences in sample size and applying the cross-validation can also make it challenging to achieve a fair comparison [22]. In contrast to these methods, our approach requires fewer pre-processing steps to extract features. Our approach does not require any ROI or voxel-based analysis, segmentation, or rigid registration, which reduces calculation costs.
Discussion
Different from the previous techniques that rely only on the handcrafted features, the proposed method combined automatic and handcrafted extracted features and use them to find latent features to diagnosis schizophrenia. We used MRI patches with no segmentation, rigid registration, or further pre-processing. 3D-CNNs learn the properties of these patches and provide features that are more robust to individual variations such as translation, rotation, etc. Researches have proposed a wide variety of ICA approaches, and more of them successfully applied to the study of functional network biomarkers in the fMRI data [9, 54, 55, 56]. In this study, we used the first component of the ICA model to reduce complexity. From DTI data, we extracted FA measures. Several studies have shown the relationship between FA measures and symptoms of schizophrenia [57, 58, 59, 60], and that is why we chose it. Results in Table 1 show, all single modalities have acceptable results, and as we expected, the accuracy of all multi-modality cases improved. The improvement in classification accuracy shows that there is complementary information in each of the modalities, and the combination of MRI, fMRI, and DTI data is very suitable in diagnosis SZ. For finding proper tuning for the network, we changed the number of 3D-CNNs layers. As Table 2 shows, by increasing the layers, accuracies increased, but after the 5th layer, it decreased. One reason for this situation is that the number of training samples is low. We report the accuracy of our model with five layers of 3D-CNNs. Comparing the results in Table 3 shows that the proposed method with 99.35% accuracy is reliable, but Because of the datasets are not the same, judgment is not fair. However, our proposed method with fewer low-level features is capable of delivering promising results with less complexity. There are some limitations to our proposed method. First, choosing random weights may lead to changes in results; however, we can use the fixed seed for the initial weights for reproducible results. Second, the 3D-CNN parameters, such as the size and number of filters in each layer or the number of layers, may not be optimally set. We find optimal settings in our experiment by cross-validation. Third, in this study, only ICA components and FA are used as low-level features. There are more informative features such as mean diffusivity (MD) and mode of anisotropy (MO) from DTI images and the amplitude of low-frequency fluctuation (ALFF), the fractional amplitude of low-frequency fluctuation (fALFF), regional homogeneity (ReHo), voxel-mirrored homotopic connectivity (VMHC) from rs-fMRI, which may improve the performance.
Conclusion
In this study, we have presented a multi-modal classification algorithm based on the 3D-CNNs to diagnosis SZ subjects from normal healthy control subjects using the fusion of MRI, fMRI, and DTI images. Our proposed method combines row data and low-level features with a simple architecture to this end. We built the 3D-CNNs on the MRI patches (row data) and low-level features extracted from fMRI and DTI images. The network gradually learns the latent features from multiple imaging modalities and fusing them for disease classification. Experimental results on the COBRE dataset demonstrate promising performance for SZ diagnosis. Promising results on our experiments showed that the fusion of structural and functional data with 3D-CNNs architecture is useful in diagnosis schizophrenia. In future work, we try to use a large dataset contain multi-site imaging data and try to find the effective fusion of features with this architecture based on one modality to reduce time and cost.
Footnotes
Acknowledgments
The authors would like to very kindly thank the anonymous reviewers for their valuable comments, which helped us to improve the work.