



Abstract
Recent technological enhancements in the field of information technology and statistical techniques allowed the sophisticated and reliable analysis based on machine learning methods. A number of machine learning data analytical tools may be exploited for the classification and regression problems. These tools and techniques can be effectively used for the highly data-intensive operations such as agricultural and meteorological applications, bioinformatics and stock market analysis based on the daily prices of the market. Machine learning ensemble methods such as Decision Tree (C5.0), Classification and Regression (CART), Gradient Boosting Machine (GBM) and Random Forest (RF) has been investigated in the proposed work. The proposed work demonstrates that temporal variations in the spectral data and computational efficiency of machine learning methods may be effectively used for the discrimination of types of sugarcane. The discrimination has been considered as a binary classification problem to segregate ratoon from plantation sugarcane. Variable importance selection based on Mean Decrease in Accuracy (MDA) and Mean Decrease in Gini (MDG) have been used to create the appropriate dataset for the classification. The performance of the binary classification model based on RF is the best in all the possible combination of input images. Feature selection based on MDA and MDG measures of RF is also important for the dimensionality reduction. It has been observed that RF model performed best with 97% accuracy, whereas the performance of GBM method is the lowest. Binary classification based on the remotely sensed data can be effectively handled using random forest method.
Introduction
Timely and accurate information about agricultural statistics is essential to support decision making related to crop production to meet future food needs and ensure food security [1]. Remotely sensed data may assist the policy makers to extract the agricultural information in an effective manner [2]. The crop information so generated may be coupled with sophisticated statistical techniques for effective and optimized decision making. Sugarcane is one of the important cash crops and India is Second largest producer of the sugarcane after the Brazil.
Sugarcane regrown from the remaining buds of subversible stublle of plantation sugarcane is known as ratoon sugarcane. Ratoon sugarcane has been adopted as frequent farming practice all over the world, and it covers approximately half of the entire area covered under the sugarcane [3]. Despite the low yield, the authors explored various benefits of the ratoon sugarcane, such as early maturity, better transport management, and economical advantages. The authors of [4] explored the impact of ratoon crop on various biometric parameters such as plant height, stalk diameter and number of tillers. In addition to the biometric characteristics, the effect of ratooning on physiological parameters such as Leaf Area Index (LAI) and leaf weight. LAI is a crucial parameter to analyse the photosynthesis and related activities during the growth season of a crop.
The growth and yield of the ratoon sugarcane have a strong relationship with Number of Millable Canes (NMC), stalk height and cane weight [5]. The growth rate of ratoon sugarcane is high during the initial stages of the season, but the growth of plant sugarcane shoots up during the grand growth phase. This distinct variation in the growth may be captured for the different kind of analytical studies. The growth rate of the sugarcane starts declining around 160 days after the plantation or the previous harvest in the case of ratoon sugarcane [3]. Consequently, the ratoon sugarcane becomes available for earlier crushing as compared to planted sugarcane. Sugarcane mills of the area purchase the sugarcane from the peasants for the crushing. Therefore ratoon sugarcane plays a significant role associated with sugarcane production. An increasing number of stakeholders prefer ratoon sugarcane due to its economic benefits as well as time-saving in planting and other operations [6]. On the other hand, the yield decline in the successive ratoons restricts the farmers about comprehensive ratooning. Hence, there is a need to analyze and explore the growth pattern of ratoon and plant sugarcane.
The growth status of a plant is associated with the energy absorbed by its leaves and later conversion to the other forms of energy by photosynthesis. For that reason, the acquaintance of the variations in the LAI is highly significant for the design of classification, growth and production assessment models [7]. However, the amount of water or moisture has a significant role in the development of leaves in a plant. Hence it is also essential to consider the irrigation scheduling during the development of the growth models. Moreover, the LAI has a strong relationship with spectral information obtained from the satellite images.
The information obtained from LAI in the temporal domain and other related parameters are important to understand the growth pattern in the temporal domain. The modelling accuracy in case of multi-temporal analysis is a function of the number and time period of the participating spectral images [8]. The different images over the entire growth season may be stacked to generate the temporal profile to study the behaviour of the crop in the study area. The accuracy of classification model may be significantly enhanced on the application of the multi-spectral and multi-temporal remotely sensed data [9]. The study [10] demonstrated that the behaviour of the long duration crop is commonly sigmoidal. It starts with a slow growth in the initial stage, reaches peak at the middle stage and starts decreasing after attaining the peak. The temporal profile based crop growth model based on Landsat data, has been shown in Fig. 1 [11, 12]. The function for the crop growth model was given by:
where
Crop growth curve [12].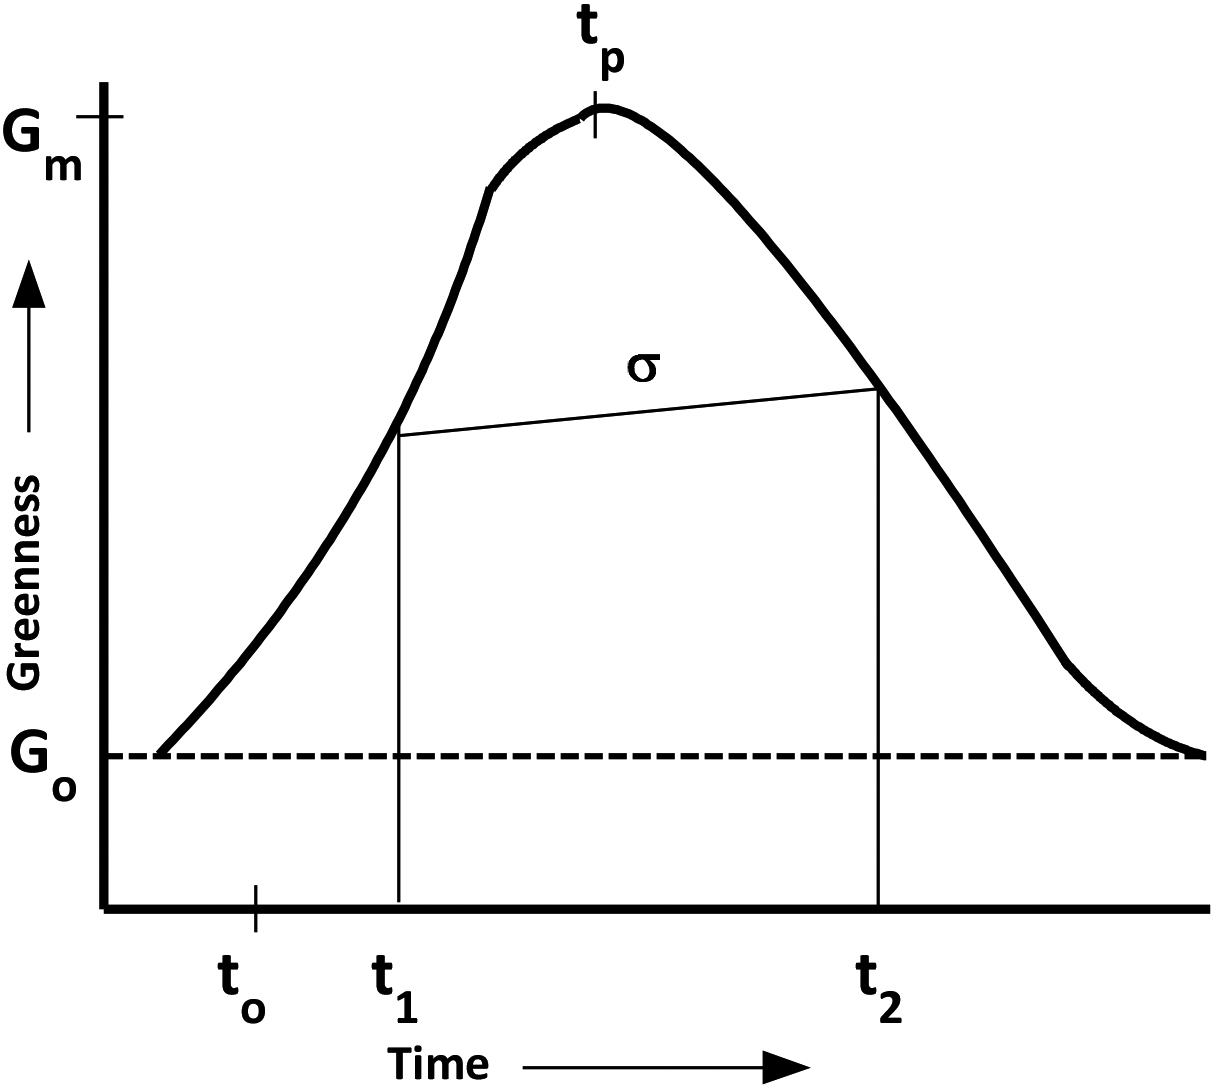
Recent technological enhancements in the field of information technology and statistical techniques allowed the sophisticated and reliable analysis. A number of machine learning data analytical tools may be exploited for the classification and regression problems. The purpose of this study is to design and develop binary classification model to discriminate the ratoon from the plantation sugarcane. However the selection of appropriate input to the machine learning model is a major concern. Besides, the design and development of discrimination model, the study also focused on the optimization of input data as well as model parameters.
The applications of of satellite sensors, machine learning methods, digital imagery and relevant geoinformatics tools to explore the agricultural information have been found to be more accurate, robust and economical [14].
Multi-temporal spectral data has been used to discriminate the ratoon from the plantation in the Muzzaffarnagar and Meerut districts of Uttar Pradesh, India [15]. Results of the study indicated that merely a single remote sensing image was not adequate for the discrimination. The study explored the imagery in the temporal domain to generate the rules for the classification. In addition to the temporal images, the study also incorporated the ancillary data to generate the expert knowledge-base to achieve the privileged accuracy of discrimination. Decision trees play an important role in multi-temporal discrimination of ratoon from the plantation [16].
Another experimental work was conducted in Sugarcane Breeding Institute (SBI), Coimbatore, India to demonstrate the relationship of ratoon and plant sugarcane. Tiller production has been recorded as maximum during the initial stage i.e., around 90–100 days after the previous harvest for both plant and ratoon crops. Still, it has been recorded a bit lower in the successive ratoons. Different parameters such as LAI, stalk height, cane diameter and leaf size at various stages exhibit different behaviour for ratoon and plant sugarcane. These differences are quite lower in the initial stages as compared to the later stages of the growth period. These variations can be used for the discrimination of the ratoon and plant sugarcane [3]. An experimental work [17] have carried out in Lucknow, India, to demonstrate the variations of different parameters related to the ratoon and plant sugarcane.
The discrimination of the specific crops may be fruitful in the prediction of crop yield, area under the cultivation, and monitoring of the crop growth [18, 19]. Temporal profile of Normalized Difference Vegetation Index (NDVI) has been used as an efficient and reliable indicator to discriminate the specific crop at the field scale or global scale [20]. The recent advancements in the information technology led to the various machine learning models. These models are flexible enough to integrate ground truth information with the classification and regression process [21]. Various methods such as Random Forest (RF), Decision Tree (DT), Classification and Regression Tree (CART) [22], Support Vector Machine (SVM) [23] and Artificial neural Network (ANN) and have been explored in recent studies related to the remote sensing of agriculture. Researchers in [24] presented a comprehensive review of the research related to the employability of machine learning models in agriculture. The review also suggested the integration of remote sensing datasets and ancillary data into the machine learning models, which may lead to the artificial intelligence and knowledge-based agriculture. However, various ensemble machine learning methods such as bagging and boosting have been developed in the recent past for the classification. A robust classification system based on the combination of classifiers may significantly increase the classification accuracy [25]. These methods further enhance the prediction and classification accuracy just by proper selection of the training data [26, 27]. The proposed work employed random forest bagging and gradient boosting for the multi-temporal discrimination of specific plantation.
Multi-temporal profile of the satellite data often generates a large number of features or predictors [28]. The high number of features may lead to the poor performance of the classifier or regressor due to the complex computations [29]. The performance of the machine learning model may be regulated by the selection of the most appropriate predictors as input variables. This selection may be termed as dimensionality reduction [30]. Dollar et al. [31] proposed a modeling framework for automatic extraction and mining of features to improve the overall accuracy. However, the proposed work also suggested to learn important features from the input data itself. A method based on RF has been used in the past for the optimized selection of features for the multi-temporal crop classification [32]. Shuai et al. [33] discussed the importance of the extraction of discriminative features from social network observations to precisely detect potential cases of Social Network Mental Disorders (SNMD). CART feature selection method may also be effectively used for the multi-temporal classification of remotely sensed data [34]. Hence, the present work is being premeditated to the optimized use of the recent expansion of satellite-based remote sensing and machine learning tools for the acquisition of consistent and near real-time crop information. The obtained information may be associated with growth status of the plants in spatial as well as temporal domain.
Modelling framework
The proposed research is focused on the discrimination of ratoon sugarcane from the plant sugarcane in the study area. Ensemble machine learning methods have been explored for the binary classification process. Prior to the discrimination, the optimised selection of important variables has been carried out to enhance the performance of the underlying model. For the study, the data and information from multiple sources have been fused to synthesize the analysis process. The design of a machine learning model starts with appropriate selection of input data. Adequate and representative data collection is the backbone of the overall model development [35]. Unnecessary data may lead to the redundancy, whereas, small amount of data leads to the loss of important information to guideline the model.
Data acquisition
Reference data
Ground truth data at regular intervals have been obtained to gather the information related to the crop calendar of the study area. The entire crop calendar for the sugarcane is covered in four stages. These stages are (i) GS1 – Germination, (ii) GS2 – Tillering, (iii) GS3 – Grand growth period and (iv) GS4 – Ripening stage. The duration of each stage has been shown in Fig. 2. To assess the possibilities of binary classification, the agricultural data has been collected from farmers and sugarcane industry. The boundary of each sugarcane field has been recorded by a hand-held GPS device. The information about ratoon and plantation sugarcane has been collected separately. Additional ancillary information about the biometric and biophysical parameters has been collected from the sugarane mills and farmers of the area.
Growth stages of the sugarcane.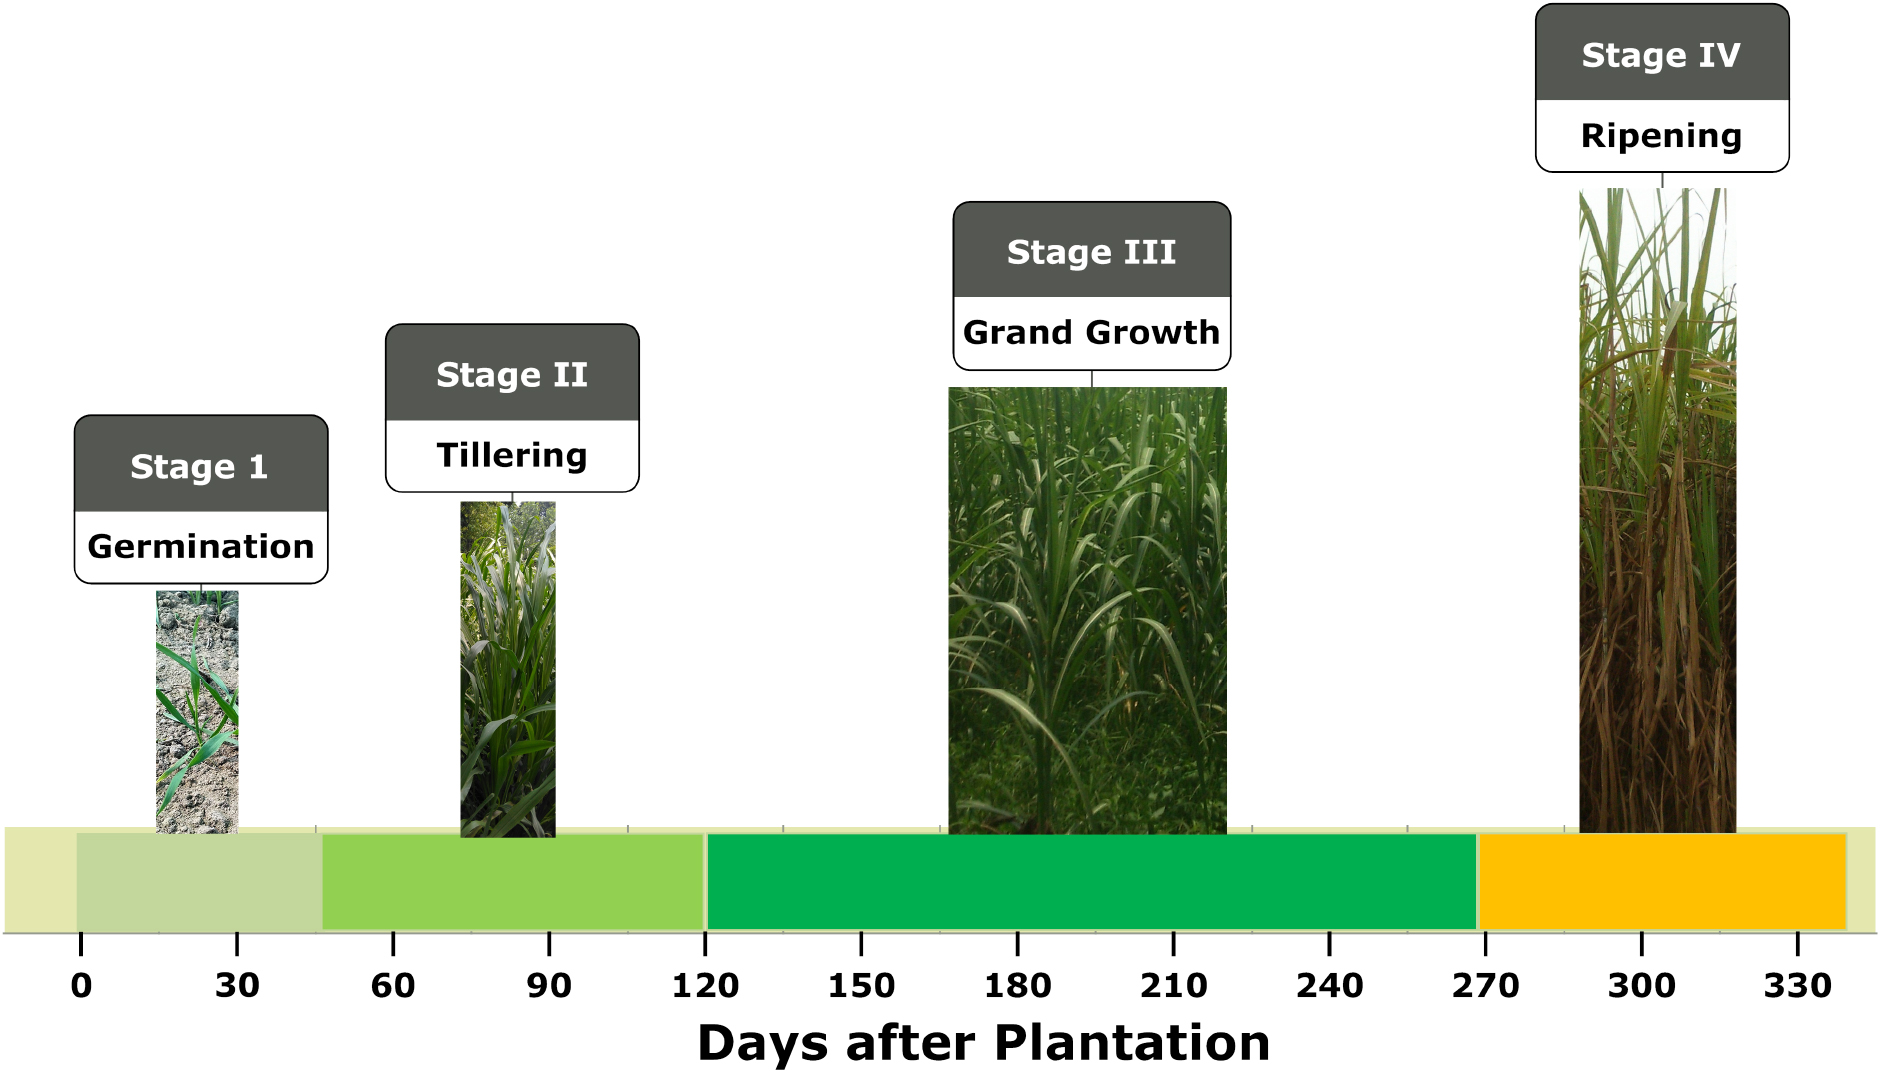
Biophysical and biometric parameters.
Separate measurements of sugarcane ratoon and plantation fields have been recorded to perform the analysis based on LAI, stalk height and stalk diameter. All the required parameters of the sugarcane have been collected during the regular visits to the experimental areas. The visits have been planned according to the crop calendar of the study area, as well as the availability of the satellite data. These parameters have been normalized to the index values from 0 to 1 for detailed analysis and have been shown in Fig. 3. It has been observed from the graph that there was a significant difference in the growth of ratoon and plant sugarcane. The differences were quite visible during the germination stage (GS1) and tillering stage (GS2). Subsequently, these variations may act as an important input to the binary classification model. However, the acquisition of these metrics are hindered by biasing, time lagging and inaccuracy.
Remote sensing data
Satellite imagery of Landsat 8 from the year 2015 to 2019 have been acquired for the proposed study. The band details of Landsat 8 OLI (Operational Land Imager) and Thermal Infrared Sensor (TIRS) have been presented in Table 1. The spatial resolution of these satellite images is 30 m, whereas the temporal resolution is 16 days.
The Digital Number (DN) obtained from the satellite images has been converted to the corresponding radiance. Further, these radiance values have been converted to the corresponding reflectance values. The details of the available satellite data for the year 2015 are given in Table 2 [36]. These satellite images after the preprocessing operations are further used to generate the vegetation indices images. Open-source software, QGIS has been used to obtain the temporal profile of different vegetation indices.
Landsat 8 bands
Landsat 8 bands
Details of landsat dataset used in the study
Vegetation indices may act as an important tool in qualitative and quantitative measures of growth parameters, classification and regression problems of remote sensing in agriculture [37, 38, 39, 40]. A significant number of indices such as NDVI, Soil Adjusted Vegetation Index (SAVI), Ratio Vegetation Index (RVI) have been proposed and investigated by the researchers in the past. Diverse studies related to the review and characteristics of these indices exist in the literature [41, 37]. NDVI images of different time periods have been shown in Fig. 4.
NDVI images.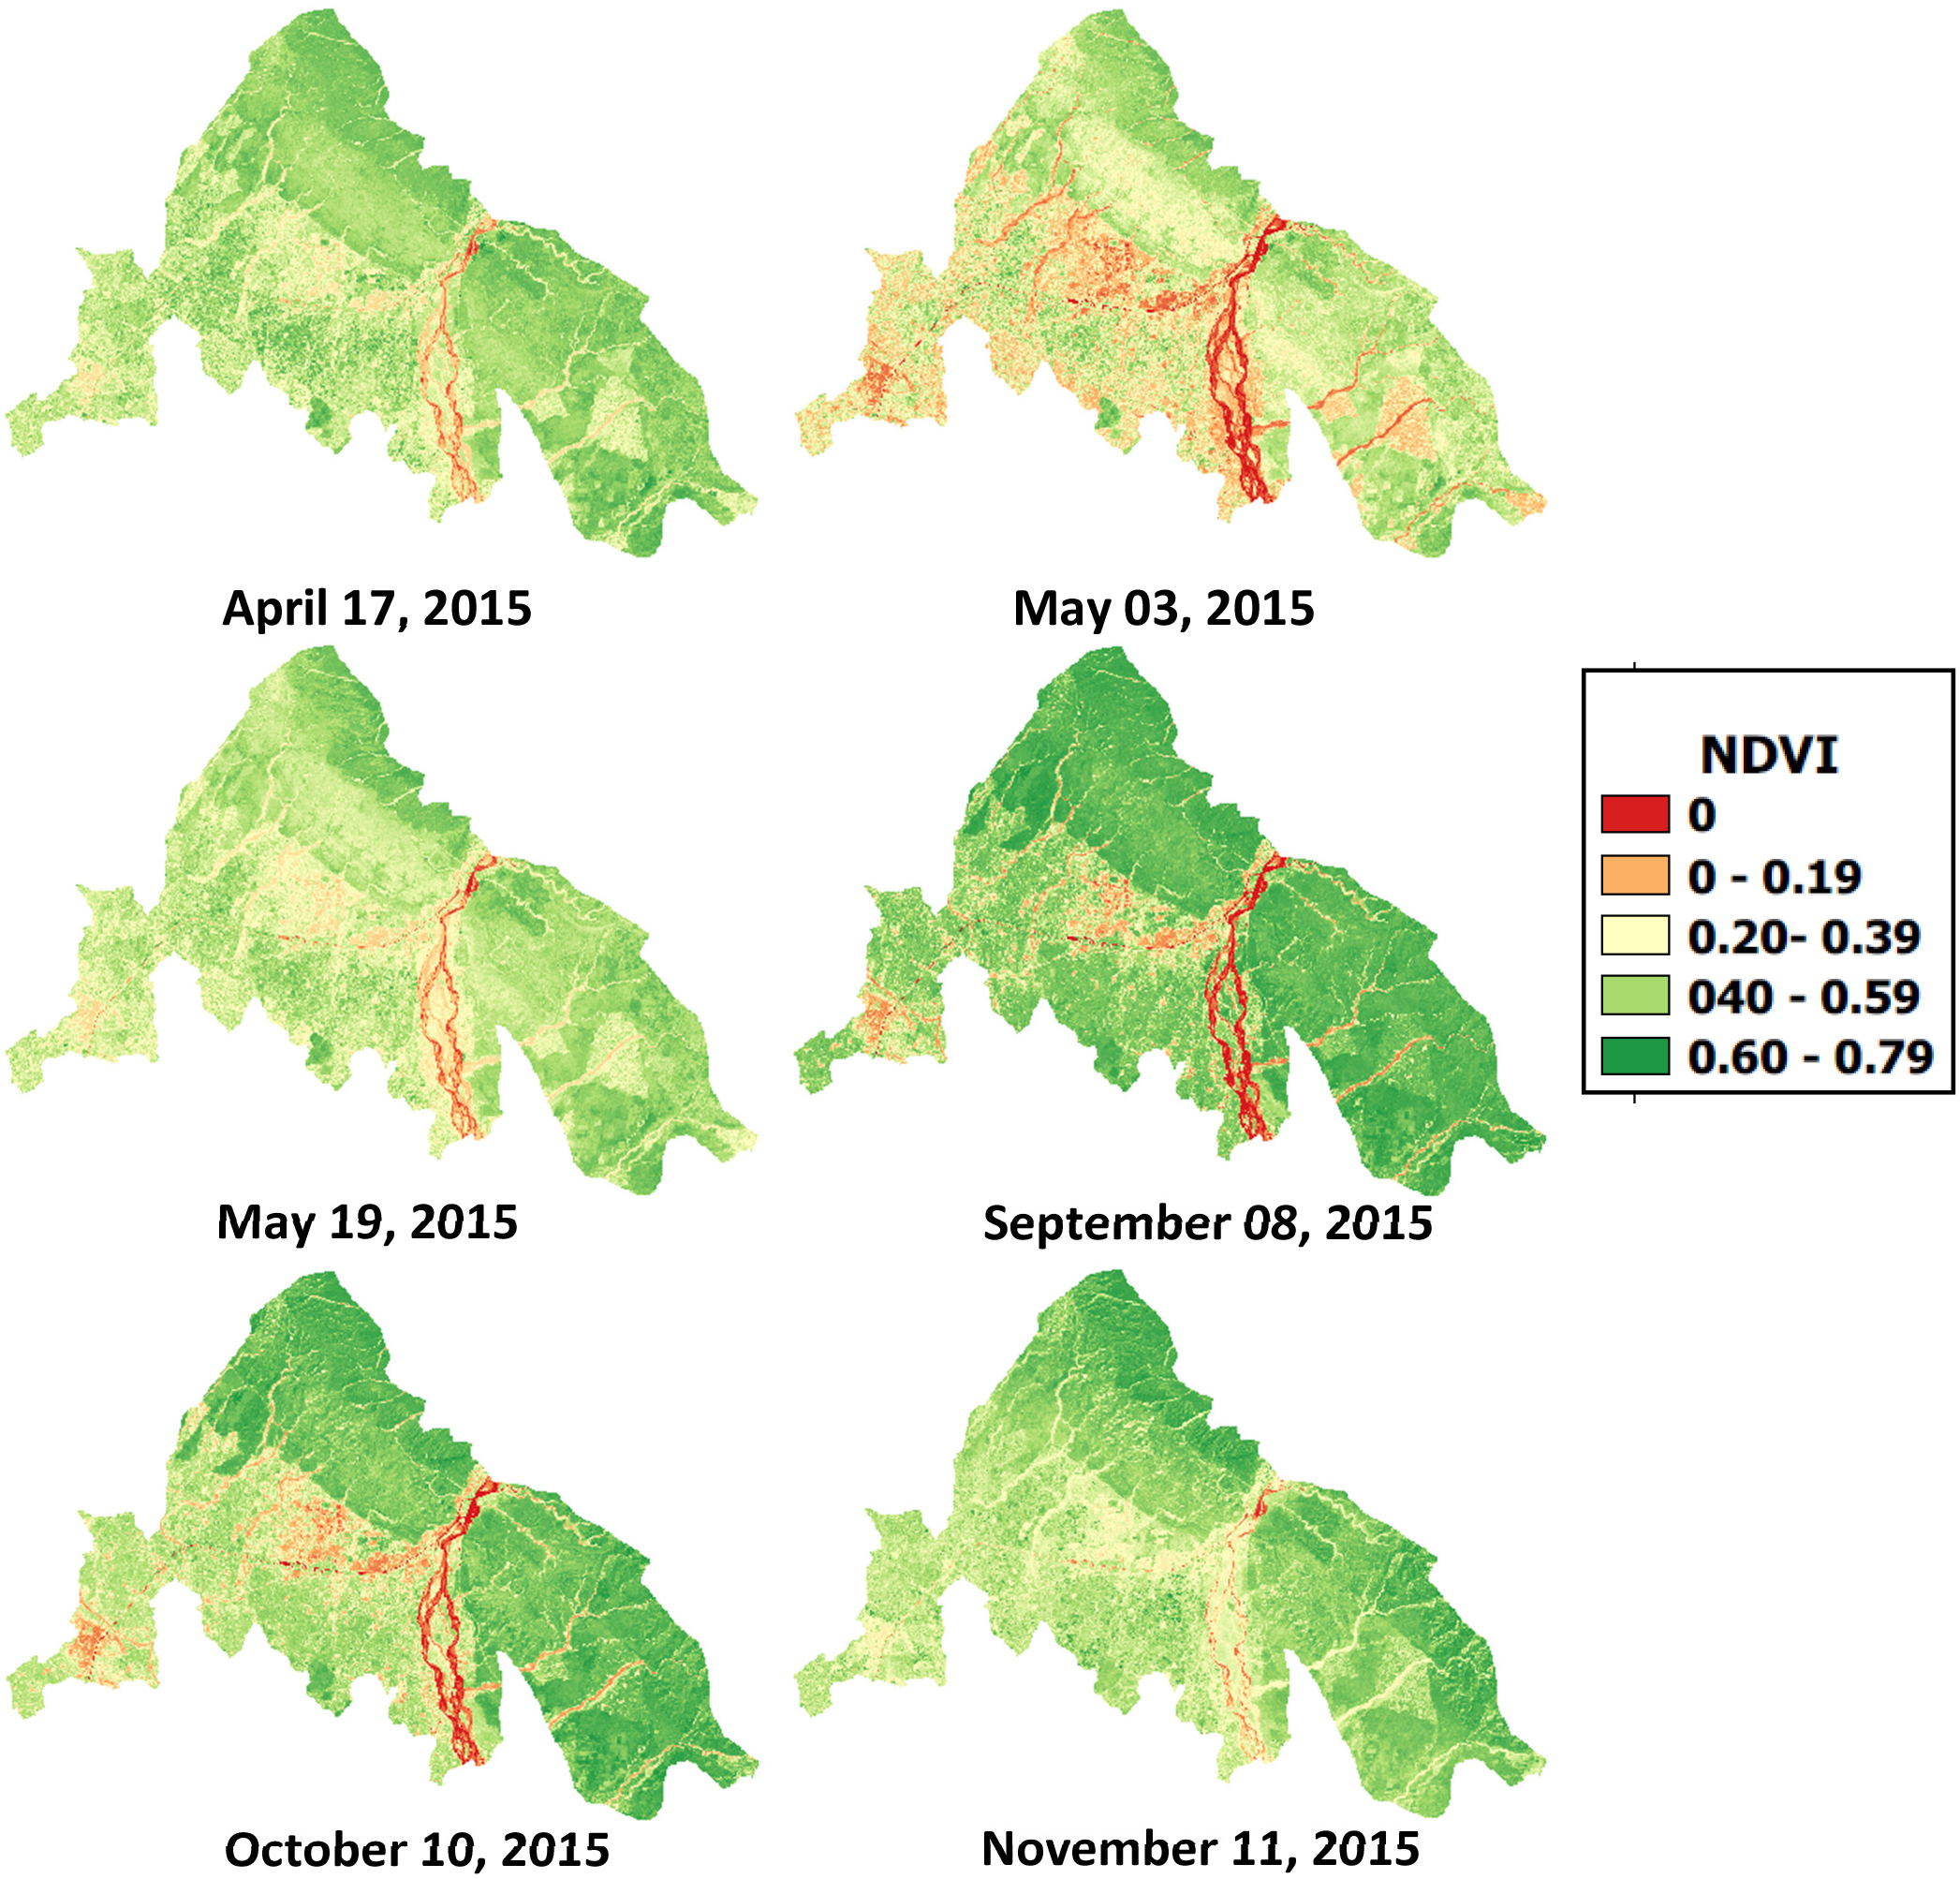
The multispectral vegetation indices and the specific spectral bands have been extracted from the selected polygons. The selection of these indices and the bands depend upon their ability to discriminate various classes. After the extraction of the indices, the random forest model has been used to identify the most appropriate variables for the further analysis based on these indices. The description and the mathematical expressions for the other indices have been given in Table 3.
Spectral vegetation indices
A review of available literature revealed that the multi-temporal information from remotely senssed data is the nucleus for classification and regression [56, 57, 58]. The research work [59] explored the noticeable NDVI distinction flanked by vegetated and non-vegetated areas in addition to the demonstration of the superior capability of Landsat-8 NDVI for agricultural applications such as crop growth monitoring. Nevertheless, satellite-derived NDVI temporal profile may be attenuated by a variety of factors. These factors are clouds, snow, geometric errors and other atmospheric effects. Most of the times, these errors and attenuations reduce the consistency, robustness and applicability of spectral data, especially for the agricultural applications [60, 61]. A study [62] investigated the Savitzky-Golay filter, Fourier transform and Wavelet transform for the reconstruction of the time-series satellite data.
The generated temporal NDVI profile of the few agricultural fields with normal crop growth trend and containing both types of sugarcane in the study area for the year 2015 is shown in Fig. 5. The visual analysis of Fig. 5, in conjunction with general crop growth information pertaining to the study area, confirms the belief that some kind of noise is present in the computed values. An attempt has been made in the present work to lower the effect of attenuations for the effective spatial as well as temporal analysis.
NDVI temporal profile of sugarcane fields (P1–P5).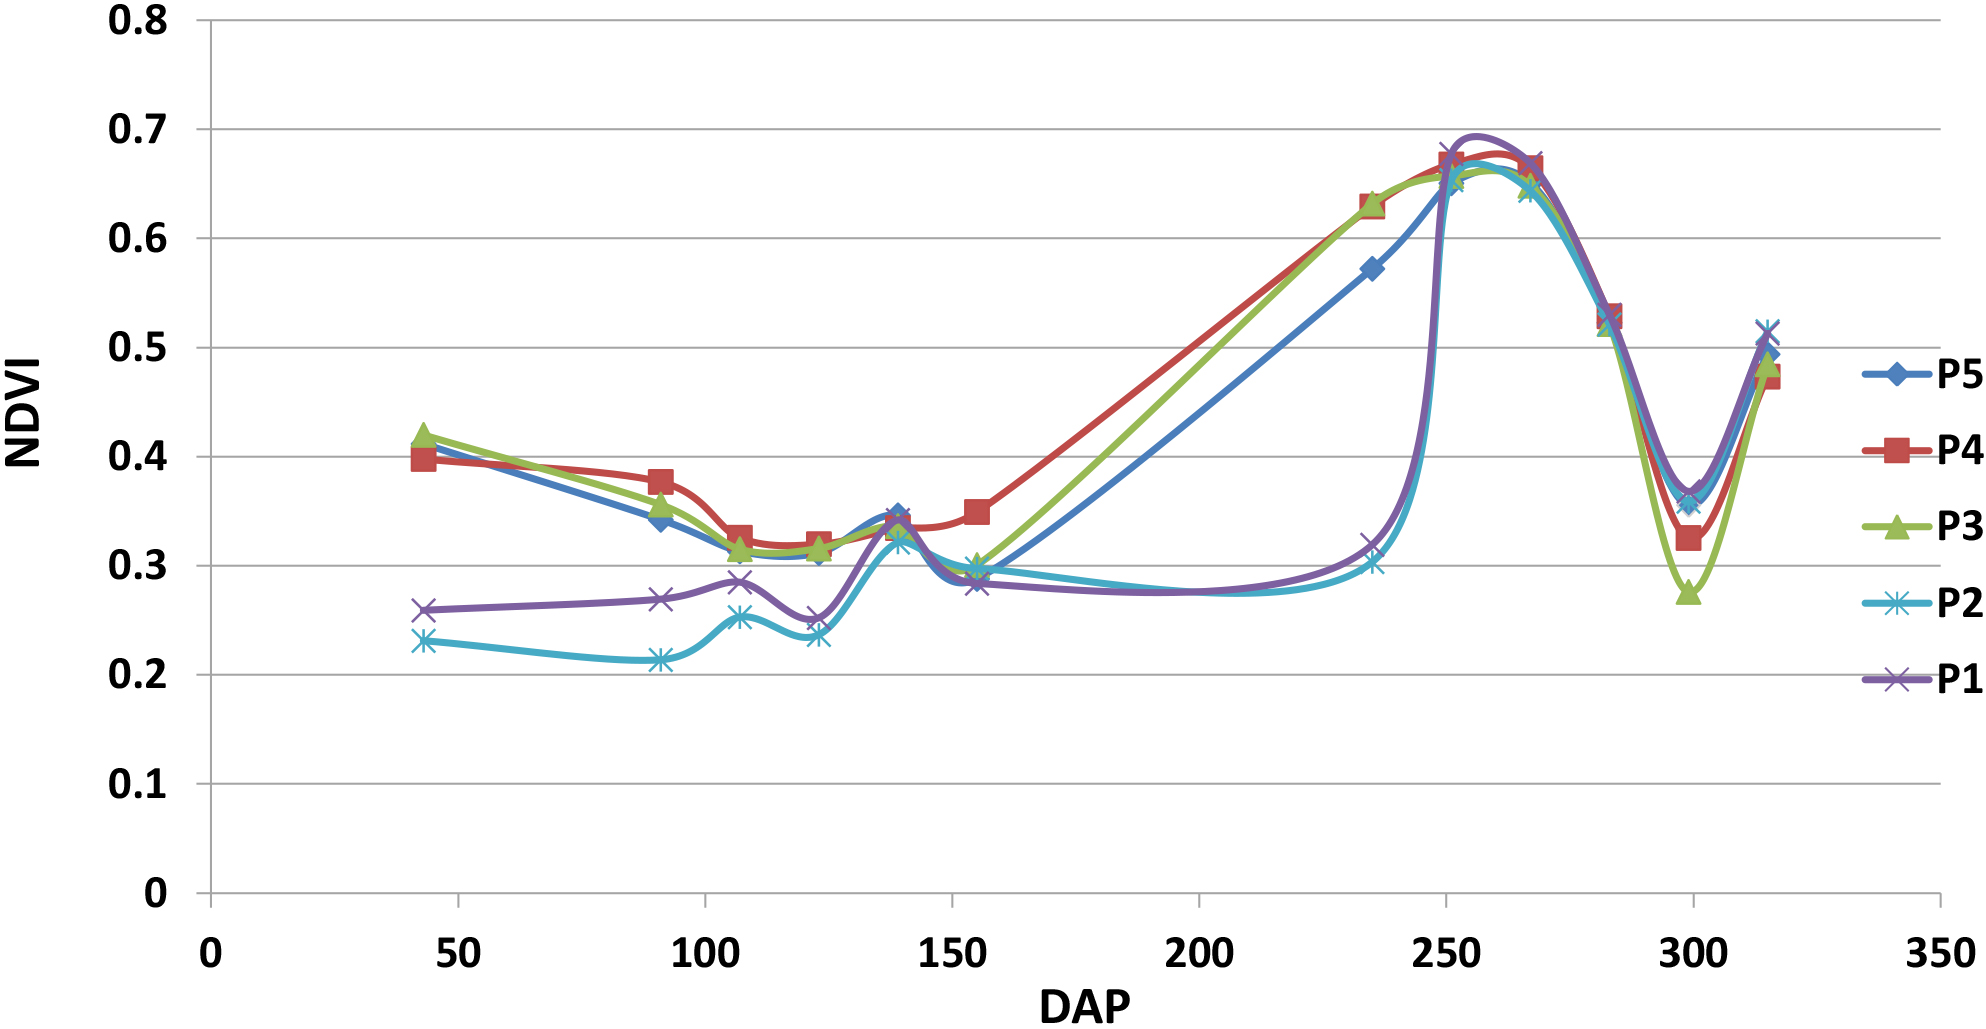
The accuracy of the binary classification may enhanced, though not necessarily, by combination of multiple spectral bands and indices together for agricultural applications [63]. The list of spectral bands (6), vegetation indices (15) and biophysical as well as biometric parameters (4) used as predictors (24) has been presented by Table 4. However, efficiency starts falling by increasing the number of predictors after a specific threshold.
Predictors used for the modelling in the study
Predictors used for the modelling in the study
The selection of such optimal parameters, which provide the storage economy as well as maximized accuracy, is called “feature selection" or dimensionality reduction [30]. Random Forest method based on machine learning has the potential to handle both classification as well as regression problems [22]. Research work [64] explored the application of random forest in multi-temporal classification. In addition to the classification, RF may be significantly useful for the optimized selection of the predictors. RF estimates the importance of a variable by determining the amount by which the prediction error increases when out-of-bag (OOB) data for that variable are permuted, whereas all other data items are left unchanged. The two critical parameters ntree and mtry are significant parameters that control the performance and the complexity of the models based on Random Forest. The parameter ntree may be used to derive bootstrap samples ntree times from the original dataset, and then each bootstrap sample is applied to derive a separate tree. For each derived tree, only the random selection of mtry predictor variables may be employed [65]. RF has also been used to rank the variables on the basis of the two measures known as Mean Decrease Gini (MDG) and Mean Decrease Accuracy (MDA). These measures act as filters to remove the unnecessary and unimportant variables. MDA measure assumes that the variable which is not affecting the predictive accuracy of the underlying model, may not be important to participate in the further classification or regression process [66]. MDG assigns the ranking to the variables on the basis of their efficiency to classify when that variable is selected at the node. R package “randomForest” has been used to implement the concept of MDA and MDG (source:http://cran.r-project.org/).
Recent advancements in the field of Information Technology and computing techniques such as high-performance computing, grid computing, cloud computing and the algorithms based on machine learning allowed the researchers and data scientists to build models to extract reliable and accurate information. These tools and techniques can be effectively used for the highly data-intensive operations such as agricultural and meteorological applications, bioinformatics and stock market analysis based on the daily prices of the market [24].
Various implementations of the machine learning algorithms allowed the researchers to explore multiple ensemble methods. Ensemble methods work in the collaboration of predictive models to liberate higher accuracies. Bagging or Bootstrap Aggregation and Boosting are the two most commonly used ensemble algorithms. Bagging reduces the variances by the application of random bootstrapped samples rather than merely a small collection of samples. Another model based on the concept of bagging is Random Forest. Random Forest works by the selection of an optimal number of variables to select the splits at each iteration during the classification or regression. This optimal number may be assigned as a parameter (mtry) to the random forest. By default, most of the implementations of RF have assigned the value of this parameter as
The ensemble algorithm Boosting works on the enhancement of the performance of classifiers in each iteration. Models are added iteratively to the week classifiers until the desired accuracy is not achieved. AdaBoost and Gradient Boosting Machine (GBM) are the most commonly used machine learning ensemble methods. Decision Tree (C5.0), CART, GBM and RF has been investigated in the proposed work.
Performance evaluation metrics
Performance evaluation of the binary classification methods may be effectively handled with Accuracy and Cohen’s Kappa Coefficient, Logarithmic Loss and Area under Receiver Operating Characteristic (ROC) Curve. Another useful parameters are Precision, Recall or Sensitivity, Specificity and F-Measure [67]. These metrics may be derived from a single matrix known as “Confusion Matrix” or “Contingency Matrix”. The concept diagram for the confusion matrix has been shown in Fig. 6. The four quadrants of the matrix are:
Quadrant 1: True Positive (TP) Quadrant 2: False Positive (FP) Quadrant 3: True Negative (TN) Quadrant 4: False Negative (FN)
The quadrant TP represents the predicted observations labelled as positive that are actually positive. FP represents the predictions that are labelled as positive but those are actually negative. TN is for those observations marked as negative that are actually negative. FN are those predictions that are marked as the negative but, the actual status of those observations is positive. All other parameters may be derived from these four matrix entries.
Confusion matrix.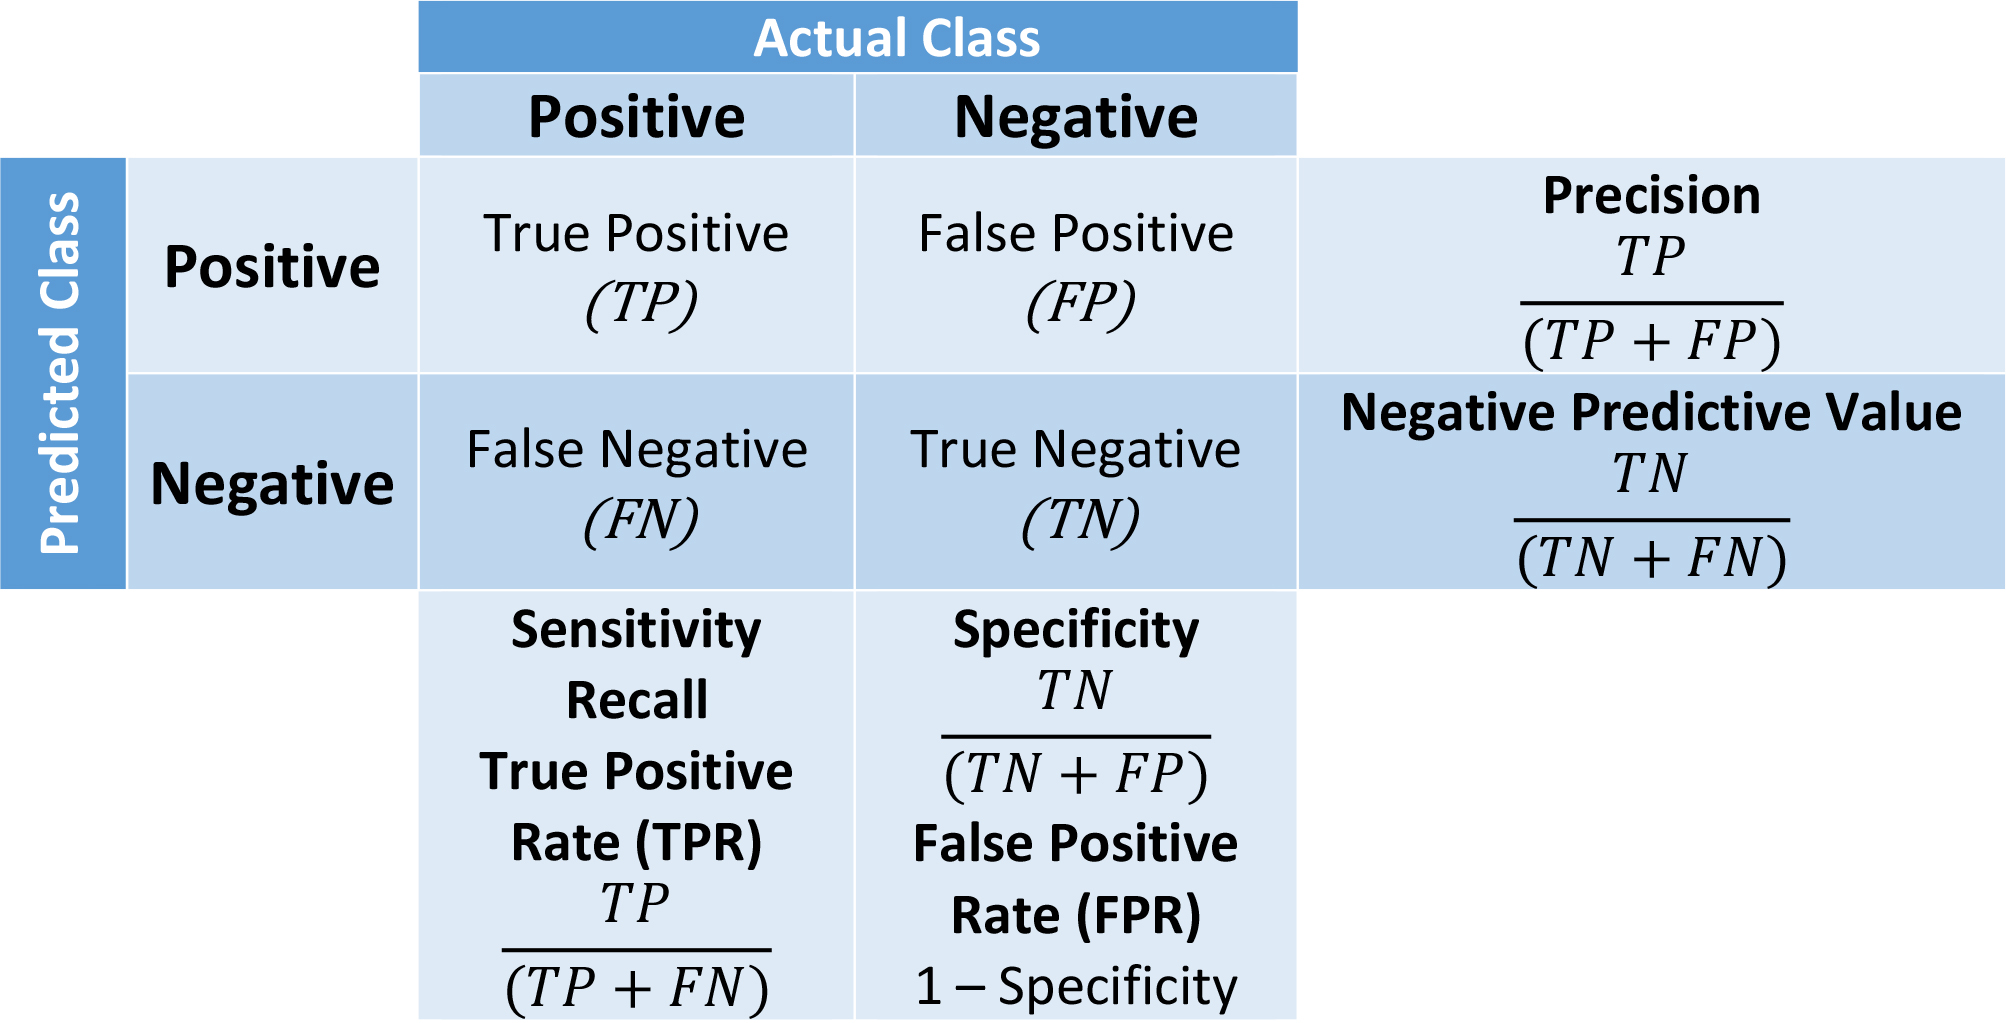
Number of correctly discriminated observations among the given records is known as “Accuracy”. Accuracy may be represented either in terms of percentage or scaled from 0 to 1. This metric explains the capability and reliability of the underlying model for the detection of negative and positive classes. It may be expressed as:
The F1 score, generated from precision and recall may be expressed as:
Cohen’s Kappa coefficient [68] or Kappa is also similar to the overall accuracy but it is normalized at the baseline of random chance on the dataset. Kappa is actually, a score that represents the level of agreement between two annotators on a binary classification problem. Mathematically, it is defined as:
where
Flow diagram of the methodology.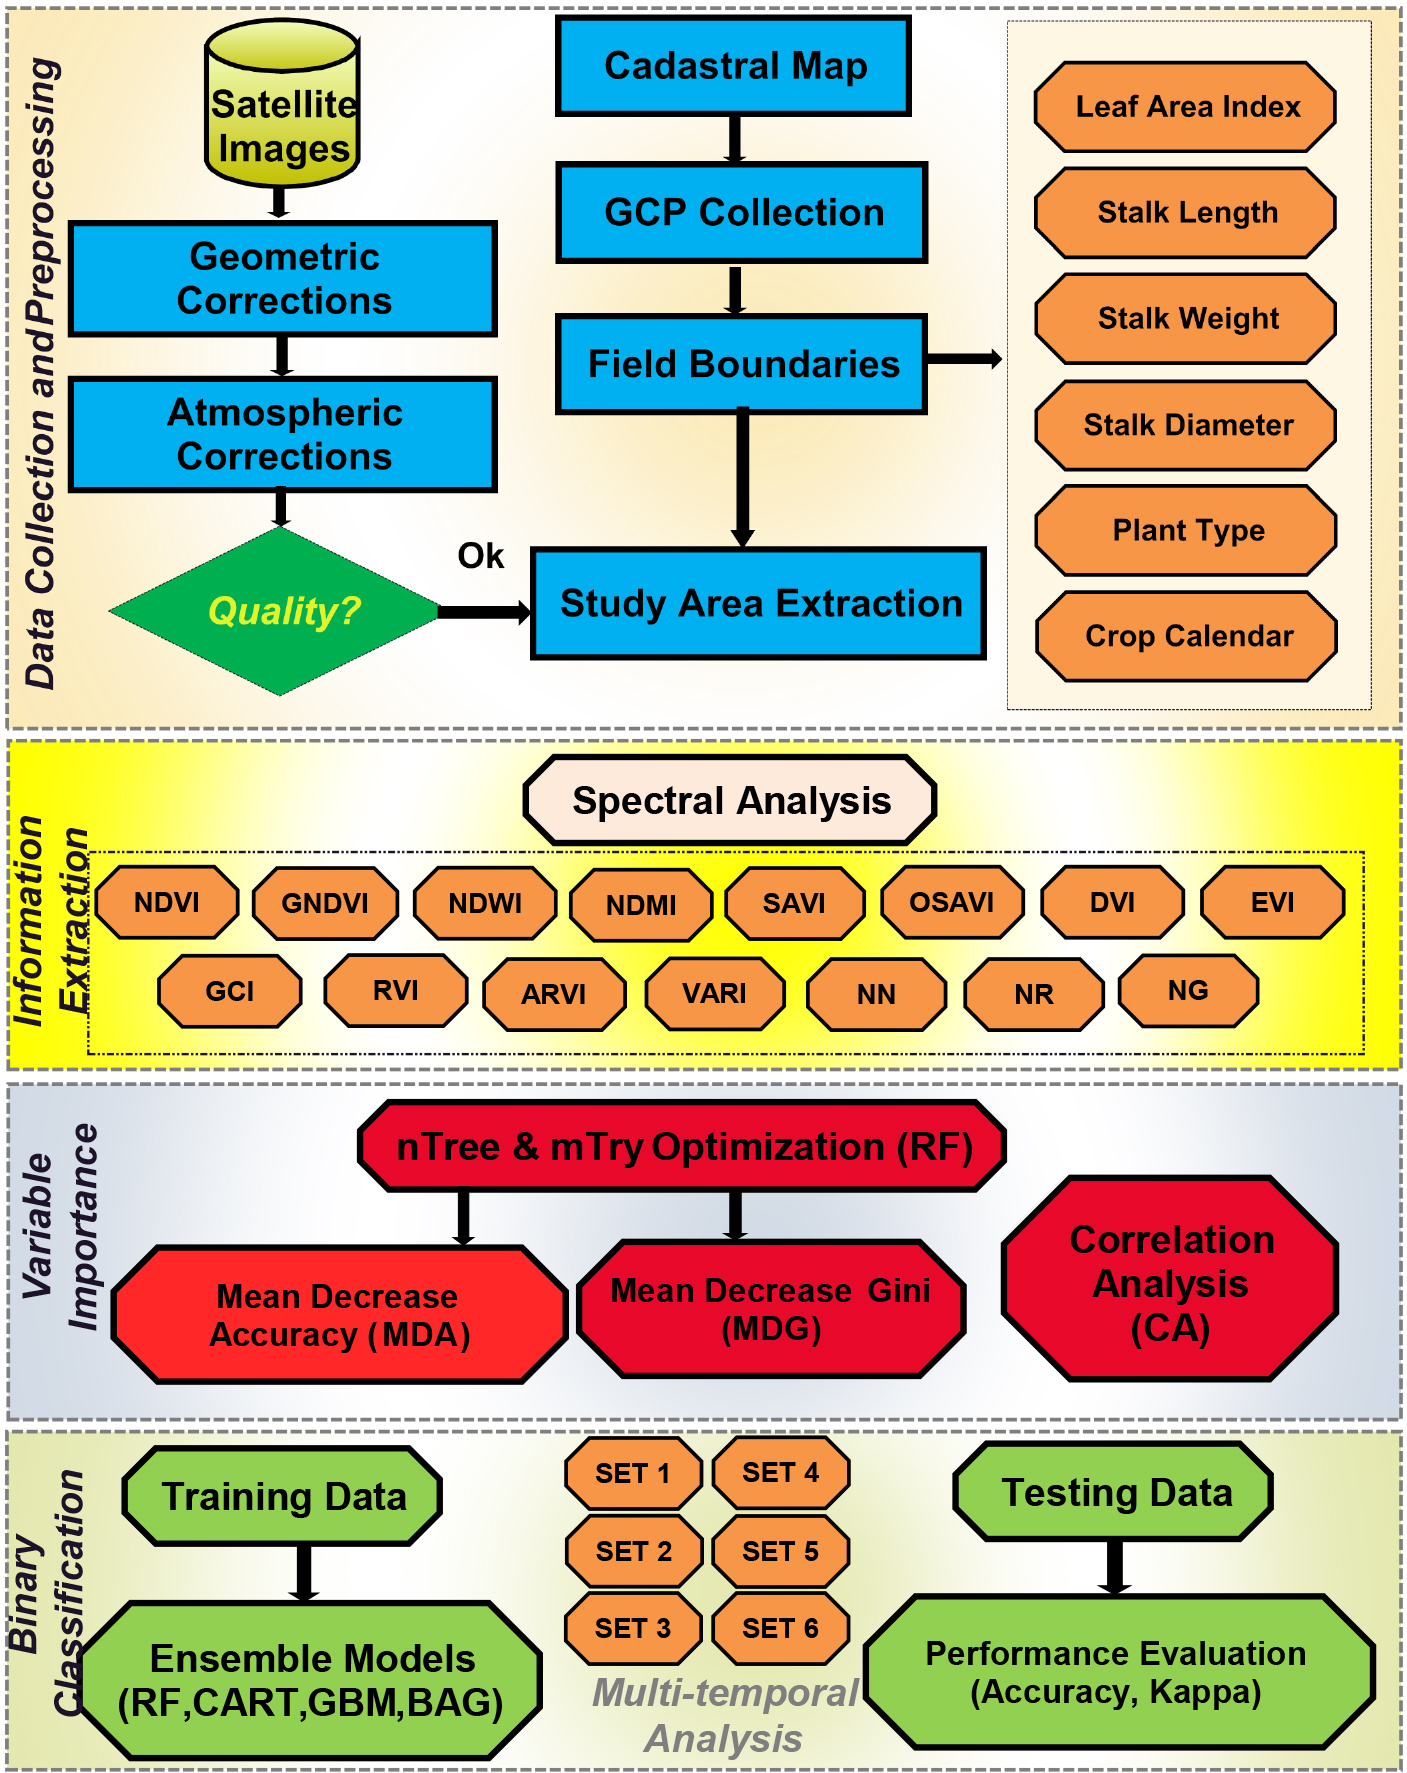
The methodology adopted in the present study is given in Fig. 7. The steps of the proposed methodology may be implemented as:
Initialization:
Acquisition of data: meteorological, Landsat images(n), ancillary data, and ground truth Pre-processing and spectral analysis: Algorithm 7
Selection of appropriate data: Algorithm 7
Temporal analysis: Algorithm 7
Comparative assessment:
Assessment based on the image set scenarios ( Analysis based on the obtained results Application of predictive model
Creation of LayerStack
Variable Importance
The proposed work is focused on the discrimination of ratoon sugarcane from the plant sugarcane. The proposed discrimination model has been considered as a binary classification problem. The model for binary classification has been designed, developed and tested with machine learning methods. Tree ensemble methods, boosting and bagging algorithms (RF, C5.0, GBM and CART (BAG)) have been explored in the proposed work. The development of the classification model encompasses following phases:
Preliminary analysis of spectral, biophysical and biometric parameters Dataset generation (split into training and testing data) Temporal analysis Performance evaluation
Prior to the discrimination, the optimised selection of the important variables has been carried out to enhance the performance of the underlying model. For the study, the data and information from multiple sources have been fused to synthesize the analysis process. The results obtained from the binary classification, as well as analysis based on the selection of predictors have been presented in this section.
The cloud-free Landsat 8 OLI data of the year 2015 have been investigated in the analysis. The details of the satellite data have been presented in Table 2. The proposed algorithm has been trained, tested and validated with geometrically and atmospherically corrected reflectance values. The most appropriate six cloud-free images (T1 to T6) have been selected for further analysis. The distribution of the images throughout the sugarcane growing season has been shown in Fig. 8. It has been observed that one image (T1) has represented the germination stage, two images (T2 and T3) headed for the tillering stage of the sugarcane growth season. The images (T4 and T5) represented the grand growth stage and the last image (T6) represented the maturity stage of the sugarcane.
Distribution of images.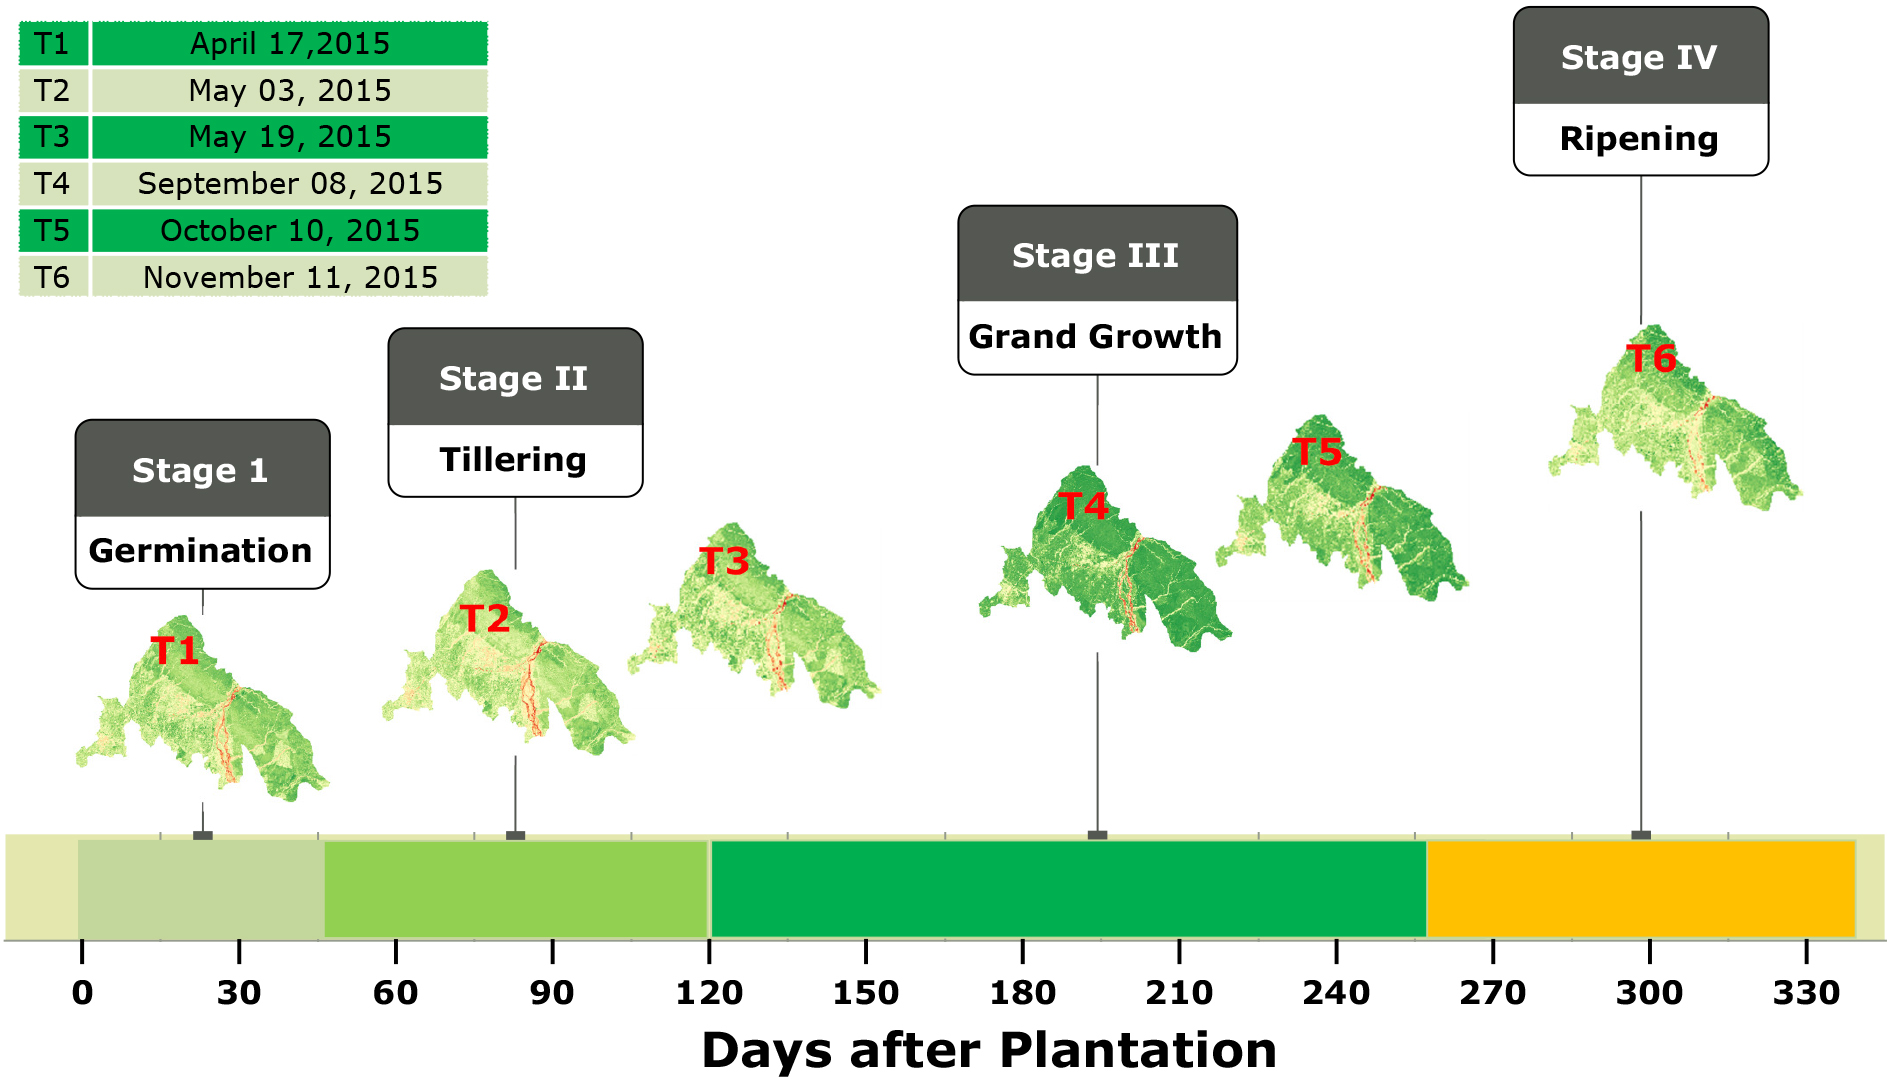
Response – spectral bands.
After the preprocessing steps, the six spectral bands (B2 to B7) and 14 spectral vegetation indices have been extracted for the spectro-temporal analysis. The spectral range and the spatial resolution of each band have been presented in Table 1. The spectral response of the bands for the extracted sugarcane plant and ratoon fields has been presented in Fig. 9. It has been observed that NIR (B5), Red (B4) and Green (B3) have more variations than other bands.
The correlations of the bands (B2 to B7) have been shown in Fig. 10. The visual, as well as statistical analysis of Figs 9 and 10, indicated that the spectral bands SWIR-II (B7), NIR (B5), Red (B4), and Green (B3) might be used to discriminate the ratoon and plant sugarcane. However, the SWIR-I (B6) and Blue (B2) bands have been also tested for the proposed model of binary classification. In addition to the bands, the temporal profile of the spectral bands and vegetation indices has been considered for the classification process.
Correlation – spectral bands.
The temporal profile of the spectral bands for the extracted sugarcane plant and ratoon fields has been presented in Fig. 11. The difference in the growth of ratoon and plant has been observed from the temporal profile of the bands. Most of these variations have been observed during the initial stages as compared to the later stages. Red band (B4) and Blue band (B3) have been most influential to demonstrate these variations in the initial stage. This may be attributed to the fact that during the germination phase, the greenness of the ratoon sugarcane is more than that of the plant sugarcane. The growth rate of both types of sugarcane is almost the same towards the end of the growth period. The similar behaviour has been observed from the temporal profile of the bands for ratoon and plant sugarcane. However, the researchers in the past suggested the use of the combination of spectral bands for agricultural applications [70].
Temporal profile (a) B2 (b) B3 (c) B4 (d) B5 (e) B6 (f) B7.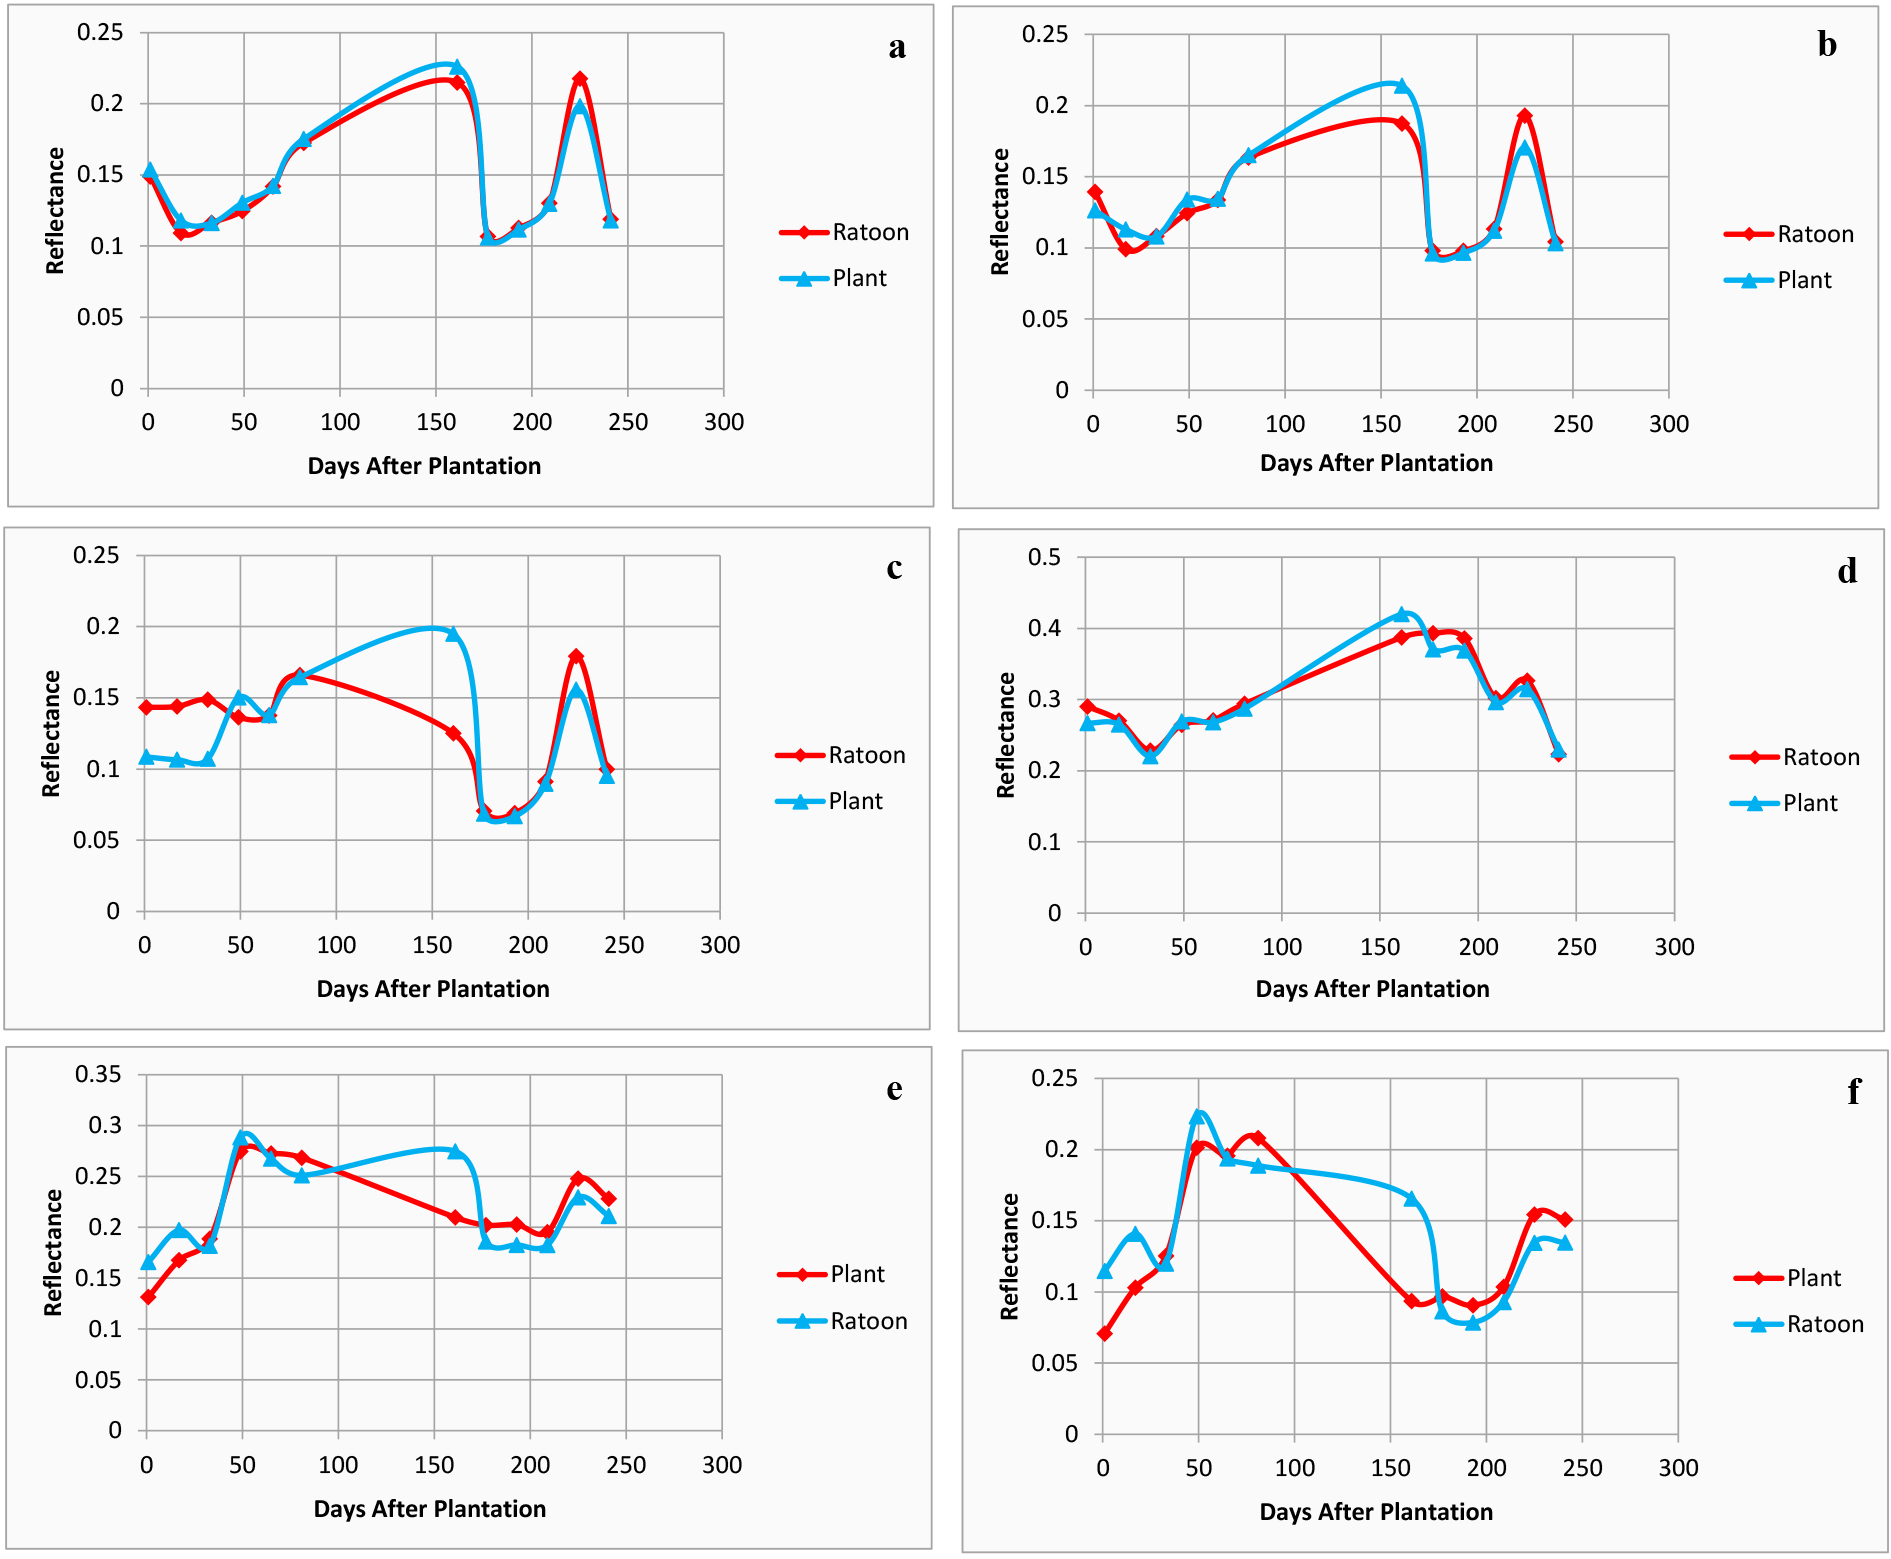
Vegetation indices enhanced the discrimination because these do not represent the absolute reflectance values of specific bands. Rather, these vegetation indices represent the variations in the slope of the reflectance curve of the participating bands [8]. These variations may be used for the classifications of crops and their types. Although a number of vegetation indices have been proposed in the past, yet the most commonly used are NDVI, SAVI, RVI and Optimized Soil Adjusted Vegetation Index (OSAVI).
For the preliminary analysis, the different vegetation indices have been extracted from the five different sugarcane fields. During the field traversal, the fields with normal crop growth pattern have been chosen to demonstrate the distinctive phases of the plant and ratoon sugarcane. The temporal profile of spectral indices has been generated from these five fields. The obtained temporal profile of NDVI, GNDVI and OSAVI have been presented in Fig. 12. Visual analysis of Fig. 12 indicated the presence of an attenuated profile, particularly in the initial stage of the crop growth. An attempt has been made in the proposed work to reconstruct the temporal profile of vegetation indices, so as to remove the attenuations.
Temporal profile of NDVI, GNDVI and SAVI.
In addition to the spectral variables such as bands and vegetation indices, the biometric and biophysical parameters may play a significant role in the discrimination process. The next section has been devoted to the analysis of biophysical parameters with reference to the proposed discrimination model.
The temporal profile of LAI for the plantation, as well as ratoon sugarcane, has been extracted for the various fields. The temporal domain plot for the LAI has been diagrammatically shown in Fig. 3. These profiles also represent that the sugarcane initially starts with slow growth during the germination stage, followed by an increase in the growth during the tillering stage and another phase of a slow pace and finally a phase of decrease in the growth till the harvesting stage. However, the profile also demonstrated that the temporal profile of plant LAI is slightly different from the ratoon LAI. The study also explored that the rate of growth of ratoon LAI is high during the grand growth stage as compared to other stages. The range of ratoon LAI remains lower than that of the plant LAI. These results are similar to the investigations explored in [3]. The diminution of the ratoon LAI is due to the low tillering as well as attributed to the soil conditions after the harvest of the plant sugarcane.
The biometric parameters, height and diameter of the stalk have been recorded for the fields of the study area. The temporal variations of these parameters have been shown in Fig. 3. These differences are more in the maturity stage (GS4) and germination stage (GS1). The comprehensive study of the graphs explained that ratoon sugarcane exhibit distinctive growth stages as compared to the plant sugarcane. This distinction may be captured by the binary classification models for the efficient mapping. The analysis based on the biophysical parameters points out that the use of biometric and biophysical variables play a vital role in the classification process. But, one major hindering towards the applicability of these variables is the collection of data at regular intervals. In addition to the complexity of the data collection, the biasing is another primary concern.
Dataset generation
Crop types and even crop varieties have distinctive growth patterns during the entire season. These distinctive patterns may assist the classification and regression models to achieve higher accuracy [71]. Multispectral remotely sensed data in the temporal domain may lead to the privileged classification accuracy as compared to the single date images [72]. Nevertheless, it is far vital to identify the optimal set of temporal images to discriminate the different targets in the study area. The optimal selection of the images depends upon the crop growth season and the particular study area for the agricultural applications of remote sensing [73]. Moreover, the increase in the number of temporal images may increase the computational complexity as well as data redundancy [74]. The accuracy of the discrimination process may be significantly enhanced by the optimized selection of the most appropriate input variables of the dataset [75].
The dataset for the machine learning models have been created from spectral bands, spectral indices and other crop growth parameters (Table 4). These parameters have been recorded in the temporal domain of the entire crop growing season. To design and evaluate the models, the available datasets need to be divided into training and testing datasets. Training data is used for the prediction whereas, the testing data is required to measure the prediction accuracy. The selection of training data and testing data affects the performance of the model, hence this selection should be tuned appropriately. Most of the Machine learning methods commonly used the k-fold cross-validation for the parameter tuning. This validation mechanism divides the input datasets into
The random forest model has been used in numerous classification and mapping experiments based on agriculture. The RF model is reliable and computationally efficient, even in the case of higher-dimensional inputs and a lower number of training data samples. RF model is based on the selection of the most appropriate parameters to guide the classification process. The classification accuracy and the computational time are the two main factors towards the evaluation of the classification models. The performance of the classification model may be significantly enhanced by the appropriate selection of the predictors and random forest parameters [28].
Random forest parameters (mtry and ntree)
The parameters mtry and ntree have been considered for the time-space trade-off regarding the performance of the classifiers. The parameter ntree represents the count of trees generated for the given dataset, whereas mtry represents the number of dataset variables selected for each tree split. The large value of the parameter ntree may generate reliable models but with more storage space and high computational time. RF parameter ntree may be assigned by way of iterative procedure to start with the least value and pick the final value when the error rate stabilizes at some threshold value of ntree. The default value for ntree in various software packages such as R is usually fixed at 500. On the other hand, the default value of the mtry is commonly fixed as
The reliable model for the classification always requires the higher values for the ntree and lower values for the mtry. However, both parameters, after reaching some threshold value, do not affect the performance, neither in the positive aspect nor in the negative. The Out of the Bag (OOB) error rate on different values of parameters ntree and mtry has been shown in Fig. 13. The effective value for the ntree has been recorded as 300, whereas the mtry has been set to 6 for the input dataset in the proposed classification process.
Selection of mtry and ntree.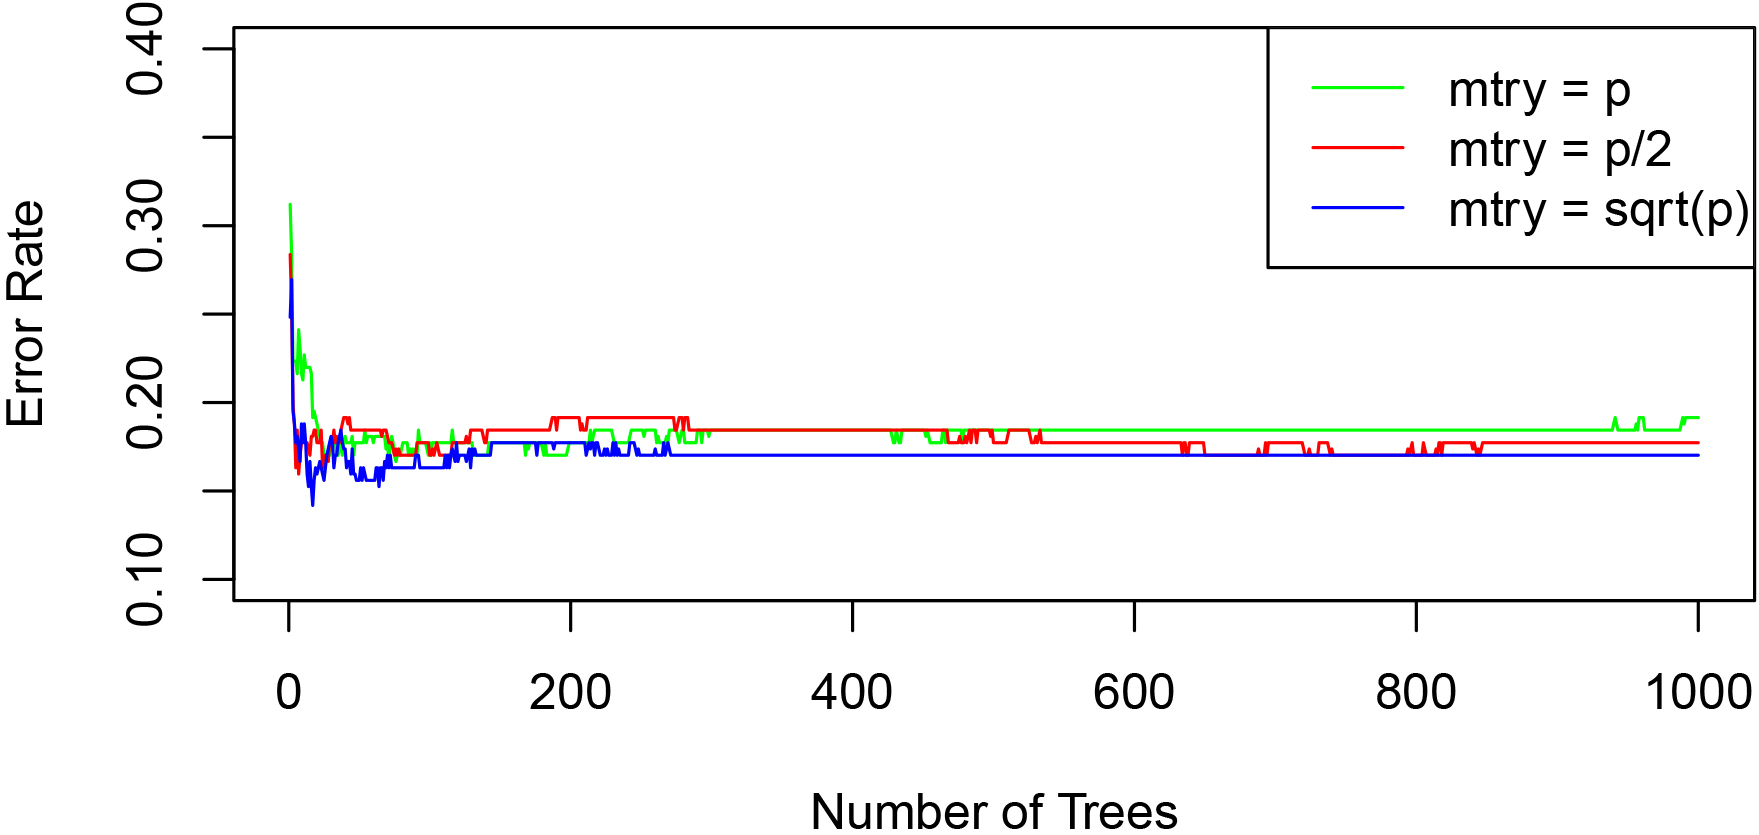
Random Forest Selection of Predictors – RFSP has been used prior to the classification process for the initial selection of relevant input data. This process may also be referred as “Dimensionality Reduction”. MDA and MDG scores on the basis of OOB error, have been utilized to select the important variables for the discrimination process. MDA assumes that if the input variable is not relevant, then the accuracy of the underlying model will neither increase nor decrease. Whereas, the MDG assigns the grades to the input variables of the dataset on the basis of their ability to differentiate the target classes. The rankings based on the MDA and MDG have been shown in Fig. 14.
Feature rankings (MDA).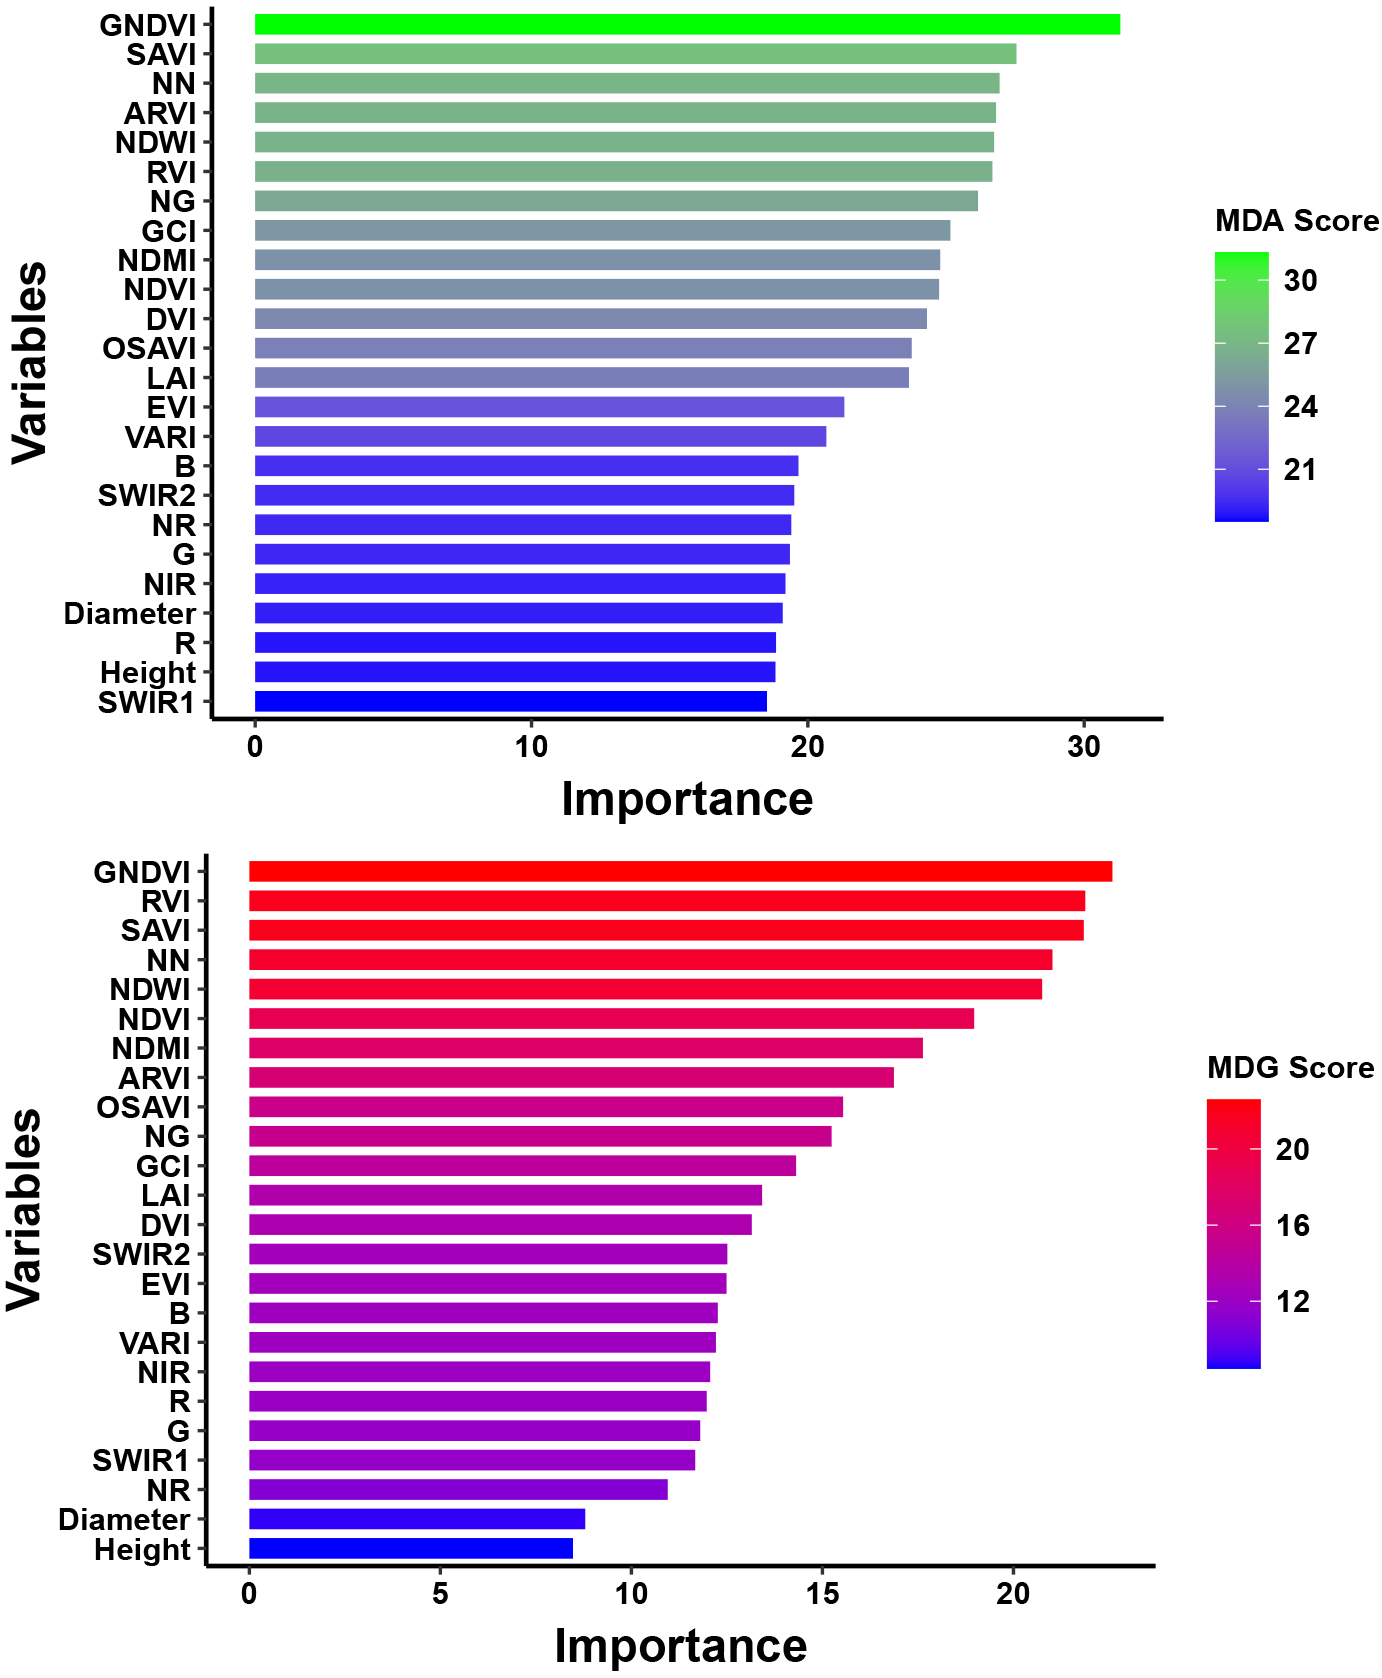
It has been observed from the rankings that spectral bands and spectral indices are on the top of the list of most important variables. The biophysical variables did not get any spot in the top rankings. The six bands B2 to B7 and nine spectral indices (GNDVI, NDVI, SAVI, RVI, NDWI, NDMMI, NN, ARVI, NG) have been selected for the temporal analysis. A digital layer of these sixteen predictor variables has been selected as the dataset for the discrimination model. On the basis of these rankings, the top 16 features have been selected for the proposed binary classifications. All these features have been employed as input to the underlying model as the plant growth is a function of the composition of these features. Few of these parameters are related to the greenness such as GNDVI, NDVI, SAVI and some are related to the moisture content of the plant such as NDWI, NDMI, NN. The mathematical formulation and significance of each parameter has been presented in Table 3.
Boosting and Bagging tree ensemble methods RF, C5.0, GBM and CART (BAG) have been comparatively investigated over the temporal domain of the dataset. The proposed work focused on the enhancement of the classification accuracy of the discrimination model by utilizing multiple images acquired throughout the cropping season of the same year. The classification accuracy and the Kappa values have been recorded for the various combinations of the images in the temporal domain. The proposed work was initialized with a single image in each iteration from the dataset of T1 to T6 images. Each set of images has been tested separately, and the analysed results have been presented in this section.
Single image analysis
One image from the dataset of six images (T1 to T6) has been selected at one time, as the input for the classification model. The mean accuracy and Kappa values for single date image analysis have been shown in Fig. 15 and presented in Table 5. It has been observed that the front-line image of the season T1 (April 17, 2015) is able to discriminate the sugarcane with a maximum accuracy of 91%, and the corresponding Kappa coefficient is 0.81. The least value for the accuracy is 0.71 for the image T2 (May 03, 2015).
Comparitive performance (single images).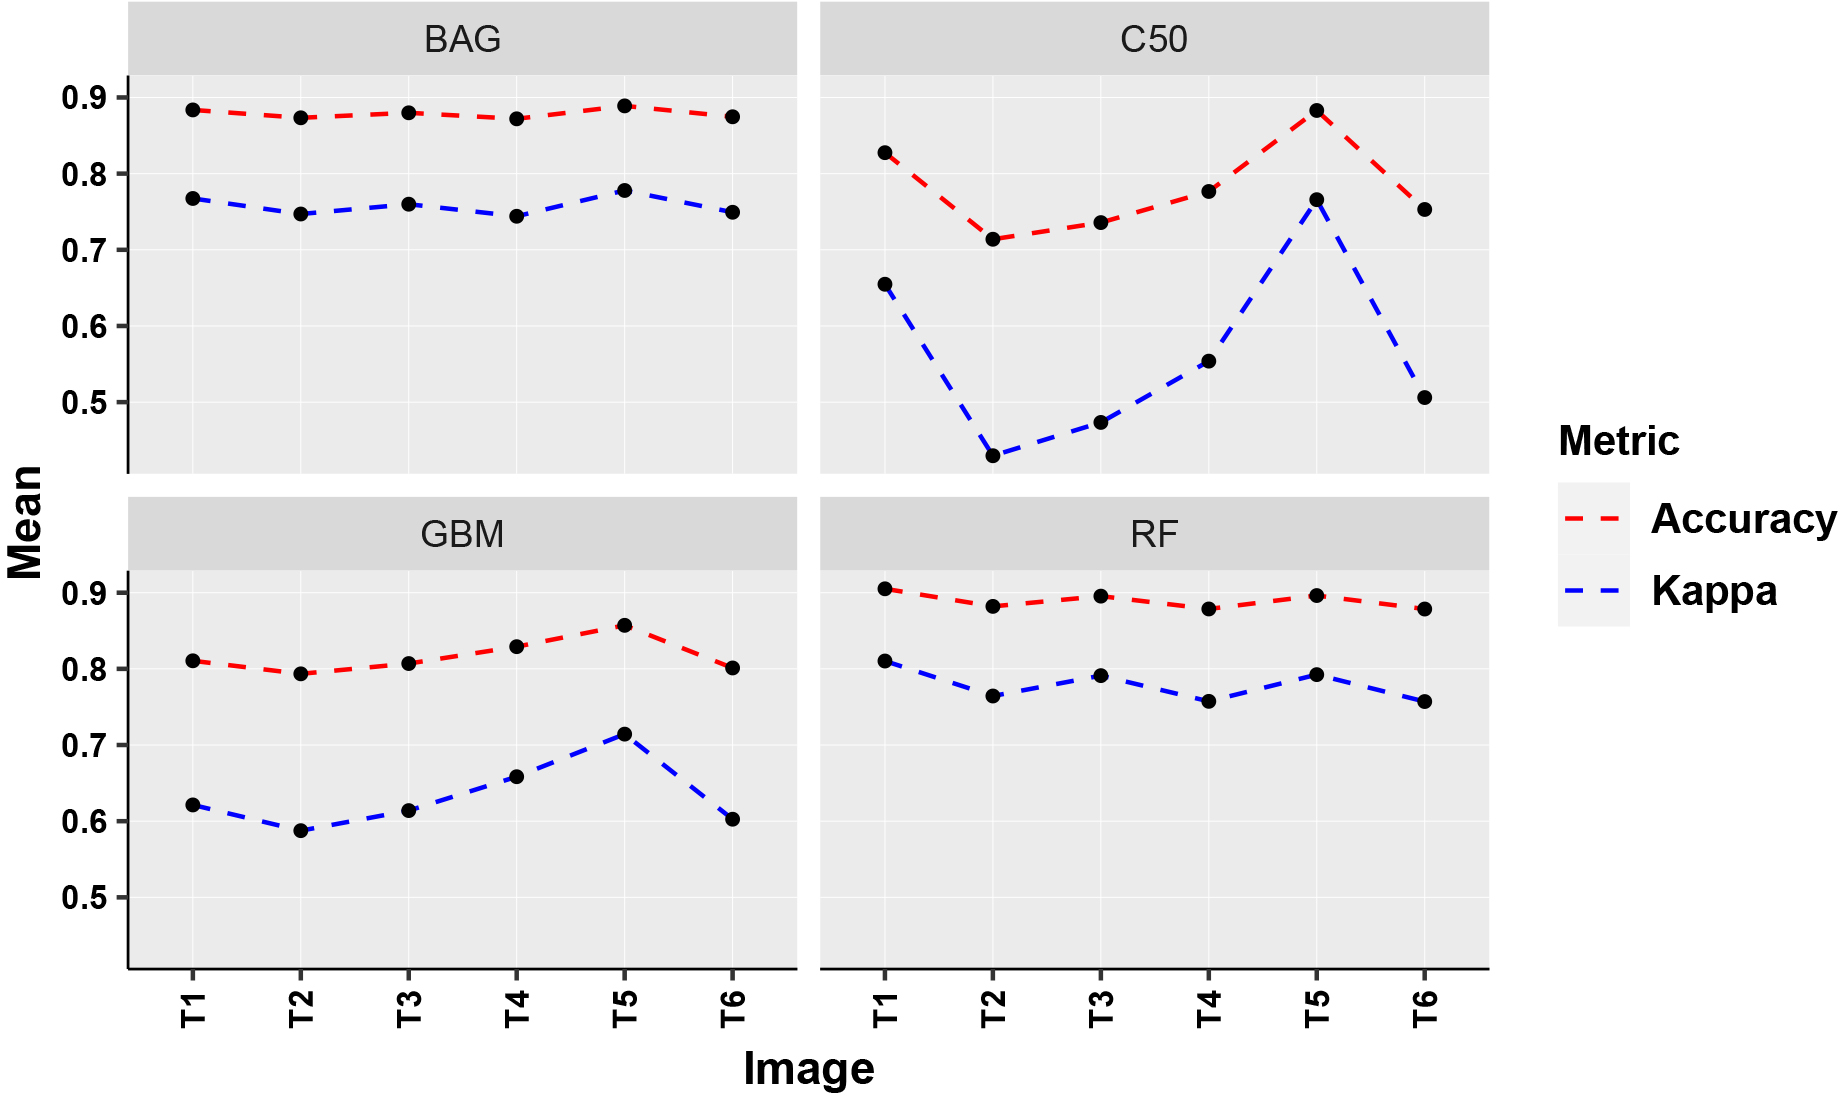
It has also been observed that the performance of the RF model is the best among all the cases. It has been inferred from the single date image analysis that the germination period is crucial to differentiate the ratoon and plant in case of single image analysis. However, during the later stages of the season also, the higher accuracy values have been recorded. The appropriate combination of the different images may enhance the overall accuracy of the discrimination.
Single image analysis
Comparative performance (two-set images).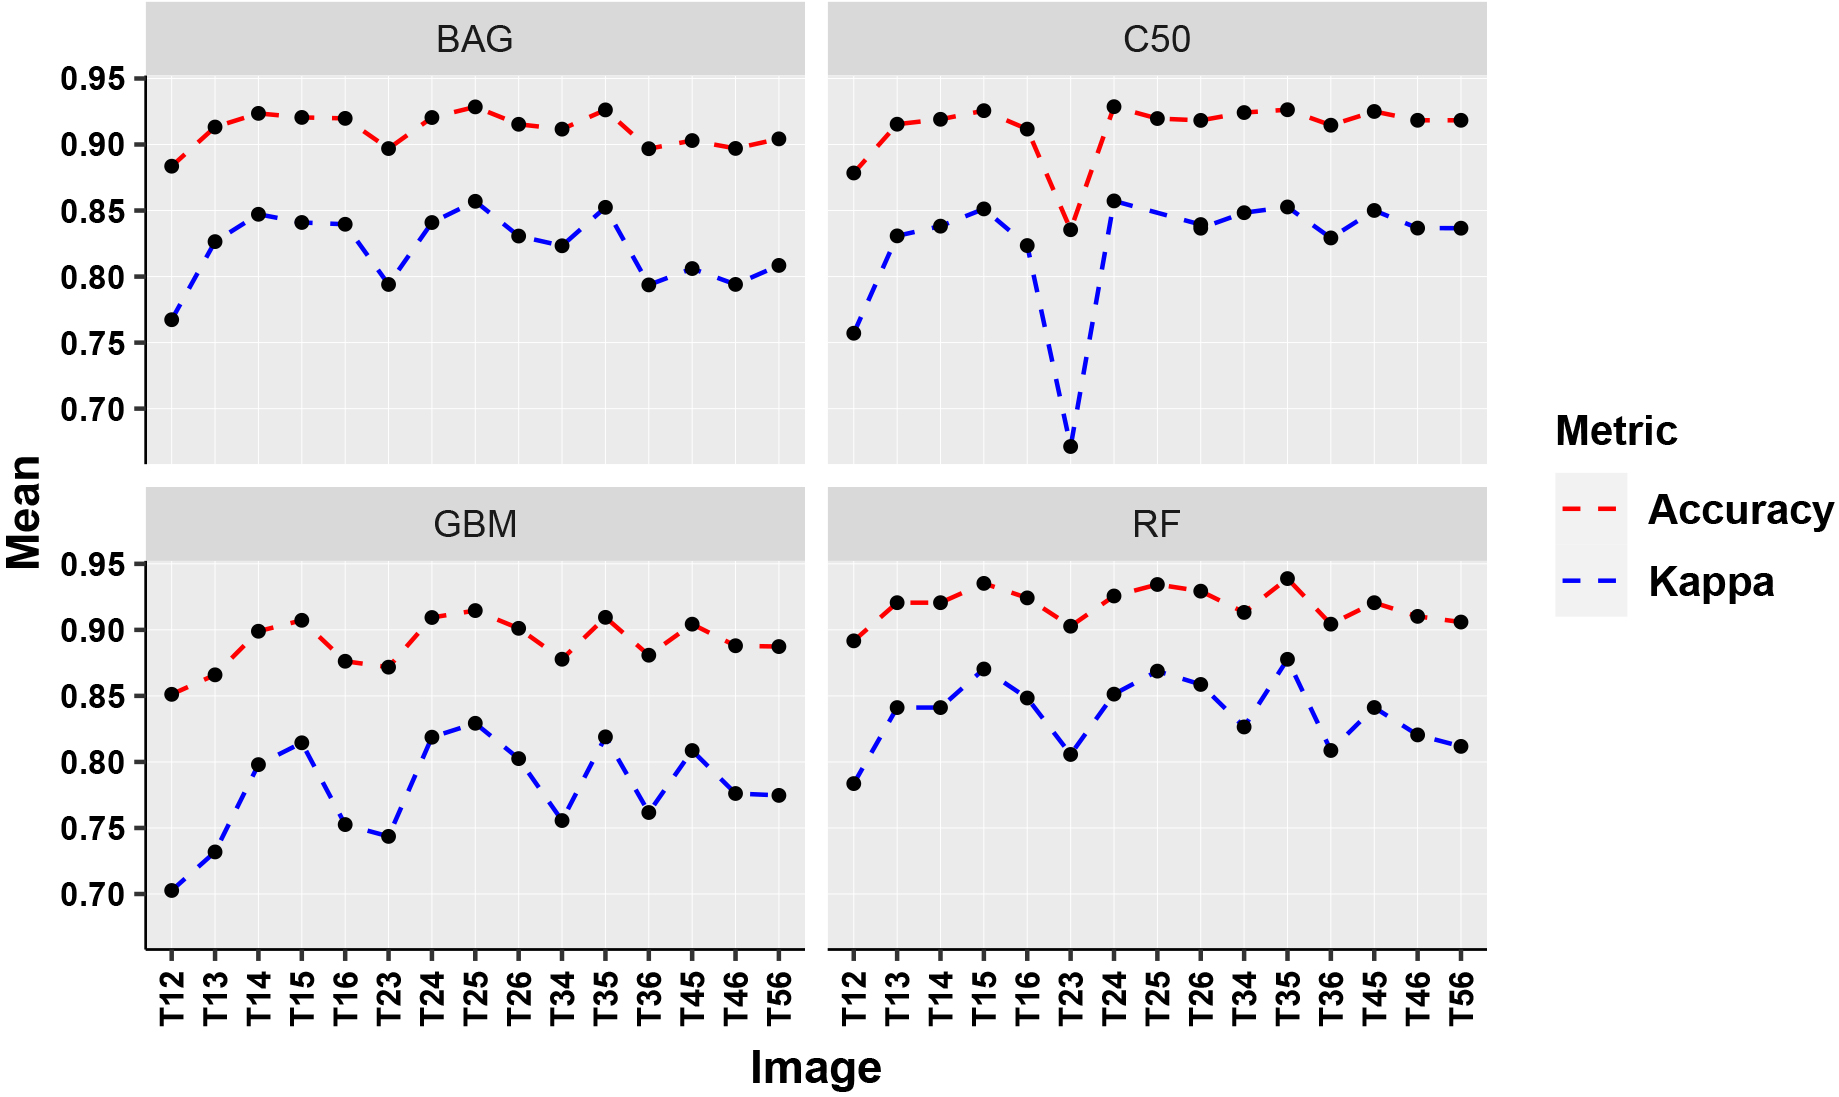
A set of possible pairs of two images from the growing season has been formed and evaluated in this section. The decreasing order of the accuracies and the Kappa values have been presented in Table 6. The mean accuracy and Kappa values for the two-set images have been shown in Fig. 16. It has been revealed that the image set (T35), i.e., combined images from May 19, 2015, and October 10, 2015 topped the table in both measures. Set T35 is able to discriminate the sugarcane with a maximum accuracy of 94% and Kappa coefficient as 0.88.
Image T3 belongs to the tillering stage, whereas T5 belongs to the grand growth stage of the plant growth season. Consequently, non-availability of the images from all the seasons of growth period due to the clouds or some other reasons may be compensated by these two crucial stages to discriminate the ratoon from the plantation. The minimum value for the accuracy has been recorded for set T23, i.e., the combined images from May 03, and May 19, 2015. Hence, the combined images from the same stage did not classify the ratoon and plant efficiently. Once again, the RF model exhibited the best performance in terms of both measures. It has been revealed that tillering and the grand growth stages together performed significantly for the discrimination process.
Two-set image analysis
Two-set image analysis
Three-set image analysis
The machine learning models have been tested for the set of three images in each iteration. The comprehensive study of Table 7 and Fig. 17 revealed that the combined image set (T256) from the tillering, grand growth and maturity stage has been able to discriminate the ratoon and sugarcane with an accuracy of 95%. On the other hand, the image set T123, which contains only initial stages and the image set T456, which contains the later stages are recorded as the lowest value of 0.90. These results confirmed that the images only from the initial stages and only from the maturity stages are not significant for the discrimination. The majority of the higher accuracy values belonged to the bagging ensemble models RF and CART (BAG). The observations from three-set image analysis gave an interesting indication that approximately one image from each of the stages is crucial to discriminate the ratoon form the sugarcane.
Comparative performance (three-set images).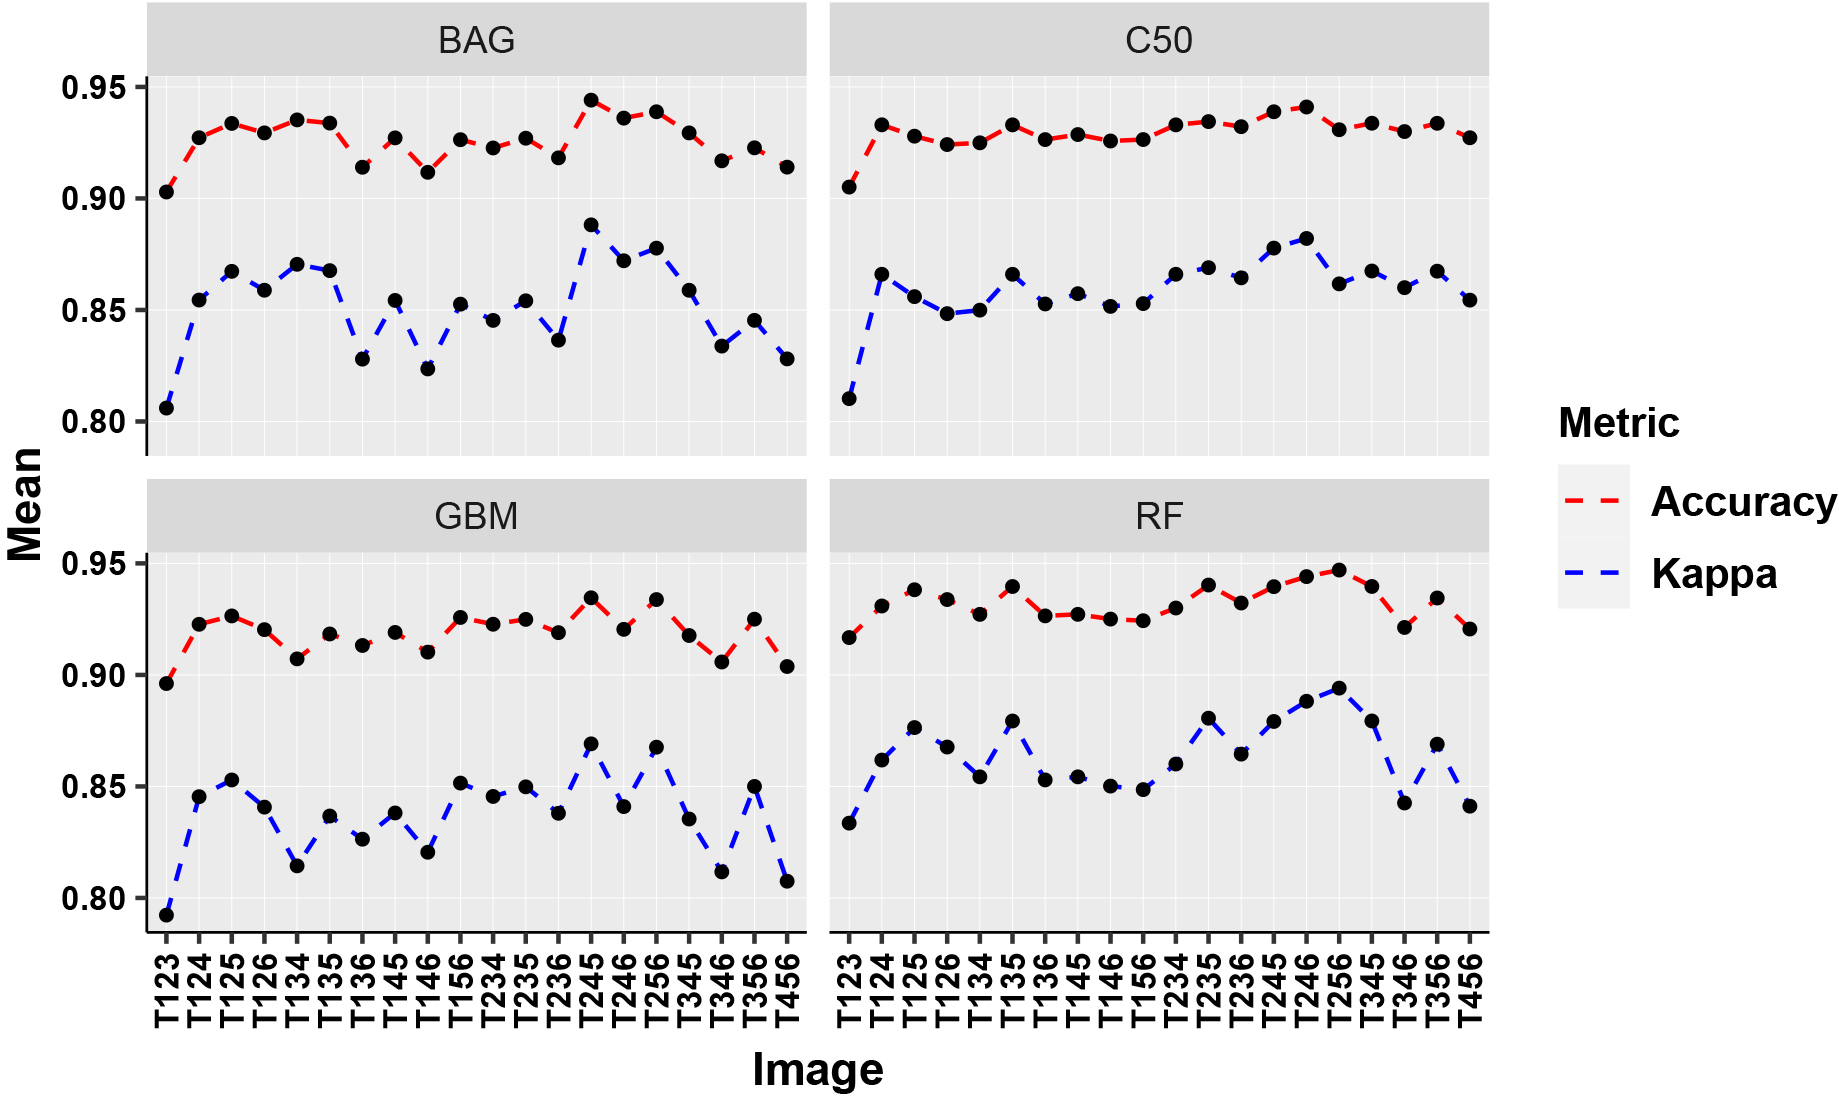
The results obtained for the four-set images have been presented in Table 8. The accuracy of 97% has been attained for the image set T2456 under the RF model. The Kappa value has also shown significance with the value 0.93 for the random forest model. The performance of the C50 model is lowest in this set of images. The graph for the comparison of the accuracy and Kappa values has been plotted in Fig. 18. It has been observed that approximately one image from each season has been able to discriminate the type of sugarcane effectively. However, the other image sets (five-set and six-set) are also investigated in the proposed work. The next sections are devoted to the analysis of these image sets.
Comparative performance (four-set images).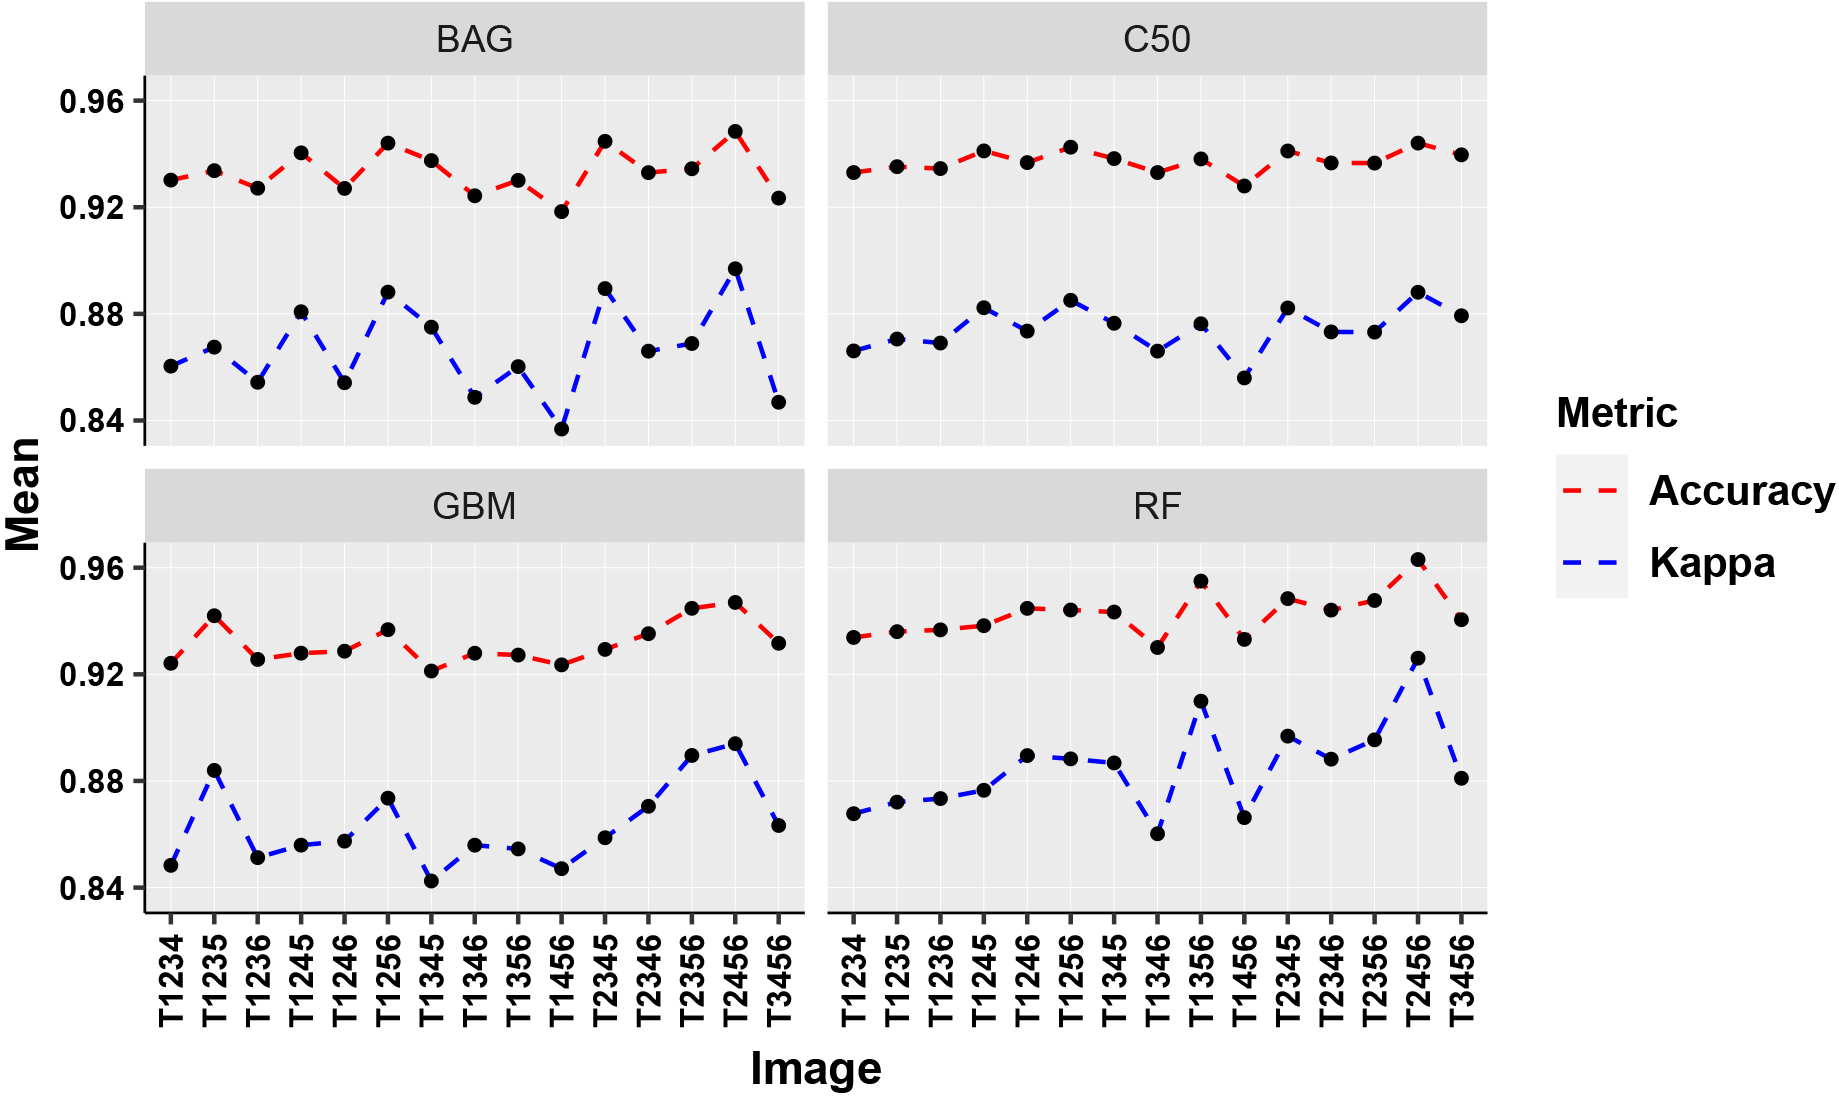
Four-set image analysis
The five images from the entire growth season have been clubbed together to investigate the effect of these images on the discrimination. Six separate image sets have been generated and tested for all the four models. Image set T12456 has topped the table (Table 9) with an accuracy value of 0.95, with a 2% decrease from the set T2456. The observations indicated that, in spite of the most accurate single image T1, the addition of this image to T2456 did not produce effective results for the classification (Fig. 19). The stages between germination and tillering are more effective than the consideration of germination only. The investigations explored that the stages between tillering and germination, as well as stages between maturity and grand growth are more significant for the classification.
Five-set image analysis
Five-set image analysis
The accuracy and Kappa value obtained for the six-set images were 0.94 and 0.90 respectively 20. The accuracy is 3% lower than that of T2456. The results revealed that a combination of all the images from the growth season is merely redundant and will increase the computational complexity and storage space. Addition of T1 and T3 images to T2456 did not increase the performance of the underlying model neither in terms of accuracy nor in Kappa value. RF model exhibits superior performance in six-set images.
Six-set image analysis
Six-set image analysis
Comparative performance (five-set images).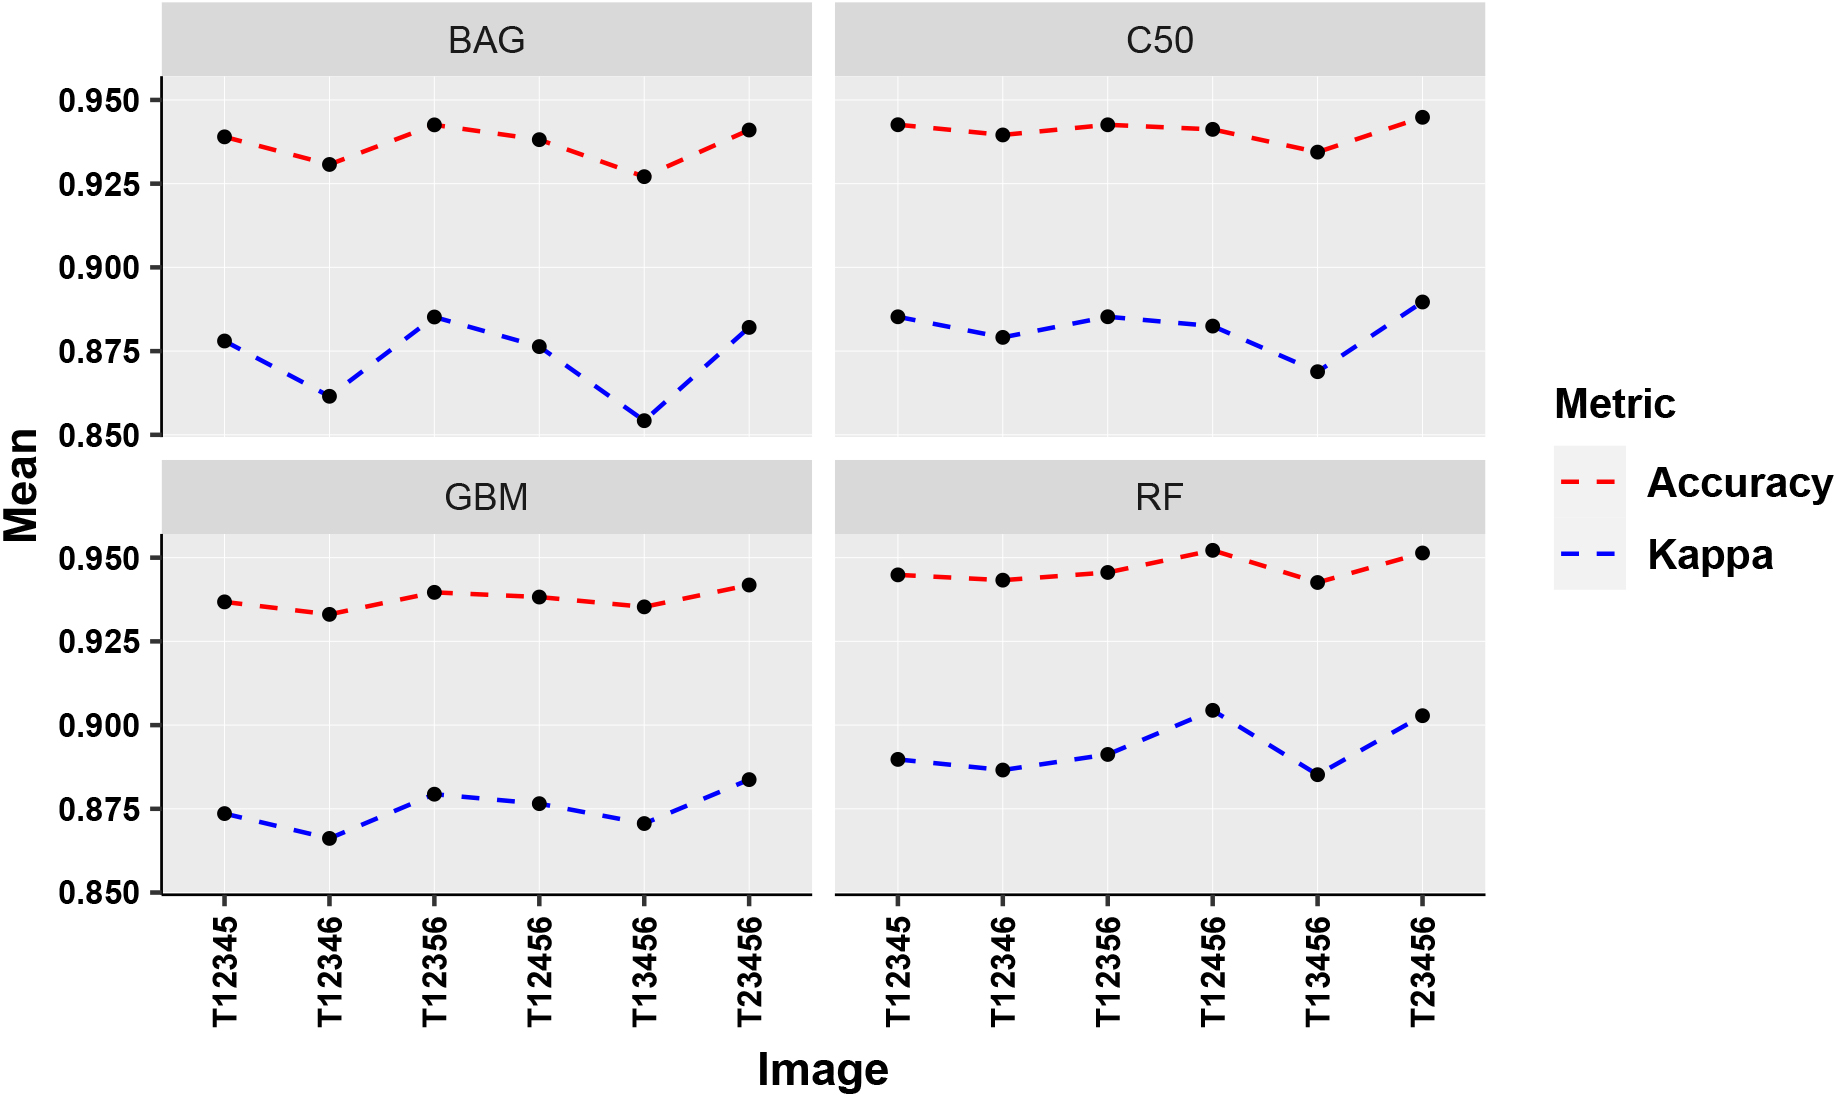
Comparative performance (six-set images).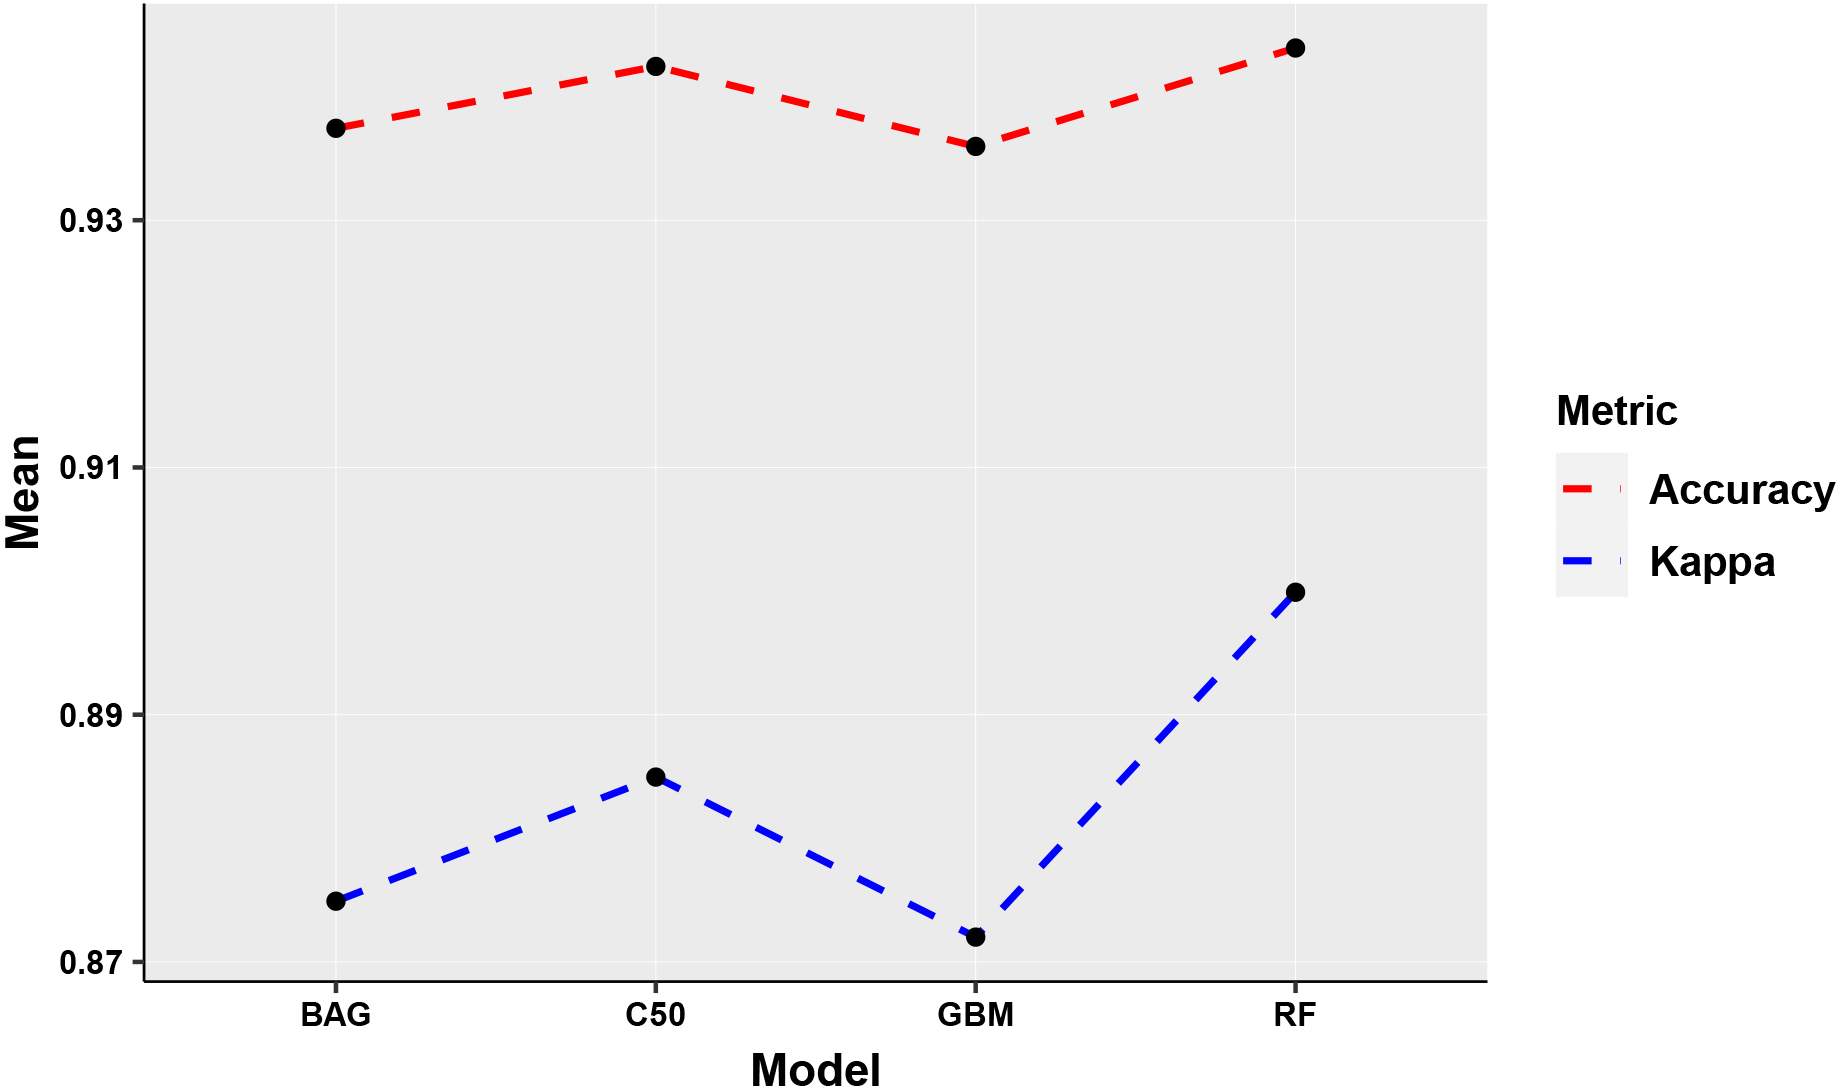
The performance of the RF classifier was observed as superior for all the image data sets and higher accuracy and Kappa are achieved in almost all of the sets. The comparative performance of all the ensemble models has been diagrammatically presented in Fig. 21. It has been observed that RF model performed significantly well on all the image sets, and the highest accuracy has been obtained as 0.97. The highest accuracy has been recorded for the four-image set T2456 as shown in Fig. 22. The Kappa coefficient is also observed as highest for the RF model and the four-image set T2456. The plot for the comparison of Kappa coefficient values has been given in Fig. 23. The comparison of models explored that GBM model performed on the lower side. While considering the images, the single image results have been performed significantly lower than other sets.
From the comparison, it can be ascertained that a single image was not sufficient to discriminate the ratoon from the plantation with higher accuracy. Also, the addition of more than four images to the dataset did not improve the performance of the binary classification process. The accuracy and Kappa, both saturated at the five-set and six-set images. Therefore, it can be concluded that one image from each season is sufficient for the discrimination of ratoon and plant sugarcane.
Comparative performance (ensemble models).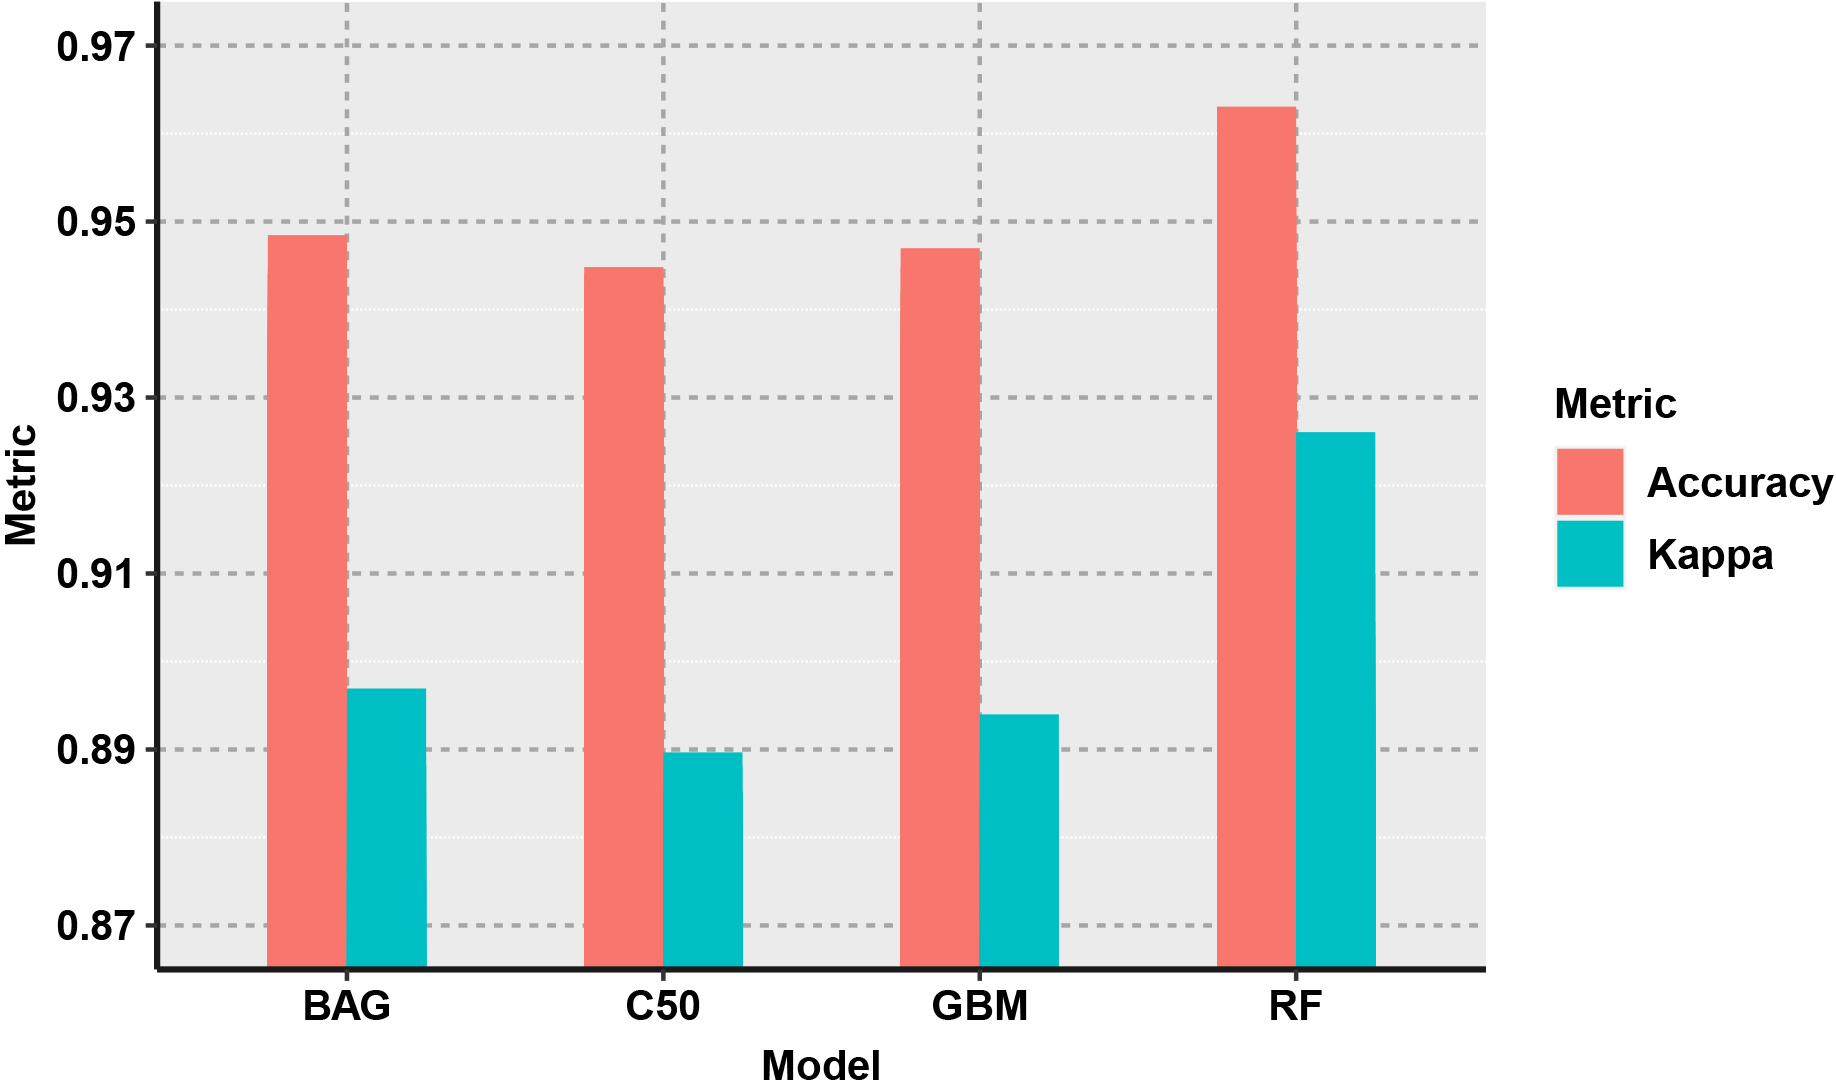
Accuracy comparison.
Kappa comparison.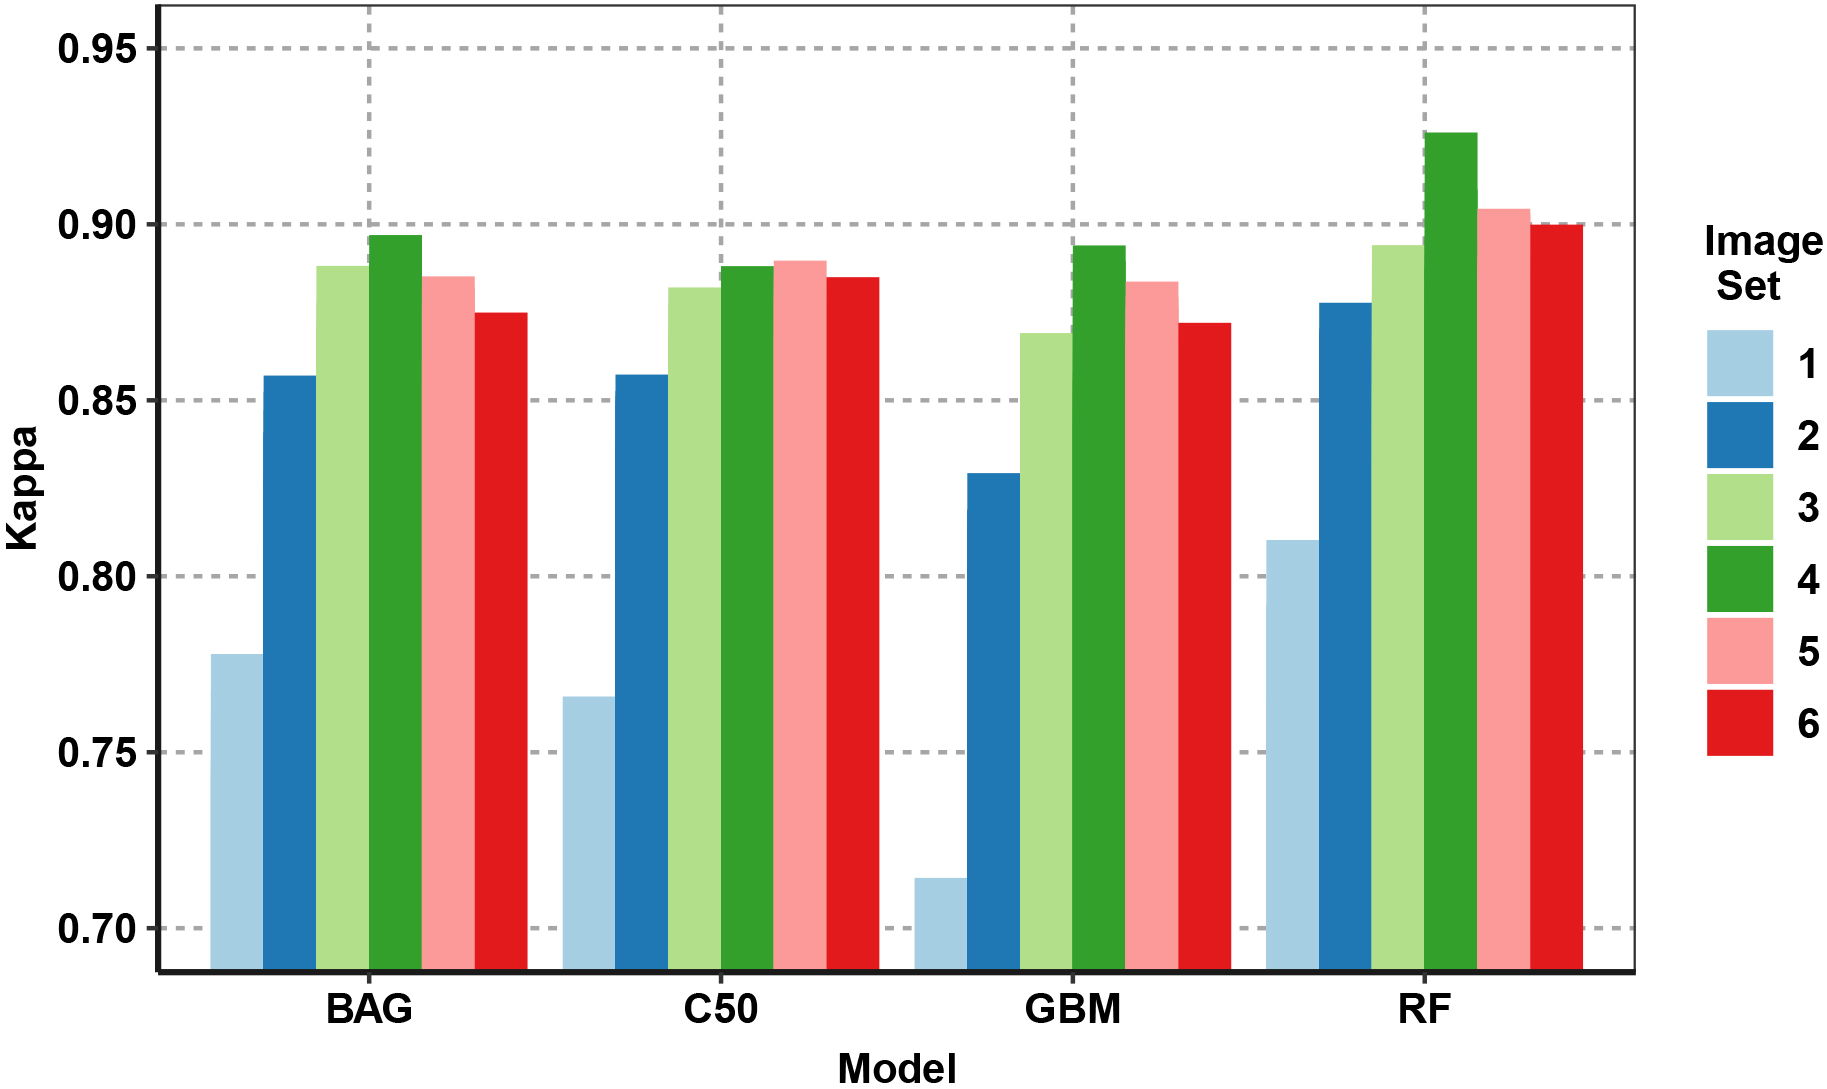
The RF model has been selected for further analysis on the validation datasets and unseen datasets from the different sites in the study area and different years. Various metrics such as Accuracy, Kappa, Precision, Recall and F-Score has been observed. The confusion matrix and the other metrics obtained for the validation dataset have been presented in Fig. 24. The overall accuracy for the validation dataset have been recorded as 96%, whereas, the Kappa coefficient values was 0.93. The precision, recall and F1-Score were also significant for the discrimination model. The discrimination model has been tested on the unseen data from the different years. The analysis for the new data has been presented in the next section.
Field experimentation confirms the fact that the greenness of the sugarcane has maximum variations initiated from the germination stage and continued till the grand growth stage. This variation factor can be used to discriminate the type of sugarcane as well as sugarcane varieties. Stages of the sugarcane growth based on the temporal variations may be effectively used for the classification. The accuracy analysis and measurement of the model’s performance have been conducted based on the on-field survey and sample data collected from the different fields of sugarcane for the year 2016 to 2019.
The comparison of the performance metrics for all the years has been presented in Table 11. The cavernous study of the Table 11 indicated that the performance of the models in the Dhanauri area is quite significant. This may be attributed to the fact that the data that has been employed to train the model belonged to this area. The irrigation system of this area is quite better than other areas. The lowest performance has been noted for the Sirmaur area. The poor performance of the developed model in this area may be due to the little difference in the climate conditions and the soil properties. Hence, the model may be enhanced for the area by incorporating some digital soil mapping model.
Performance metrics
Performance metrics
Confusion matrix – validation dataset.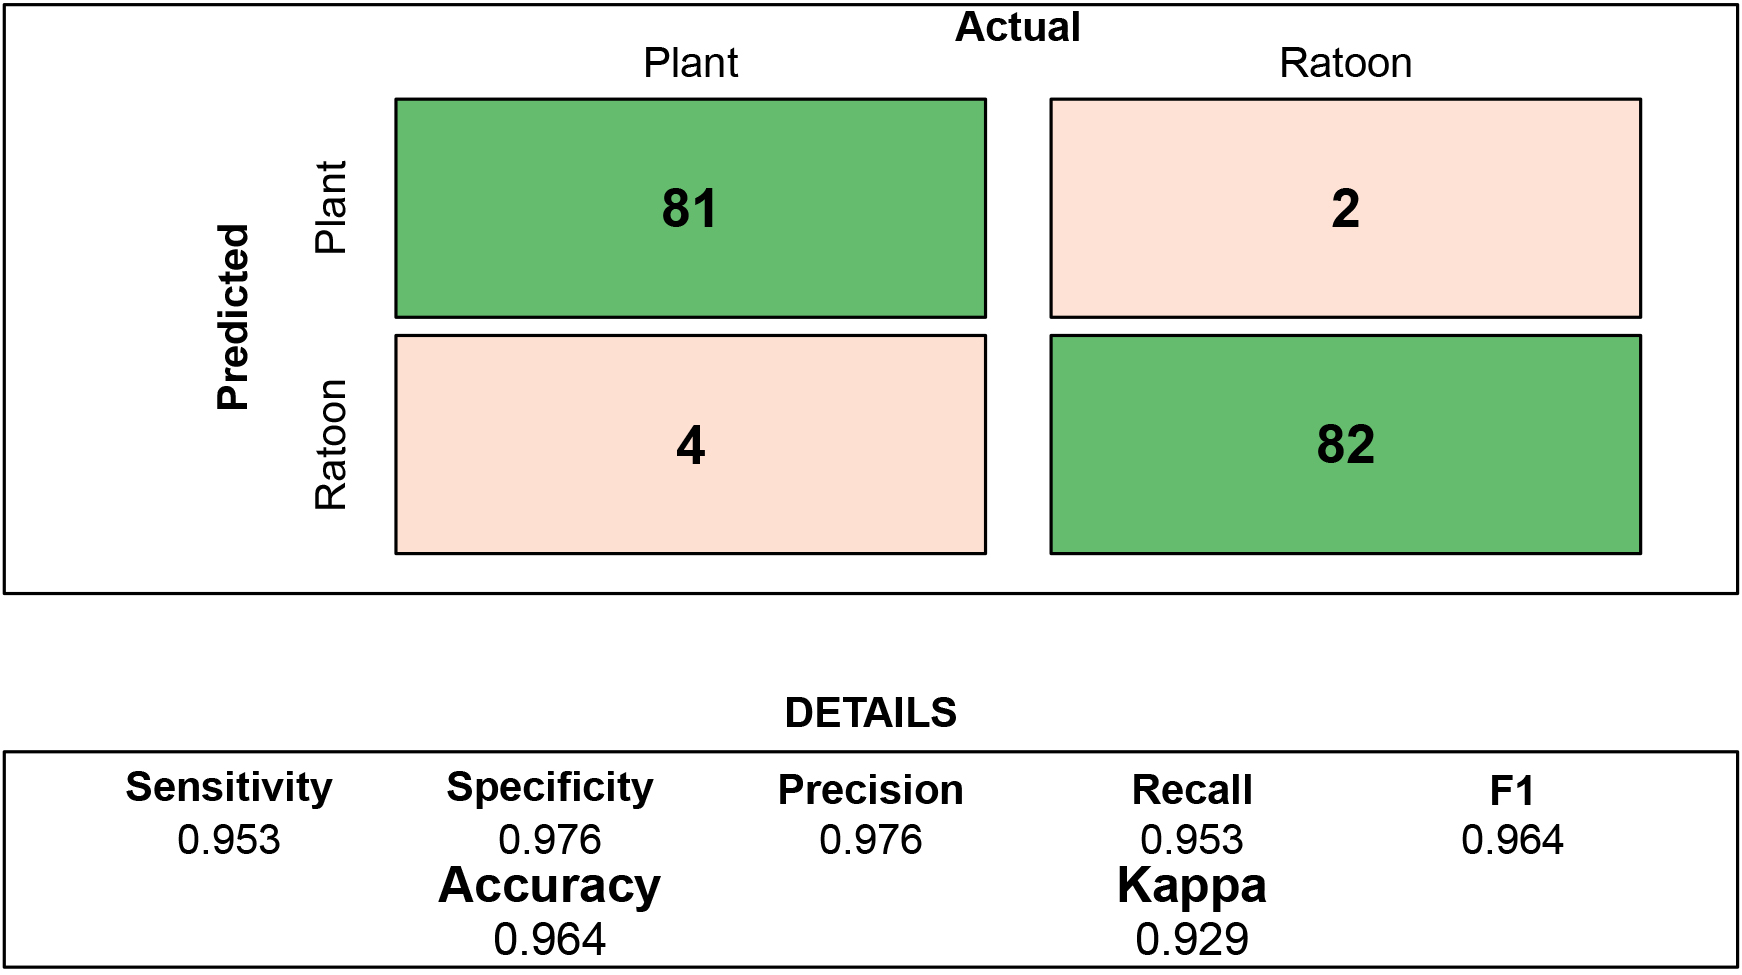
The overall results and the analysis based on the different performance evaluation metrics indicated that the discrimination model proposed in the study may be effectively used for the binary classification of ratoon and plant sugarcane based on the remote sensing data.
The present study demonstrated that temporal variations in the spectral bands and the vegetation indices may be effectively used for the discrimination of ratoon sugarcane from the plantation. The discrimination has been considered as a Binary classification problem. The preliminary analysis and the streamlining of the temporal profile of remote sensing data have been acquired to extract the potential information for the classification. Different variables such as spectral bands, spectral indices, biometric and biophysical variables have been employed. Variable importance selection based on the random forest method has been used to create the appropriate dataset for the classification. In spite of the temporal variations, the biometric variables have not shown noticeable importance.
Machine learning ensemble methods bagging and boosting have been utilized for binary classification problem. Machine learning models RF, CART (BAG), GBM and C5.0 have been used for the temporal image analysis. It has been explored that a single image from the entire season is not sufficient to discriminate the ratoon and plant sugarcane. One image from each stage of the growth may produce quality results. Four images (May 03, September 08, October 10 and November 11, 2015) taken together have shown the best performance in terms of classification accuracy and Kappa value. However, the addition of extra images into the dataset did not improve the accuracy. It has been observed that RF model performed best with 97% accuracy, whereas the performance of GBM model is the lowest. The proposed model has explored the testing data with the desired performance. In spite of the fact that the present model has been developed from a single year training dataset, it is reasonable to deduce that the observed accuracy of the proposed method is most suitable and operational in achieving the global normal accuracy in Himalayan Foothill areas having diverse agricultural practices.