
Abstract
In the course of recommending locations for establishing new facilities on urban planning or commercial programming, the location prediction offers the optimal candidates, which maximizes the number of served customers or minimize customer inconvenience, therefore brings the maximum profits. In most existing studies, only the spatial-temporal features are recognized to evaluate the location popularity, where social relationships of customers, which are significant factors for popularity assessing, have been ignored. Additionally, current researches also fail to take capacities and categories of the facilities into consideration. To overcome the drawbacks, we introduce a novel model of Multi-characteristic Information based Top-
Keywords
Introduction
Location prediction aims to identify the appropriate locations for placing new facilities either for commercial or public from a range of available candidates. In this context, location is characterized as a special site where the facility is set up to a given service for customers in a road network. This kind of prediction has been widely applied in a variety of recommendation systems in terms of urban planning or commercial facility locating, e.g., programming of establishing new vehicle charging stations, mobile toilets, retail stores, or restaurants in a city. One of the most important factors of prediction is the profits that incurred by candidate locations, different benefits could be gained from various locations as a result of their geographical situations, service periods, customer flows, or service capacities, and so on. Therefore, to predict the location popularity, which is a reflection of profits or earnings intuitively, the number of potential served customers is formally estimated, and there are grounds to recommend the locations with the highest evaluated popularity.
With GPS and mobile devices developed in recent years, people’s daily trajectories have been recorded and analyzed widely [1, 2, 3], where a trajectory is a sequence of check-in locations with timestamps in succession that illustrate the motion path more precisely. Therefore, an increasing number of studies of location recommending or location predicting come to focus on trajectories [4, 5, 6, 7, 8, 9, 10, 11]. However, these researches evaluate the popularity of candidates by the spatial-temporal information between customers and locations solely [12, 13, 5, 6, 7], or a few other characteristics are taken into consideration [14, 8, 9, 10]. As a result, these studies fail to depict the effects of social friend relationships, temporal regions and facility categories over the assessment of location popularity, which will render the final recommending results inaccurate and cause uneconomic to some degree. And next, the details of the three overlooked features are introduced.
An example for candidate location prediction.
In this paper, to overcome the aforementioned deficiencies, we formulize the location prediction problem, aiming to identify the optimal
This study proposes the location prediction problem within a novel model MITLP, it recognizes several kinds of relevant characteristic information comprehensively, and meanwhile depicts the feature of quantization and the evaluation of location popularity. We have developed a new recommending framework CLSTC-forest, which incorporates candidate locations, customers and spatio-temporal trajectories efficiently, an effective query algorithm is also employed accordingly. Extensive experiments are performed on real datasets to offer insight into the efficiency and effectiveness of the proposed model and framework, moreover, a case study is conducted further to visualize the effectiveness.
The rest of the paper is organized as below. Section 2 reviews the related work and Section 3 illustrates the definition and the framework of the proposed problem. Section 4 formulates the model with respect to feature extraction, popularity quantization and popularity evaluation. Section 5 depicts the implementation of the model and the corresponding query method. Experimental evaluation and a case study are reported in Section 6. The last section concludes the entire paper.
The existing work is covered on next optimal location prediction and optimal
Next optimal location prediction
Quite a few studies [18, 19, 20, 9, 21, 22, 12, 5, 13] focus on the next optimal location prediction problem by taking advantage of various metrics and objective functions, the background is that some facilities in spatial area already exist, and then the next optimal location is recommended for placement. Sun et al. [19] acknowledge the service capacity of each location facility, which suggests that there is a certain limitation on the number of served customers, however, the metric is only examined by spatial distances between customers and locations. Li et al. [20] query a location for establishing facility on the base of the optimal segment query of trajectories, they assign a score on each segment as in [5] without recognizing the candidate location as a specific position on a road network. Besides the metric model, the probability model-based prediction is another important side referring to the location recommending problem. Yao et al. [9] take advantage of a Semantics-Enriched Recurrent Model (SERM) for the next optimal location prediction in semantic trajectories, where both spatio-temporal transitions and relevant textual information posted by customers are considered on improving the precision, nonetheless, they concentrate on the mining of semantic information from trajectories. And Wang et al. [21] employ this different characteristic information of customers and integrate it into a simple regression model to query the optimal location, and they neglect the effects of facility categories and only recognize the restaurant placement. Karamshuk et al. [18] also propose a probability model Geo-Spotting on identifying the optimal area (location) for a new specific retail store, where the power of various machine learning features on the facility popularity are studied, but they only investigate few features of geographic and user mobility, the region characteristic of metropolises is ignored.
Optimal
locations prediction
Recent researches have concentrated on exploring the problem of optimal
Despite of the great contributions made by existing studies, yet there is no work dedicates the reciprocal recommendation, category competitiveness, and historic trajectories in spatio-temporal domain on candidate location prediction synchronously. Consequently, we propose the novel model MITLP to address the issue in this work, furthermore, a tree-liked framework is introduced by accordance with the structure of road network effectively.
Problem statement
In this section, we formally introduce the problem of candidate location prediction for facility placement, an overview of the entire problem framework is employed as well. Table 1 summarizes the frequently used notations throughout this paper.
Notation and the corresponding description
Notation and the corresponding description
Consider a setting where candidate locations and trajectories are located in a road network and social relationships of customers with respect to trajectories can be captured. The road network is illustrated as a directed weighted graph
The choice of
For example, if we plan to set up a charging station in one candidate location with 30 power poles for serving NEV (New Energy Vehicles), the service capacity of this facility (location) will be set to 30.
Note that each trajectory is corresponding to a certain exclusive customer represented as
Framework overview
An overview of the proposed location predicting framework is illustrated in Fig. 2, which consists of four logic parts in general. To begin with, by taking advantage of multi-characteristic information of the inputs, the facility location prediction extracts the significant features of spatial commute distance, social relevancy, temporal conflict, and category competitiveness respectively. Next, candidate locations are mapping to the road network in advance, and in order to predict the correlations between locations and its corresponding customers precisely, location popularity is quantified and then evaluated properly with the help of service categories, capacity constraints, and four previous extracted features. Subsequently, by repeating the interactive processes of popularity evaluation and parameters learning within test data, the framework of CLSTC-tree and CLSTC-forest are constructed by following several combination strategies of model learning. In the end, the candidate locations are kindly organized and ranked with the help of CLSTC-forest level marks, the final results are obtained conveniently through a simple selecting approach for either consultants or decision-makers on urban planning, public facilities locating, or commercial facilities locating, and so on.
An overview of the framework.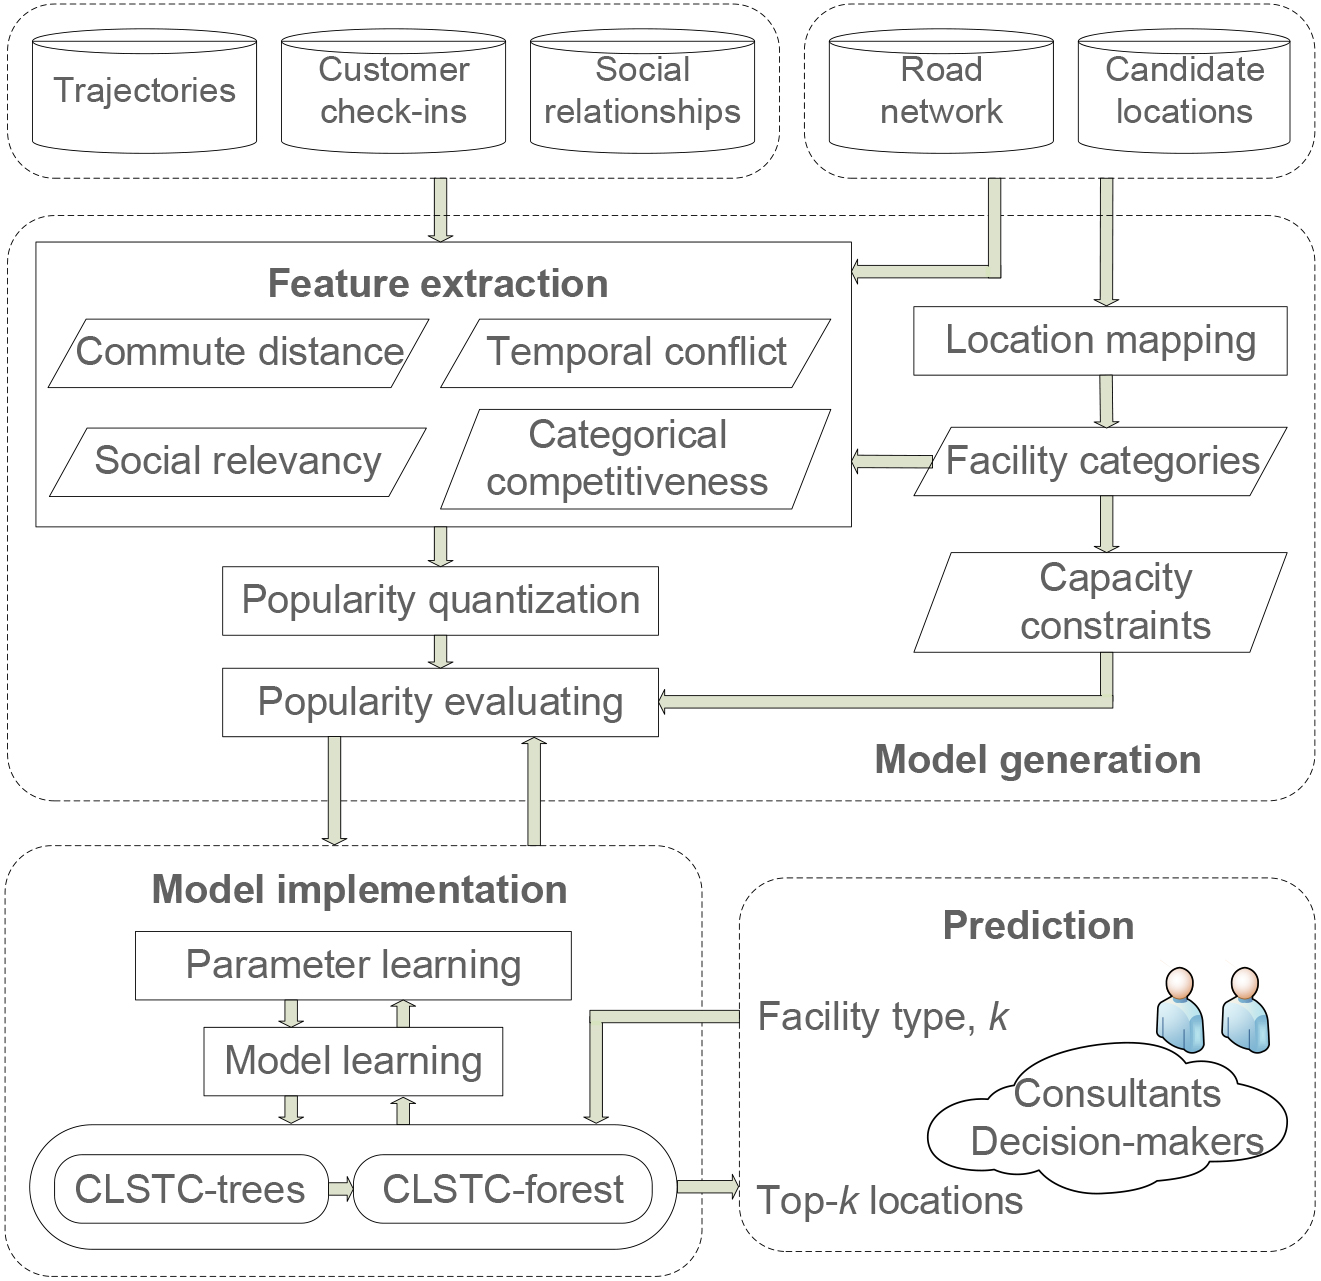
In this section, prediction features are illustrated within a few of characteristics, the popularity quantization and popularity evaluation for model learning are depicted, the proposed model is also briefly demonstrated with an example.
Prediction features
Feature extraction from multiple inputs is the critical essences for the processes of popularity predicting and model learning, we not only recognize the mutual correlations between locations and customers, but also capture the relevant characteristics of specific facilities that will be established at the same time. Subsequently, all the associated features are developed at length.
where
where
The first one is the attractiveness effect of candidate location, assume that
where
The second one is the customer check-in effect in terms of the category of facility which is planned to be established on this location, consider that the specific category is
where
The last one is the attractiveness of customer, to begin with, the double Pareto lognormal (DPLN) distribution [24] is developed to fit the overall spreading of social friend relationships over customers with respect to
From these points of view, the overall character of social relevancy among
where
Subsequently, within all the customers that have already been evaluated to
where
where
The reason for acknowledging categorical competitiveness is that existing facilities of the same category nearby will affect the selection of candidate location through homogeneous competition. Moreover, different sub-categories (brands) may have diverse effects on location facility, for example, if we plan to establish a KFC store on
The objective of an optimal or top-
where
Note that there is a special circumstance on the evaluation of service utility, which is
In the process of service utility assessing, a location serves customers who perceive it as their closely associated facility within its capacity, as well as a customer is calculated with the entire candidate locations and will be served by only one in the end. The greater value of
where
Within the definitions of
Model implementation
Similar to the set cover problem [25], the general implementation of MITLP is time-consuming and would not be appropriately learned. Therefore, it is inapplicable to real metropolis road network or larger magnitudes of
CLSTC-forest (tree)
The introductions of CLSTC-tree and CLSTC-forest are elaborated as below.
Specifically, the node in CLSTC-tree reflects the ground truth that a particular sub-area of road network is represented by its label
A simple CLSTC-tree.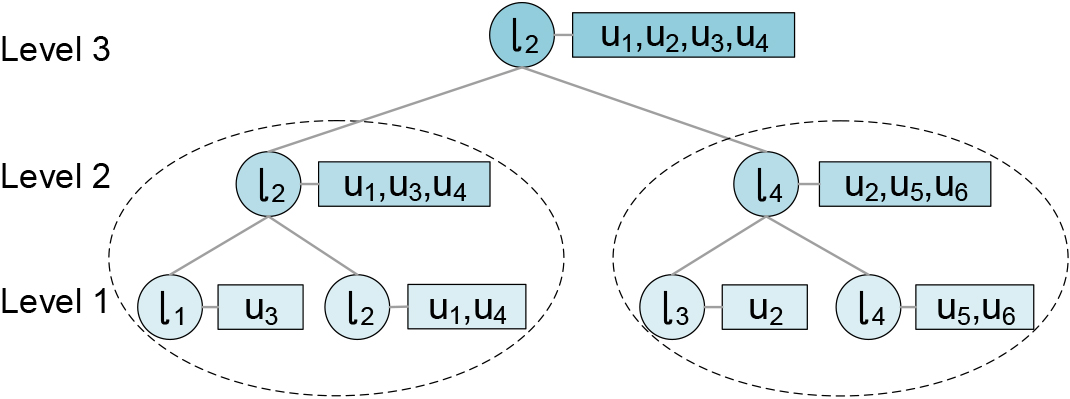
A bottom-to-top approach is employed to the generation of CLSTC-forest (trees), the overall generation processes are presented in Fig. 4, which includes two steps: 1) leaf node generating; and 2) none-leaf node combining, it can be observed that a CLSTC-tree is ultimately developed while the tree root node can not be combined any more.
Leaf node generating
Suppose that a customer has been served with no more than one candidate location (facility) at a time, under this condition, we focus on bundling both candidate locations and their corresponding customers into leaf nodes by taking advantage of a constrained
To be more specific, firstly the service utility
After this process, the entire cluster set of
The flowchart of generation processes (model learning).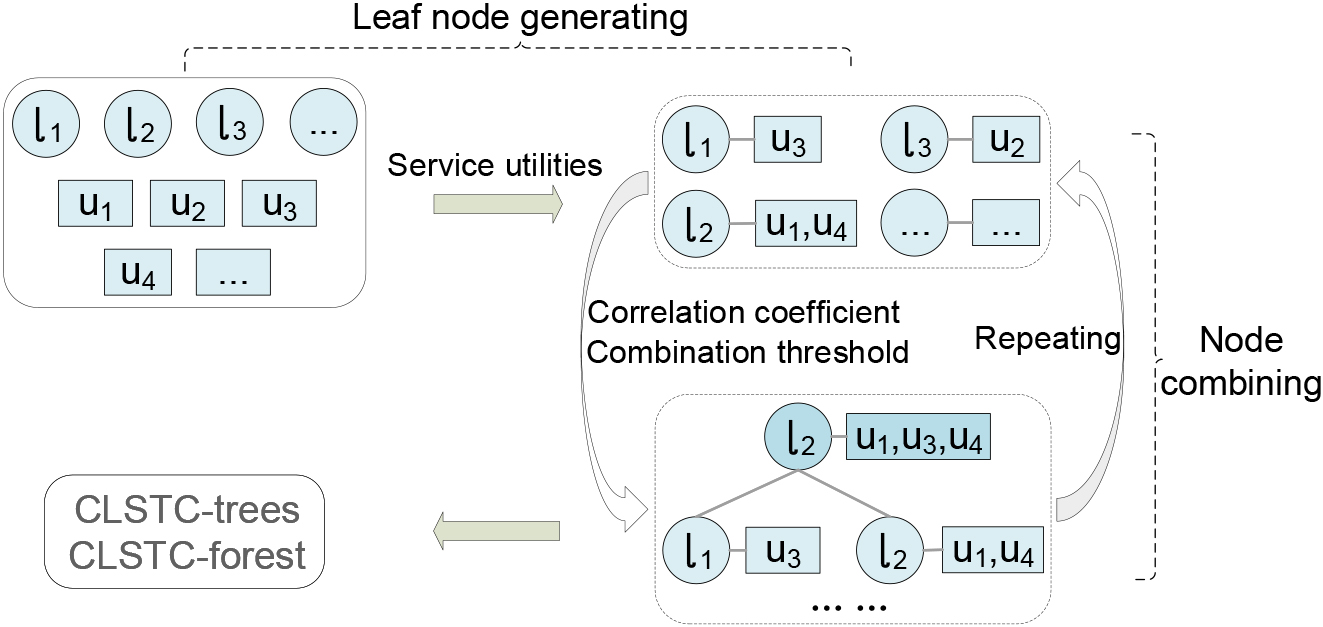
In this practice, the entire CLSTC-trees are constructed from bottom leaf nodes to top root nodes by handling a sequence of merging strategies, and then the CLSTC-forest will be automatically formed.
It is observed that each leaf node generated from the former step is also a simple CLSTC-tree that has merely one root node, from this point of view, a series of merging approaches can be adopted to merge two CLSTC-trees into one by taking advantage of their information of root nodes. The process of forming one parent node from two child nodes is also referred as node combining, which is a crucial exercise in generating CLSTC-trees (forest). First of all, the definitions of tree node correlation coefficient and CLSTC-tree correlation coefficient are proposed.
where
In this context, the correlation coefficient
Nevertheless, there is no need to assess the correlations over each pair of CLSTC-trees in the combining development, since two candidate locations are less likely to share a large quantity of customers who are in close relations when they are far apart from each other in spatial distance. From this point of view, the combination threshold between two tree nodes is suggested as
After this node combining practice, new root (parent) nodes have been created, and fresh desirable CLSTC-trees are formed after one round of combining, subsequently, the newly shaped CLSTC-trees are taken as the inputs to the next combining process until there is no CLSTC-tree left, then the CLSTC-forest is automatically established.
With the help of Eq. (11) and definition 8, it can be observed that the output score
where
We can see that
Note that the actual facilities are almost impossible to be established at the centers of locations (road intersections), that is to say, they barely coincide with the same geographic positions. As a result, we acknowledge that
After model implementation, each CLSTC-tree is well-organized, and these tree nodes would represent both candidate locations and the corresponding customers comprehensively in a spatial area, it is important to catch that there will be a greater number of customers that have been served by the location within larger spatial space if the node is at a higher level of the CLSTC-tree. What’s more, candidate locations with their corresponding customers are apart from each other in different CLSTC-trees, where the specific aspects include spatial distance, social relevancy or temporal region, and so on. With this ground truth, we can see that the top-
To easily explicate the querying, tree levels of CLSTC-forest are marked and put into a set
[b] Top-
Based on the CLSTC-forest and
Experimental evaluation
In this section, we experimentally evaluate the efficiency and effectiveness of MITLP. The datasets and environment are described firstly, then we list the baseline methods and experiment settings, next the top-
Datasets and environment
Datasets
The most widely used datasets of Shanghai and Beijing, which are the two largest cities in China, are employed in this study. By taking Beijing datasets as an example, the details of candidate locations, trajectories, customers with their corresponding social relationships, POI check-ins and ground-truth facilities are introduced as follows.
The intersections
However, since it is difficult to capture a large number of customers within their corresponding daily trajectories in reality, we adopt the algorithm of discovering the Popular Routes in [26] to simulate the processes of generating customers with respect to trajectories by existing real datasets, the reason is that historical traveling experiences would indicate how customers usually determine routes between spatial locations. The datasets of Shanghai are prepared in the same way, Table 2 gives an overview of the two datasets explicitly.
Statistics of two metropolises
We collect the POI (facility) categories from the open LBS platform in AutoNavi,2
Summaries of four facilities
All approaches in Python (Version 3.6.0) platform are implemented, and the entire experiments are performed on a 64-bit Intel(R) Xeon(R) E5-2630 v2 2.60 GHz CPU (24 Cores) machine with 256 GB RAM, 1TB hard disk, which runs a CentOS Linux release 7.4.1708 (Core) OS.
Baselines
To the best of our knowledge, no existing studies have been committed to the constrained top-
What’s more, there is no doubt that verifying the effectiveness on real establishing facilities of various categories is sincerely ambitious and impractical in metropolises, as a result, to simulate the process of facility placement, we carry out the entire experiments with respect to several popular existing facilities adopted by most recent studies as in [18, 14, 8, 9, 10, 6, 21].
To conduct the model learning and experiment evaluating efficiently, we need to initialize a series of primary parameters at first. The average capacities of four existing facilities are listed in Table 3 with some field investigations that have been appraised on both evaluated cities, three Laplace smoothing coefficients of
For exploiting every of specified location facilities in a city, the corresponding datasets (trajectories, customers and social relationships) are divided into training part and testing part, which consist of 80% and 20% of the whole datasets randomly. Furthermore, each experiment is evaluated for 10 times and the average results are returned finally. During the algorithm practices, the multi-process programming technology is utilized to accelerate the whole evaluations while a total of 20 CPU cores are handled.
Performance in efficiency
Evaluation metrics
We have conducted a comprehensive evaluation in efficiency on the running time of model learning (or index constructing) with respect to all competitors, and besides, for assessing facility capacities and visualizing the structures of CLSTC-forest, none-full/full (root) CLSTC-tree nodes and the maximum tree heights are illustrated briefly.
Experimental results
The running time of five models in various category of facilities and a couple of urban datasets are depicted in Fig. 5, in which Fig. 5a–d denote the results returned from Shanghai and Fig. 5e–h are from Beijing. It can be observed that there is an upward trend in time consumption generally, NetClus, SERM and
CLSTC-forest collections in Shanghai
CLSTC-forest collections in Shanghai
CLSTC-forest collections in Beijing
Performance on model learning (hours). (a)–(d) In Shanghai, (e)–(h) in Beijing.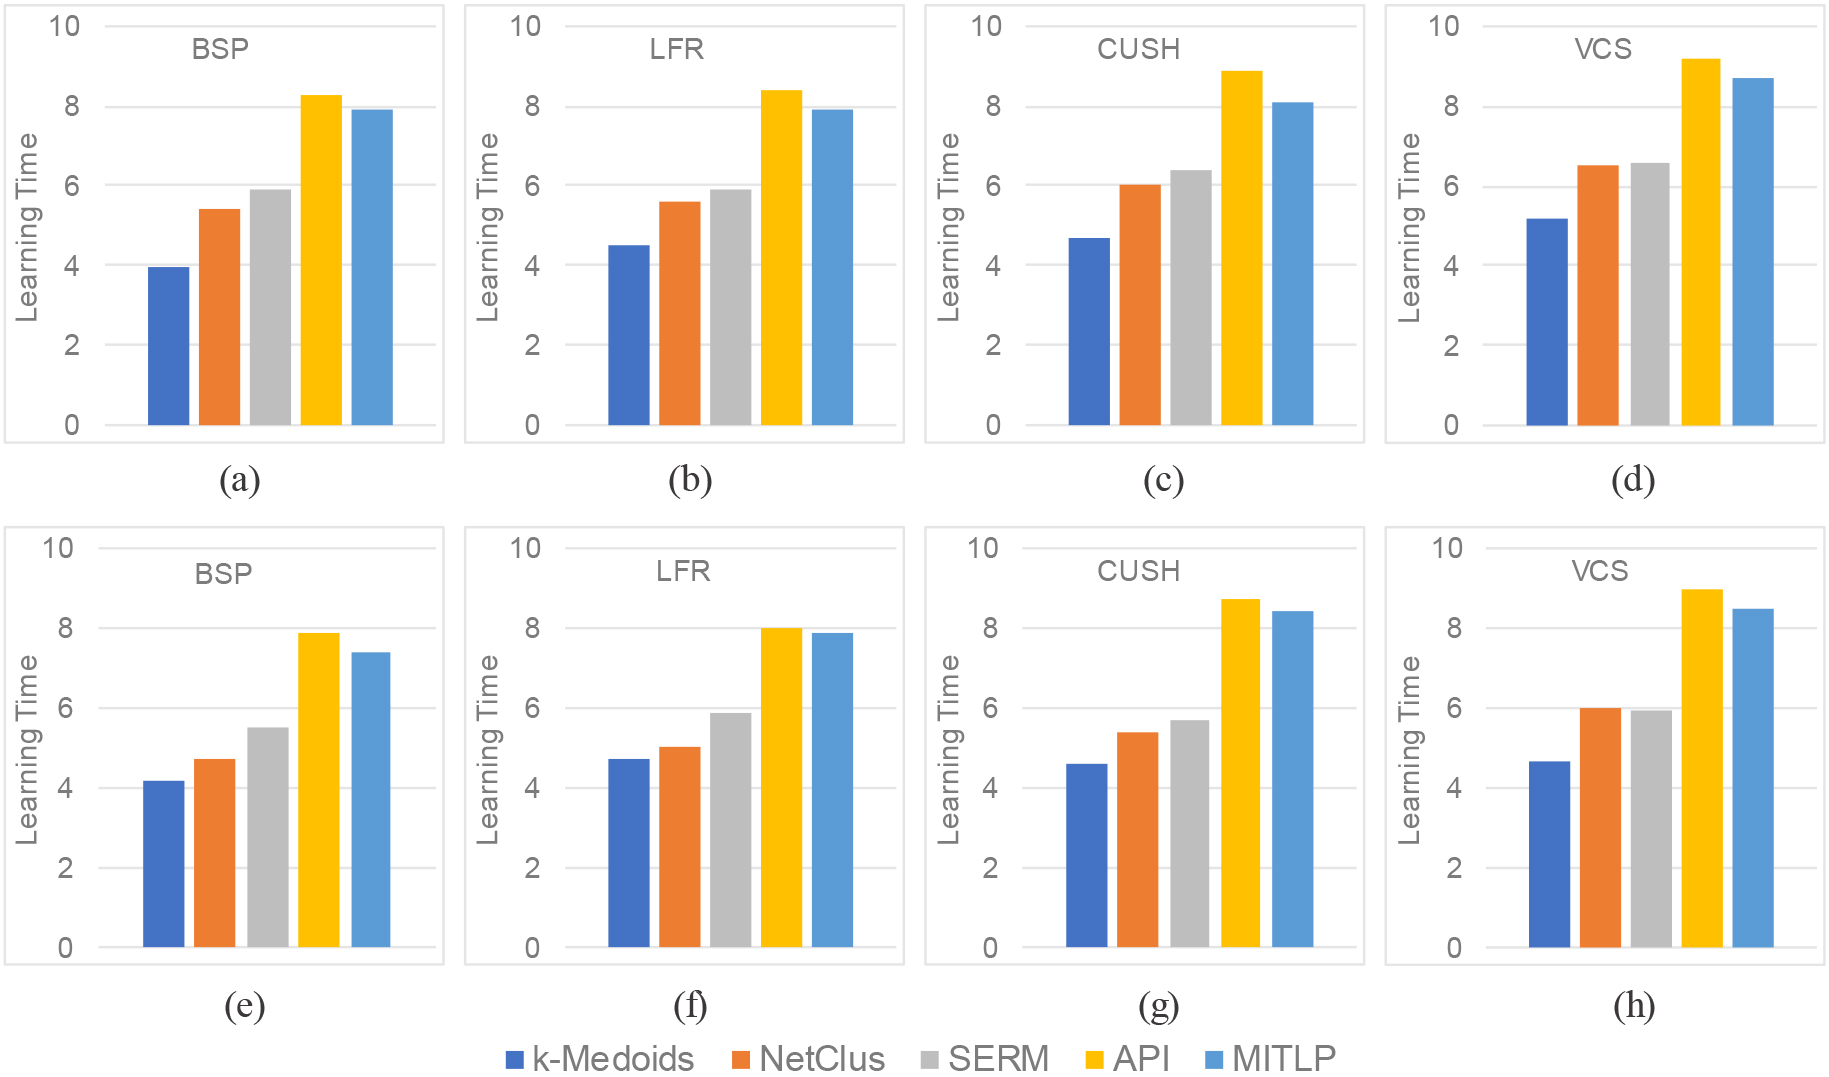
Tables 4 and 5 have given a brief insight into the highest tree heights, as well as the number of none-full/full tree nodes in bottom level (leaf nodes) and top level (root nodes) of CLSTC-forest on the four specific facilities. Since different facilities may have distinct capacities indeed, the highest height of CLSTC-forest raises with the increase of capacities, as well as the number of full tree nodes decreases at the same time as in leaf nodes and root nodes, the reason is that candidate locations (facilities) in tree nodes are filled in more quickly when the capacity is small, thus the number of CLSTC-trees (root nodes) also grows up, and vice versa. Meanwhile, the height of every CLSTC-tree is also positively correlated with the facility capacities.
Evaluation metrics
A couple of the metrics of Precision and Root Mean Square Error (RMSE) are designed carefully for effectiveness evaluating. On one hand, precision is one of the most important traditional evaluation metrics in top-
where
On the other hand, to better verify the effectiveness of candidate location predicting, RMSE is also adopted to measure the deviations between the recommended locations and the ground-truth facilities, the reason is that the facilities are almost impossible to be established just on the locations, and then, the definition of RMSE is listed as:
where every pair of
The smaller value of two metrics implies that the recommended locations are really better in accordance with the actual existing facilities, and the model has a better performance in effectiveness.
Performance in terms of precision on Shanghai.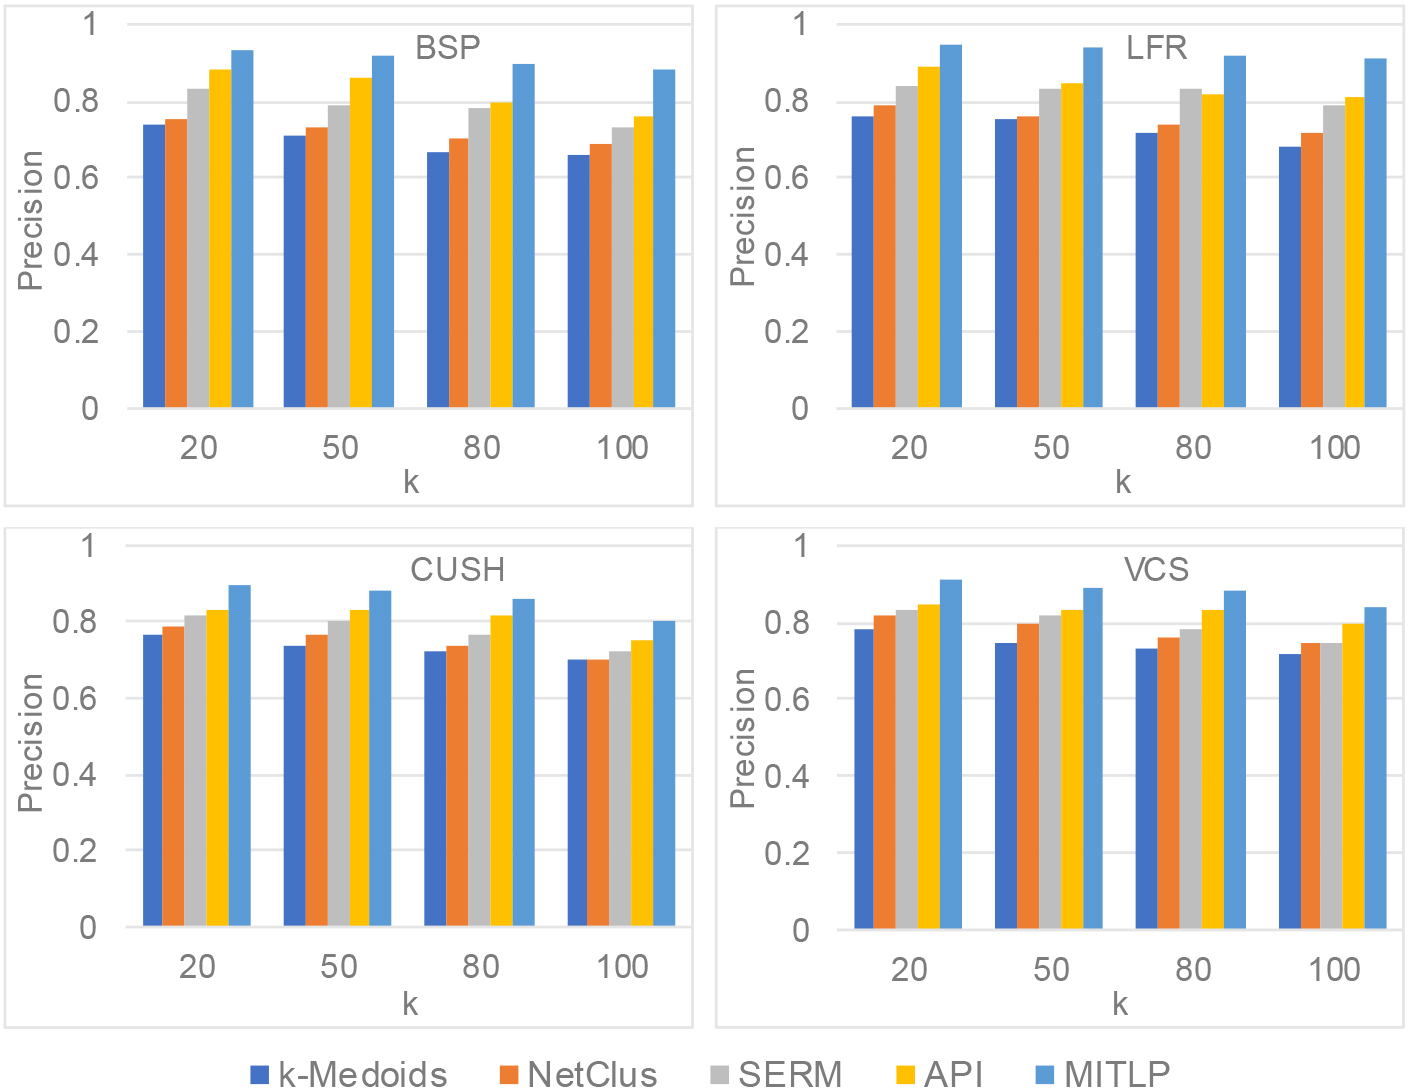
Performance in terms of precision on Beijing.
The precision of varying
Performance in terms of RMSE on Shanghai.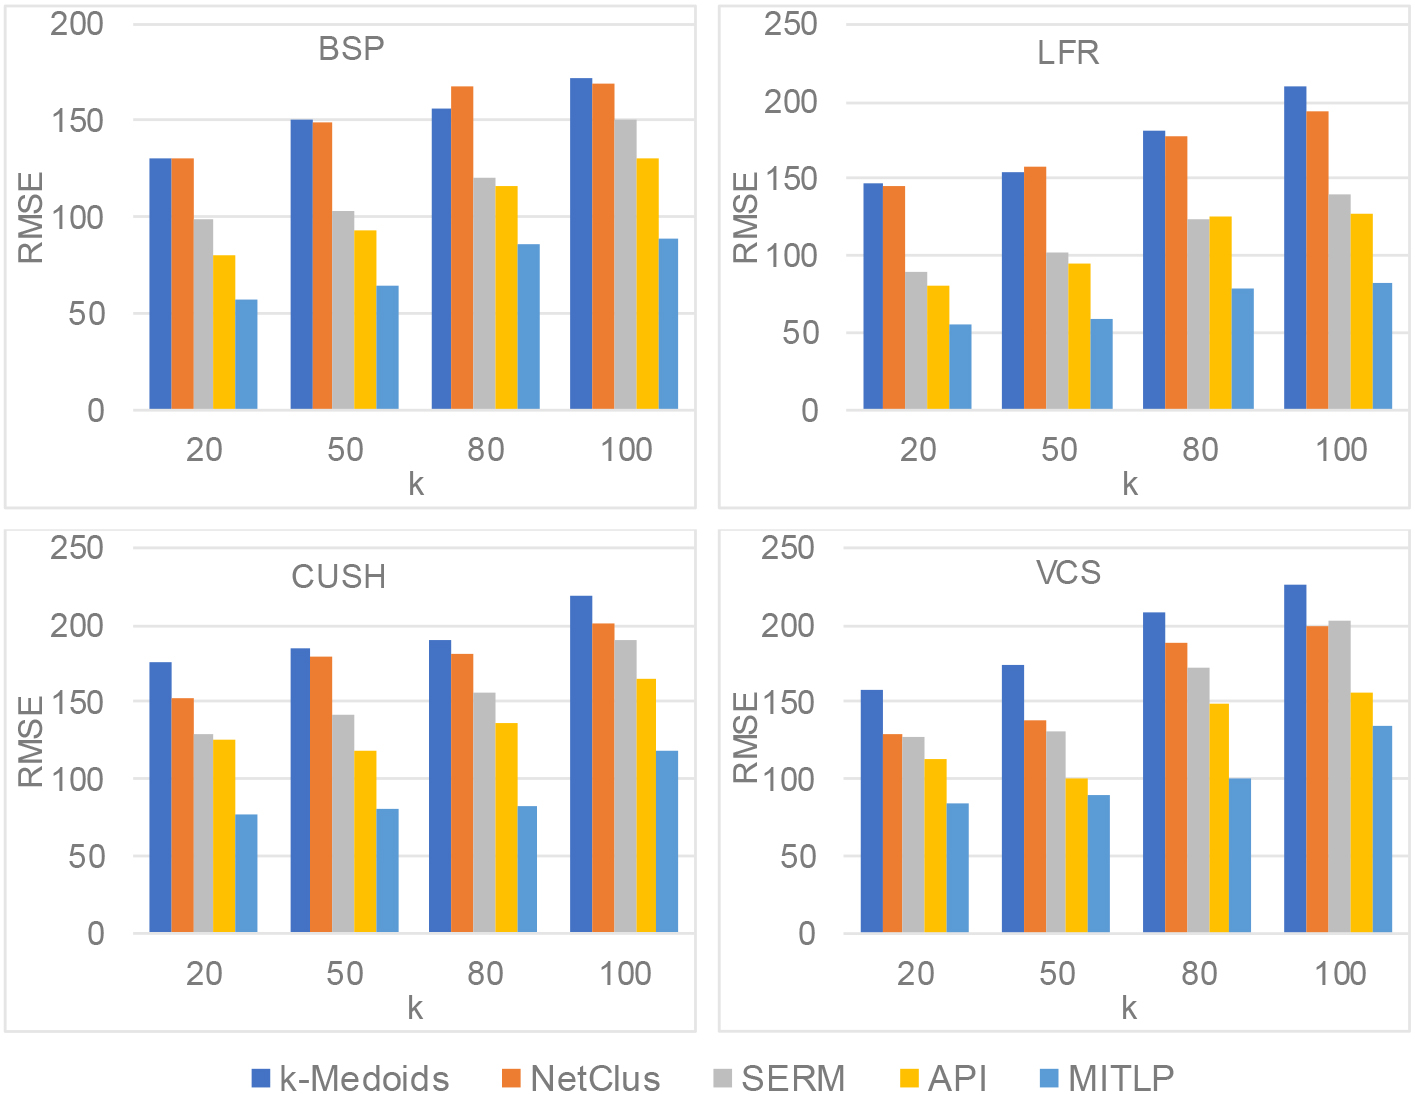
Performance in terms of RMSE on Beijing.
Subsequently, the performance of RMSE is presented in Figs 8 and 9 on same conditions, we can see that our proposed MITLP model has a better achievement comparing with all competitors, and the results has a reverse manner with the precision. The reason can be derived from their definitions, a higher precision indicates that there is a lower deviation between recommended location and validated facility, and vice versa. In other words, if the value of precision is larger, the candidate locations recommended will be better represented by the corresponding facilities in road network, it also demonstrates that a larger RMSE will result in a worse performance on predicting contrarily.
Weights learned by MITLP. (a)–(c) In Shanghai, (d)–(f) in Beijing.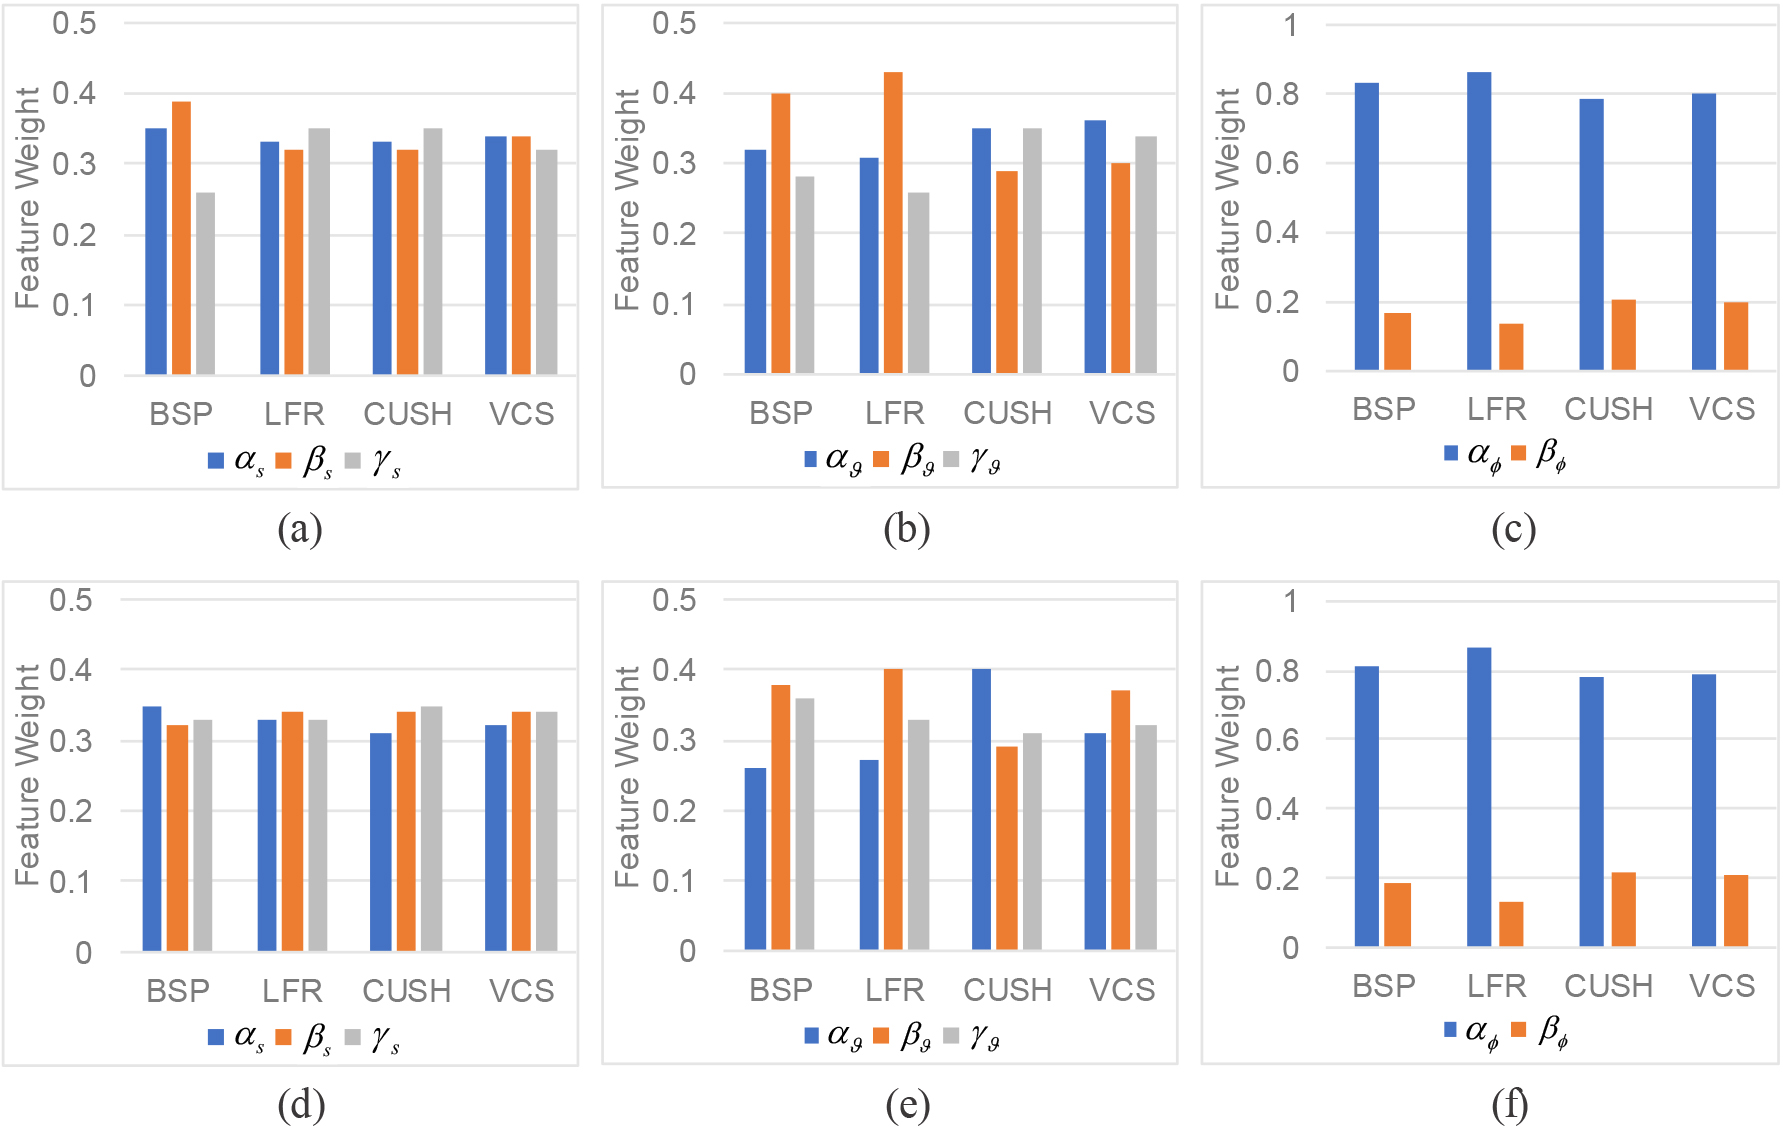
Visualization in VCS (
In order to offer insights into the characteristic contributions to the performance of candidate location predicting, we further investigate three groups of feature weights with respect to Eqs (6), (10) and (11) in Fig. 10 as a whole. For
A simple case study on VCS is simultaneously presented to visualize both the recommended locations and the ground-truth facilities at the central area of Beijing, as shown in Fig. 11, a total number of top-20 candidate locations within the hit facilities are depicted respectively. We can see that the recommendation results in Fig. 11a are almost close to the corresponding ground-truth facilities in Fig. 11b in geographical positions, more specifically, the precision is 88% and the RMSE is 89 meters as described in Figs 7 and 9 respectively. This case study shows that our query results are accurate and reliable in facility location predicting.
Conclusions
In this paper, we have proposed a novel model MITLP for the problem of location prediction for facility placement with multi-characteristics. We not only acknowledge the spatio-temporal behaviors and social relationships of customers, but take advantage of the capacity limitations and categories of specified facilities at the same time. What’s more, the location popularity is quantized and evaluated with respect to these relating features. In order to achieve efficient top-