We challenge the problem of efficiently identifying critical links that substantially degrade network performance if they do not function under a realistic situation where each link is probabilistically disconnected, e.g., unexpected traffic accident in a road network and unexpected server down in a communication network. To solve this problem, we utilize the bridge detection technique in graph theory and efficiently identify critical links in case the node reachability is taken as the performance measure.To be more precise, we define a set of target nodes and a new measure associated with it, Target-oriented latent link Criticalness Centrality (TCC), which is defined as the marginal loss of the expected number of nodes in the network that can reach, or equivalently can be reached from, one of the target nodes, and compute TCC for each link by use of detected bridges. We apply the proposed method to two real-world networks, one from social network and the other from spatial network, and empirically show that the proposed method has a good scalability with respect to the network size and the links our method identified possess unique properties. They are substantially more critical than those obtained by the others, and no known measures can replace the TCC measure.
Identifying critical nodes and links that play an important role in a large complex network is one of the essential and crucial issues in various fields including communication network analysis, urban design and evacuation planning, etc. For instance, in the field of social network mining [5, 15], detecting a limited number of influential nodes that are effective for widely spreading information is known as the influence maximization problem, which is motivated by viral marketing. Traditional centrality measures such as degree centrality and betweenness centrality are often used to quantify the importance of individual nodes and links. However, since these measures are based only on network topology, other factors that are more realistic, such as probabilistic information diffusion model (functional) and geodesic distance (structural) have also been used to assess a certain network performance metric [39, 26, 35, 34, 22, 36, 23].
The objective of these studies is identifying the most critical nodes/links in maintaining or maximizing a desired network performance, that is, identifying those nodes/links that degrade the performance substantially if they fail to function. For example, if the desired performance is maintaining an ability of information spread of a given social network, the critical links (information paths between two people) to be identified are those which maximally reduce the total number of people who can receive information issued by specific persons (information sources) when those links fail to pass the information. If the desired performance is maximizing evacuation or minimizing isolation in evacuation planning, the critical links (roads) to be identified are those which maximally reduce the total number of people who can reach one of the evacuation facilities when these links are blocked. This problem can be mathematically formulated as an optimization problem once a quantitative performance measure is defined when the network structure is given.
In reality, every link in a given network is not necessarily always functioning. In case of a social network some information paths between two persons may not be open due to server down or some other reason, and no information is passed from one to the other. In case of a road network some roads between two intersections may be blocked by traffic accident, road repair or nearby construction, and no persons and vehicles are allowed to pass. We do not know when these happen in advance. To account for this uncertainty, we assume that each link is disconnected probabilistically and propose a probabilistic link disconnection model. This is a standard approach taken in most studies on uncertain graphs. In other words, we consider a problem of identifying critical links associated with a set of target nodes specified in advance in a given uncertain network. Under this problem setting, we adopt, as the performance measure, the marginal loss of the expected number of nodes that can reach one of the target nodes from the rest of the nodes in the network, or equivalently the marginal loss of the expected number of nodes in the network that can be reached from one of the target nodes, when a particular link is disconnected. For example, assuming a social network, this measure quantifies how a link affects the overall communication to a set of people (target nodes) over the network if it does not pass information, and assuming a road network, this measure quantifies how a particular road connecting two intersections affects overall reachability to a set of facilities (target nodes) over the network if it stops allowing people and vehicles to pass. We refer to this marginal loss as the Target-oriented latent criticalness centrality (TCC) and propose a method to efficiently identify critical links, i.e., links for which TCC values are large.
We notice that bridge in graph theory is the key concept to solve this problem. A bridge is a link in a connected component such that its deletion divides the component into two disjoint ones. In our problem setting, if one of the disjoint components does not contain any target node, the marginal loss of the bridge is greater than 0 because no node in the component can reach, or equivalently can be reached from, any target node in the other component and thus, the link can be a candidate of critical links. We propose an algorithm that incorporates the standard bridge detection algorithm whose computational complexity is , where is a set of links in the network, and identify all bridges and compute their TCC values efficiently. To the best of our knowledge, our approach is the first to identify critical links based on the bridge detection algorithm under a probabilistic link disconnection model.
Conference version of this paper appeared in [37], where we investigated the performance for two real world road networks in a evacuation problem setting with fixed sets of target nodes (evaluation facilities). In this paper, we detail the explanation of the algorithm, but we do not repeat the same experiments. We redesign the experiments in a more general setting and show the new results for two different networks from two different domains, one from social and the other from spatial domains, and two different target node settings with a parameter to change their size. The results reconfirm what was reported in [37], and reveal new findings. We have applied a similar idea to identify critical nodes in uncertain graph [24, 25]. However, no notion of target nodes was introduced and the performance measure is the marginal loss of the expected total reachability. Thus, the problem setting is different.
Below we summarize our contributions in this paper. 1) We present a realistic problem of detecting critical links under a probabilistic link disconnection model. 2) We propose a new centrality: Target-oriented latent link Criticalness Centrality which is defined as the marginal loss of the expected number of nodes that can reach, or equivalently can be reached from, one of the target nodes. 3) We propose an efficient algorithm to compute TCC value of each link based on bridge detection, whose computational complexity is , where is the number of networks generated from an original one based on the probabilistic link disconnection model (possible worlds). 4) We experimentally demonstrate the effectiveness of our proposed method for two real-world networks, Enron e-mail network and Washington DC Road network, using two different target node settings (medoid and random) with different target sizes. The results show that our method is much faster than computing the traditional centrality measures, has a good scalability with respect to the network size, and the links our method identified possess unique properties. They are substantially more critical based on TCC measure than those obtained by the other centralities. No known measures can replace the TCC measure.
The paper is organized as follows. Section 2 briefly explains the related work of this paper. Section 3 formulates the critical link detection problem based on a probabilistic link disconnection model. Section 4 presents the proposed method based on bridge detection. Section 5 shows experimental results on two real-world networks. Section 6 summarizes the main achievements and future directions.
Related work
Centrality measure
A variety of node-centrality measures have been used to quantify the criticalness (importance) of each node/link. These include traditional centrality measures that are based only on network topology such as the degree centrality, the betweenness centrality [12] and PageRank centrality [3] and new measures that take into account other factors from functional view point, such as percolation centrality [32] which is defined by percolation states of individual nodes in a social network. Traditional centralities have often been used to analyze spatial networks embedded in the real world from structural viewpoints [7, 27, 22]. More problem specific performance measures have also been devised and used to quantify the criticalness of links. For example, typical performance measures for a road network are based on traveling time for a link or a path in the network [39, 26]. We proposed a performance measure based on the node reachability in our past work [34, 36], which is close to the one we use in this paper. There exist many studies on centrality measures over uncertain graphs [11, 31, 43, 2] which do not focus on reachability. Our work is different from these existing studies. What we focus on in this paper is the critical link detection problem in a situation where links are probabilistically blocked.
Originally centrality is defined for each individual node or link. However, in order to deal with a more realistic situation such as information diffusion over a social network from multiple source nodes, it becomes more important to examine which group of nodes are the most central. Thus, a notion of group centralities has been proposed [9] as an extension of traditional node-centrality measures, e.g., group degree centrality, group closeness centrality and group betweenness centrality. Among them the group closeness centrality is closely related to real world problems such as location planning of commercial or evacuation facilities in a wide area [23]. In this paper, to quantify the criticalness of a link, we measure the network performance by the node reachability from/to a set of target nodes. Thus, the problem we tackle in this paper is also related to maximizing a group centrality since the performance measure we adopt can be a kind of group closeness centrality for the set of target nodes. TCC is different in that we count the number of nodes based on reachability and the graph we treat is uncertain.
Critical link detection
There are a variety of investigations for mining critical links. Grady et al. [13] proposed the notion of link salience to extract the skeleton of a network as an extension of link betweenness centrality. Fang et al. [10] presented link capacity allocation methods to prevent cascading failures under limited investment costs for power transmission networks. Critical link identification problem has also been explored in various scenarios, including communication networks [40], wireless sensor networks [1] and water distribution systems [8]. On the other hand, the problem of injecting appropriate new links for improving network performance has been examined from various perspectives. Papagelis [28] and Parotsidis et al. [29] investigated a problem of minimizing the average shortest path distance over all pairs of nodes in a network by finding optimal new shortcut links. Crescenzi et al. [6] and Parotsidis et al. [30] addressed the problem of maximizing the closeness centrality of a specific node in a network by suitably selecting links to be injected. Chaoji et al. [4], Tong et al. [42] and Li et al. [20] explored a problem of promoting information diffusion in a social network by injecting new links. Ohara et al. [23] proposed a method to create new links that maximizes the gain of the group closeness centrality and applied it to evacuation problem. Unlike these previous studies, we focus on the node reachability from/to a set of target nodes as the network performance, and attempt to efficiently identify critical links in an uncertain situation where links are probabilistically disconnected. We propose a new link-centrality measure, Target-oriented latent link Criticalness Centrality, which can be considered as a kind of vitality index [19], and develop a method of efficiently calculating the TCC value of every link.
Our proposed method is based on the standard bridge detection algorithm [41] in graph theory. The bridge itself is critical in a network since its removal breaks the connectivity of the network. Thus, bridge detection is embedded into problems encountered in various fields such as wireless sensor networks [1], while it is also utilized to improve computational efficiency of conventional centrality measures [38]. However, these studies assume that the network structure is stable. Unlike these previous studies, our work deals with an uncertain graph [16, 14] where each link has independent disconnection probability. There have been substantial studies on uncertain graphs. Potamias et al. [33] designed an algorithm for efficiently answering -nearest neighbor queries, and Liu et al. [21] presented a technique for reliable clustering. To the best of our knowledge, there is no work that uses the bridge detection technique to identify critical links under the probabilistic link disconnection model.
We addressed in [17] the contamination minimization problem in information diffusion that is closely related to the critical link detection in this paper. The aim of the problem is minimizing the spread of contamination via a network by blocking a small number of links. In this paper, we adopt the same idea in [17] and sample graphs from a given original network by deciding connectivity of each link according to the disconnection probability to estimate the expected number of nodes based on the reachability from/to a set of prespecified nodes. However, the difference is that we succeeded in substantially reducing the number of sampled graphs by computing the difference of reachability sizes for both connected and disconnected cases for each link, given a sampled graph, while the method in [17] requires much larger number of samples for each link as it computes the expected value of both when it is connected and disconnected.
Problem formulation
Let be a given simple undirected (or bidirectional) network without self-loops, where and are sets of nodes and undirected links, respectively. We also express each link as a pair of nodes, i.e., . In our problem setting, we assume a fixed group of nodes , called target nodes, such as people who serve as source nodes in information spread on a social network or evacuation facilities on a spatial network. Let be the set of reachable nodes by following links from a node over , where note that . Then, we can define a set of reachable nodes by following links from a node over , i.e., . Since is an undirected network, this definition of also means that a node can reach at least one of the target nodes by following links in . For example, the direction of the information flow on a social network is from (information source nodes) to (information receiver nodes), whereas the direction of the flow of people in the case of disaster evacuation is from (each point in a road network) to (evacuation facilities).
For each link , let be a random variable expressing the link connectivity, i.e., if the link is disconnected; otherwise , where we denote its disconnection probability by . As performed in studies on uncertain graphs, we introduce such probabilities that each link is accidentally missed and disfunctions in order to reflect the realistic situation. For example, in terms of information diffusion on a social network, those probabilities are assigned according to some link down model based on users’ network environments. In terms of disaster evacuation over a spatial network, they are assigned according to some road blockage model based on geographical properties. By using a set of random variables defined by , we can define a graph , where . Now, by assuming independent Bernoulli trials for all the links, we can compute the occurrence probability of each graph by
For each graph , let and be graphs constructed by adding and removing a link , respectively, i.e., and . Based on and , we define the following reachability contribution value of a link over .
Evidently, in order to obtain the expected reachability contribution value, we need to compute defined as
where means an expected value taken for all the possible assignments to random variables except for . Note that the expected value can be interpreted as the expected number of nodes that become unreachable from any of the prespecified target nodes when link is blocked under the condition that each link other than is blocked with its probability . In the case of information diffusion on a social network, represents the expected number of people who become unable to receive information issued by specific persons when an information path between two persons is down under the condition that each of the other paths becomes non-functional with the probability . Here we should emphasize that by introducing some weight for each node (which we set 1 uniformly for the sake of simplicity), we can straightforwardly extend our problem setting to ones that can take into account more realistic conditions. For example, we can find critical information paths for viral marketing over a social network under a more realistic condition if buying power of each person is given by its weight . In the case of evacuation planning, we can take into account population distribution in a city if is defined as population around the node (junction). Then, denotes the expected number of people who become unable to successfully move to any of the evacuation facilities when a road is blocked under the condition that each of the other roads is blocked with the probability .
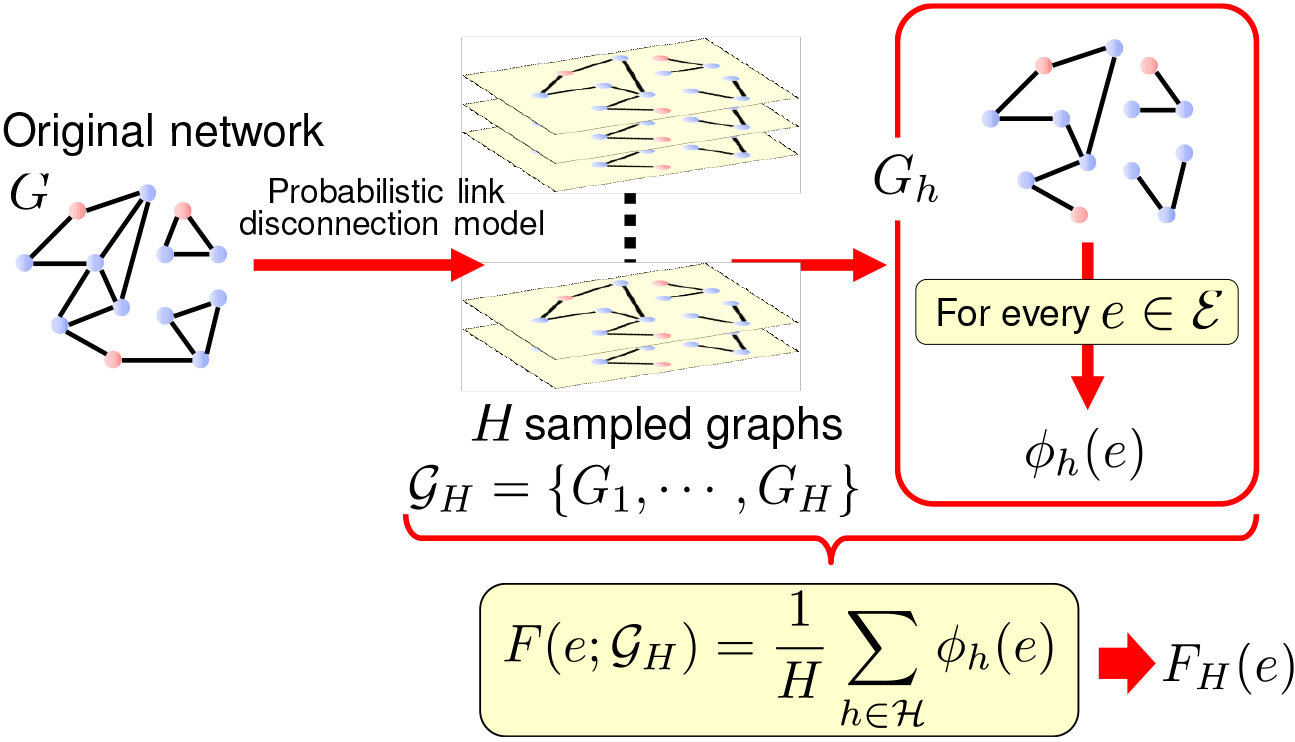
Evidently, it is difficult to exactly compute defined in Eq. (3) due to a large number of possible network configurations, which amounts to (possible worlds). Thus, we employ an approach based on Monte Carlo simulation. Let be a set of integers defined by . Now, we repeat simulations times based on the probabilistic model defined in Eq. (1), and sample a set of graphs i.e., , where is the set of non-disconnected links at the -th simulation. Then, by defining as follows:
where and , we can define the reachability contribution value of a link for as follows:
Intuitive illustration of the problem setting of computing the expectation of the contribution value of each node in an uncertain network.
Hereafter, we denote simply as because the set of generated graphs is fixed in our experiments. Figure 1 illustrates the overall process to compute . Evidently, is an unbiased estimator, i.e.,
Thus, when is a sufficiently large number, can be a close approximation to the expected reachability contribution value . In this paper, we refer to each contribution value as the Target-oriented latent link Criticalness Centrality (TCC for short) for a link , and focus on the problem of accurately and efficiently calculating for every .
Proposed method
To develop an effective algorithm for computing contribution value for every , we focus on the following two facts. For a generated graph , 1) each link has a positive contribution value, i.e., , if is a bridge in a connected component in , and only if one of the components which are separated after removing , does not contain any node ; 2) each link has a positive contribution value if connects two connected components in , and only if one of these components contains a node . Hereafter, the connected components each containing at least one node are referred to as DR (definitely reachable) components, while the other components as DU (definitely unreachable) components.
In order to compute all bridges of , we employ the idea of standard bridge detection algorithm originally proposed by Tarjan [41], which constructs a rooted depth-first tree for each connected component by traversing it from an arbitrary selected node in the depth-first manner, as described below. Here, we propose to select each target node i.e., as the starting node. If a connected component contains other target nodes, these nodes are skipped. Then, in order to examine whether a bridge has a positive contribution value or not, we only need to examine by the depth-first search that the descendant part of the component after removing is a DU component because its ascendant part is guaranteed to be a DR component.
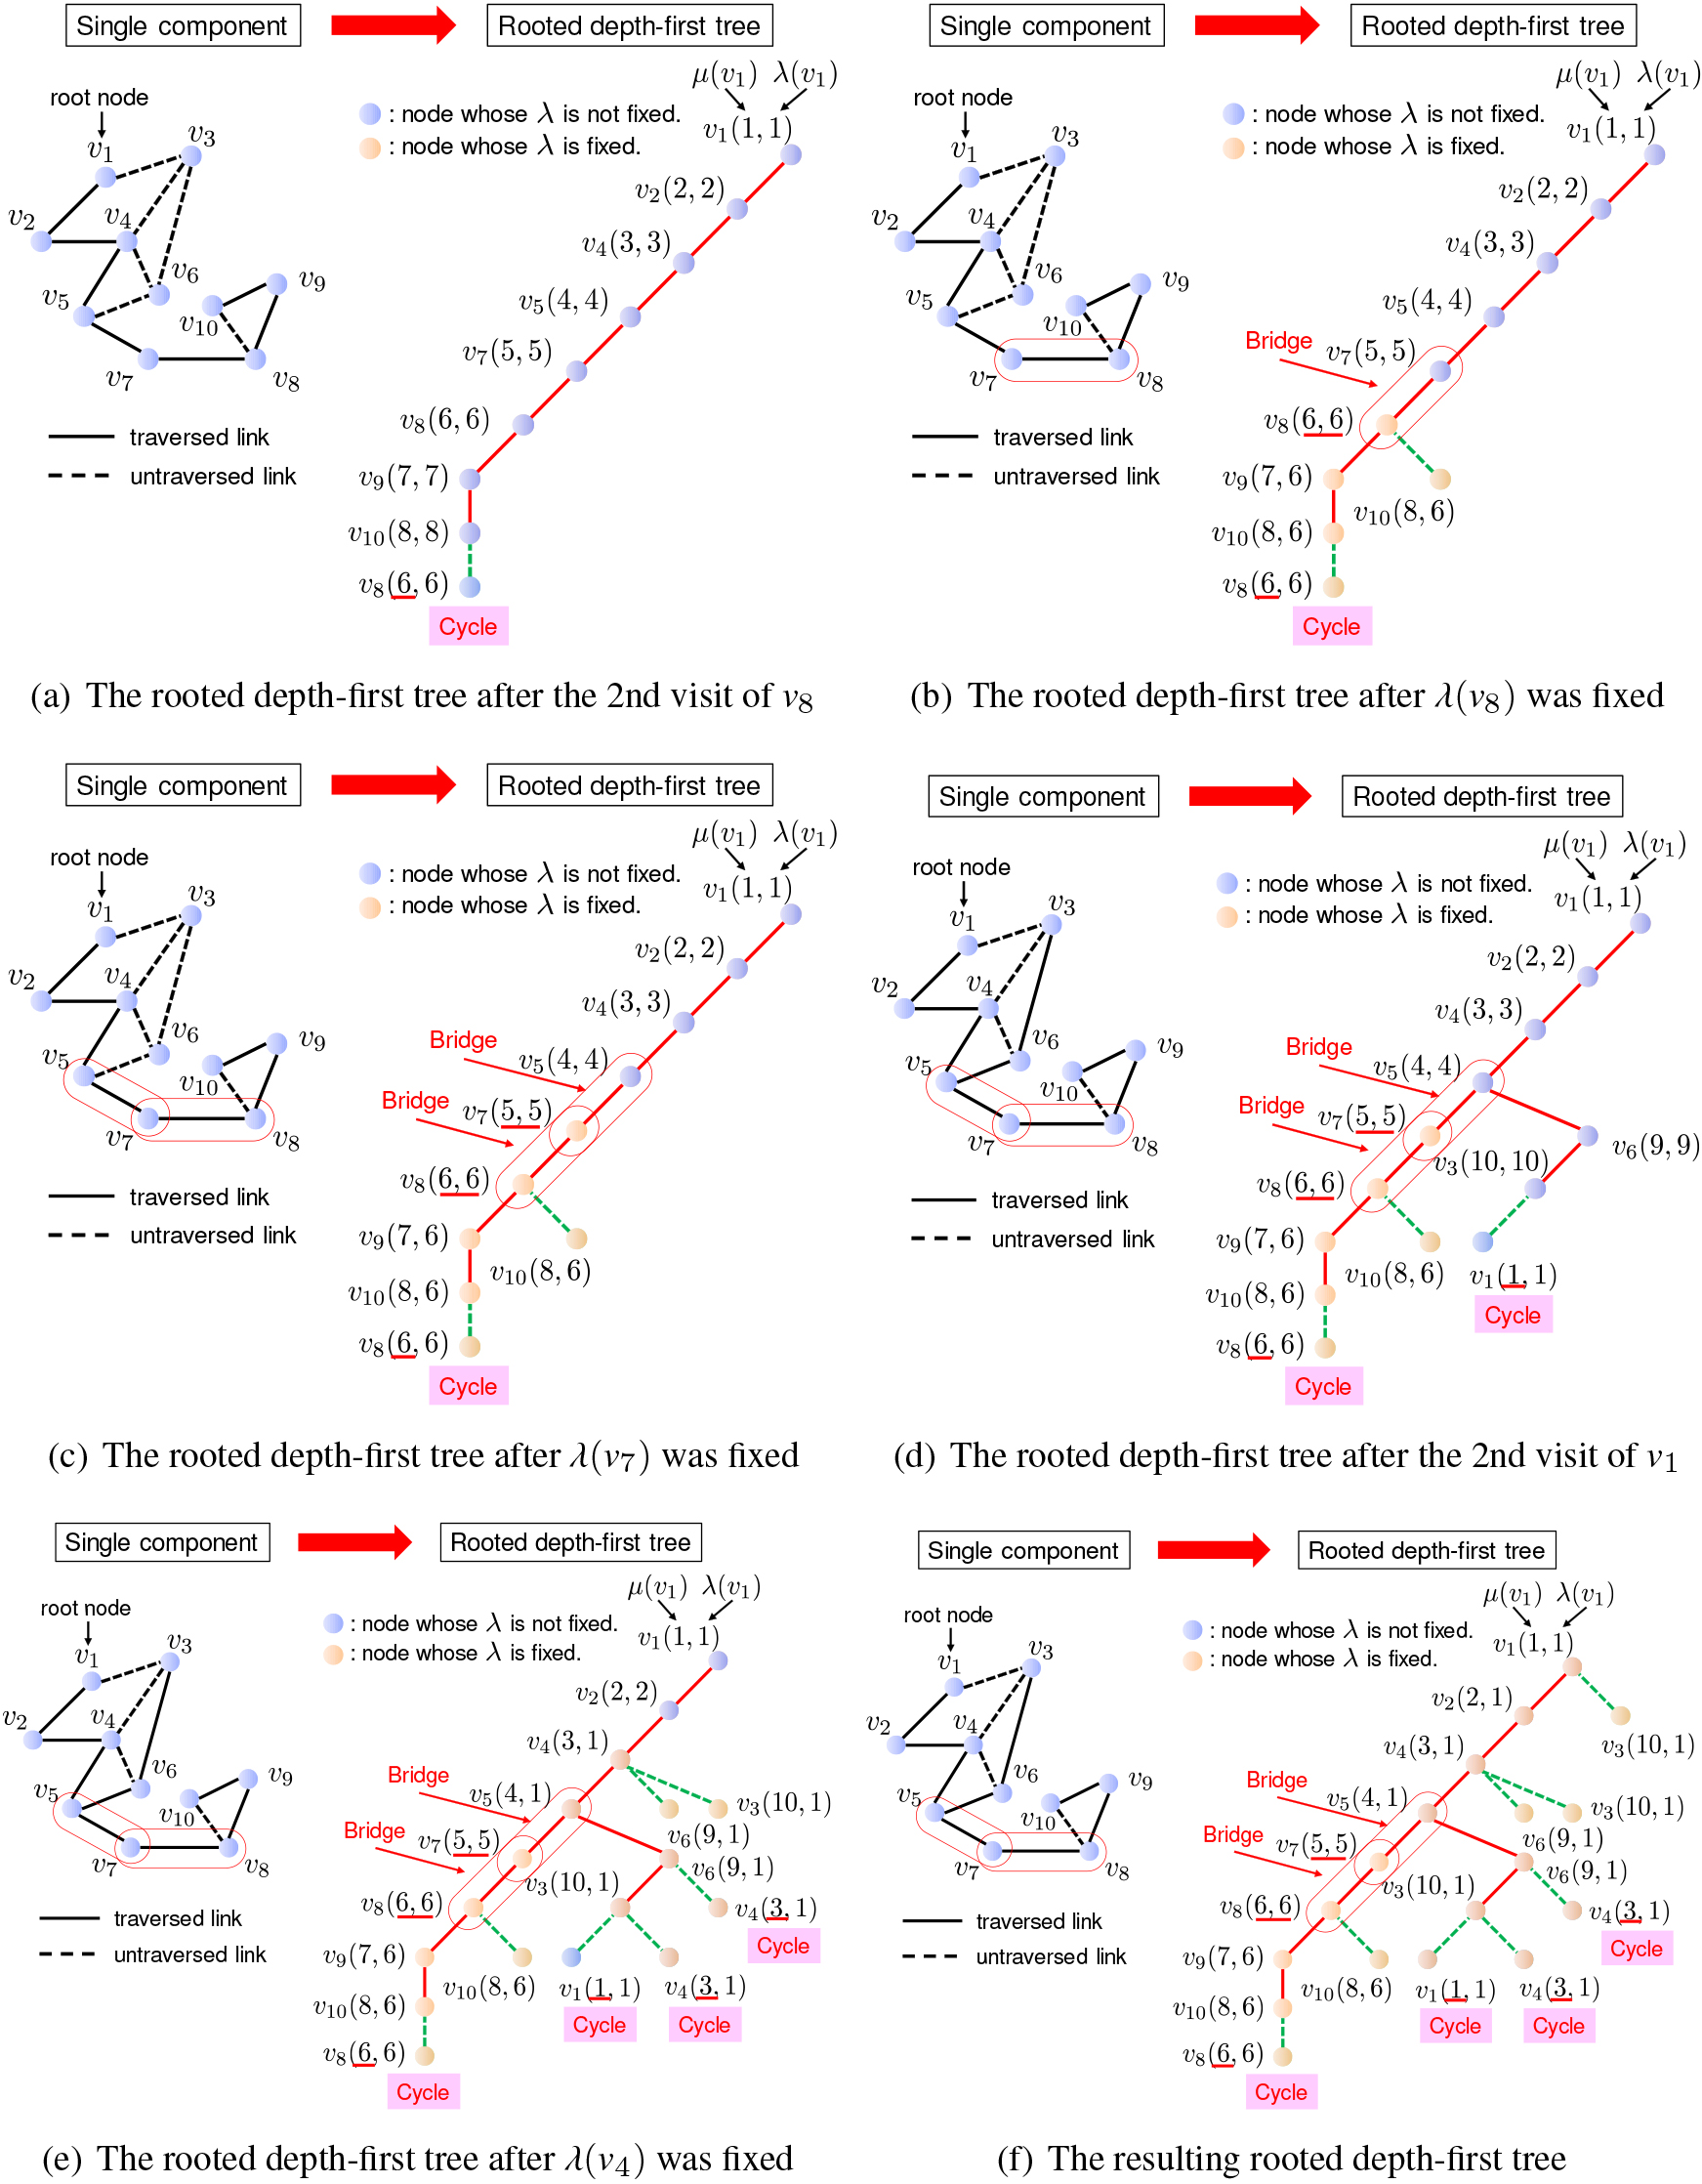
Here, we revisit the bridge detection algorithm. For a given connected graph , let be the order number assigned to each node during the depth-first search and be the minimum order number in a cycle that is detected during the search and contains node , just as used in the standard bridge detection algorithm, which yields if a link is a bridge. This means that any descendant node of cannot go to any ancestor nodes of without passing through the link . Formally, the algorithm is described as follows: after initializing for all and the ordering number as , we select an arbitrary node as a root and perform the following depth-first search procedure , where stands for an empty node and means that has no parent node. As for the depth-first search procedure , after setting , and , for every link such that , we recursively perform the depth-first search procedure if , and set if . By applying this algorithm, we can construct a network consisting only of links over which the depth first-search procedure is actually performed (traversed). Hereafter, we refer to this network as a rooted depth-first tree.
An example of constructing a rooted depth-first tree from a given single component.
For example, let us consider constructing a rooted depth-first tree from a single component shown in the left in Fig. 2a by traversing it from node in the leftmost manner, which results in the tree shown in the right in Fig. 2f. It is noted that although the order of traversing links of an undirected graph to visit all nodes it contains is not unique and there are multiple choices, all bridges in the graph can be identified correctly no matter which order we may choose. As shown in Fig. 2a, each node of the rooted depth-first tree is basically given its node name and a pair of values and . For example, for node stands for and . As mentioned previously, for every node , is initialized to , and, during the construction of the tree, it is updated to if holds for its adjacent node such that link exists in the component and is not the parent node of in the depth-first tree. For example, when visiting node first time by doing , is set to 8 as shown in Fig. 2a. has two adjacent nodes and , among which is its parent node in the depth-first tree. Thus, is a unique candidate to search at the next step. But, is and not , which means has already been visited and a cycle is detected. Therefore, without performing the depth-first search , we update to because holds. Then, as for node , after performing the depth-first search , we need to update to as shown in Fig. 2b because . Intuitively, when detecting a cycle during the depth-first search, the minimum value of in the cycle, 6 in this case, propagates from child node to its parent on the depth-first tree through the backtracking process of the search. In this example, after the backtrack, the values of and are fixed and never changed because they have no further adjacent nodes to visit. has another adjacent node , but we can find has already been visited because . Since has no further adjacent nodes to visit, we backtrack to node and fix . Then, we can detect the first bridge because of as shown in Fig. 2b. Similarly, after backtracking to node , we can detect the second bridge because as shown in Fig. 2c. After traversing nodes and , we can detect a cycle because we reach node and as shown in Fig. 2d. Similarly, while backtracking to node , two more cycles are detected, and , , , and are respectively updated from , , , and to as shown in Fig. 2e. propagates to the parent node of , i.e., , and eventually, we can obtain the rooted depth-first tree shown in Fig. 2f.
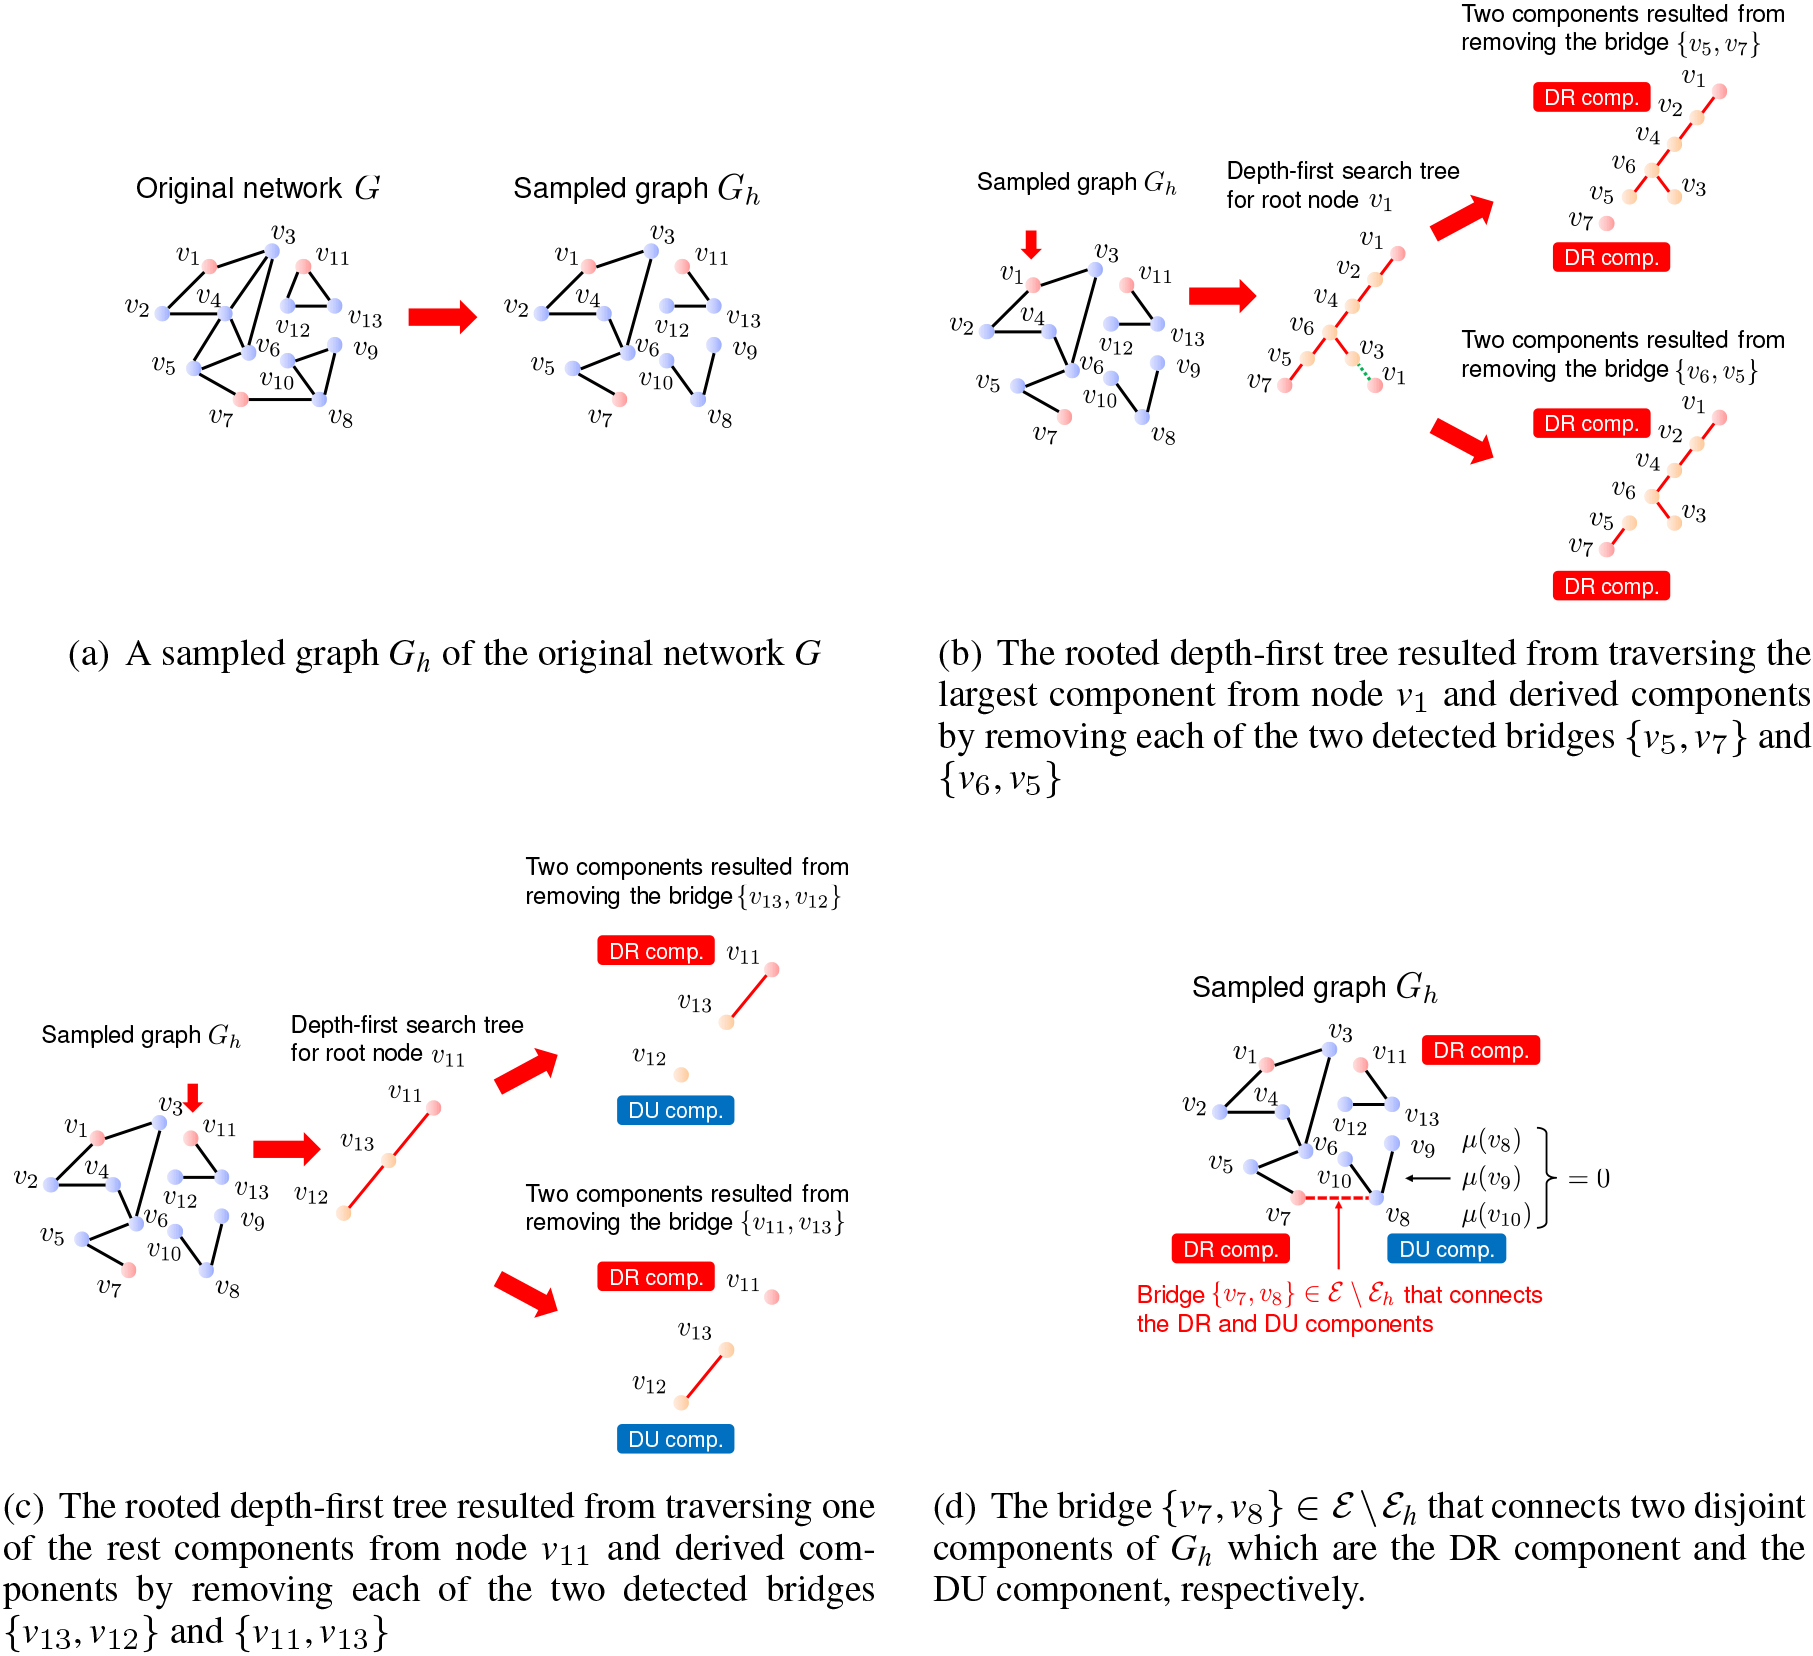
An illustration to explain how bridges can be used to compute the reachability contribution value .
Further, let be the induced connected component from descendant nodes of in the rooted depth-first tree obtained by the depth-first search. Also, let be the connected component containing node . Here, we denote the numbers of nodes in and by and , respectively. Then, if a bridge is detected and and are DR and DU components, respectively, in the rooted depth-first tree that is resulted from a sampled graph for , we can add to the contribution value of , i.e., , because no node in can reach any node if is removed from . For example, suppose the sampled graph shown in the right in Fig. 3a is given in which , , and are the prespecified target nodes and there exist three disjoint components. Then, by traversing it from node in the depth-first manner, we can obtain the rooted depth-first tree shown in the middle in Fig. 3b and detect two bridges and . Removing each bridge from yields two disjoint components as shown in the right in Fig. 3b, but we cannot update the contribution value of these bridge links because both of the resulting components contain one of the target nodes, i.e., all of them are a DR component. Similarly, we can obtain the rooted depth-first tree shown in the middle in Fig. 3c and detect two bridges and by traversing from node in the depth-first manner. In this case, since by removing each of them and become a DU component as shown in the right in Fig. 3c, we can add to and to according to each case.
While the above update of the reachability contribution value is based on the fact 1) mentioned at the beginning of this section, based on the aforementioned fact 2), if a link is a bridge that connects two disjoint components and in the sampled graph and only either one of them is a DU component, then we can add to if is a DU component, and vice versa. For example, consider the sampled graph in Fig. 3 again. After traversing it starting from nodes and , we can detect the last component that is a DU component by traversing from one of the rest nodes, , , and . Then, we can find that link is a bridge that connects two disjoint components and as shown in Fig. 3d. Since is a DR component and is a DU component, we can add to , the contribution value of the bridge link .
We summarize our proposed algorithm as Algorithm 3. Note that at Step 9 means that is not traversed during the depth-first search at Step 4 to compute DR components and that is not reachable from any node . Thus, we can compute a DU component by finding the whole set of reachable nodes from an arbitrary node satisfying through the depth-first search at Step 9. Evidently, for a given , the computational complexity of the steps 3 to 13 is which is the same as the standard bridge detection algorithm. Thus, the total computational complexity of our algorithm becomes . Hereafter, we refer to our proposed algorithm described above as the TCC method.
[t] Proposed algorithm[1] A set of graph samples, . The set of reachability contribution values for , . Initialize contribution value as for every . Initialize the original number as for each node. Compute DR components by repeatedly doing the depth-first search from a node s.t. after setting , , , and . link obtained during the depth-first search Compute , and by the depth-first search. Update as if the link is a bridge, i.e., , and is a DU component. Compute DU components by repeatedly doing the depth-first search starting from nodes s.t. and after setting , , and compute for in DU components. link Update as if and are DR and DU components, in this order. Update as if and are DU and DR components, in this order. after setting for every .
Experiments
We evaluated the effectiveness of the proposed method and the generality of the results using two real networks.
Experimental settings
The networks we used are from two different domains, one from social and the other from spatial domains. The former is Enron network derived from the Enron Email Dataset [18]. Each node represents a distinct email address and two nodes are connected if and only if there are bidirectional communications. The resulting network has 4,254 nodes and 22,157 links. The latter is Road network of Washington D.C., which is constructed from OSM (OpenStreetMap) data obtained from Metro Extracts1
https://mapzen.com/data/metro-extracts.
in August, 2015 [22]. The resulting network has 114,758 nodes and 128,746 links. The average degree of a node, i.e., the average number of links incident to a node, is 10.42 for Enron network, and 2.2 for Road network, while the maximum degree is 384 for Enron network, and 8 for Road network. Enron network is much denser than Road network as can be expected. We decided to set for every , since the main purpose of this work is to evaluate the fundamental performance of the proposed method. Thus, is the unique parameter for controlling the disconnection probability. Here we should emphasize that this uniform setting has been widely employed in many previous studies in the filed of information diffusion over social networks [5, 15].
We compare the proposed TCC measure with the extended version of the conventional link betweenness centrality measure by taking into account the target nodes, , which is referred to as TBC (Target-oriented link Betweenness Centrality). Namely, TBC is defined by
for a link , where is provided by
Here, indicates the set of nodes such that is the closest node from node in in terms of a distance function over network , denotes the number of the shortest paths from node to node , and denotes the number of those paths passing through a link . In addition, we also compare the TCC measure with a variant without considering target nodes, which is referred to as CC (link Criticalness Centrality) given by the following equation:
Here note that CC can be regarded as the link centrality version of the node centrality proposed by Ohara et al. [24] called LCC (Latent node Criticalness Centrality).
Assigning target nodes needs problem specific information, e.g., location of emergency hospitals in case of ambulance call for a road network. In our experiments we artificially assigned target nodes by use of notion of medoid and changed the number by specifying the rate to the total number of nodes . Here, medoid is a center node in a cluster. In our problem setting it is a node that is closest to the rest of the nodes, i.e., the sum of the shortest path to the rest of the nodes is minimum. For multiple number of medoid, each node has its own medoid to which the shortest path is minimum. To be more precise, the number of target nodes is set to the nearest integer of . We also assigned target nodes randomly with the same parameter for comparison purpose. We employed a greedy algorithm to assign a set of medoid target nodes, i.e., the best node in terms of the medoid criterion is repeatedly selected by fixing the already assigned nodes until the number of selected nodes reaches the number of target nodes. We notice that the medoid criterion satisfies the submodular property, i.e., marginal loss of sum of the shortest path from each node to its own medoid over all nodes monotonically decrease as the number of target nodes increases, thus the minimum performance of the greedy algorithm is guaranteed. In our experiments, we set the rate as and denote the experimental results with medoid and random target nodes as m002, r002, m05, and r05, respectively.
Experimental results
First, we evaluated the computational efficiency of the proposed TCC method by comparing it with the straightforward extended versions of conventional node centrality measures, i.e., degree, and PageRank centralities, and a conventional link centrality measure, i.e., link betweenness centrality, in our uncertain network framework. First, we extend degree centrality and define node centrality measure DC by
for a node , where indicates the degree of a node in . Second, we define node centrality measure PRC from PageRank centrality by
for a node , where is the PageRank score of a node in and is given by the PageRank algorithm with random jump factor 0.15. Third, we extend betweenness centrality and define link centrality measure BC by
for a link , where is the betweenness of a link in and is given by
Here, and also denote the number of the shortest paths from node to node and the number of those paths passing through a link , respectively. The former two are node centralities and not link centralities, but the purpose is to compare the computational efficiency and no precise definition is needed here.
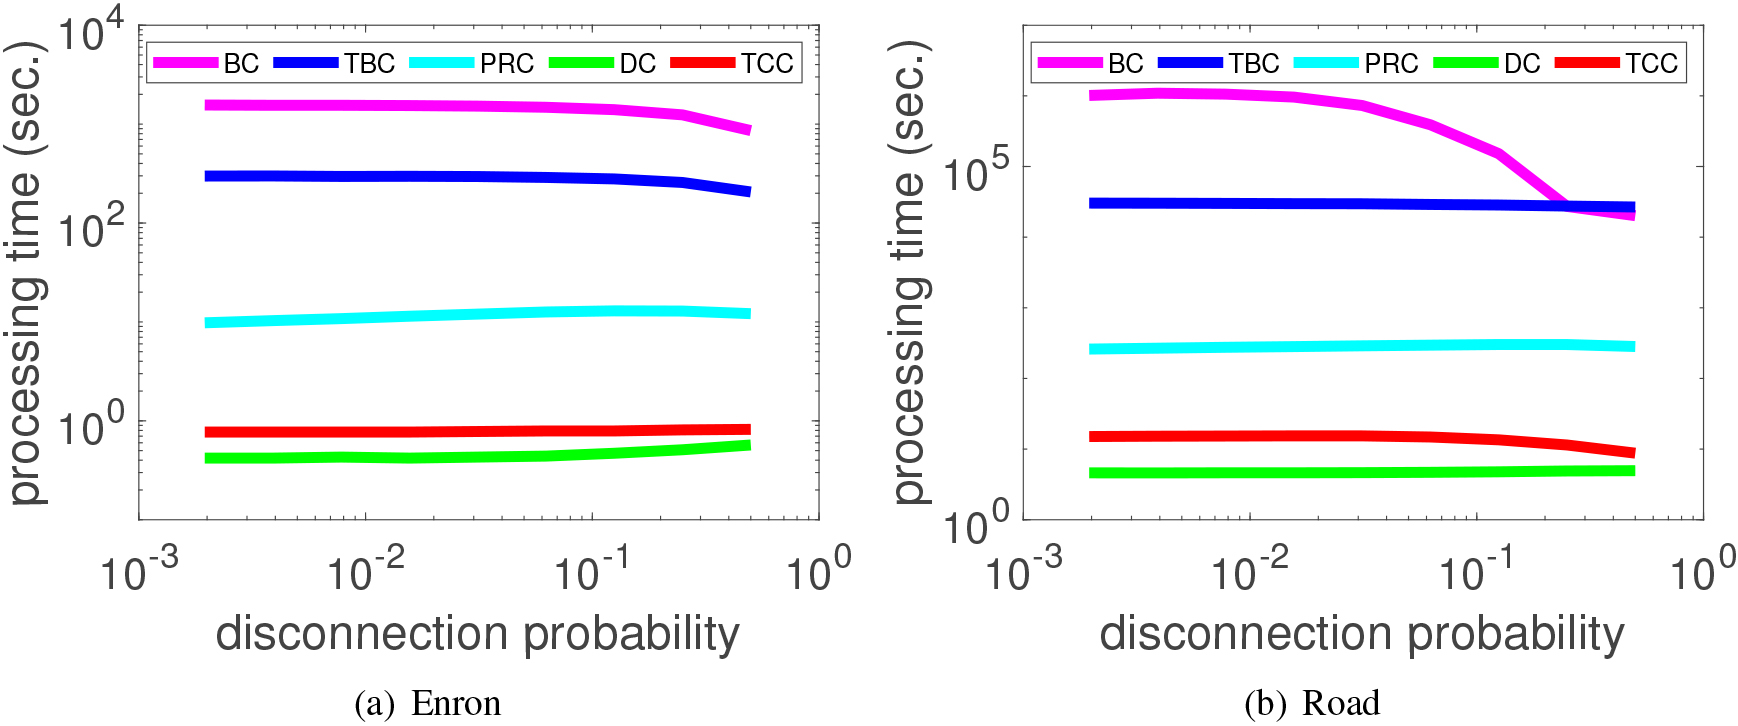
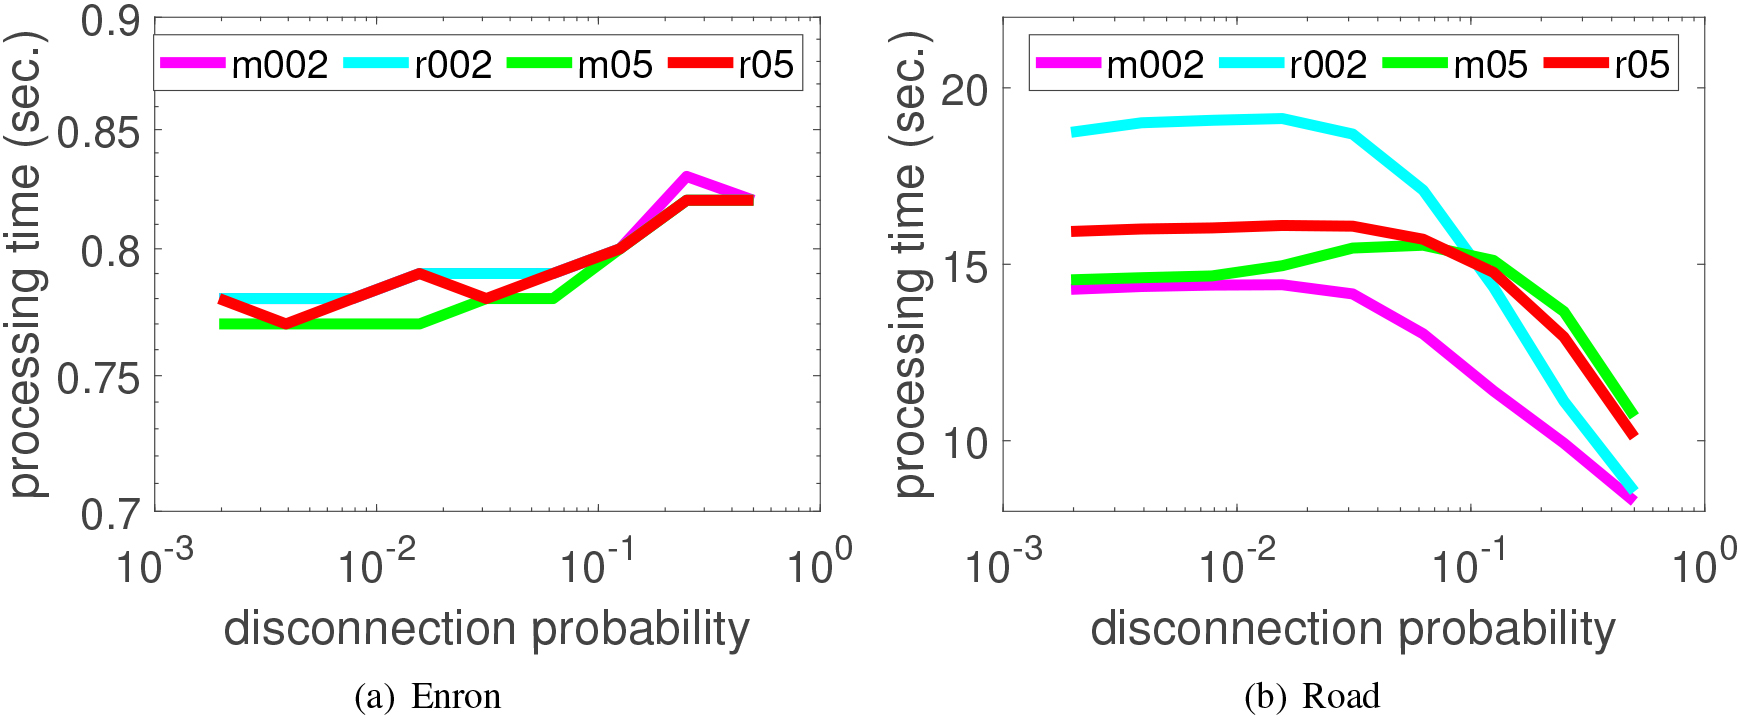
Comparison of processing time with the representative centrality measures as a function of the link disconnection probability. TCC and TBC are for r002.
Comparison of processing time with different target node settings as a function of the link disconnection probability.
We compared the processing time of the proposed TCC with those of BC, PRC and DC to compute the centralities for with a setting . We set the disconnection probability to for every link and varied the integer from 1 to 9, leading to the range of , . Figure 4 shows the experimental results,2
Our programs are written in C, and run on a computer with Xeon X5690 3.47 GHz CPUs using a single thread within a 192 GB main memory capacity.
where TBC and TCC are computed for r002. Figures 4a and b are the results for the Enron and Road networks, respectively. From Fig. 4, it can be observed that these two networks with different configuration and size exhibit quite similar tendency. The processing times for computing TCC are substantially smaller than those for , and PRC although they are roughly twice as large as those for DC, most efficiently computable one. BC is most expensive because its computational complexity approximately becomes a square order of the network size. TBC becomes substantially faster than BC due to the restricted target nodes . PRC needs power-iterations for solving the eigenvector equation. It is noted that the processing times for BC are likely to decrease when the disconnection probability becomes large, especially for the Road network. This is because the number of disconnected node pairs increases for a large . From these results, we can claim that our proposed TCC method has a good scalable property with respect to the size and the configuration of networks.
Next, we evaluated the computational efficiency of the proposed TCC method by changing target nodes settings. Figure 5 shows the experimental results, where we show the results of the settings of m002, r002, m05, and r05. Figures 5a and b are the results for the Enron and Road networks, as before. From Fig. 5, it can be observed that the processing times of the proposed TCC method are quite comparable for different target-nodes settings, especially for the Enron network. This indicates that TCC method is computationally efficient regardless of the target-nodes settings. Note that in case of the Road network, as shown in Fig. 5b, the processing times are likely to decrease when the disconnection probability becomes large because of the same reason above (the number of disconnected node pairs increases for a large ), which is similar to the experimental result shown in Fig. 4b.
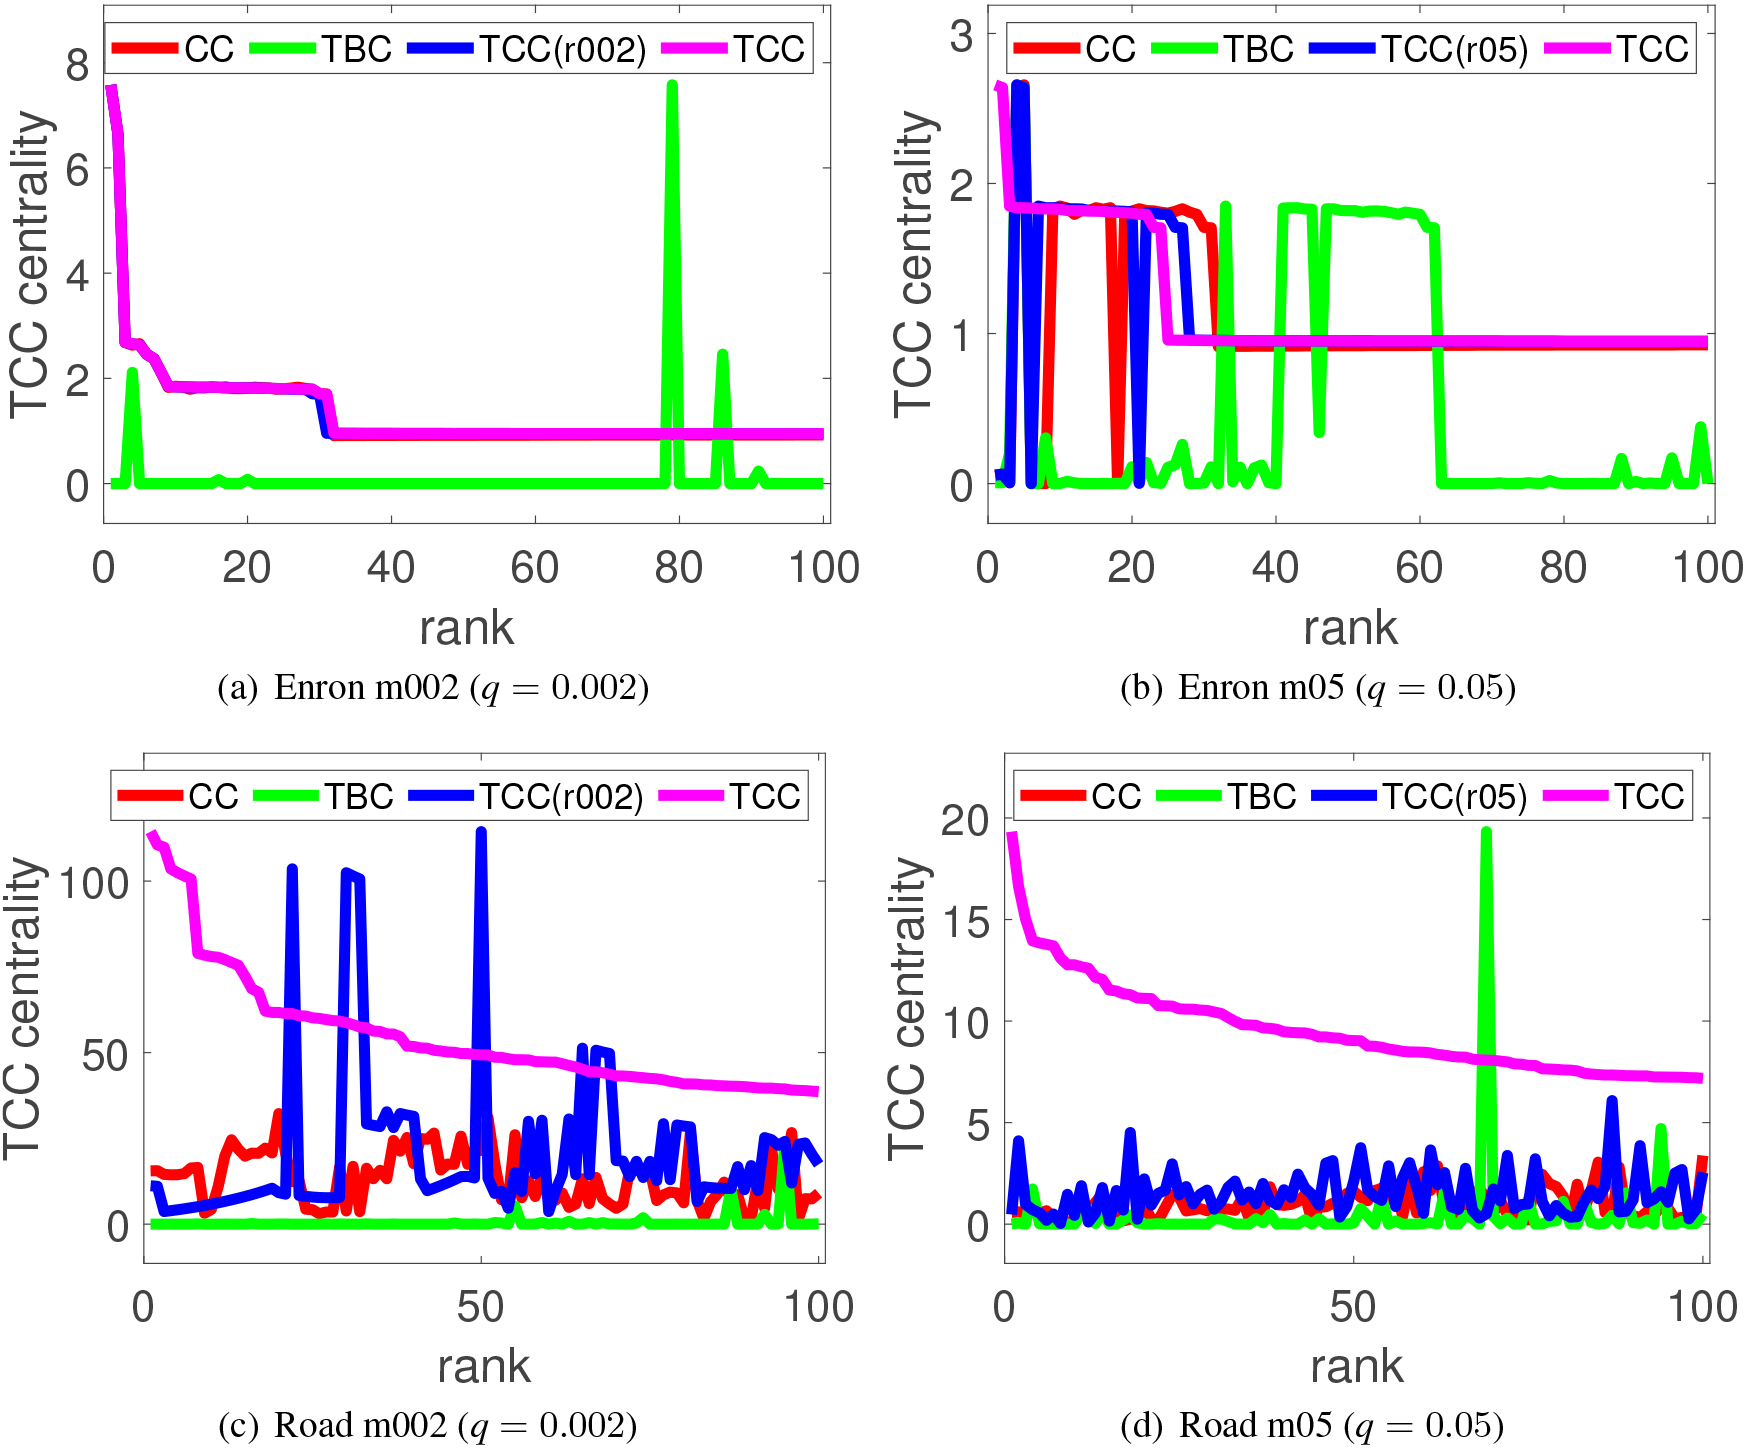
TCC value of the top-100 links obtained by each centrality measure for two different medoid target rates ( 0.002 and 0.05) under a link disconnection probability ().
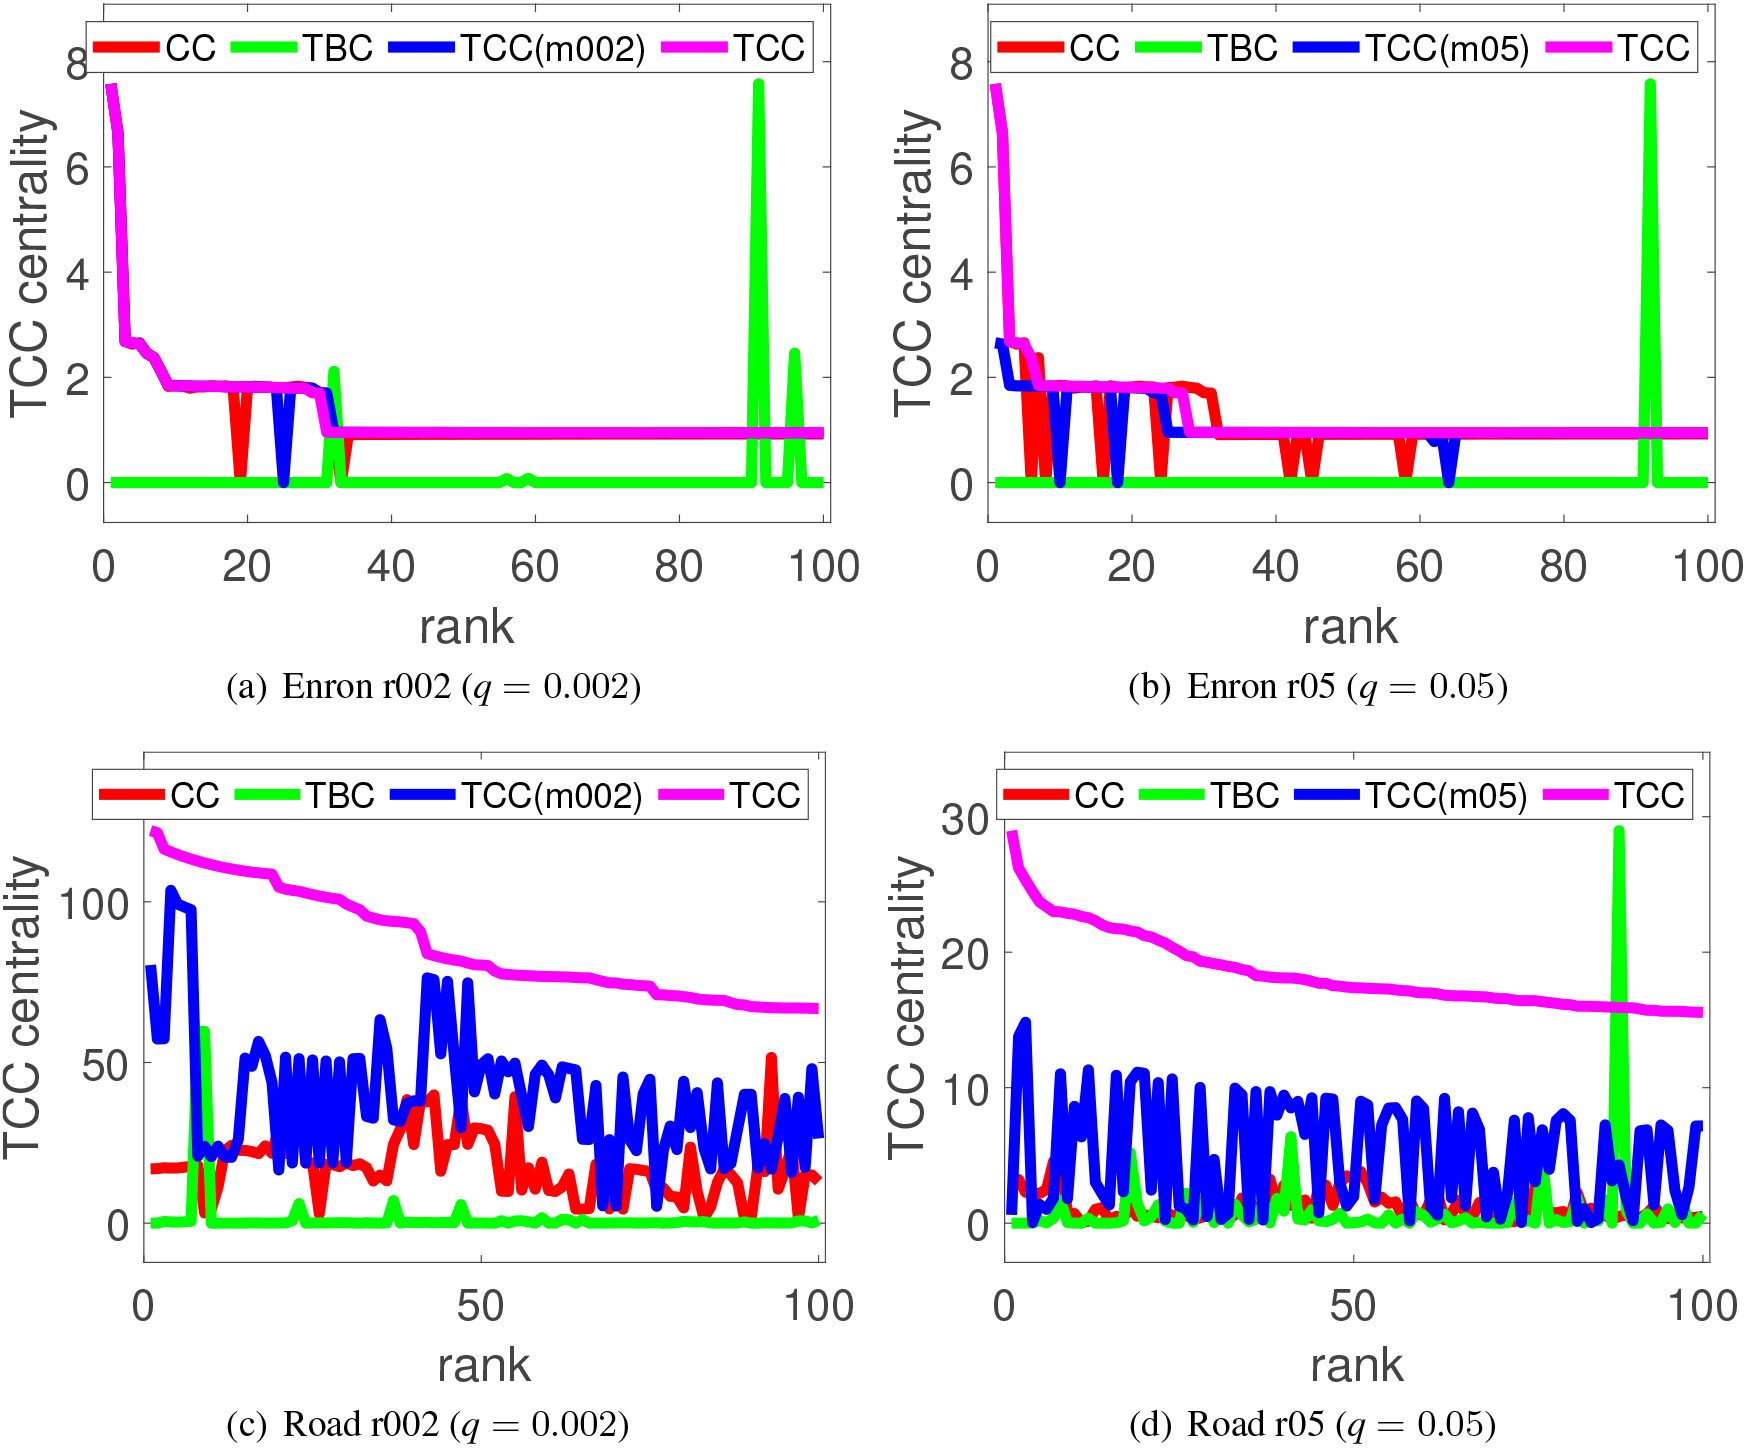
TCC value of the top-100 links identified by each centrality measure for two different random target rates ( 0.002 and 0.05) under a link disconnection probability ().
We further examined the performances of highly ranked links that are identified by the other link centralities, i.e., CC and TBC, in case of the disconnection probability for the two networks. TCC values were computed for both medoid and random target settings of the same size. More specifically, let be one of m002, r002, m05, r05, and be TCC(S) value, i.e., . We then evaluated the performance defined by for each , where denotes one of and stands for the link with the -th rank in each centrality measure . The results for the other disconnection probabilities are quite similar. Thus, we report the results for .
Figure 6 shows the experimental results for the medoid target node setting, where the horizontal and vertical axes denote the ranking of links up to top- and the performance evaluated in the measure, respectively. The pairs of Figs 6a–d are the results for the Enron and Road networks, respectively. Note that CC does not need target node information. CC and TCC(r002) are hidden underneath TCC almost completely in Fig. 6a, and CC and TCC(r05) partly in Fig. 6b. Figure 7 is the results for the random target node settings, where the pairs of Figs 7a–d are the results for the Enron and Road networks, respectively. Like in the medoid target node setting, CC and TCC(m002) are hidden mostly underneath TCC in Fig. 7a, and CC and TCC(m05) partly in Fig. 7b.
Following observation can be made from these results. Performance behaviors and the degree of their differences are different for different networks and for different target node settings as well as for different link centralities. The difference between TCC and others is much clearer for Road network than Enron network in both target node settings. No other centralities can replace the proposed TCC and the location of the target nodes does matter. To our surprise TBC is not a good measure. We conjecture that the links that appear on the shortest paths do not happen to be the links needed to maintain connectivity on these networks. In Enron network the location of the target nodes does not seem to matter when the size is very small. However, later we show the precision of the top ranked links and see that overlaps of the curves in Figs 6a and b, 7a and b do not necessarily mean that the performance is similar, i.e., the locations of critical links are the same. Putting all the observations together, we can conclude that the performances of highly ranked links strongly depend on the networks and the target node settings, and less strongly on the target node size for some network. In short, TCC measure with a given target node setting has unique properties and no other centrality measure can replace the proposed TCC measure. It is difficult to identify links having high TCC values by means of conventional centrality measures.
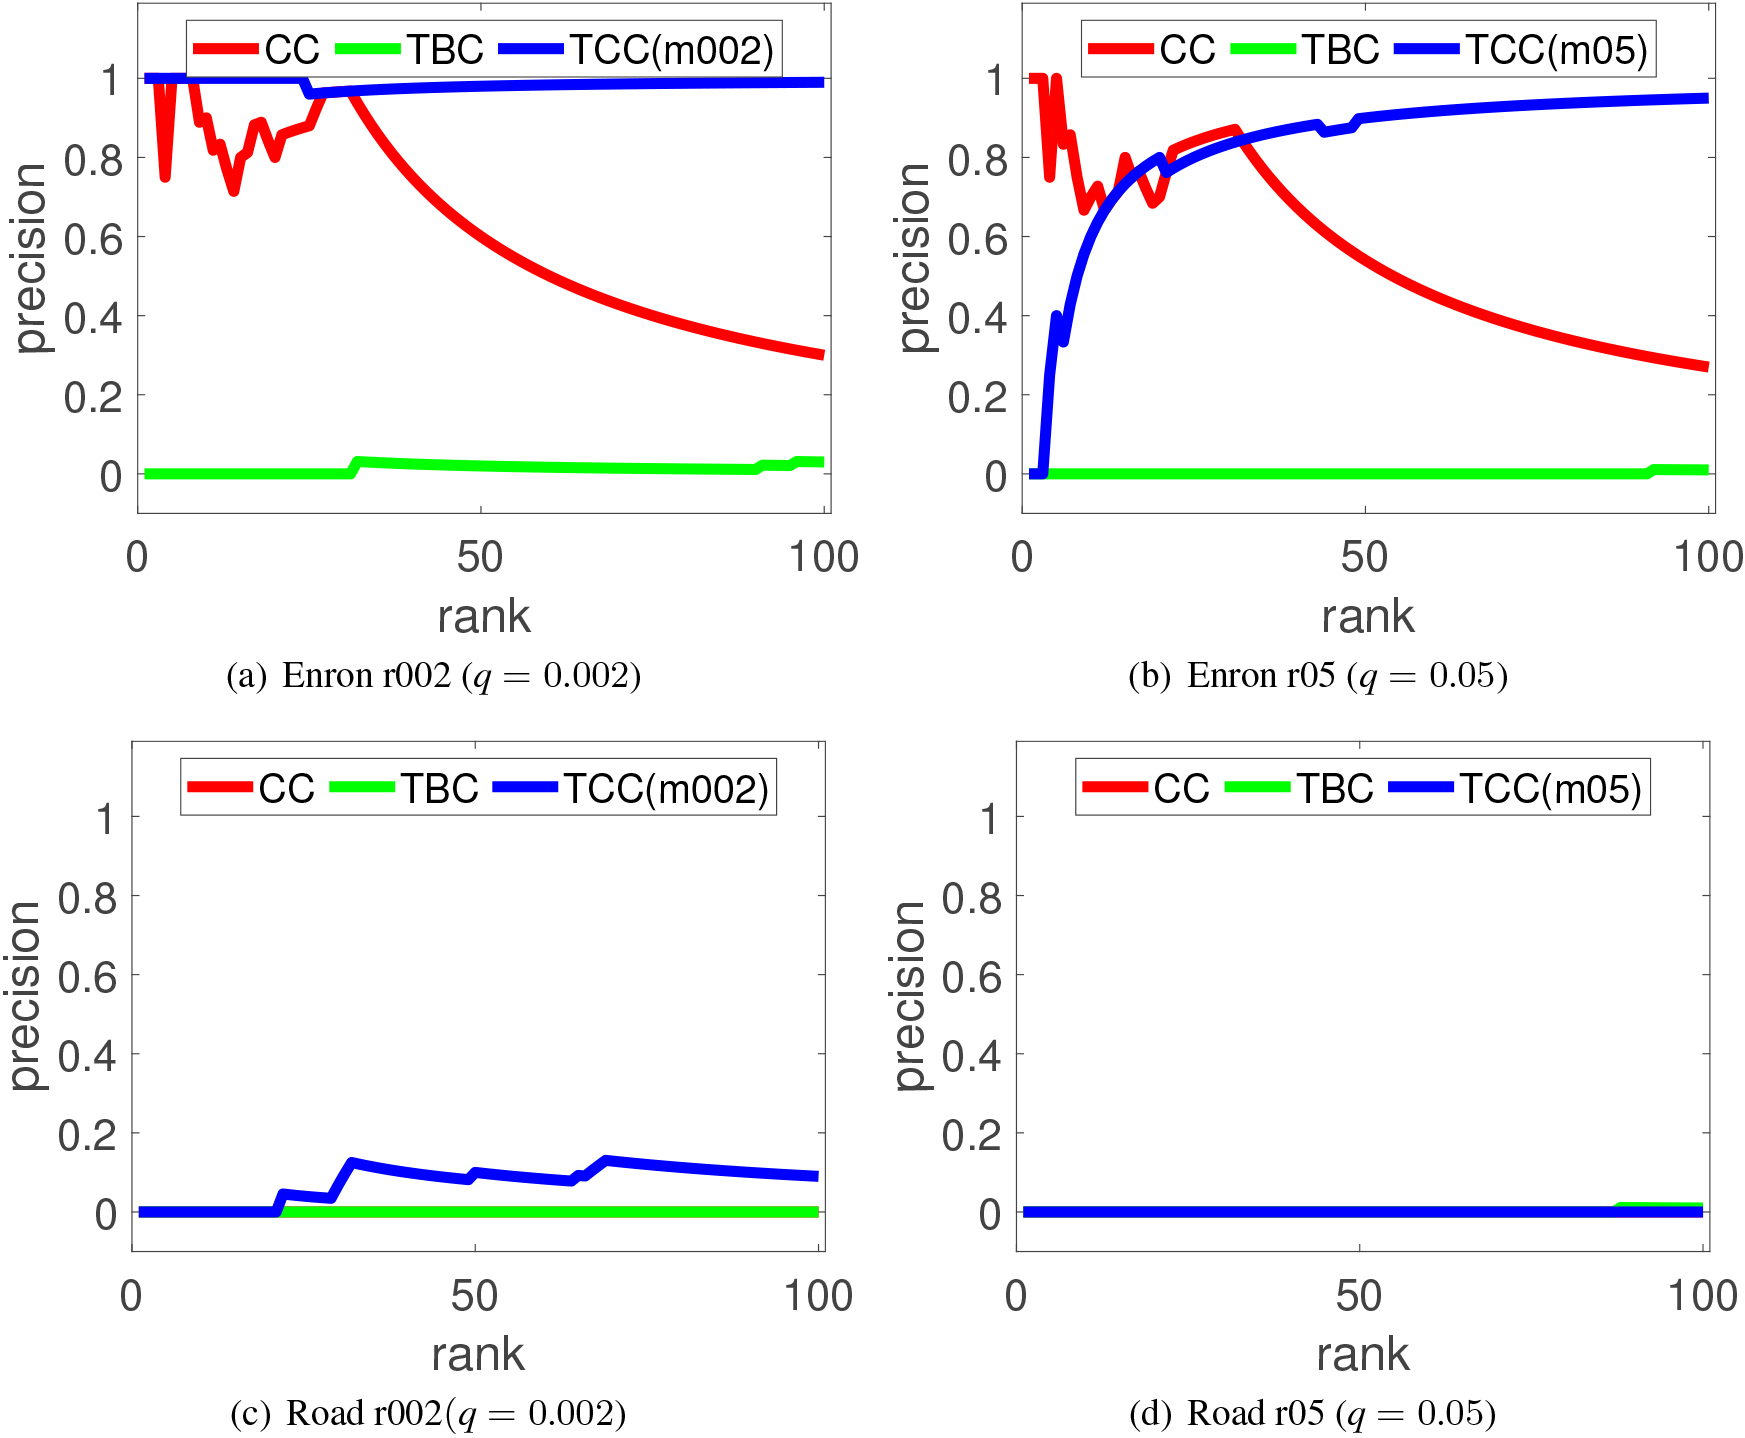
Precision comparison in the top-100 links obtained by each centrality measure for different medoid target rates ( 0.00 and 0.05) under a link disconnection probability ().
Precision comparison in the top-100 links obtained by each centrality measure for different random target rates ( 0.002 and 0.05) under a link disconnection probability ().
Next, in order to more closely examine our experimental results, we further investigated the similarity between the ranking results obtained by TCC(S) measure and those by CC, TBC and TCC(S’) measures in case of the disconnection probability for the two networks. These correspond to Figs 6 and 7. Again, it should be noted that we obtained quite similar experimental results for the other disconnection probabilities. We measured the similarity between the top links for the ranking based on TCC(S), denoted by , and those for the ranking based on the other link centralities, CC, TBC, and TCC(S’), denoted by , by using the precision Prec(k) defined as follows:
where and stand for one of , and one of m002, r002, m05, r05 , respectively.
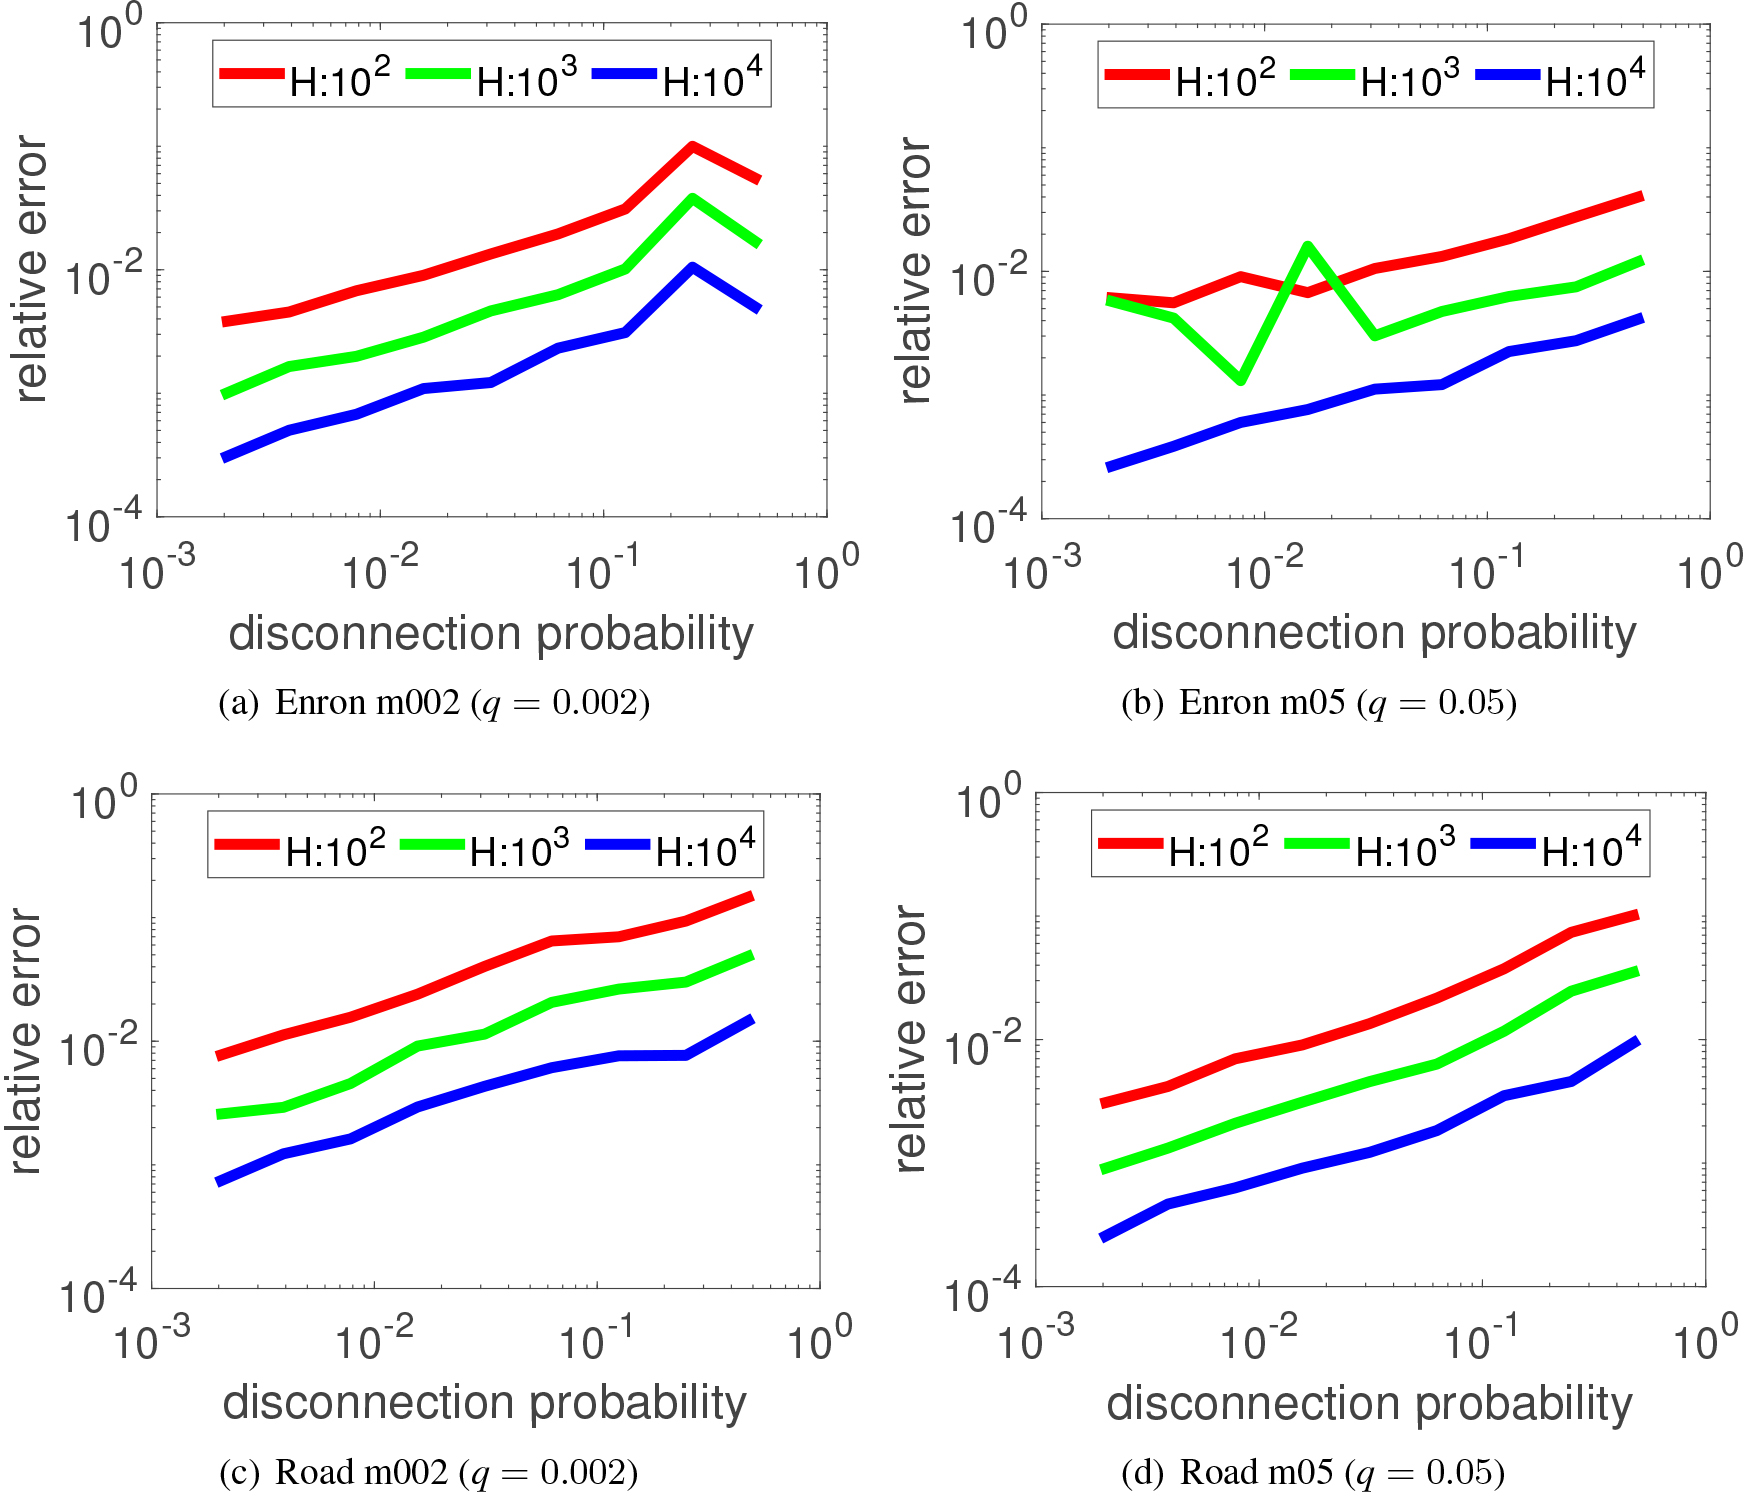
Fluctuation of the relative error of TCC values as a function of the link disconnection probability for different number of simulations for two different medoid target rates ( 0.002 and 0.05).
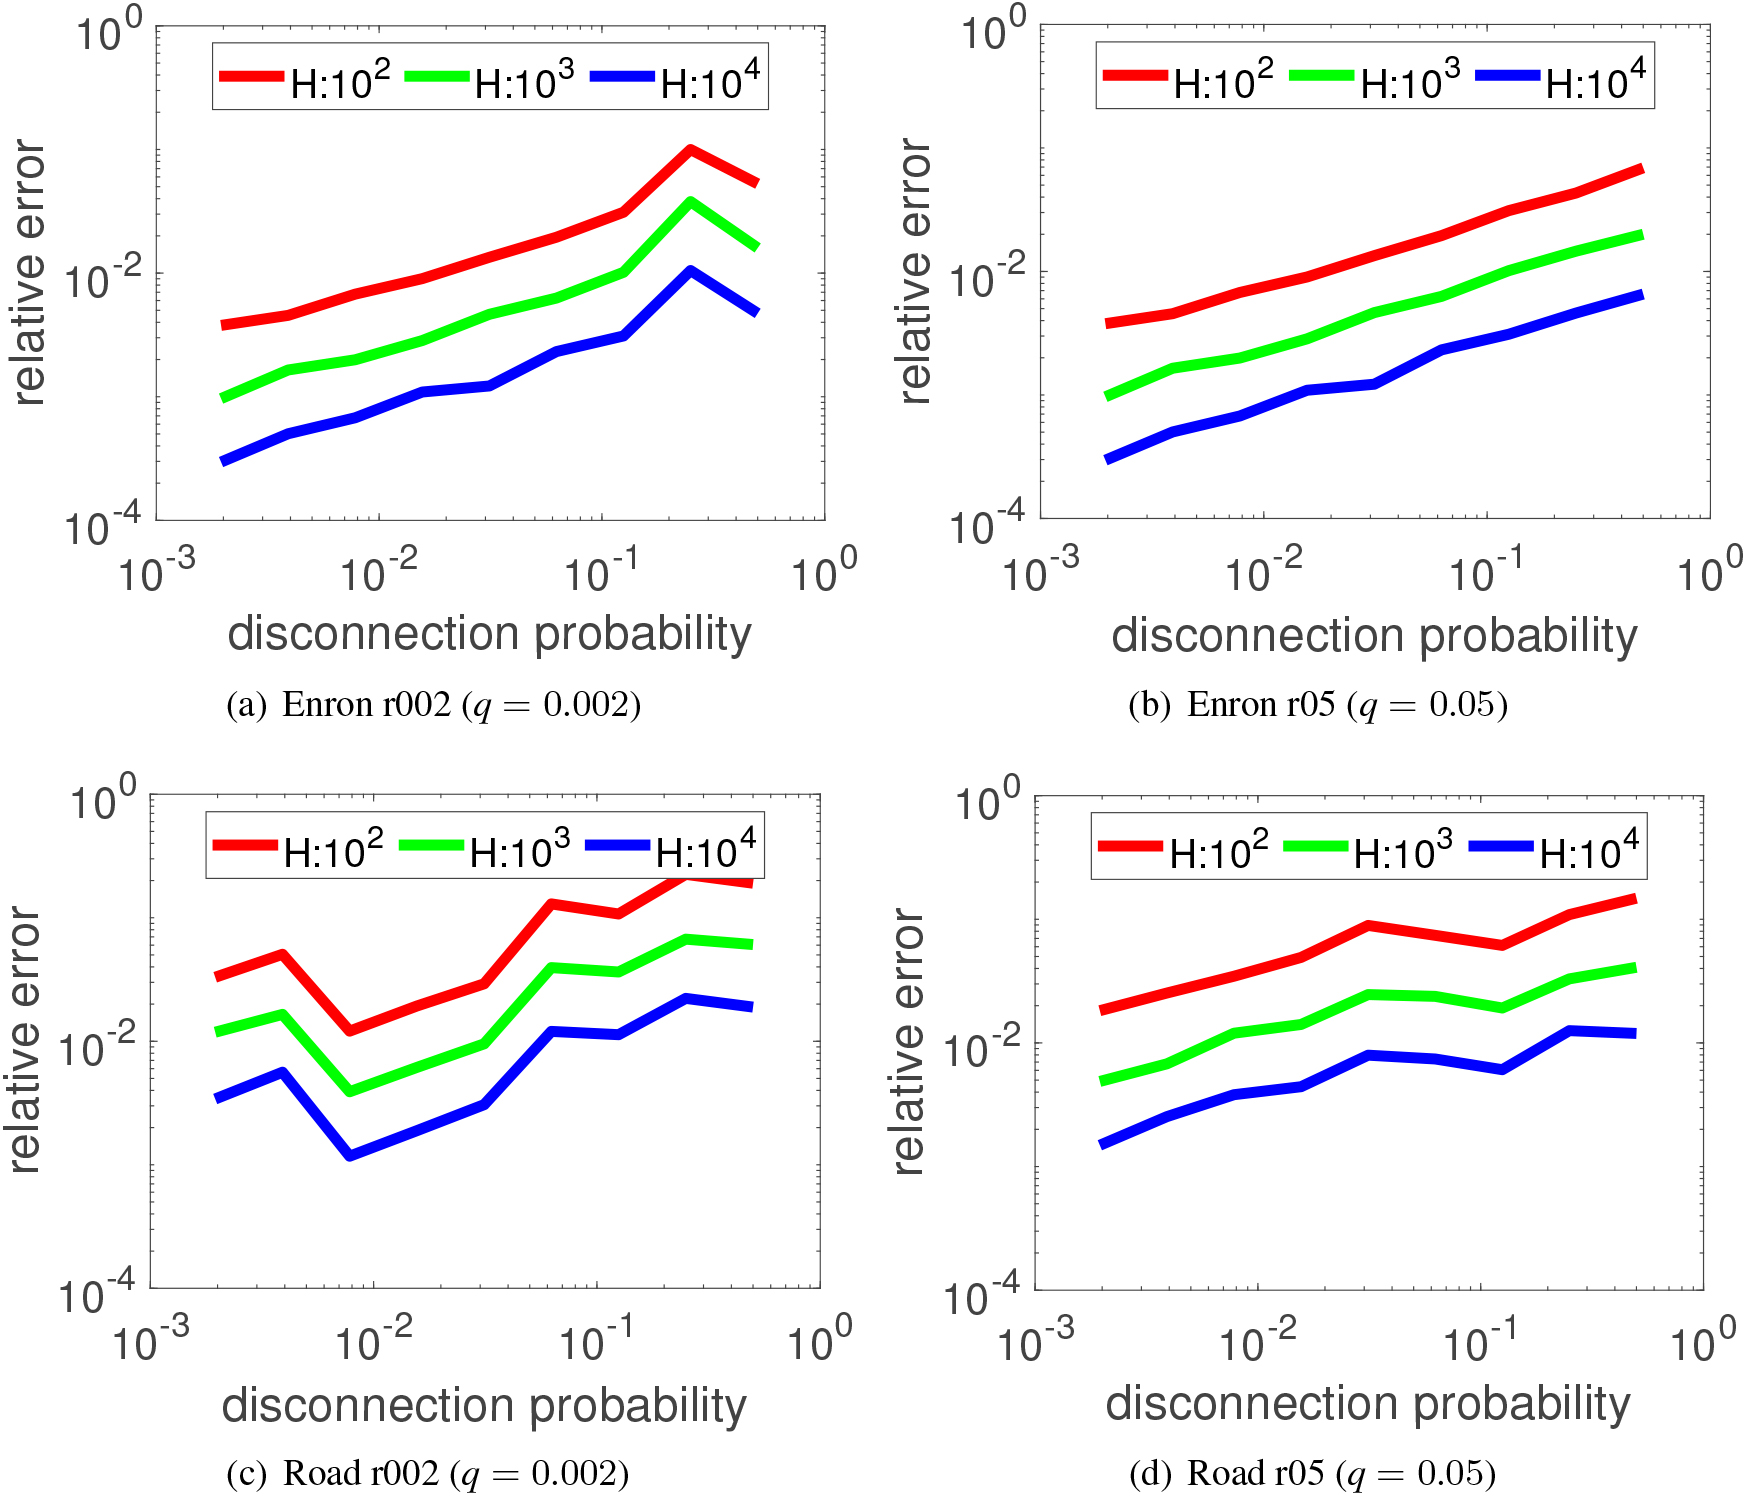
Fluctuation of the relative error of TCC values as a function of the link disconnection probability for different number of simulations for two different random target rates ( 0.002 and 0.05).
Figure 8 shows the experimental results for the medoid target node settings, where the horizontal and vertical axes denote the rank up to top- and the precision Prec(k), respectively. Again, the pairs of Figs 8a–d are the results for the Enron and Road networks, respectively. Figure 9 shows the results for the random target node settings in the same format. As before, some curves are hidden because of the overlaps with the other curves. CC in Figs 8c and 9c are hidden beneath TBC.
From these figures, we can also see that the experimental results basically coincide with those shown in Figs 6 and 7. TBC is the worst among all. One notable difference is that the precision scores of CC are substantially poor in comparison to those of TCC(r002) in Fig. 9a, TCC(r05) in Fig. 8a, TCC(m002) in Fig. 8b and TCC(m05) in Fig. 9a, especially for the ranks from top-50 to top-100. This is because the slight difference of TCC values by CC method results in different links as critical ones. In short, our results confirm that measure is not useful at all for finding links having high TCC values. CC may be helpful to some degree but it heavily depends on network configuration. When the size of the target nodes is small, TCC does not require correct locations, but this again heavily depends on network configuration.
Finally, we evaluated the approximation accuracy by changing . More specifically, we computed the TCC value, , for each link by setting 1,000,000, and regarded them as the ground truth by setting . Then, we repeated 100 times for a fixed , i.e., , each of which is obtained by a series of independent Bernoulli trials for , and evaluated them in terms of the relative error defined by
Figure 10 shows the experimental results of the top-1 link according to for each probability setting of for the medoid target node settings. Again, the pairs of Figs 10a–d are the results for the Enron and Road networks, respectively. Figure 11 shows the results for the random target node settings in the same format. From these figures, we can see that the experimental results for the case of 0.002 are relatively more stable than those of 0.05, where the numbers of target nodes for the former settings are substantially smaller than those for the latter settings. Moreover, we can see that the relative errors are less than 10% for any disconnection probability even for for Enron network and for Road network with the setting m05, and for the Road network with the setting r002. In short, these experimental results suggest that we can stably compute our TCC centrality without sampling very many graphs.
Conclusion
We addressed the problem of efficiently identifying critical links under a realistic situation where all the links in a network are probabilistically disconnected as is assumed in studies in uncertain graphs. A link is critical if it has a large performance degradation when it is removed. There are many situations in which disconnection can take place probabilistically, e.g., some information paths between two persons may not be open by server down in case of a social network, and some roads between two intersections may be blocked due to traffic accident in case of a road network.
Noting that bridge in graph theory is the key concept to solve this problem, we proposed a novel algorithm that can efficiently identify critical links by incorporating the bridge detection algorithm as the underlying search technique. A bridge is a link in a connected component such that its deletion divides the component into two disjoint ones. To be more precise, we define a new measure, Target-oriented latent link Criticalness Centrality (TCC), which quantifies the performance degradation and is defined in this paper as the marginal loss of the expected number of nodes that can reach, and equivalently can be reached from, one of the target nodes in the network, and compute TCC for each link by use of detected bridges.
We applied the proposed method to two real-world networks, one from social network and the other from spatial network, and investigated how the performance compares with the traditional link centralities with respect to processing time, TCC value, network structure, target node size and allocation. Computational complexity of the proposed algorithm is , where is the number of networks generated from an original one based on the probabilistic link disconnection model to compute the expectation, and is the number of links in the network. The experimental results show that our method is much faster than computing the traditional centrality measures, and has a good scalability with respect to the network size. Critical links identified by the proposed method possesses unique properties. The extended version of the traditional link betweenness centrality TBC where one of the pair nodes is constrained to the closest one in the target nodes gives a very poor performance in terms of both TCC measure and computation time and cannot find good critical links. The target nodes and their size do affect the results, but their effect strongly depends on network structure. We conclude that no known link centralities can replace TCC.
Our immediate future work is to extend the proposed method to be able to deal with directed networks for which the standard bridge detection algorithm cannot be used. Another direction is to make the model more realistic, e.g. by removing the assumption of uniform link disconnection probability by incorporating problem and domain specific knowledge. We used networks in the real world. It would be useful to use artificial networks as well and systematically change the network properties and conduct performance evaluations more systematically to see which factors are crucial in determining the performance.
Footnotes
Acknowledgments
This work was partly supported by JSPS Grant-in-Aid for Scientific Research (C) (No. 20K11940).
References
1.
AkramV.K. and DagdevirenO., Breadth-first search-based single-phase algorithms for bridge detection in wireless sensor networks, Sensors13(7) (2013), 8786–8813.
2.
Avella-MedinaM.PariseF.SchaubM.T. and SegarraS., Centrality measures for graphons: Accounting for uncertainty in networks, IEEE Transactions on Network Science and Engineering7(1) (2020), 520–537.
3.
BrinS. and PageL., The anatomy of a large-scale hypertextual web search engine, Computer Networks and ISDN Systems30 (1998), 107–117.
4.
ChaojiV.RanuS.RastogiR. and BhattR., Recommendations to boost content spread in social networks, In Proceedings of the 21th International Conference on World Wide Web (WWW ’12), 2012, pp. 529–53.
5.
ChenW.LakshmananL. and CastilloC., Information and influence propagation in social networks, Synthesis Lectures on Data Management5(4) (2013), 1–177.
6.
CrescenziP.D’angeloG.SeveriniL. and VelajY., Greedily improving our own closeness centrality in a network, ACM Transactions on Knowledge Discovery from Data11(1) (2016).
7.
CrucittiP.LatoraV. and PortaS., Centrality measures in spatial networks of urban streets, Physical Review E73(3) (2006), 036125.
8.
DiaoK.FarmaniR.FuG. and ButlerD., Toward scalable cut vertex and link detection with applications in wireless ad hoc networks, Int. J. Optim. Civil Eng.5(3) (2015).
9.
EverettM.G. and BorgattiS.P., Extending centrality, In: Models and methods in social network analysisCarringtonP.J.ScottJ. and WassermanS., eds, 2005, pp. 57–76.
10.
FangY.-P.PedroniN. and ZioE., Comparing network-centric and power flow models for the optimal allocation of link capacities in a cascade-resilient power transmission network, IEEE Systems Journal99 (2014), 1–12.
11.
FrantzT.L.CataldoM. and CarleyK.M., Robustness of centrality measures under uncertainty: Examining the role of network topology, Computational Mathematical Organization Theory15(303) (2009).
12.
FreemanL., Centrality in social networks: Conceptual clarification, Social Networks1 (1979), 215–239.
13.
GradyD.ThiemannC. and BrockmannD., Robust classification of salient links in complex networks, Nature Communications3(864) (2012), 1–10.
14.
KassianoV.GounarisA.PapadopoulosA.N. and TsichlasK., Mining uncertain graphs: An overview, In Proceedings of the International Workshop on Algorithmic Aspects of Cloud Computing (ALGOCLOUD 2016), 2017, pp. 87–116.
15.
KempeD.KleinbergJ. and TardosE., Maximizing the spread of influence through a social network, Theory of Computation11 (2015), 105–147.
16.
KhanA.YeY. and C.L., On Uncertain Graphs, Morgan & Claypool, 2018.
17.
KimuraM.SaitoK. and MotodaH., Blocking links to minimize contamination spread in a social network, ACM Transactions on Knowledge Discovery from Data3 (2009), 9:1–9:23.
18.
KlimtB. and YangY., The enron corpus: A new dataset for email classification research, In Proceedings of the 2004 European Conference on Machine Learning (ECML’04), 2004, pp. 217–226.
19.
KoschützkiD.LehmannK.A.PeetersL.RichterS.Tenfelde-PodehlD. and ZlotowskiO., Centrality indices, In: Network Analysis: Methodological FoundationsBrandesU. and ErlebachT., editors, Springer, 2005, pp. 16–61.
20.
LiD.XuZ.LiS.SunX.GuptaA. and SycaraK., Link recommendation for promoting information diffusion in social network d, In Proceedings of the 22nd International Conference on World Wide Web (WWW ’13), 2013, pp. 185–186.
21.
LiuL.JinR.AggarwalC. and ShenY., Reliable clustering on uncertain graphs, In Proceedings of the 2012 IEEE 12th International Conference on Data Mining (ICDM 2012), 2012, pp. 459–468.
22.
OharaK.SaitoK.KimuraM. and MotodaH., Accelerating computation of distance based centrality measures for spatial networks, In Proceedings of the 19th International Conference on Discovery Science (DS’16), LNCS 9956, 2016, pp. 376–391.
23.
OharaK.SaitoK.KimuraM. and MotodaH., Maximizing network performance based on group centrality by creating most effective k-links, In Proceedings of the 4th IEEE International Conference on Data Science and Advanced Analytics (DSAA’17), 2017, pp. 561–570.
24.
OharaK.SaitoK.KimuraM. and MotodaH., Critical node identification based on articulation point detection for network with uncertain connectivity, In Proceedings of the Sixth International Symposium on Computing and Networking (CANDAR 2018), 2018, pp. 146–152.
25.
OharaK.SaitoK.KimuraM. and MotodaH., Critical node identification based on articulation point detection for uncertain network, International Journal of Networking and Computing9(2) (2019), 201–216.
26.
OliveiraE.L.PortugalL.S. and JuniorW.P., Determining critical links in a road network: vulnerability and congestion indicators, Procedia – Social and Behavioral Sciences162 (2014), 158–167.
27.
OpsahlT.AgneessensF. and SkvoretzJ., Node centrality in weighted networks: Generalizing degree and shortest paths, Social Networks32(3) (2010), 245–251.
28.
PapagelisM., Refining social graph connectivity via shortcut edge addition, ACM Transactions on Knowledge Discovery from Data10(2) (2015).
29.
ParotsidisN.PitouraE. and TsaparasP., Selecting shortcuts for a smaller world, In Proceedings of the 2015 SIAM International Conference on Data Mining (SDM 2015), 2015, pp. 28–36.
30.
ParotsidisN.PitouraE. and TsaparasP., Centrality-aware link recommendations, In Proceedings of of the Ninth ACM International Conference on Web Search and Data Mining (WSDM ’16), 2016, pp. 503–512.
31.
PfeifferJ.J., III. and NevilleJ., Methods to determine node centrality and clustering in graphs with uncertain structure, In: Proceedings of the Fifth International Conference on Weblogs and Social MediaAdamicL.A.Baeza-YatesR. and CountsS., editors, The AAAI Press, 2011.
32.
PiraveenanM.ProkopenkoM. and HosseinL., Percolation centrality: Quantifying graph-theoretic impact of nodes during percolation in networks, PLoS ONE8(1) (2013), 1–14.
33.
PotamiasM.BonchiF.GionisA. and KolliosG., K-nearest neighbors in uncertain graphs, In Proceedings of the VLDB Endowment (PVLDB), volume 3, 2010, pp. 997–1008.
34.
SaitoK.KimuraM.OharaK. and MotodaH., Detecting critical links in complex network to maintain information flow/reachability, In Proceedings of the 14th Pacific Rim International Conference on Artificial Intelligence (PRICAI2016), 2016, pp. 419–432.
35.
SaitoK.KimuraM.OharaK. and MotodaH., Super mediator – a new centrality measure of node importance for information diffusion over social network, Information Sciences329 (2016), 985–1000.
36.
SaitoK.KimuraM.OharaK. and MotodaH., An accurate and efficient method to detect critical links to maintain information flow in network, In Proceedings of the 23th International Symposium on Methodologies for Intelligent Systems (ISMIS2017), 2017, pp. 116–126.
37.
SaitoK.OharaK.KimuraM. and MotodaH., Critical link identification based on bridge detection for network with uncertain connectivity, In Proceedings of The 24th International Symposium on Methodologies of Intelligent Systems (ISMIS2018), LNAI 11177, 2018, pp. 89–99.
38.
SariyüceA.E.KayaK.SauleE. and ÇatalyürekU.V., Graph manipulations for fast centrality computation, ACM Transactions on Knowledge Discovery from Data11(3) (2017), 26:1–26:25.
39.
ShenY.NguyenN.P.XuanY. and ThaiM.T., On the discovery of critical links and nodes for assessing network vulnerability, IEEE/ACM Transaction on Networking21(3) (2013), 963–973.
40.
StojmenovicI.Simplot-RylD.NayakA. and VelajY., Toward scalable cut vertex and link detection with applications in wireless ad hoc networks, IEEE Network25(1) (2011).
41.
TarjanR.E., A note on finding the bridges of a graph, Information Processing Letters2(6) (1974), 160–161.
42.
TongH.PrakashB.A.Eliassi-RadT.FaloutsosM. and FaloutsosC., Gelling, and melting, large graphs by edge manipulation, In Proceedings of the 21st ACM international conference on Information and knowledge management (CIKM ’12), 2012, pp. 245–254.
43.
WangC. and LinZ., An efficient approximation of betweenness centrality for uncertain graphs, IEEE Access7 (2019), 61259–61272.