
Abstract
It is important to make sense of the data within its context to propose a useful model to solve a problem. This domain knowledge includes information not contained in the data, but that will help us understand the data to be fed into a machine-learning algorithm and guide us on what features might help our model. Nevertheless, domain knowledge may become insufficient as the input variables increase, forcing the need to try automated feature selection techniques. In this study, we investigate whether the joint use of 1) feature selection techniques, such as Chi-square, Tree-based Feature Selection, Pearson’s Correlation, LASSO, Low Variance, and Recursive Feature Elimination, 2) outlier detection methods such as Isolation-Forest, and 3) Cross-Validation techniques lead to improving the accuracy in multiclass classification in machine learning. Specifically, we address the classification of patterns representing the activation state of cell signaling components into classes that symbolize the different cellular processes triggered in cancer cells. The results presented in this work have shown an accuracy increase with up to 80% fewer input features by only using 3 out of the 16 original descriptors.
Keywords
Introduction
The vast majority of problems we face in the real world involve data classification. A classifier can be proposed, by using machine learning algorithms on a set of training data, to predict the class of new data, even when the latter’s classes are not known. Many of these machine learning techniques allow the solution of binary classification problems [21, 17]. Other problems require the discrimination between data belonging to two or more categories, known as multiclass classification problems. The medical diagnosis of some disease is a typical example of a binary classification problem. In this example, the classifier uses the patient’s clinical information to determine whether they have the disease or not; therefore, there are only two possible results [13, 20, 26]. On the other hand, a multiclass problem may be classifying between different types of tumors, or, as in this work, the different cellular states that a cancerous cell can go through, depending on the activation/inhibition state of the components of the signaling pathways that lead the cell to them [28, 29, 2].
Machine learning studies techniques to make accurate predictions based on past observations; generally, the problem is to predict the “l” label of an example “x” to minimize the probability of an incorrect prediction [16]. Of course, the goal is to generate some rule that makes the most accurate predictions possible in new observations. However, this is a difficult task [14]. To achieve this, in this work, we used exploratory analysis as a method that offered data that would serve as input to the dimensionality reduction process, this last process, also known as feature selection, is one of the most critical steps in machine learning [18, 5, 4]. When entering data into a model, the goal is to feed it with relevant characteristics to predicting a class. If the features entered into the model are irrelevant, there is the possibility of introducing unnecessary noise, resulting in lower model accuracy. Attributed to Richard Bellman, the expression “Curse of Dimensionality” is used to express the complexity of using brute force to optimize a function with several input variables. The two possible issues that occur when data has a large number of dimensions are often related to in today’s Big Data problems:
If there are more features than observations, the model could be overfitted, resulting in poor performance. When there are many features, the observations become more challenging to cluster together; an excessive number of dimensions makes each observation in the corpus appear equidistant from all the other observations. In addition, since Euclidean distance is often used by grouping techniques to measure the similarity between observations, this becomes a problem because if all distances are roughly equal, no significant clusters can be created.
Conceived to guide data mining projects, the cross-industry standard process for data mining (CRISP-DM) was developed to respond to the increasing need for data mining techniques that can extract knowledge from data [19]. In this paper, we perform CRISP-DM-based exploratory data analysis to later investigate the importance of the dataset descriptors to reduce their number and improve the multiclass classification accuracy. Feature selection is not a recent idea, and below we will address three reviews on this subject.
The first review [15] tackles feature selection methods such as standard filter, wrapper, embedded, and hybrid techniques emphasizing applications in text mining, image processing, computer vision, industrial applications, and bioinformatics. Finally, they identified a trend pointing towards hybrid feature selection methods such as evolutionary computation heuristic algorithms. The second review [25] approaches these evolutionary computation techniques. However, they acknowledge that the lack of guidelines on this approach leads to a disintegrated field which convey lost opportunities for improving this approach. They identify techniques, evaluation criteria, and number of objectives as key factors for genetic algorithms, ant colony optimization, particle swarm optimization, sequential forward selection, sequential forward floating selection, sequential backward floating selection, simulated annealing, tabu search, and many other promising techniques, yet at a high computational cost, resulting only feasible in real-world applications for datasets with a small number of instances. Finally, the third review [23] reports feature selection in medical applications covering medical imaging, biomedical signal processing, and DNA microarray data analysis in real-world scenarios. They explored techniques such as information gain, relief–F, recursive feature elimination for support vector machines, lasso regularization, and INTERACT, to demonstrate the suitability of feature selection in real-world scenarios as a preprocessing step.
In this work, we use various methods to evaluate the relationship among the different predictor variables (characteristics) and the objective variables (classes) for the analysis of a cell signaling dataset. The methods can be divided into three main groups:
Filter based: metrics are specified to filter the characteristics based on them subsequently. For example, Pearson’s Correlation, and Chi2 [3, 12]; Wrapper based: these consider selecting a subset of characteristics as a search problem and recursive elimination. For example, Recursive Feature Elimination [5]; Embedded: this approach uses algorithms with built-in methods for selecting features. For example, Lasso and Tree-based Feature Selection have their feature selection methods integrated [7].
The synergy between these feature selection techniques and outlier detection methods – such as i-Forest – is explored in this work. Accordingly, the main contribution of this study is to significantly improve the accuracy in the multiclass classification in automated learning using an approach based on the collaborative use of 1) exploratory data analysis, 2) feature selection techniques, 3) outliers detection methods, and 4) cross-validation. We claim that a significant increase in the accuracy of multiclass classification in machine learning can be achieved from a synergy between exploratory data analysis and the dimensionality reduction of the input data.
The rest of the paper is organized as follows. Section 2.1 describes the characteristics of the cell signaling dataset selected as a multiclass classification problem. Section 2.2 presents the methodological approach based on data mining in this work to explore, preprocess, and model the cell signaling dataset. Aspects concerning exploratory data analysis and data scaling are dealt with in Sections 2.3 and 2.4, respectively. The k-NN machine learning algorithm used in this work is described in detail in Section 2.5. Feature selection techniques used for dimensionality reduction are introduced in Section 2.6. The results obtained during data preparation, exploratory analysis, and modeling based on the k-NN algorithm with and without dimensionality reduction are presented in Sections 3.1, 3.2, and 3.3, respectively. Section 4 discusses the results. Lastly, the conclusions are given in Section 5.
The cell signaling dataset
The issue at hand here focuses on the understanding, exploration, analysis, and further inference of the behavior of the PI3K/Akt/mTOR signaling pathway in cancer cells under different cellular conditions. In tumoral cells, activation of signaling pathways related to Phosphoinositide-3-kinase (PI3K) and Mitogen-Activated Protein Kinases (MAPKs) has been linked to the expression of paracrine signals that promote cell growth and survival after exposure to stress. Therefore, these proteins are expressed only in high concentrations in transformed cells. PI3K controls various key functions related to cancer biology, including proliferation, cell survival, migration, and angiogenesis. The PI3K/AKT/mTOR pathway is central in different cellular functions. It has a complex signal transduction mechanism, in which three main modulator proteins participate: PI3K, AKT (Serine/threonine kinase, also known as protein kinase B), and mTOR (Serine/threonine kinase, mammalian Target of Rapamycin).
In recent years, we have been working on in silico modeling and simulation of cellular signaling networks involved in cancer, particularly PI3K/Akt/mTOR signaling network and other cell signaling pathways closely related to it [9, 8], to provide reliable support and guidance to in vitro experimentation in this area of molecular biology. Alternatively, the results obtained from in vitro experiments allowed us to improve the conceptual and computational models (i.e., model and simulation) and continue the translational research cycle between biomedical-bioinformatics models and experimental results.
The Cellulat bioinformatics framework is used as a cell signaling data simulator. In silico experiments generate a large volume of input-output patterns where the input refers to the global activation/inhibition state of the signaling elements of the network, and the output represents the cellular state(s) associated with that activation/inhibition state. Note that in the “Data preprocessing” phase before the start of the “Data farming” phase (see Fig. 1), the domain expert plays a key role in determining: 1) the sampling rate (e.g., millisecond, seconds, minutes, or any order of magnitude of these time units) in which the data produced by the simulator are selected to integrate the dataset, and 2) if applicable, the feature selection that will characterize the dataset records.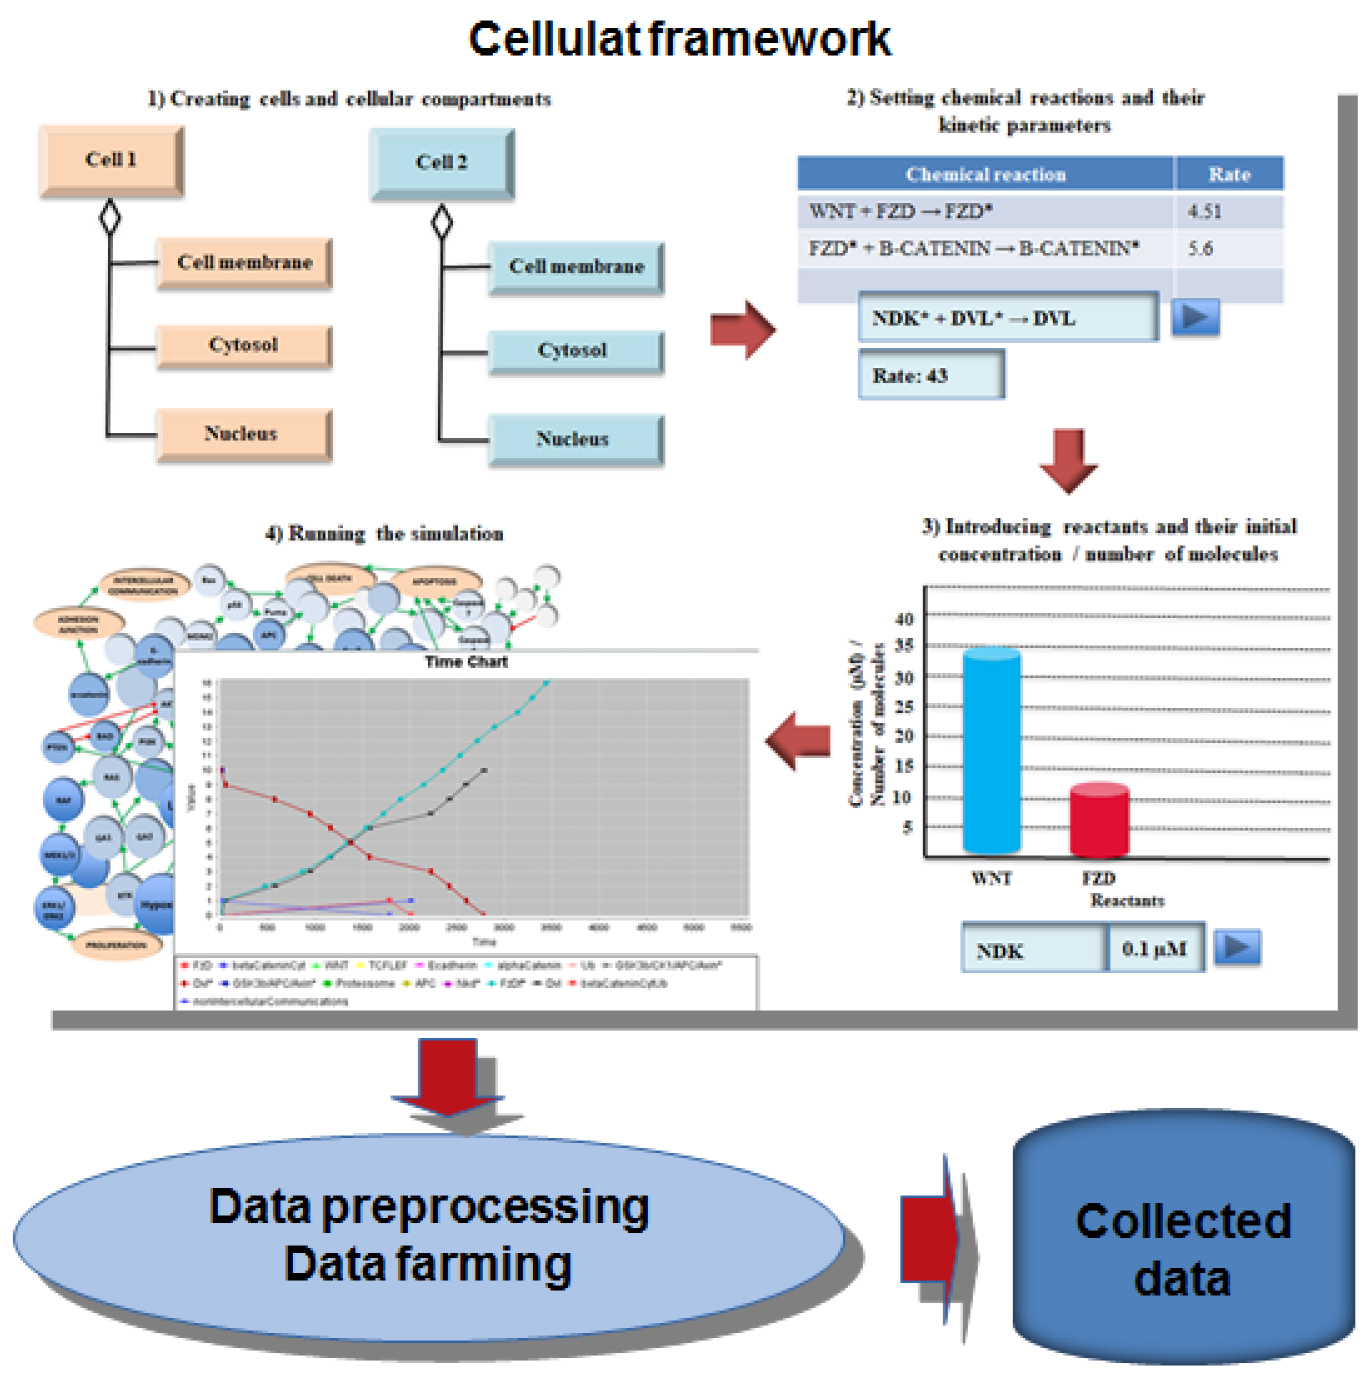
The simulation of cancer-related cell signaling pathways, as well as the subsequent in silico experimentation, was carried out on the Cellulat computational framework, a computer simulation for the study, exploration, and prediction of cell signaling networks, developed, validated, and verified by us years ago [11, 10, 8]. The Cellulat bioinformatics framework was not conceived only as a computational simulation but also as a big data producer (i.e., a cell-signaling data simulator), which describes the simulation pathway’s behavior at each moment of its execution. This last feature of Cellulat was what led us to use the generated dataset1
As can be seen in Fig. 1, we used the Cellulat computational framework to 1) observe, explore and understand the behavior of PI3K/Akt/mTOR cell signaling pathway from a wide range of in silico experiments carried out, and 2) produce massive data that describe the behavior of this signaling pathway, in terms of the activation/deactivation state of each of its signaling elements as well as the resulting cellular process. The cell signaling dataset to be explored, preprocessed, and analyzed corresponds to a large volume of input-output patterns produced by in silico experiments carried out by the Cellulat bioinformatics framework.
Table 1 shows the characteristics of the resulting PI3K/Akt/mTOR dataset regarding the number of features, number of instances, and number of classes. The PI3K/Akt/mTOR dataset comprises 2195 instances characterized by 16 attributes and five classes. Attributes represent signaling elements such as receptors, key proteins, PI3K/Ras inhibitors, anti-apoptotic proteins, pro-anti apoptotic proteins, pro-apoptotic proteins, and tumor suppressor proteins. These 16 attributes correspond to the same number of target signaling elements of the PI3K/Akt/mTOR signaling network, i.e., signaling elements whose level of activity/inactivity is decisive in the cellular process that can be triggered. Note that the total elements of the signaling network amount to 50.
On the other hand, classes represent the main five cellular states – survival, proliferation, motility, epithelial-mesenchymal transition (EMT), and apoptosis – to which the cell could be carried, depending on a particular activation/inhibition configuration exhibited by the signaling elements. Here it is necessary to note that the first four cell states mentioned are not mutually exclusive. For example, a cell that is in the state of survival could, in turn, be in proliferation and motility. However, the apoptosis cell state excludes any other cell state. The above means that an input pattern could be classified in more than one class. In other words, four of the five classes are not mutually exclusive. Table 2 shows the number of instances representing each initial class.
Characteristics of the PI3K/AKT/mTOR signaling dataset resulting from the data farming process
Classes and number of instances for PI3K/AKT/mTOR signaling dataset
The exploration, preparation, and analysis of the cell signaling database were carried out following the methodological approach provided by CRISP-DM, a widely proven method of guiding data mining work [19]. Despite not being a recent methodological approach, it is still relevant to guide data mining projects. As shown in Fig. 2, CRISP-DM consists of the six main phases: business understanding, data understanding, data preparation, modeling, evaluation, and deployment.
Phases of the CRISP-DM method. Note that in each of the CRISP-DM phases, the domain expert plays a key role. To mention just a couple of examples, in the “Data understanding” phase, the domain expert carries out an initial exploration and analysis of the data in order to identify if there are quality problems in the data, discover initial findings of the data, and propose hypotheses about the information that these data describe. On the other hand, in the “Modeling” phase, the domain expert plays a crucial role in selecting modeling techniques, testing methods, and the generation and evaluation of the models. The phases “Business understanding” (domain understanding) and “Data understanding” not only play a decisive role in the type of application at hand, i.e., multiclass classification, but also in other types of applications such as binary classification, regression, and clustering.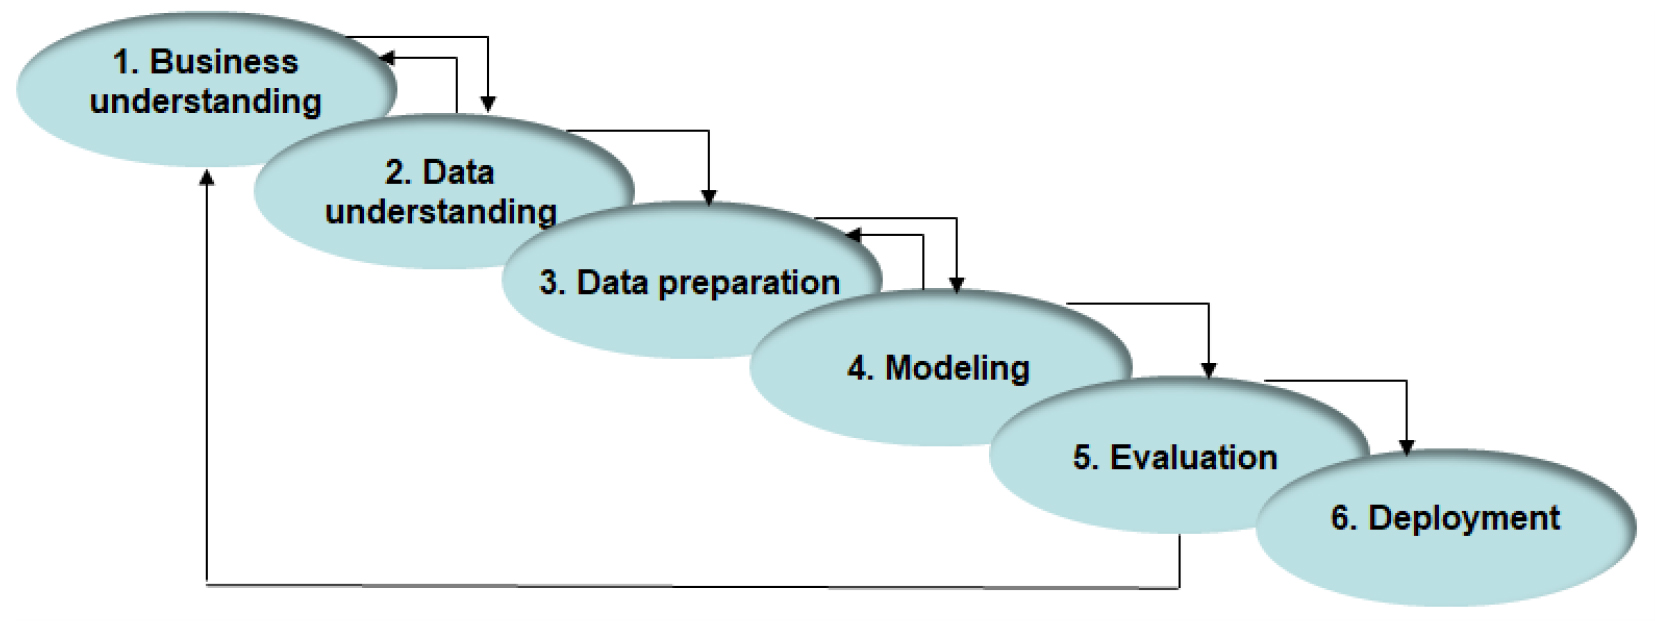
The Business Understanding phase is of great importance since it is in this phase where the problem to be solved is defined. It focuses on understanding the work goals and providing a data mining perspective to understand what data should be analyzed. The Data Understanding phase consists of describing, exploring, and analyzing the data to identify quality problems, discover initial ideas about the data, and even establish hypotheses about the information described by them. The Data Preparation phase shapes the raw data to build the final data set that will serve as input for the model. In the Modeling phase, the techniques used for data analysis are chosen, and their optimal parameters are found. The Evaluation phase thoroughly evaluates the built model to ensure that the proposed objectives are achieved. Finally, in the Deployment phase, the results are presented [19].
The “Data understanding” phase of the cell signaling dataset was strongly based on the Exploratory Data Analysis (EDA), which allowed us to explore and obtain intuition about the cell signaling dataset before starting with their preparation for later analysis. Therefore, the EDA application was an initial step that consisted of characterizing the PI3K/AKT/mTOR signaling dataset by extracting key signaling elements, identifying outliers values, understanding the relationship between particular signaling elements, and in short, maximizing the understanding of this dataset to minimize possible inaccuracies that may occur later during the preparation and analysis of the data.
Data scaling
Data scaling is possibly the main step during the data pre-processing stage, prior the creation of the machine learning model. Data scaling allows all the characteristics to be in the same range since, if there were a large difference in the values, the larger ones would play a more important role during model training, which is commonly undesirable. Scaling can differentiate between a good and a bad generalization phase carried out by the machine learning model. Normalization is used to create a scaled version of the data values, typically between
In this work, for the scaling of the data from the PI3K/AKT/mTOR dataset, we use the Yeo-Johnson transform [27], a particular type of power transformer that finds the optimal scaling factor (
The presence of outliers in the data set commonly leads to an analysis model that exhibits poor performance. To mitigate this problem, we evaluated different techniques to identify and eliminate these outliers as part of preprocessing the data.
When the data matches the normal distribution, the Z-score will determine how uncommon is an observation. The Z-score is the number of standard deviations above and below the mean that each data value falls in. The Eq. (2) is applied to calculate the Z-score of an observation:
The more unusual an observation is, the Z-score is more distant from zero [1].
Isolation Forest (i-Forest) is an algorithm for the detection of anomalies (outliers) based on trees, which models the data in such a way that the anomalies are isolated, taking advantage of two quantitative properties of these: 1) the number of instances is few, and 2) its attribute values are very different from regular instances [6].
Local outlier factor
One approach to identifying outliers is to locate those instances that are farthest from the other instances in the feature space. This can work well for low-dimensional spaces, although it can become less suitable as the number of features increases. The local outlier factor (LOF) is a technique that tries to take advantage of the nearest neighbors’ (k-NN) approach to detect outliers. Each instance is assigned a score for how isolated it is based on its neighborhood’s size, so instances with a high score are identified as outliers [6].
The machine learning algorithm
For analyzing the large volume of input-output patterns from the cell signaling dataset and obtain insight into the PI3K/AKT/mTOR signaling network, a machine learning model trained by a k Nearest Neighbor (k-NN) was used. It is necessary to analyze, format, and condition the data to build a machine learning model. The preprocessed dataset is then used to train the machine learning algorithm, and therefore, as mentioned before, to generate the machine learning model. There are different types of machine learning; supervised, unsupervised, reinforcing, and insightful. In this work, we use a supervised learning algorithm. The term supervised refers to the fact that the learning process involves a set of labeled data that feedback to the algorithm, indicating whether the predictions made are correct or incorrect.
The k-NN classification algorithm is often referred to as memory-based learning or instance-based learning. These terms indicate the main concept of k-NN: creating the model by memorizing the training data set and then using this data to make predictions. Figure 3 shows the machine learning model proposed, which is explained below in detail.
The adopted machine-learning algorithm to analyze the large volume of input-output patterns produced by the Cellulat simulator.
The k-NN algorithm (Algorithm 3) uses a majority voting mechanism. k-NN collects data from a training set and uses it to predict the class of the new examples presented to it. For each new example, the
[h] [1]
A numerical measure that tells us how far one point is from another is known as distance. Some of the distances commonly used with the k-NN algorithm are given by Eqs (3)–(5):
The Euclidean distance between points
The Chebyshev distance between two vectors of characteristics
The Manhattan distance between points
As mentioned earlier, in this work, we use an approach based both on exploratory analysis and reducing the dimensionality of the input space to improve the accuracy of multiclass classification in machine learning. Dimensionality reduction alludes to limiting the number of variables that characterize the data. In many cases, it is helpful to decrease the number of variables by projecting the data to a lower-dimensional space [24]. This dimensionality reduction can be seen as selecting the most relevant characteristics, eliminating the less outstanding ones [22]. In the machine learning paradigm, a narrower input space implies a more natural structure. It is desirable to have input data with few variables that produce simple models that generalize well. This is especially valid for linear models where the degrees of freedom and the number of inputs are connected.
Dimensionality reduction is a data pre-processing technique conducted after the data cleaning and scaling stages and before the predictive model’s training phase. The techniques for selecting the most relevant characteristics used in this work are described below.
Low variance
Low Variance feature removal is a basic and straightforward approach to feature selection. The Low Variance technique removes all characteristics whose variance does not reach the established threshold. This feature selection algorithm only works with features and not with class outputs. This makes it an unsupervised technique. If the variance of a feature is close to zero, then a feature is approximately constant and will not improve the model’s performance. In that case, it should be removed. The variance is defined by Eq. (6):
where
In this method, each feature is evaluated against the classes. For each pair of features, the Chi-Squared values are calculated; a larger Chi-Squared value commonly indicates a greater interdependence between the two attributes, so the use of this method identifies the features that are more likely to be independent of the class and thus unrelated to the classification. Since this approach is commonly used with categorical attributes, it is needed first to discretize the numeric attributes at different intervals. The Eq. (7) is used to calculate the Chi-Squared statistic:
where
The Recursive Feature Elimination (RFE) method chooses features by evaluating different subsets of characteristics recursively. The selection uses the weights assigned by an estimator. First, with the initial set of characteristics, the estimator is trained, and for each feature, their importance value is obtained. Then the less salient features are removed from the existing feature set. This process is repeated through the entire dataset recursively until the desired number of features is finally achieved.
LASSO
The Least Absolute Shrinkage and Selection Operator (LASSO) is a regularization technique. Regularization is one approach to tackle the problem of overfitting by adding additional information, and thereby shrinking the parameter values of the model to induce a penalty, as can be seen in Eqs (8) and (9):
where
The above loss function is minimized by the residual sum of squares (RSS) plus an additional penalty for feature weights. The greater the chosen value for
The Extra Trees Classifier is a metamethod that fits several randomized decision trees on various data set sub-samples and averages their results to enhance the prediction accuracy and counter over-fitting. Those randomized decision trees are, in fact, Extremely Randomized Trees, which essentially consists of strongly randomizing both attribute and cut-point choice while splitting a tree node.
Pearson’s correlation
The Pearson’s correlation coefficient calculates the linear relationship between two random variables. Its values range between
where
Data preparation
The first inconsistency identified in the PI3K/AKT/mTOR corpus by the exploratory data analysis was the classification scheme. In a typical classification problem, a data instance can only be assigned to one class. In this corpus, however, a particular input instance representing the activation state of sixteen signaling elements is associated with several cellular processes; each of these cellular processes was initially considered an individual class, as shown in Table 2. The class scheme was transformed into a more convenient one to avoid an instance belonging to more than one class. The resulting classification scheme is listed in Table 3, while Fig. 4 shows the updated number of instances in each class. This transformation allowed us to process the corpus normally.
Adopted classification scheme
Adopted classification scheme
Reassignment of instances to the new proposed classes.
Once translated into a multiclass classification scheme, exploratory data analysis on the PI3K/AKT/mTOR dataset allowed us to identify the major signaling elements and key interaction relationships between signaling pairs, which could be significant enough to lead the cell to the observed cellular process or processes. In other words, the exploratory analysis focused on the evaluation of the 16 input characteristics (signaling elements) of the dataset as a preceding step to selecting the optimal number of characteristics (the most salient predictors) that lead to the best performance of the learning model.
The first step in evaluating the salience of the 16 signaling elements in the resulting cellular process is to analyze their relative importance on the six classes resulting from the new proposed multiclass classification scheme. Figure 5 shows some results of the initial phase of the performed exploratory data analysis. The rest of the graphs can be consulted in the Supplementary Material.
Importance of the signaling elements AKT (a), PI3K (b), PTEN (c), SHIP2 (d), and XIAP (e) as significant predictors.
Figures 5a–e show the relevance of the concentration value of the signaling elements AKT, PI3K, PTEN, SHIP2, and XIAP, as salient predictors for an input pattern – of sixteen attributes that represent the same number of signaling elements – be classified into one of six classes representing different possible combinations of cellular processes, as illustrated in Table 3. Figures 5a and b shown that AKT and PI3K concentration values greater than 0.1 characterize the patterns belonging to classes 1 to 5, which represent different combinations of cell states, all characterized by “survival” of the cell. On the other hand, AKT and PI3K concentration values equal to or very close to 0.0 characterize the patterns belonging the class 6, which represents the “apoptosis” cell state (see Table 3). Figures 5d and e show the strong influence of the signaling elements PTEN and SHIP2 in the classification of input patterns in class 6, which represents the cell state “apoptosis” (see Table 3). Values of PTEN and SHIP2 large enough in powers of 10 are characteristic of input patterns associated with the cell state “apoptosis,” while minimal concentrations of these proteins characterize the other cell states, whose combinations are represented by classes 1 to 5. Finally, as can be seen in Fig. 5e, XIAP is perhaps the most critical predictor to determine when an input pattern will be classified in class 6, which represents the cell state “apoptosis” or in any of classes 1 to 5, which represent different combinations of cell states associated with the survival of the cell. A value of the XIAP concentration equal to or sufficiently close to zero indicates that the input pattern belongs to class 6, characterizing the “apoptosis” cell state.
Once the first phase of the exploratory analysis was concluded and with a first idea in mind about the importance of each of the 16 predictors in the multiclass classification process, a subsequent evaluation of these was carried out using the previously introduced Chi-Squared, Tree-based Feature Selection, Pearson’s Correlation, LASSO, Low Variance, and Recursive Feature Elimination techniques. The results produced by this second phase of the exploratory data analysis are described in Table 4, where we can verify the importance or weight of the five previously explored predictive attributes (AKT, PI3K, PTEN, SHIP2, and XIAP) in the multiclass classification process, according to the group of techniques used. As we can see in Table 4, among the eight most salient predictors discovered by the Chi-Squared technique, four of them are precisely AKT, PTEN, SHIP2, and XIAP, while among the eight most salient predictors indicated by the Tree-based feature selection technique stand out PI3K, AKT, PTEN, and XIAP. Note that the LASSO and Low Variance techniques indicate only three of the sixteen predictors as the most important or weighty in the multiclass classification: PTEN, SHIP2, and XIAP.
Results produced by feature selection techniques
The modeling process was carried out using the previously introduced k-NN machine learning model, considering two modeling stages, a first stage in which the original sixteen features that describe the data is considered the dimensionality of the input space. In contrast, in a second stage, the characteristics indicated by each of the dimensionality reduction techniques applied are selected as the input patterns, applying the k-NN model to each of these subsets of characteristics.
Performance of the machine learning model without considering the reduction of the dimensionality of the data
This stage of k-NN machine learning was carried out using three different approaches. In the first and second approaches, we do not use cross-validation but a random subset for training and testing patterns, which leads to overfitting characterized by the lack of generalization. In the first approach, the value of k is set equal to
k-dependence of the k-NN accuracy.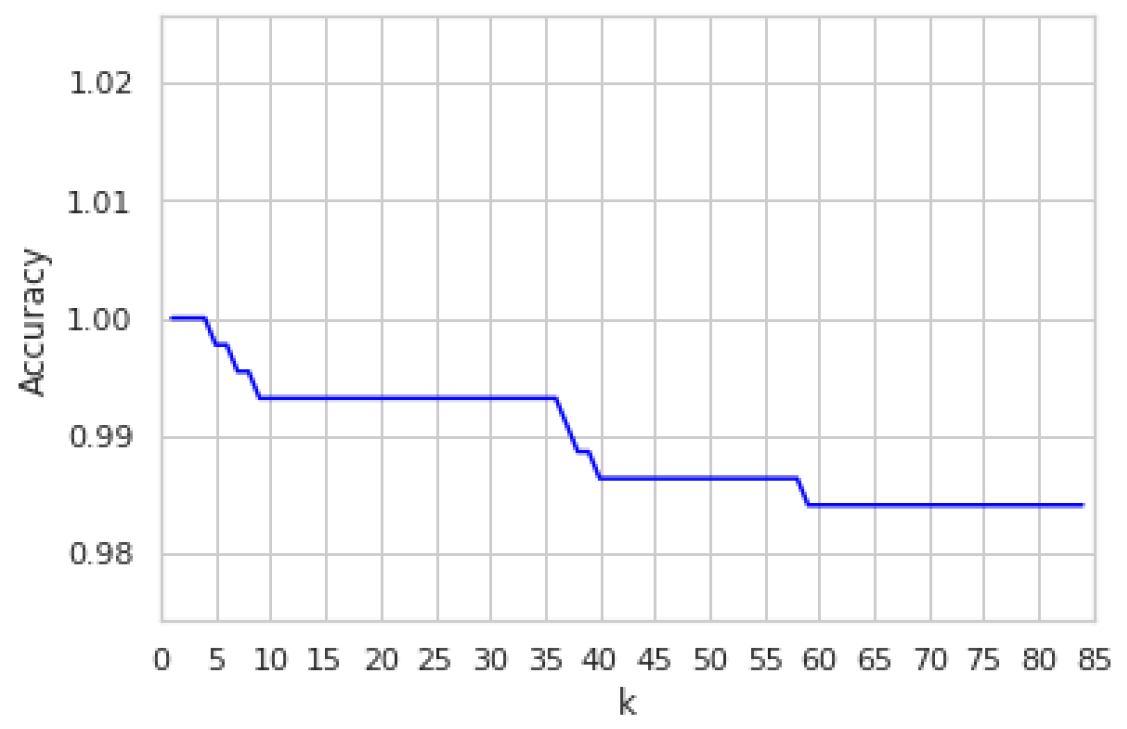
Results produced by z-Score (b), i-Forest (c) and LOF (d) techniques to mitigate the problem of outliers.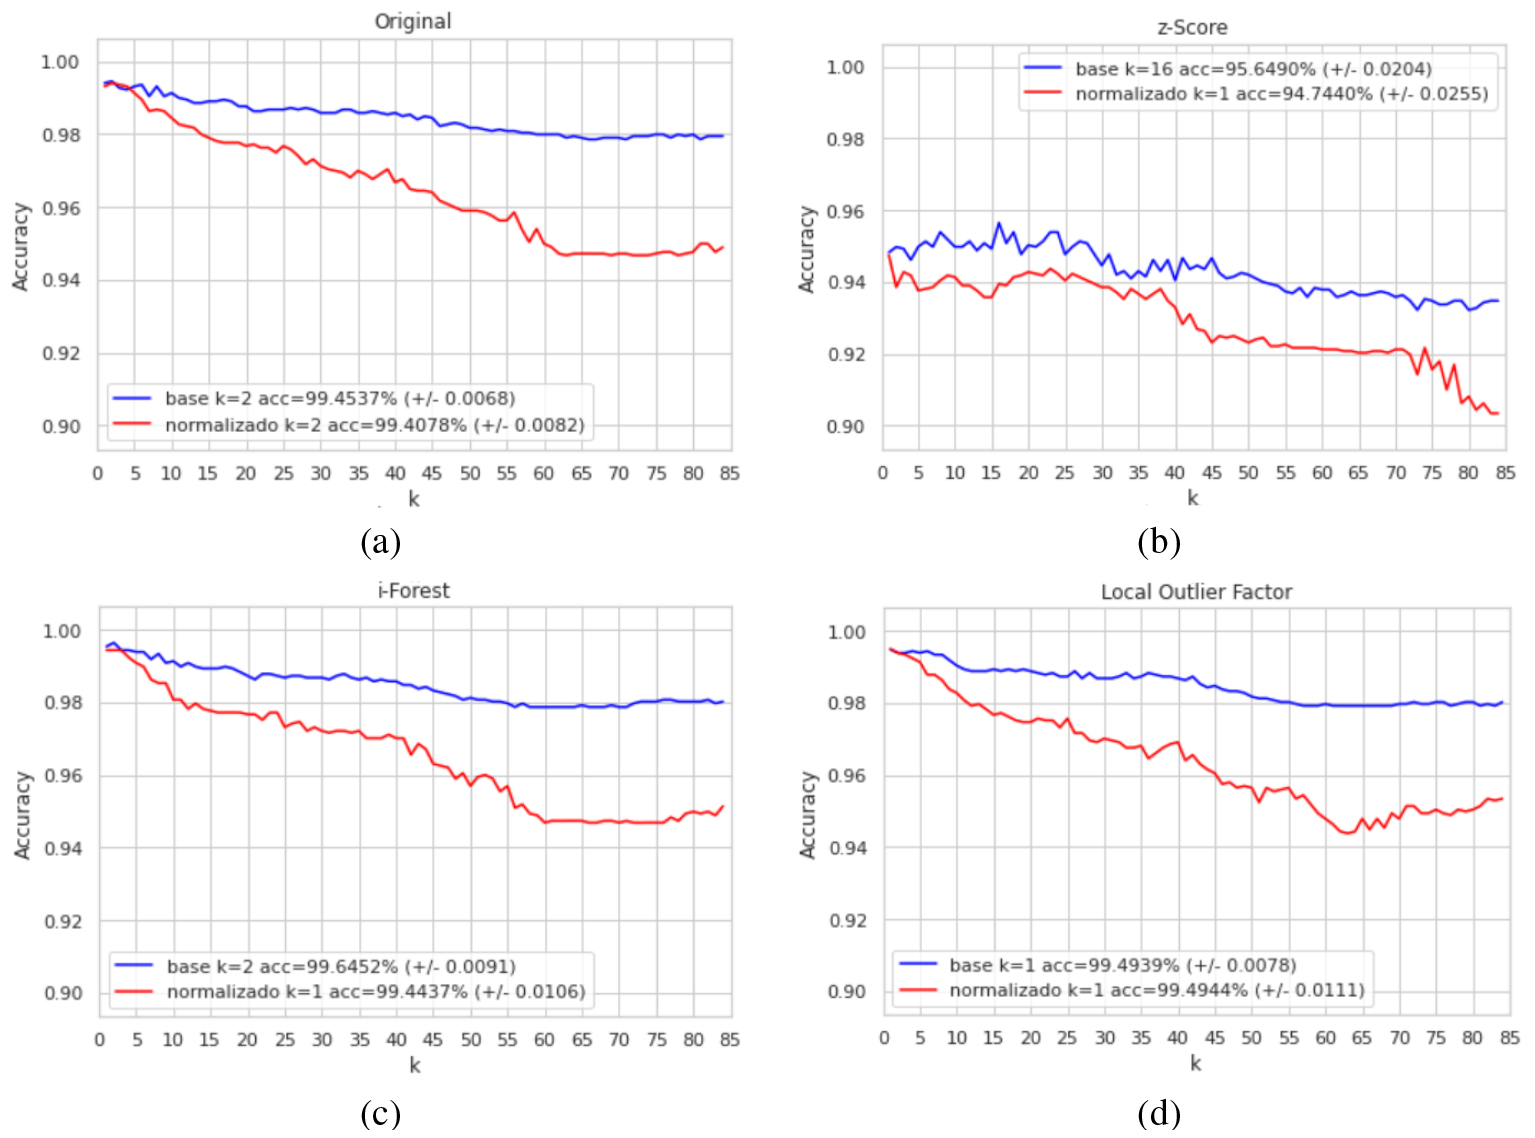
Impact of feature selection techniques on accuracy of multiclass classification machine learning.
On the other hand, unlike the first two approaches used, the third approach is based on three techniques aimed at improving classification: 1) cross-validation to estimate the ability of the model to generalize to new data, 2) scaling of the data with the transform Yeo-Johnson, and 3) the use of the z-Score, i-Forest and LOF techniques to mitigate the problem of outliers commonly present in datasets. The results obtained by applying this third approach with the k-NN machine learning model are illustrated in Fig. 7.
Figure 7a shows the results of applying the k-NN algorithm considering only the use of cross-validation and scaling, obtaining the best accuracy for classification acc
In the second modeling stage, the k-NN algorithm was applied to each of the six subsets of features produced by the same number of feature selection techniques described in Table 4, where the relationship of characteristics selected as the most important predictors for each of these techniques can be appreciated. This second modeling stage also considered cross-validation to avoid overfitting and the use of the i-Forest technique to mitigate the problem produced by outliers. The results obtained are shown in Fig. 8a–f. As shown in these figures, the best precision in the classification was obtained with the subsets of characteristics selected by the Chi-Square and Tree-based feature selection techniques. The k-NN algorithm applied to the group of eight characteristics selected by the Chi-Square technique produced an accuracy rate of 99.6462% for
In addition, it is necessary to note that the Tree-based Feature Selection and Chi-Squared techniques produced greater accuracy in the classification for the initial approach shown in Fig. 7c, characterized only by the use of cross-validation and the i-Forest technique to reduce outliers, in which the best precision obtained was acc
Discussion
The CRISP-DM methodology, described in Section 2.2, conducted the approach based on exploratory data analysis in this work. From the results presented in Section 3, AKT, PI3K, PTEN, SHIP2, and XIAP signaling elements were identified as the most important predictors for the multiclass classification task. AKT and PI3K concentration values greater than 0.1 characterize the patterns belonging to the “survival” class, while large values of PTEN and SHIP2 signaling elements indicate input patterns associated with the “apoptosis” class. In contrast, lower concentrations of these proteins characterize the remaining classes representing other cell states. Finally, the XIAP concentration value close to zero indicates input patterns belonging to class 6, characterizing the “apoptosis” cell state. At the end of the exploratory analysis, it was unclear if the five proteins are the only important ones for a multiclass classification task or if a subset of signaling elements that perform better exists. We preprocessed the data by applying data scaling and outlier elimination to feed the feature selection algorithms to investigate these preliminary findings. To scale the data, we used Power Transformation (Yeo-Johnson) and the i-Forest technique for outlier elimination since both techniques offered the best results in each category.
We performed feature scaling during the data preprocessing stage to scale the values to a fixed range since the dataset contains highly varying magnitudes. When feature scaling is not performed, a machine learning algorithm tends to give greater weight to larger values and less weight to smaller values, regardless of the unit of measure in which the characteristics are expressed. In our case, however, the scaling did not improve the k-NN algorithm’s performance; in fact, scaling the data was detrimental. We hypothesize that the increase in error rate was due to the data set features’ inherent nature, where the different concentrations of proteins have a specific meaning depending on the scale.
Figure 6 shows an unconvincing result of a 100% hit rate regarding model evaluation, which we addressed by applying a 10-fold cross-validation schema to assess the model generalization power and avoid overfitting problems. Since we have a very imbalanced data set, this technique also allowed us to evaluate the k-NN algorithm by training several models on subsets of the available input data and evaluating them on the complementary subset. Figure 7 shows the more robust results after cross-validation. Finally, we deem that the Isolation-Forest outlier detection technique synergizes with the tree-based feature selection results to improve them. i-Forest belongs to the ensemble decision trees family, which takes advantage of the feature selection that uses the Extra Trees Classifier to evaluate the features’ saliency. The collaborative use of these two techniques led to a better performance of the multiclass classification task.
For reproducibility, the different parameters we use for the scikit-learn machine learning library are shown in Table 5.
Scikit-learn machine learning library algorithm parameters
Scikit-learn machine learning library algorithm parameters
In this work, we presented and discussed how the collaborative use of 1) exploratory data analysis, 2) feature selection techniques, 3) outliers detection methods, and 4) cross-validation lead to significantly improve the accuracy in the multiclass classification machine learning. On the one hand, the proposed approach allowed us to explore the role of a set of feature selection techniques – Chi-Square, Tree-Based Feature Selection, Pearson’s Correlation, LASSO, Low Variance, and Recursive Feature Elimination – to finding the most important predictors for multiclass classification problems. On the other hand, we evaluated the synergy between the feature selection techniques mentioned above and the outlier detection methods, finding that the joint use of the Tree-Based Feature Selection technique and the i-Forest method produced the best results in the accuracy of multiclass classification.
As discussed above, when the k-NN algorithm was applied to the subset of eight characteristics proposed by the Chi-Square technique, an accuracy rate of 99.6462% for
According to the Chi-Square and Tree-Based Feature Selection techniques, the obtained results showed that subsets of the eight more salient signaling elements (predictors) led to a significant accuracy improvement over the sixteen original ones. As the initial exploratory data analysis results pointed out, both feature selection techniques indicated mTOR, PTEN, XIAP, and AKT among the eight more salient predictors proposed. However, as shown in Table 4, the Ras signaling element was selected as the most salient predictor by both techniques. This variability in the feature subsets reveals a limitation of our proposal and the current feature selection techniques that, even though we have shown, help reduce computation time and take care of multicollinearity by improving model performance by eliminating redundant features and noise in the dataset, this reduction of dimensions through the selection of features always entails losing information. In addition, there is the latent question about the optimal subset of characteristics and if the feature selection technique is dataset dependent.
In future research, it would be of interest to use different types of classifiers such as neural networks that would greatly benefit from the reduction of descriptors since each neuron can be seen as a feature that can be pruned accordingly to its saliency. These ideas could be combined with the methods proposed to get better and faster feature selection methods successfully applied to large datasets.
Ethics approval and consent to participate
Not applicable.
Consent for publication
Not applicable.
Data availability
The data that support the findings of this study is openly available in GitHub at
Declaration of competing interests
The authors declare that they have no competing interests.
Funding
This work was partially funded by the authors’ universities and the Consejo Nacional de Ciencia y Tecnología (CONACyT) from México. Its contents are the responsibility of the authors and do not reflect the views of the research granting bodies. The authors were responsible for the data analysis after the extraction and linkage.
Footnotes
Acknowledgments
Pedro Pablo González Pérez would like to thank the support of Universidad Autónoma Metropolitana, Unidad Cuajimalpa. Máximo Eduardo Sánchez Gutiérrez would like to thank the support of Universidad Autónoma de la Ciudad de México. The authors would also like to thank the support given by Maura Cárdenas Gracía who shared the understanding of the theoretical and experimental aspects of the PI3K/AKT/mTOR signaling pathway and its role in cancer.