Abstract
Based on the shape characteristics of the sample distribution in the clustering problem, this paper proposes an extended clustering algorithm based on cluster shape boundary (ECBSB). The algorithm automatically determines the number of clusters and classification discrimination boundaries by finding the boundary closures of the clusters from a global perspective of the sample distribution. Since ECBSB is insensitive to local features of the sample distribution, it can accurately identify clusters on complex shape and uneven density distribution. ECBSB first detects the shape boundary points of the cluster in the sample set with edge noise points eliminated, and then generates boundary closures around the cluster based on the boundary points. Finally, the cluster labels of the boundary are propagated to the entire sample set by a nearest neighbor search. The proposed method is evaluated on multiple benchmark datasets. Exhaustive experimental results show that the proposed method achieves highly accurate and robust clustering results, and is superior to the classical clustering baselines on most of the test data.
Introduction
Clustering is one of the most fundamental problems in data science and machine learning communities [1, 2]. Enormous efforts have been made on clustering algorithms over the past decades [3, 4]. However, with the development of consumer-level data acquisition devices, the data acquired in real-world applications nowadays are highly disordered, unlabeled, and complex, which brings new challenges to this problem [5].
Clustering algorithms [6, 7, 8] can be classified by their representation and methodology: partition clustering [9, 10, 11, 12, 13, 14, 15, 16, 17], density-based clustering [18, 19, 20, 21, 22, 23], model-based clustering [24, 25], graph clustering [27, 28, 29, 30], and learning-based clustering [31, 32, 33], as shown in Table 1. These methods tackle the clustering problem by either using hand-crafted pipelines to first find the cluster center and determine the label, or apply data-driven strategies to learn the clustering rules. To be specific, K-means [9, 10, 11, 12, 13] constantly adjusts the center of mass in order to minimize the objective function.
Introduction of clustering algorithm
Introduction of clustering algorithm
Although the aforementioned algorithms are able to produce relatively convincing results in some scenarios, the limitations are very obvious: (1) the number of clusters and clustering parameters need to be defined carefully, which is cumbersome and infeasible for some practical applications; (2) for data with a complex density distribution, the location of clustering center may be fuzzy and difficult to determine; and (3) it is difficult to identify clusters with complex shapes. For example, K-means, C-means, K-medoids, and DPC require the user to enter the number of clusters. Furthermore, K-means and K-medoids are not suitable for finding clusters with nonconvex shapes, and DBSCAN is not good at identifying clusters with uneven density distribution. The GMM-based algorithm assumes that the samples obey
In this paper, an extended clustering algorithm based on cluster shape boundary (ECBSB) is proposed. ECBSB searches the cluster boundary closure from the global perspective of sample distribution, and then propagates the cluster label from the boundary closure to the center, which reduces the algorithm’s dependence on the cluster shape. It is significantly different from the existing clustering algorithms, as it better utilizes the global characteristics of data distribution by analyzing the cluster boundary explicitly.
The contributions of this paper are threefold:
A clustering method that extends from boundary to center is proposed. Based on the global characteristics of the sample distribution, the proposed method searches the cluster boundary closure, and then propagates the cluster labels from the boundary closure to the center of the cluster to realize clustering. ECBSB can automatically determine the number of clusters according to the modified number of boundary closures, and can identify clusters with complex shapes. ECBSB can also well identify clusters with an uneven density distribution. Experiments demonstrate that the proposed method can achieve high accuracy and robust clustering results, and outperforms the classical clustering algorithms on most of the datasets.
The rest of this paper is organized as follows. Section 2 briefly introduces the related works. Section 3 introduces the main idea and framework of ECBSB. Section 4 introduces the specific implementation of ECBSB based on the Aggregation dataset, and then explains the parameter selection and noise processing method. Section 5 shows the test results of ECBSB on benchmark datasets, and compares it with some classical clustering algorithms. Conclusions and directions for future work are provided in Section 6.
It is a common strategy for most clustering methods to find clusters by finding cluster centers. However, this often requires a lot of calculation. Searching for the boundary closure can greatly simplify the steps of clustering, and lead to better clustering results. This section introduces the related boundary clustering methods, and gives a detailed description of the current popular clustering algorithms.
Esra et al. [34] constructed a connected graph method based on small surface detection, and theoretically proved that the small surface based on pattern clustering is the boundary of clustering. Therefore, clustering based on boundary information is feasible. In order to solve the problem that two adjacent points belonging to different classes may be clustered into one class, Zhong et al. [35] proposed a clustering algorithm based on cluster boundary information. The algorithm selects boundary points in the sample space by setting the density threshold. Then, the idea of transitivity is used to cluster the non-boundary points. Although this method is based on the boundary information, it still extends from the cluster center to the boundary, and needs to search a large number of non-boundary points, and thus the efficiency of the algorithm is not high. Additionally, it is likely to link the samples in two different clusters during the transmission process, and hence it is not suitable for clusters with an uneven density distribution.
The K-means algorithm based on partitioning firstly randomly selects
The DBSCAN algorithm describes the density degree of the sample distribution according to a set of neighborhood parameters
The spectral clustering algorithm based on graph theory needs to calculate the similarity matrix and Laplacian matrix between samples, and clusters the feature vectors of the Laplacian matrix to cluster samples. The principle of spectral clustering is similar to the dimensionality reduction of data, that is, mapping data from high-dimensional space to low-dimensional space. Although there are many spectral clustering methods, the spectral clustering algorithm mentioned in this paper is the most basic method because it is based on eigenvectors and uses algorithms similar to K-means to cluster eigenvectors.
Main idea of ECBSB
The main idea of ECBSB is to emphasize the global distribution characteristics of the data points in the sample set by finding the shape boundary of the cluster, and to gather the samples in the cluster boundary closure into a class, rather than cluster based on the density or distance of samples.
For example, when clustering the samples in Fig. 1a, we will determine the clustering results according to whether samples belong to the same closure, rather than determining the distance and density of samples. Take the clustering problem of points
Global characteristics of sample distribution. 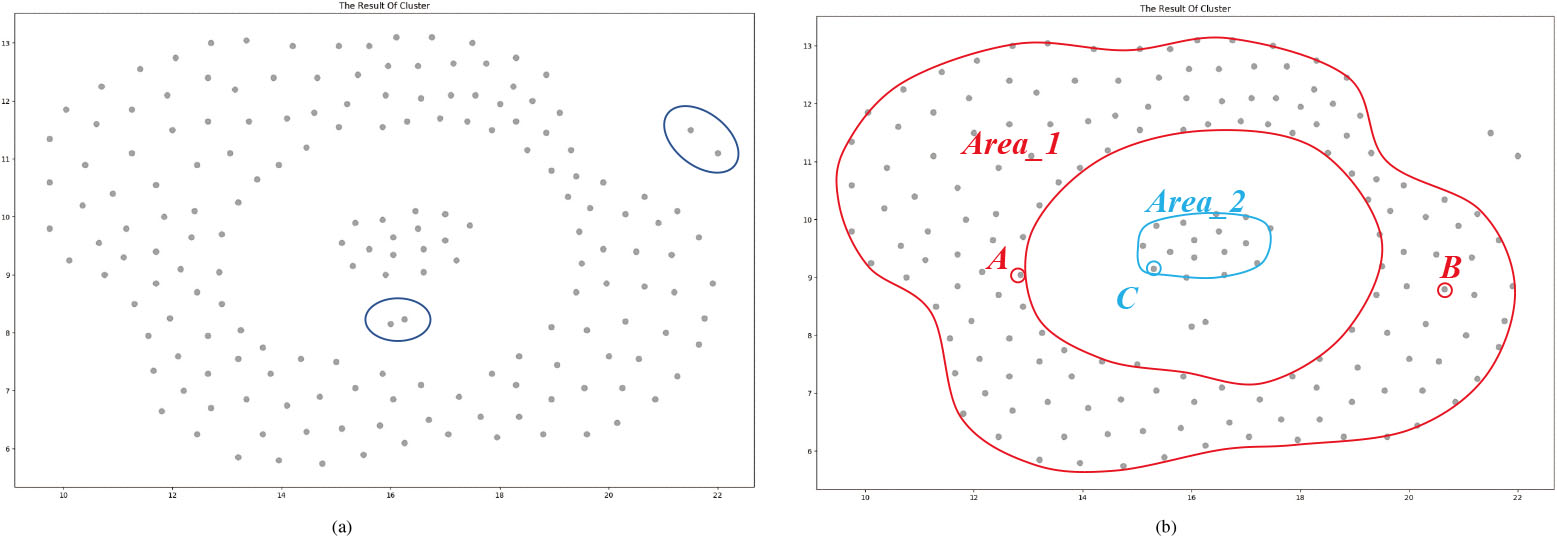
Based on this idea, ECBSB finds cluster boundary closures according to the global distribution of the sample set. However, there are usually noise points in the sample set (such as the points in the circle in Fig. 1a), which will cause serious interference to the clustering of other samples. Therefore, the interference of noise should be eliminated, and then the cluster boundary should be extracted according to the overall distribution characteristics of the sample set. ECBSB consists of the following four steps:
The extended clustering algorithm based on cluster shape boundary is presented in Algorithm 1.
[H] : Framework of ECBSB[1] Raw sample data:
In this section, we introduce the specific implementation method of the extended clustering algorithm based on cluster shape boundary. The pseudocode of the key steps is given, and the flow of the algorithm is explained in detail with the Aggregation [34] dataset. Then, we explain how the algorithm processes noise, and how the parameters are set.
Implementation of ECBSB
Before the implementation of the algorithm, the related variables and concepts are introduced. Sample set
In order to find the boundary points accurately, we need to first remove the edge noise points. The points satisfying the following conditions in the sample set are determined as edge noise points, and are eliminated.
Here,
After the edge noise points is determined, the distance matrix
Taking any sample
In set
Example of boundary point determination.
Taking the two-dimensional sample space as an example, the encoded value
As shown in Fig. 2, the
The core step of ECBSB is to connect the boundary points according to the nearest neighbor search principle to form the boundary closure of the cluster. Before connecting the boundary points, we first define cluster labels and link labels for all points in sample set
We specify a starting point before connecting boundary points. The starting point
Example of boundary closure formation.
For example, the boundary points
We give the pseudocode of the closed cluster boundary process in Algorithm 3. Algorithm 3 randomly selects the points marked as [0, 0] in the set of boundary points as the starting point, and then finds the process points through recursive function. The recursive process is shown in Algorithm 3.
[H] : Closure_formation[1]
: Recursive (Processed_Data,
When the nearest neighbor of the process point is the starting point, the recursion ends. However, when the starting point and the process point are closest to each other, the recursive process easily falls into an endless loop. Therefore, we need to set another threshold; when the number of process points with the same cluster label is greater than this threshold, the process points are allowed to connect with the starting point.
After the boundary closure is formed, the boundary points on the same closure have the same cluster labels. However, ring clusters, such as Area_1 in Fig. 1b, have two boundary closures and two different cluster labels, and thus we need to modify the cluster labels of boundary closures. If the two boundary closures can be connected through non-boundary points, then the two closures can be grouped into one class, and the same cluster label can be used.
According to the nearest neighbor principle, the cluster labels are propagated from the boundary point whose cluster label is not 0 to the sample whose cluster label is 0. As shown in Table 2, Point_i represents the non-boundary points. Column A(1) represents the sample that is closest to the non-boundary points, and column A(N-1) represents the sample furthest from the non-boundary points. Here
Sorting table of distance between non-boundary points and other points
First, we check whether the cluster label of neighbor points in column A(1) of non-boundary points is 0. If it is not 0, the cluster label of the non-boundary point of the corresponding row is changed to the cluster label of the neighbor point. For example, when the cluster label of P2_1 in column A(1) is
Running result chart of each step of ECBSB. 
The time complexity of the ECBSB algorithm is the sum of the time complexity of its four steps, and is expressed as
Processing of edge noise points
There are usually noise points in the sample set. While the existing clustering algorithms usually introduce a threshold to eliminate noise points, when the threshold setting is unreasonable, non-noise points will be removed. Although ECBSB eliminates the edge noise points in Step1, it classifies the edge noise points into the nearest cluster in Step4. It is reasonable to classify noise points into clusters closest to themselves. ECBSB has a high tolerance for noise points, and reduces the probability of misclassification of non-noise points.
Parameters Cnum and Crad
The parameters Crad and Cnum are used to determine and eliminate the edge noise points in Step1; however, it is not easy to determine these two parameters through calculation. We thus suggest to use an interactive method to adjust the two parameters through graphic representation. First, according to the sample distribution, observe the approximate diameter of the smaller clusters in the space. Take 1/4 of the diameter as Crad, and then adjust Cnum. The selected parameters are reasonable when the interconnection between clusters is reduced, and the shape boundary of clusters is protruded.
Experimental and analysics
In this section, we test the performance of ECBSB on benchmark datasets, and compare its performance with those of other clustering algorithms via ACC and other indicators. All experiments are implemented in MATLAB2020. The experimental results verify the effectiveness of ECBSB.
All algorithms follow the same principle of parameter selection as the original algorithm. In K-means, K-means++, DPC, and SC algorithms, we take the real clustering number as the
Experimental setting
There are eight benchmark datasets used for testing: six labeled datasets and three unlabeled datasets [23, 37, 38, 39, 40]. The shape of clusters in each dataset is different, with different features such as embedding, connection, and density overlap. The details are shown in Table 3.
The two clusters in the Flame dataset are connected, and the whole cluster is in the shape of an arrow; the clusters in the Compound dataset overlap each other, and the dataset contain an embedded structure; in the Aggregation, Triangle2, Xclara, and D31 datasets, the clusters are elliptic convex clusters, but they are connected and have noise; the shape of clusters in PanelB, T4.8k, and T5.8k datasets are complex, and there are a lot of noise samples and artifacts between clusters.
Datasets
Datasets
In this paper, in order to quantitatively describe the performance of the proposed algorithm on each dataset, we use four common external indices and one internal index: ACC, NMI, ARI, F-measure, and DBI [1, 2, 3].
As shown in Fig. 5, on the Flame dataset, although the two clusters are highly interconnected, ECBSB can identify clusters similar to the arrow shape, because the interconnection between clusters has been reduced after Step1. The Compound dataset contains an embedded structure, but this does not affect the formation of the boundary closure, and thus ECBSB can accurately identify the embedded structure. The T4.8k dataset contains many clusters with complex shapes and artifacts, but ECBSB can also accurately find the cluster boundary, and automatically determine the number of clusters according to the boundary closure. The idea of ECBSB is also applicable in the three-dimensional sample space. It only needs to adjust the cluster boundary closure method in Step3. In this paper, the Delaunay triangulation algorithm is used to connect boundary points to form a three-dimensional boundary closure, as shown in Fig. 5d.
Experimental results of ECBSB.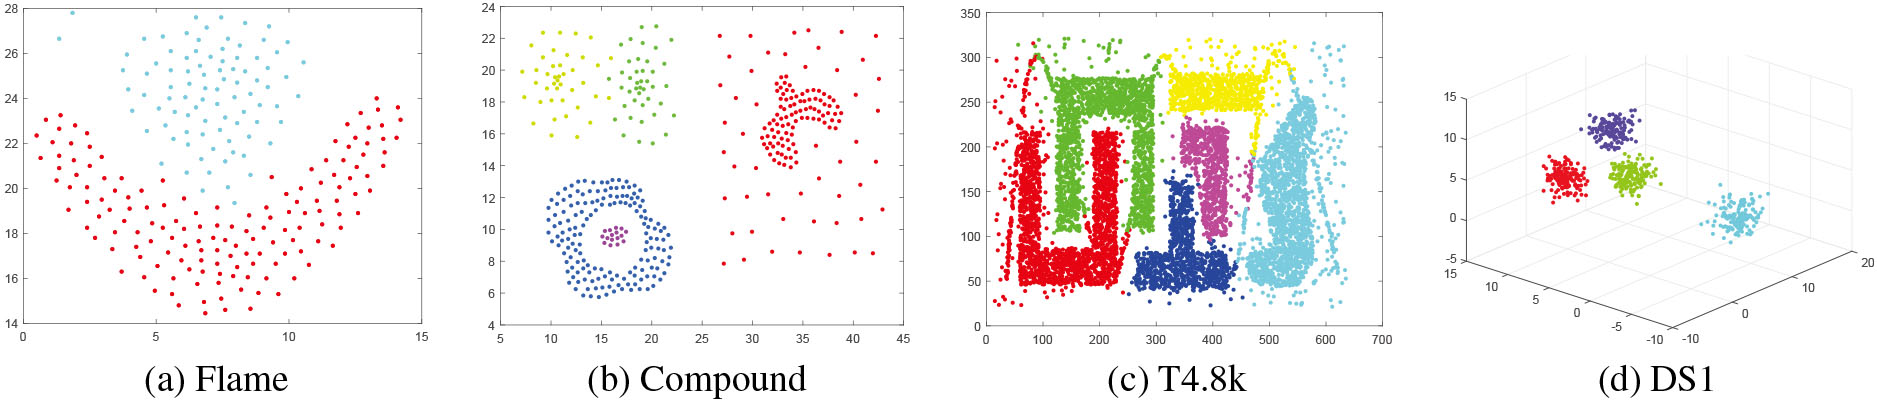
The results of four algorithms are compared when the density distribution of clusters is not uniform.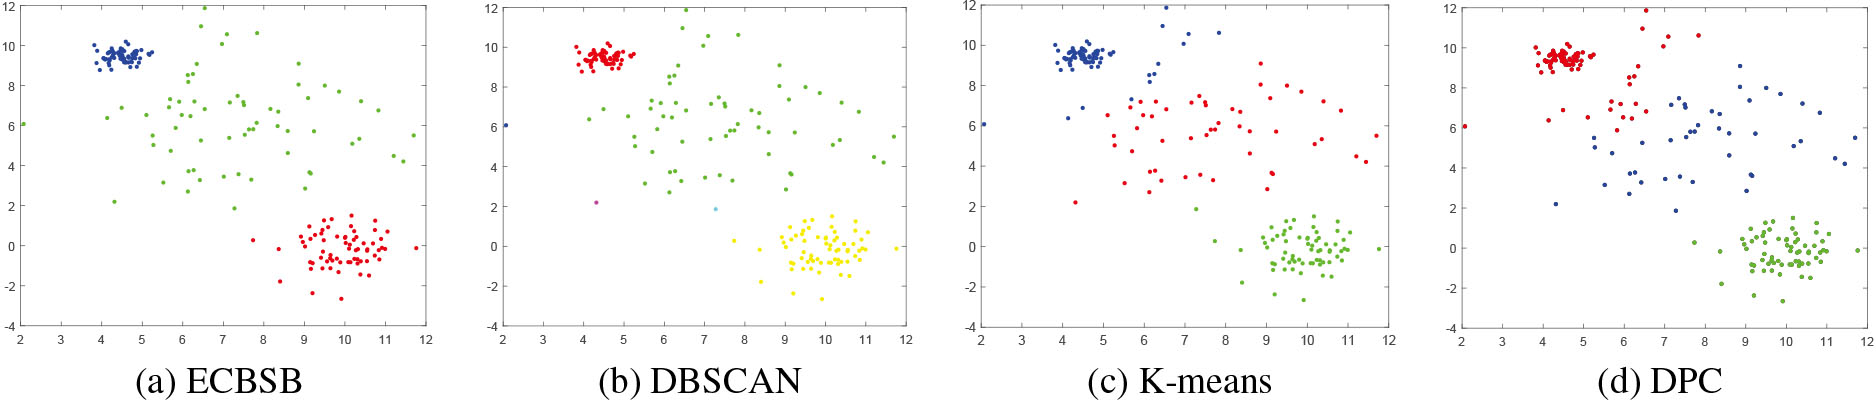
As shown in Fig. 6, the original sample set consists of three clusters with normal distribution, but the density distribution of clusters is not uniform. In this condition, only ECBSB can accurately identify the three clusters (Fig. 6a). Because of the low density and sparse distribution of the green cluster, DBSCAN does not accurately identify the boundary part of the red cluster, as shown in Fig. 6b. Meanwhile, influenced by the high density of the black cluster, K-means and DPC gather the samples belonging to the red cluster into the black cluster (Fig. 6c and 6d).
Comparison of evaluation indexes of different algorithms
We compare the ECBSB algorithm with K-means, K-means++, DBSCAN, DPC, and spectral cluster (SC) algorithms on different datasets, and the results are presented in Table 4. The K-means algorithm and K-means++ algorithm perform well on convex datasets, but their performance is significantly lower than that of the ECBSB algorithm on nonconvex datasets. The scores of the DBSCAN algorithm on six datasets are lower than those of the ECBSB algorithm, because the parameters of the DBSCAN algorithm can only reflect the local attributes of the sample distribution; while the parameters of the ECBSB algorithm reflect the global characteristics of the sample distribution. The DPC algorithm is better than the ECBSB algorithm on convex datasets Xclara and Triangle2, but performs worse than the ECBSB algorithm on nonconvex datasets. Spectral clustering can reasonably find the structural characteristics of the data distribution, and its score on each dataset is similar to those obtained by the ECBSB algorithm.
However, the K-means algorithm, K-means++ algorithm, and spectral clustering algorithm need to specify the number of clusters according to prior knowledge, which is difficult to achieve in practice. Conversely, the ECBSB algorithm can independently determine the number of clusters by finding the number of cluster boundaries. Moreover, the DBSCAN algorithm is sensitive to the density of clusters, especially when the density difference is large. Although the DPC algorithm provides a decision graph for its user’s reference, the number of clusters still need to be set manually. Meanwhile, the ECBSB algorithm can find the shape and structure of clusters according to the global characteristics of the data distribution, and determine the number of clusters independently according to the number of boundaries. Furthermore, it can obtain better clustering results when the density distribution among clusters is uneven. The clustering results of the six algorithms on different datasets are shown in the appendix.
Conclusion and future work
An extended clustering algorithm based on cluster shape boundary proposed is to find the shape boundary of clusters from the global perspective of sample distribution, and then extend the boundary to the cluster center to realize clustering. Moreover, ECBSB can automatically determine the number of clusters according to the number of boundary closures, and can identify clusters with complex shapes. Finally, numerous experiments are carried out on benchmark datasets, and the results show that ECBSB outperforms DBSCAN, K-means, K-means++, DPC, and spectral clustering algorithms.
The idea of ECBSB is applicable to high-dimensional space, but its operability is poor. Therefore, this paper only gives a method to find the shape boundary of clusters in low-dimensional data space. Our next work will apply ECBSB to the high-dimensional data space and explore the method of building a shape boundary in the high-dimensional space. Additionally, we note that ECBSB is not suitable for those clusters without boundary points or boundary closures. This needs to be addressed to improve the adaptability of ECBSB to different datasets.
Footnotes
Acknowledgments
This work was supported by the National Natural Science Foundation of China under Grants 61825305.
Appendix A. Comparison results of different algorithms
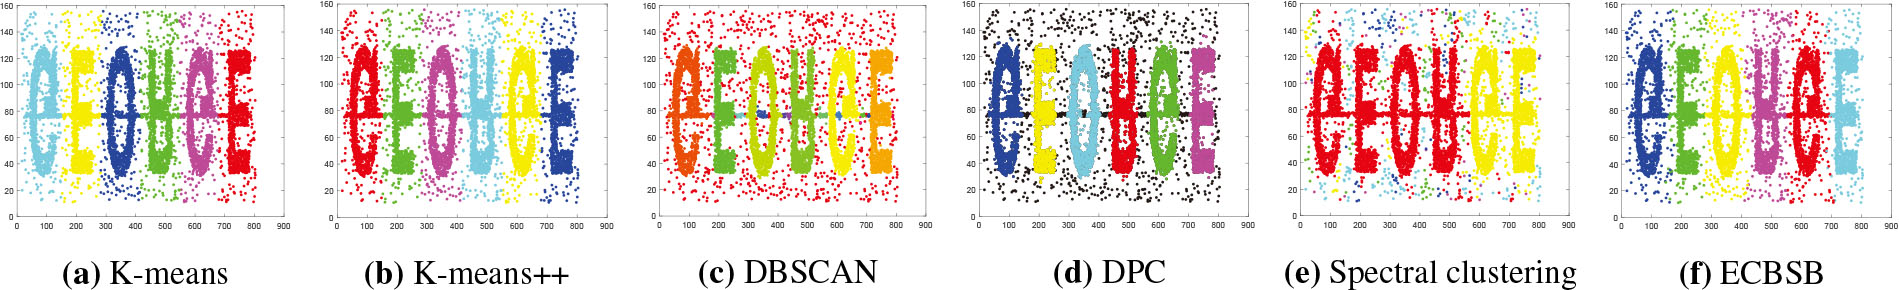
This appendix presents the performance of six algorithms on different datasets, as shown in Fig. 7 to Fig. 14.
As shown in Fig. 7, the clustering results of ECBSB, spectral clustering, and DBSCAN algorithm are basically correct, but DBSCAN recognizes many data as noise points. K-means, K-means++, and DPC algorithms fail to identify arrow shaped clusters on the Flame dataset. Only the ECBSB algorithm can find the embedded structure in the Compound dataset, and the number of samples identified as noise is far less than that identified by the DBSCAN algorithm, as shown in Fig. 8. On the Aggregation and PanelB datasets, the clustering results of K-means and K-means++ algorithm are obviously wrong due to the large impact of density, as shown in Fig. 9 and Fig. 10.
The clustering results of the ECBSB algorithm and other five algorithms are basically the same in Fig. 11 to Fig. 13. In clusters with complex shapes, the ECBSB algorithm can achieve the same results as K-means and K-means++, as shown in Fig. 14.
Flame.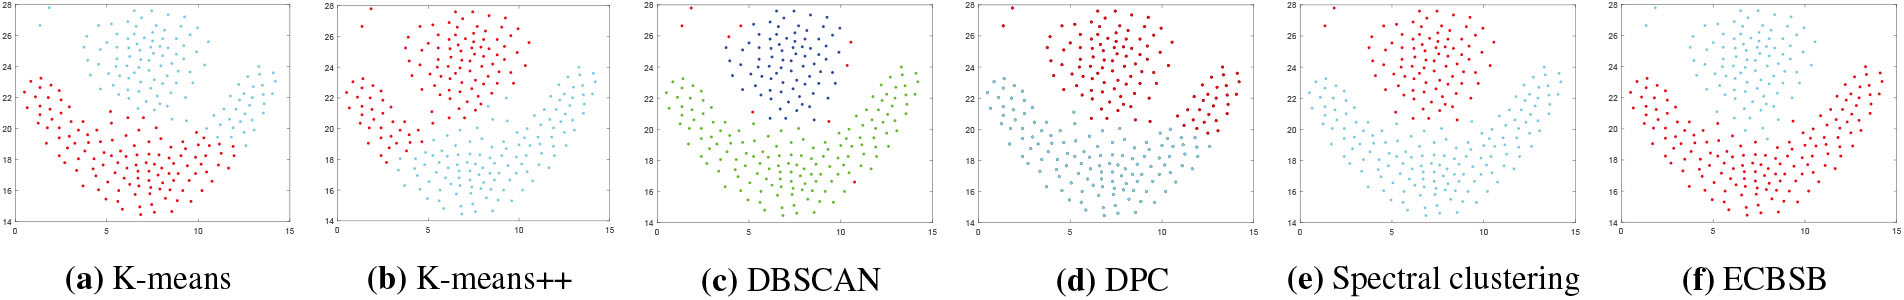
Compound.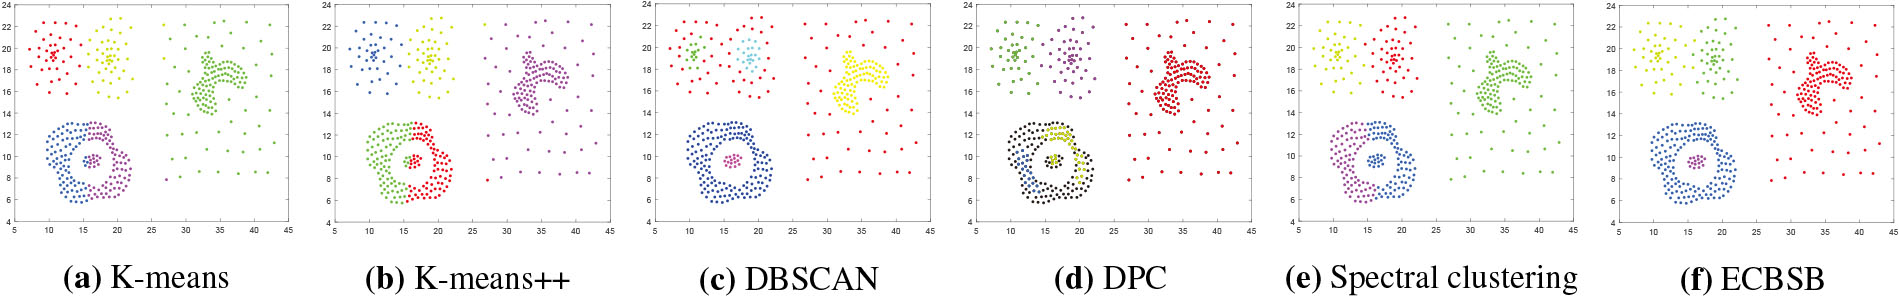
Aggregation.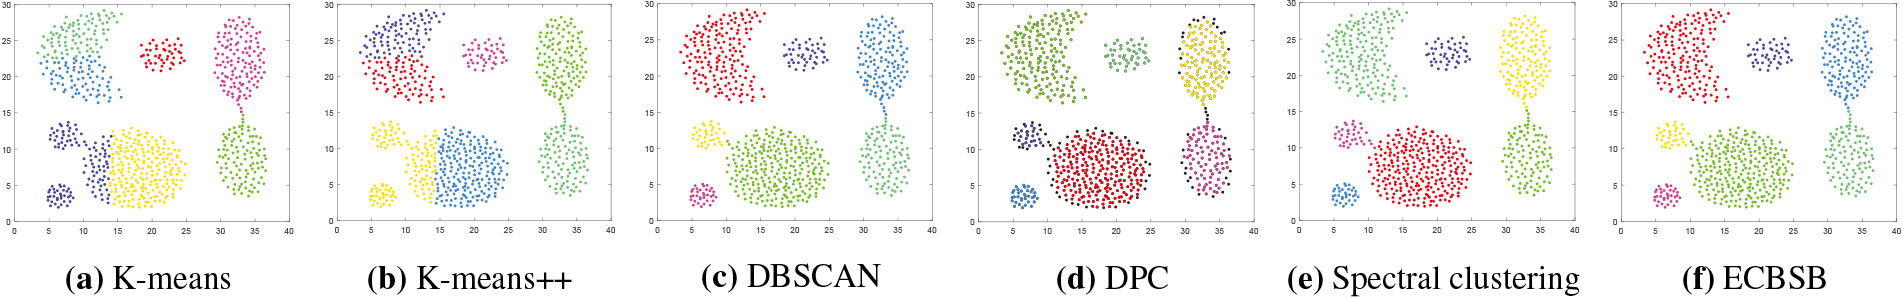
PanelB.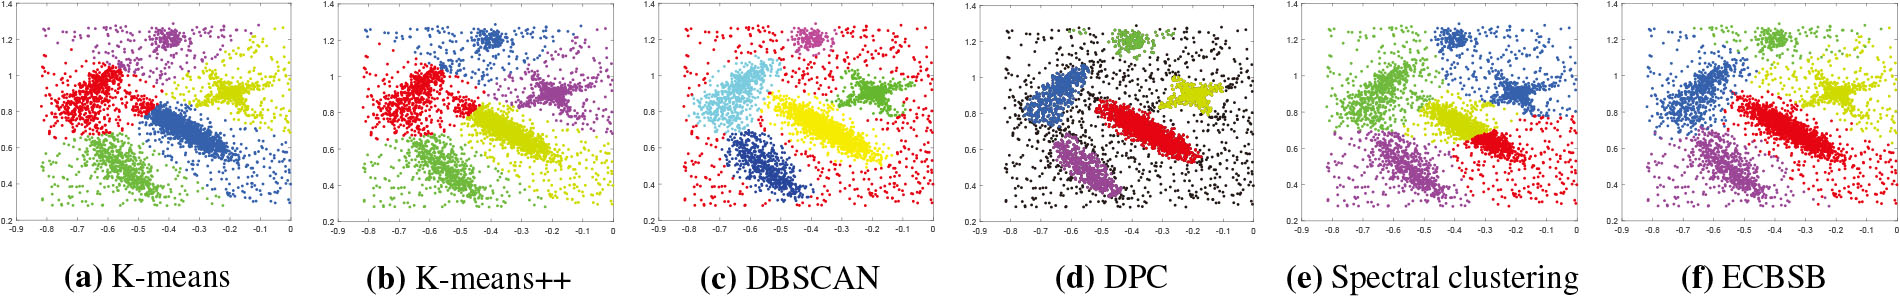
Triangle2.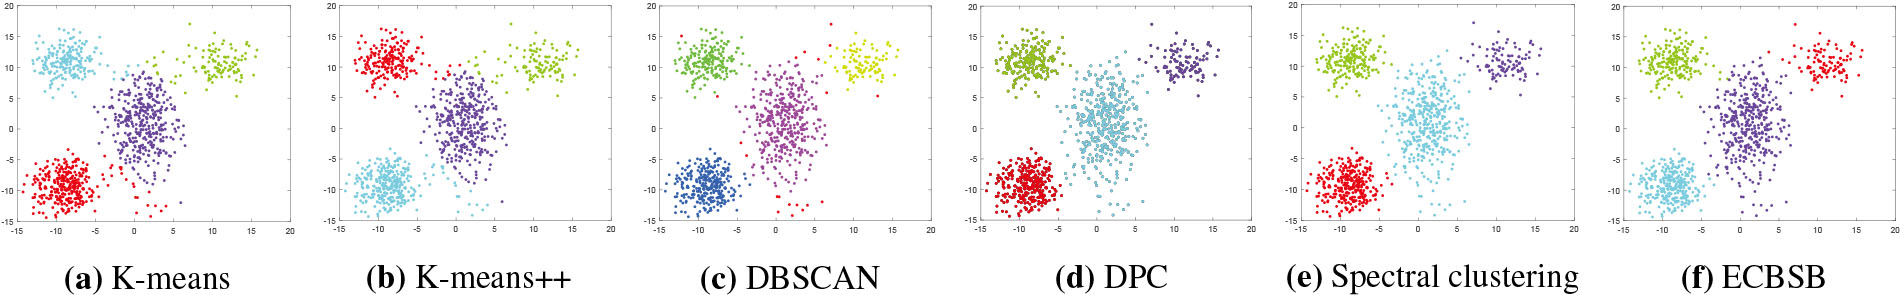
Xclara.
D31.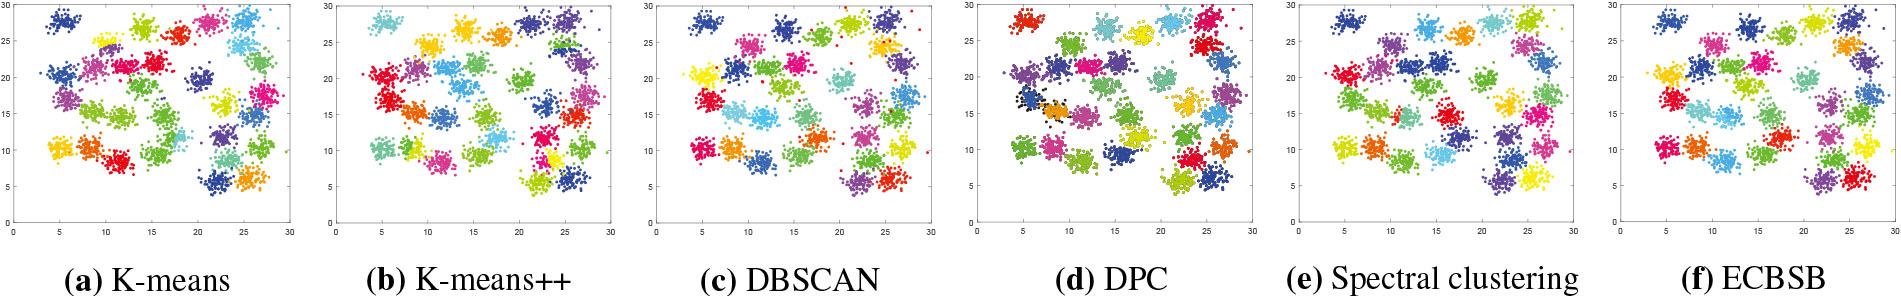
T5.8k.