
Abstract
In the field of computer-aided design (CAD) and three-dimensional (3D) modeling, constructive solid geometry (CSG) representations based on primitive 3D shapes and boundary representations (B-Rep) based on geometry and topology are widely used to represent complex shapes. Therefore, it is important to recognize primitive shapes such as cubes, cones, and cylinders and to accurately judge and classify the deformation of primitive shapes. For this purpose, various techniques have been studied, such as a vector-based determination method, a determination method using multiple images from various angles, and a determination method based on positional relationships between points. However, because large datasets are required to classify these shapes and it is difficult to respond to changes in shape due to rotation, the resulting recognition accuracy is not always high.
In this work, we propose a method based on solid angles, which do not depend on the positional relationship of vectors, viewpoints, or changes due to rotation, as feature quantities. We demonstrate the effectiveness of primitive 3D figures using features based on solid angles. In addition, we show that the presence or absence of deformation can be determined when part of a primitive 3D figure is deformed.
Introduction
In computer-aided design (CAD) and three-dimensional (3D) modeling, methods such as constructive solid geometry (CSG) representation and boundary representation (B-Rep) are used to represent complex shapes [1, 2]. With the recent spread of 3D printers, it has become easier to create and output 3D shapes. However, because 3D data are generally composed of triangular meshes, shapes with a higher complexity require a greater number of meshes; thus, editing becomes more difficult. In addition, considering the printing area of 3D printer, difficulties arise in dividing the data into appropriate areas for printing [1, 3, 4, 5]. Therefore, a method for converting shapes to editable CSG representations using primitive shapes and values is currently being studied [1, 6].
In contrast two-dimensional (2D) shapes, 3D shapes inevitably require a large amount of data. In addition, unlike plane figures, 3D shapes change greatly depending on the viewpoint. Therefore, it is extremely difficult to determine and classify a 3D shape [7, 8]. In general, for the determination of 3D shapes, feature quantities based on vectors, point-to-point relationships, and images obtained from multiple viewpoints have been studied [9]. However, large datasets are required for learning, and universal solutions are not always possible [9, 10, 11].
In this context, we focused on solid angles and evaluated their effectiveness in order to obtain features that are independent of viewpoint and rotation. In this paper, we classified figures with a focus on the primitive shapes used for CSG representation, which are widely used in the field of shape modeling for computer graphics (CG) and CAD. In addition, we determined whether the presence or absence of deformation can be confirmed for primitive shapes subjected to local deformation.
Related works
Solid angle
A solid angle is the 3D equivalent of a 2D angle [12]. A solid angle,
Definition of a solid angle [13].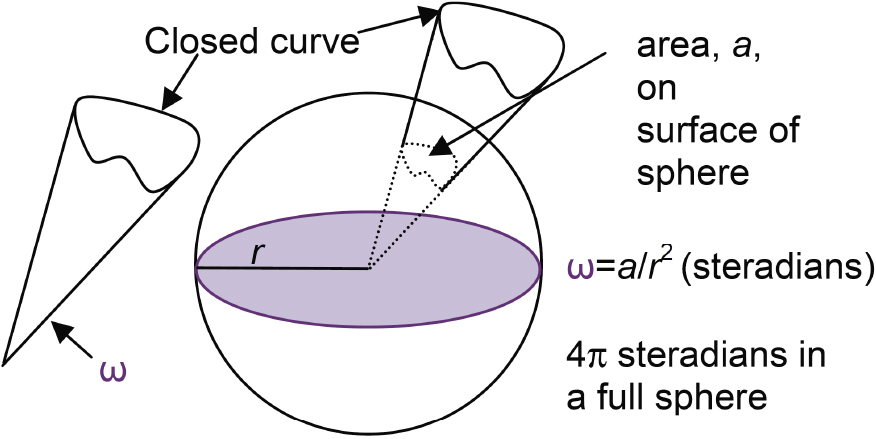
Determining whether a point is within or outside a polygon based on the solid angle [15].
Because the surface area of a sphere is
In general, the solid angle (Fig. 3) can be obtained from Eq. (1):
where
In Eq. (3),
Relationship between polygons and spherical trigonometry [15].
This method allows inside/outside determination for non-convex shapes, similar to applications in 2D space (Fig. 4). However, rather than processing positive and negative angles of 2D shapes (Fig. 5), positive and negative values for a 3D shape are determined according to the input order of the data (Fig. 6).
By the using the solid angle, accurate calculations can be performed for complicated 3D shapes; however, the determination requires a very long time because trigonometric functions are frequently used [14, 16]. Therefore, when analyzing complex shapes using solid angles, general-purpose computing on graphics processing units (GPGPU) may be required, depending on the object size and analysis range [15, 17].
Internal and external judgment in 2D space [15].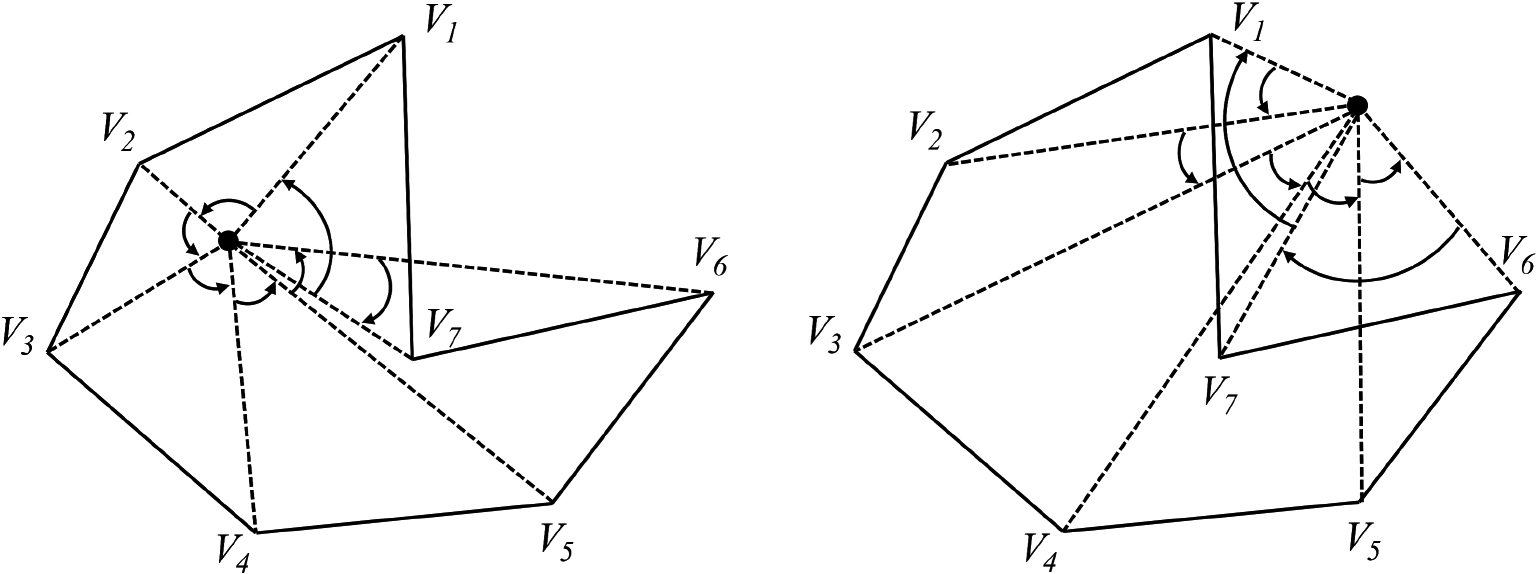
The shape results in positive and negative angles [15].
Example of positive and negative positional determination in relation to a polygon [16].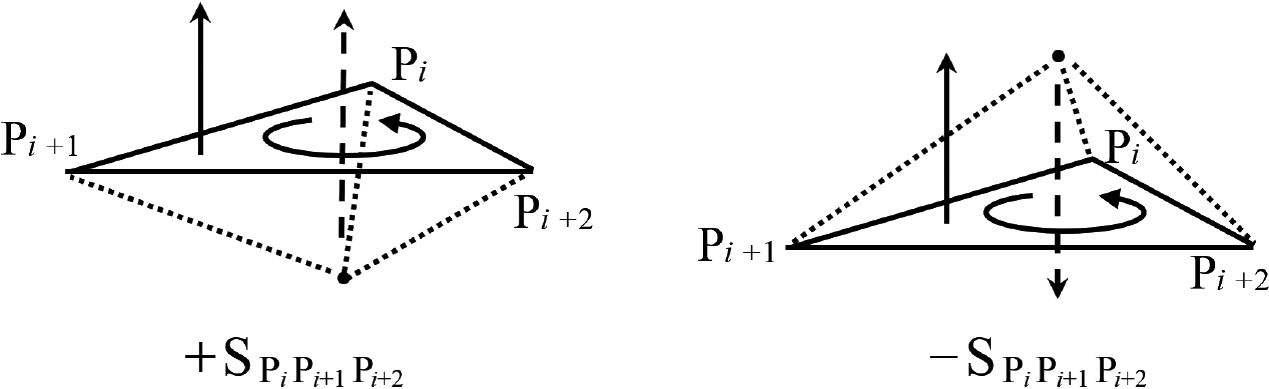
There are various methods for representing an object, with solid modeling being the most commonly used technique. The two prominent methods for expressing solid models are CSG modeling and B-Rep modeling [18, 19].
CSG represents visually complex shapes by combining basic 3D shapes called primitive shapes. For example, as shown in Fig. 7, one can create a new 3D shape by combining two primitive 3D objects in a stack. Although the types of primitives that can be handled differ depending on the CAD application, these shapes generally include cubes, cuboids, spheres, cylinders, cones, and pyramids [20].
The process of creating shapes by combining objects [21].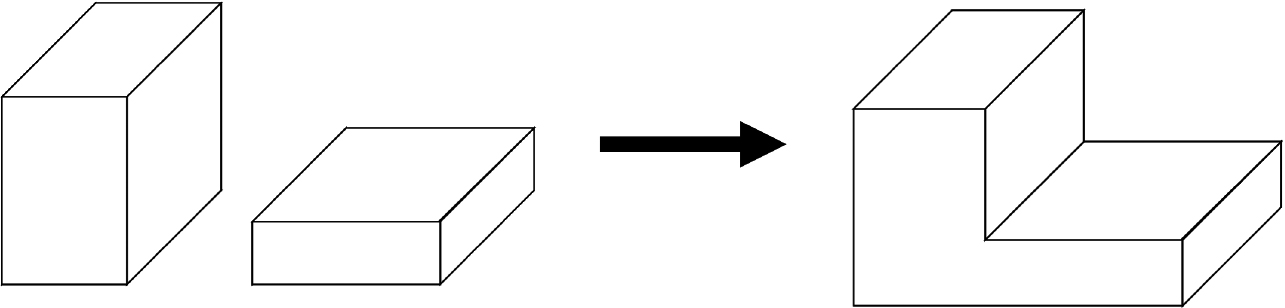
In general, the process of combining primitive shapes is a Boolean operation, and the combination methods include union, difference, and intersection methods (Fig. 8) [21, 22].
Shapes produced by Boolean operations [21].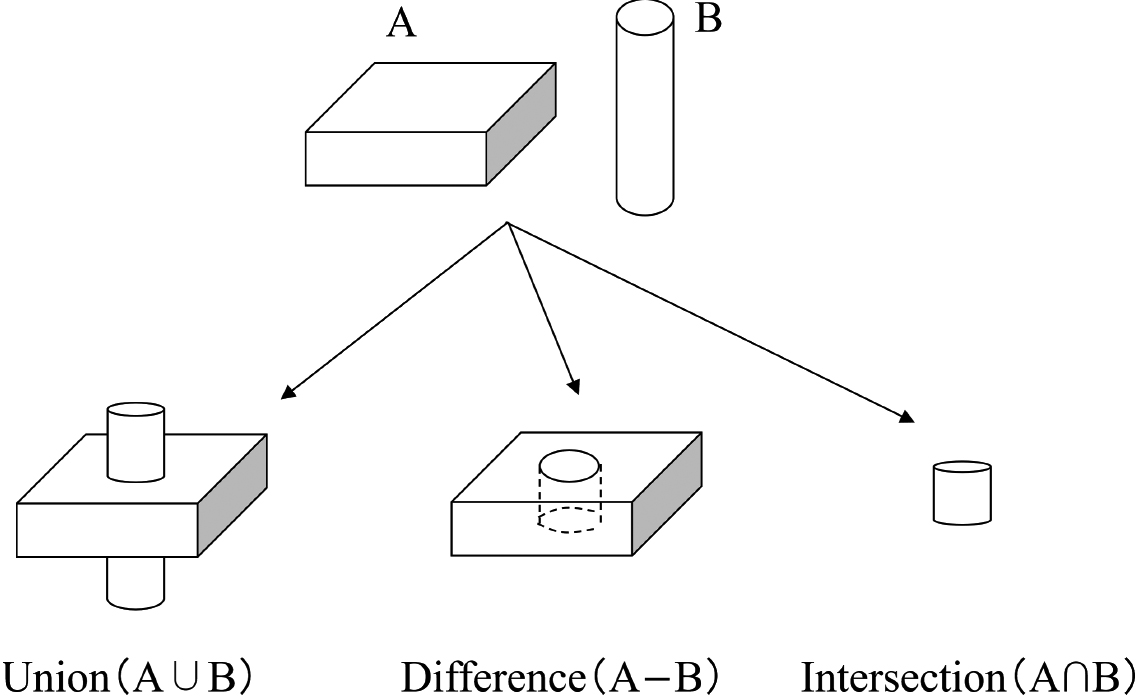
The result of the Boolean operation is stored as a tree structure (Fig. 9). Because this representation method is relatively simple, one can perform 3D modeling even by scripting. Moreover, the characteristics of this method are suitable for parametric modeling [23].
Creating complex shapes with Boolean operations [21].
B-Rep is another type of solid model representation method. For example, as shown in Fig. 10, the B-Rep model is represented not by the 3D shape itself, but by the connection of shapes, such as planes [24].
Representation by B-Rep [21].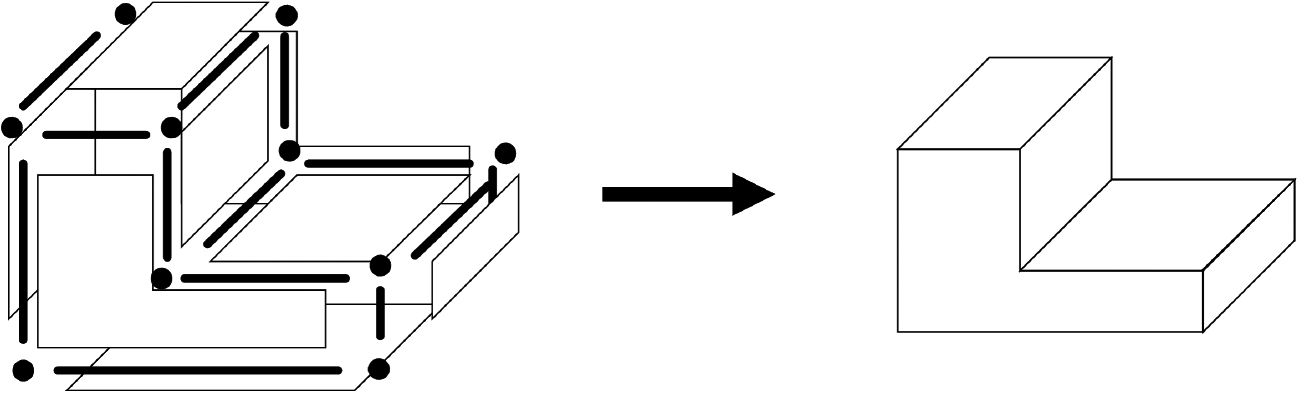
A B-Rep model is not represented solely by the shape itself, which is a topological entity, but by a data structure that represents the graph structure of the elements that compose the shape as well as the shape itself, such as points, curves, and surfaces, which are geometrical entities. In general, topological entities include components such as vertices, edges, faces, and shells, while geometrical entities include simple straight lines, arcs, planes, cylindrical surfaces, or parametric representations such as Bezier, B-spline, and NURBS (Figs 11 and 12).
Creating complex shapes with B-Rep [21].
Illustration of the basic B-Rep structure. The data model comprises geometrical entities and topological entities [24].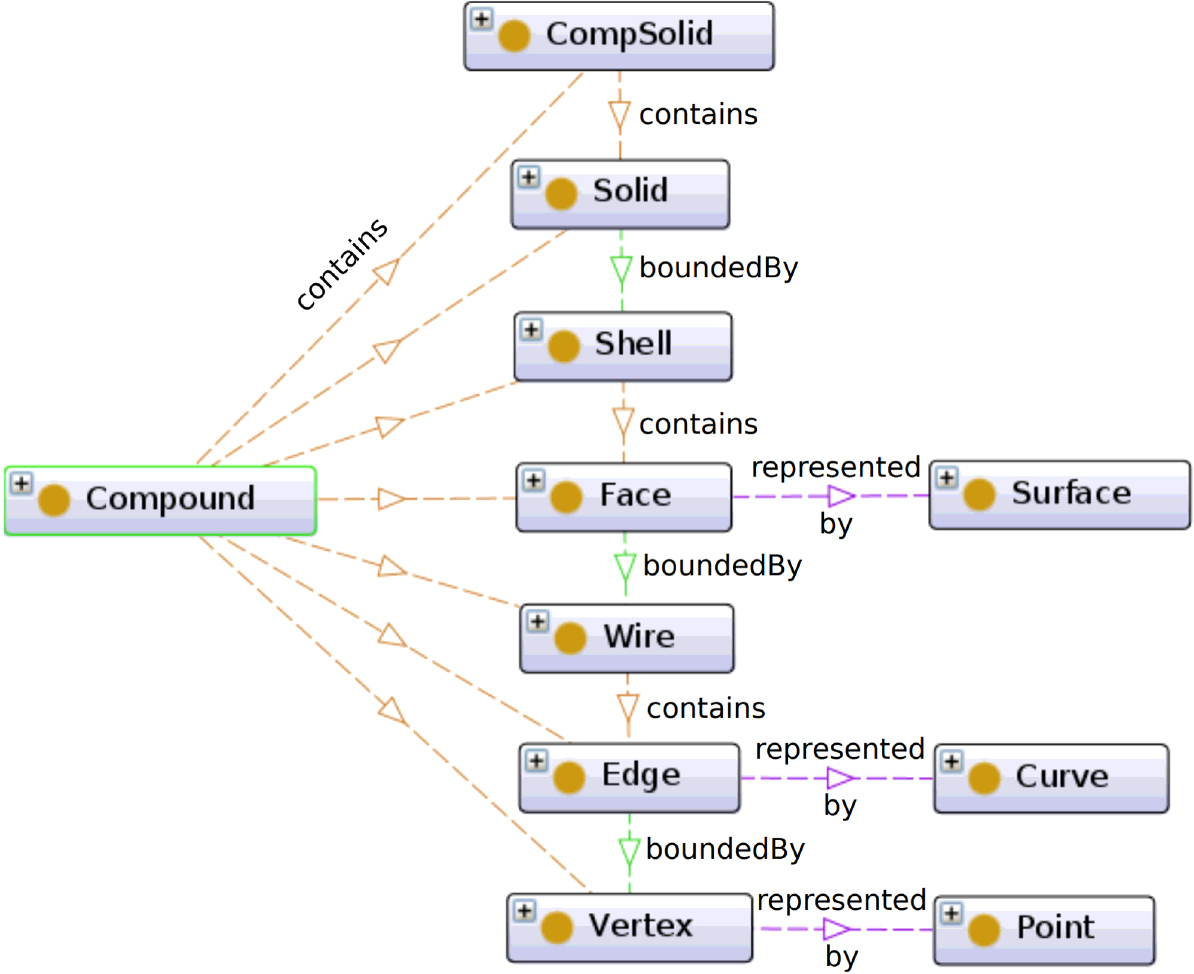
A support vector machine (SVM) is a binary classifier that uses supervised learning. An SVM uses linear input elements to learn from training samples to find the margin-maximizing hyperplane that maximizes the distance to a data point (Fig. 13) [25, 26].
SVMs maximize the margin around the separating hyperplane [26].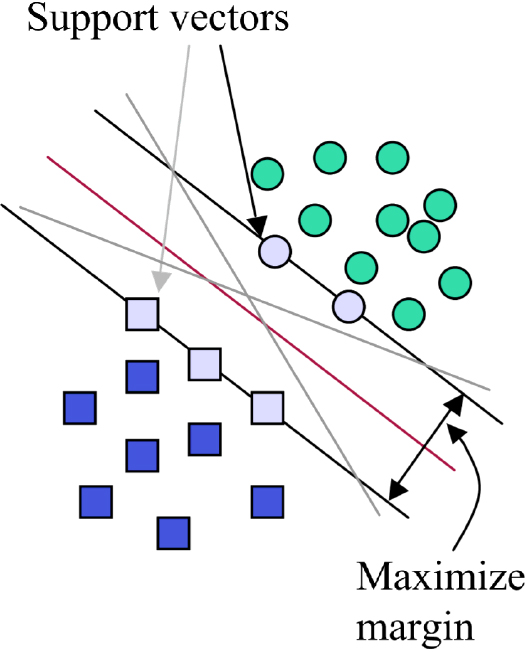
Linear discrimination is a typical method for two-class classification problems, in addition, linear discrimination has been combined with the kernel learning method to construct a nonlinear discriminant function. This method is currently one of the best learning models in term of recognition performance among many discrimination methods [27, 28]. As an extension of SVMs, soft-margin SVMs and data mapping to a nonlinear high-dimensional feature space using the kernel method have been proposed [29, 28].
In the kernel method, the original feature vector
Nonlinear classifier using the kernel trick [32].
One of the most commonly used kernel functions is the radial basis function (RBF) kernel [30], as given in Eq. (4).
In the case of RBF kernels, the kernel trick is equivalent to making the nonlinear feature vector
Logistic regression (left) with the decision boundary denoted by a solid line and an SVM with the RBF kernel (right) on the Scikit-learn half-circles dataset. Support vectors are denoted by circles, and margins are denoted by dashed lines [33].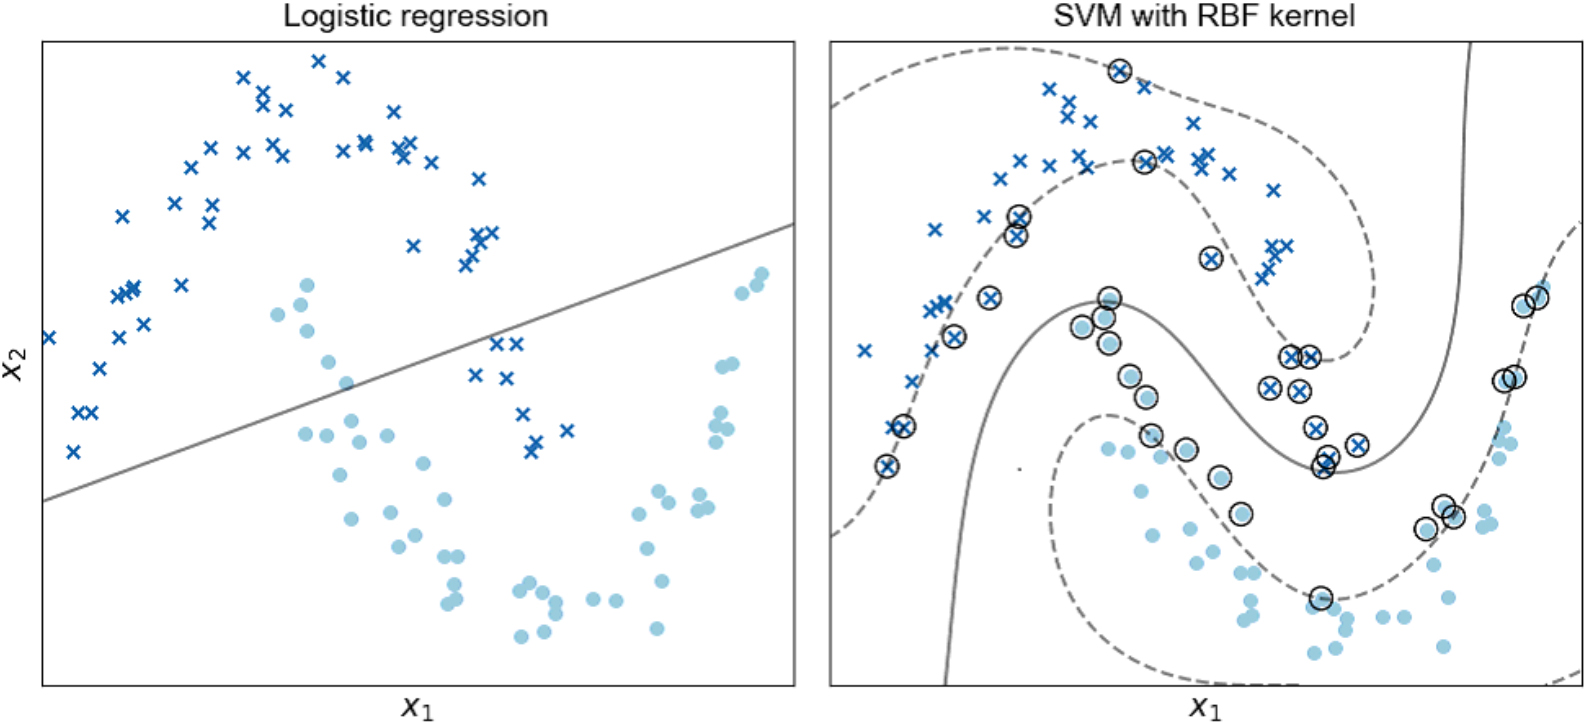
Currently, open-source machine learning libraries such as Scikit-learn [34, 35, 36], LIBSV [37, 38], and dlib [39, 40] are available for easy use of SVMs [41]. The effectiveness of these libraries and the results of machine learning using these resources have been reported in the literature [42, 43].
Voxel-based solution
A voxel is an element of volume, representing the value of a normal lattice unit in 3D space. The voxel is an extension of data pixels in 2D images and is often used for visualizing and analyzing medical and scientific data. Although voxels have been used for a long time, their use has recently increased due to the continuous development of CPUs and graphics hardware [44]. Voxelization is often used because of its simplicity and ease in processing [45].
In previous work, a method of voxelizing to
Learning by voxelization [10].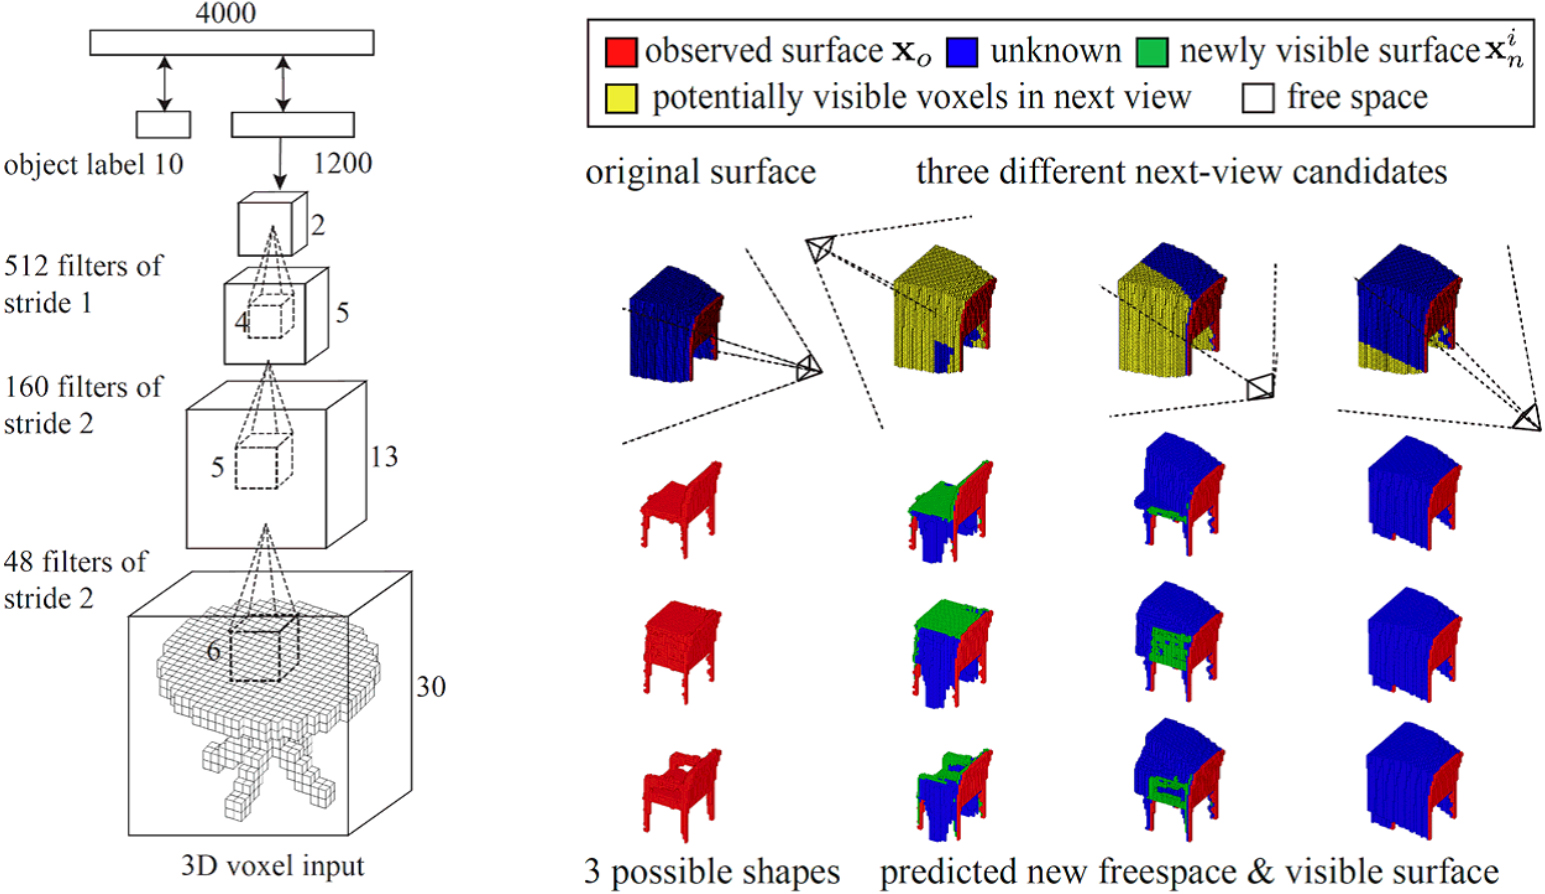
Learning by the multi-view method [49].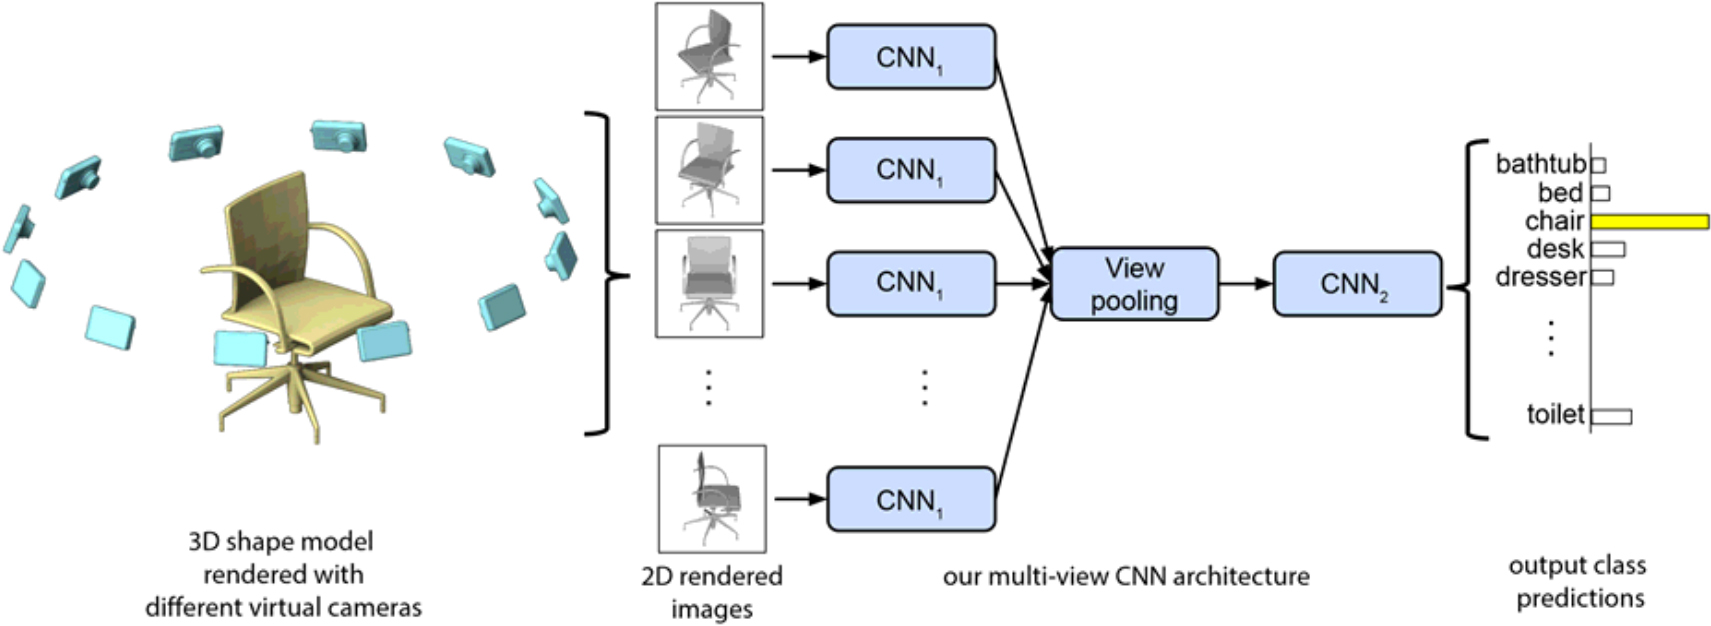
Because the display accuracy depends on the size of each voxel or grid cell, the resolution of this method is low, and it is difficult to improve the recognition accuracy [47]. Further, if the voxels are smaller, a more detailed representation can be obtain, but the memory increases in proportion to the third power of the voxel length [48].
The multi-view method provides object recognition and learning by predicting 3D shapes based on 2D images obtained from various angles. Previous studies using this method have shown that the use of additional data increases the categorical recognition accuracy by 8% compared with voxel-based ShapeNet [49].
In this method, a large number of virtual cameras pointing toward the center of gravity are arranged around the axis to create a number of 2D rendered images, and 3D shapes are compared based on these images. Subsequently, images of many cameras around the axis are individually input to a convolutional neural network (CNN), and the obtained feature map is integrated by a view-pooling layer to obtain invariance with respect to rotation around the axis (Fig. 17) [49, 50].
In recent studies, attention fusion has been conducted based on multi-view images and point clouds to improve accuracy [51].
Spin image solution
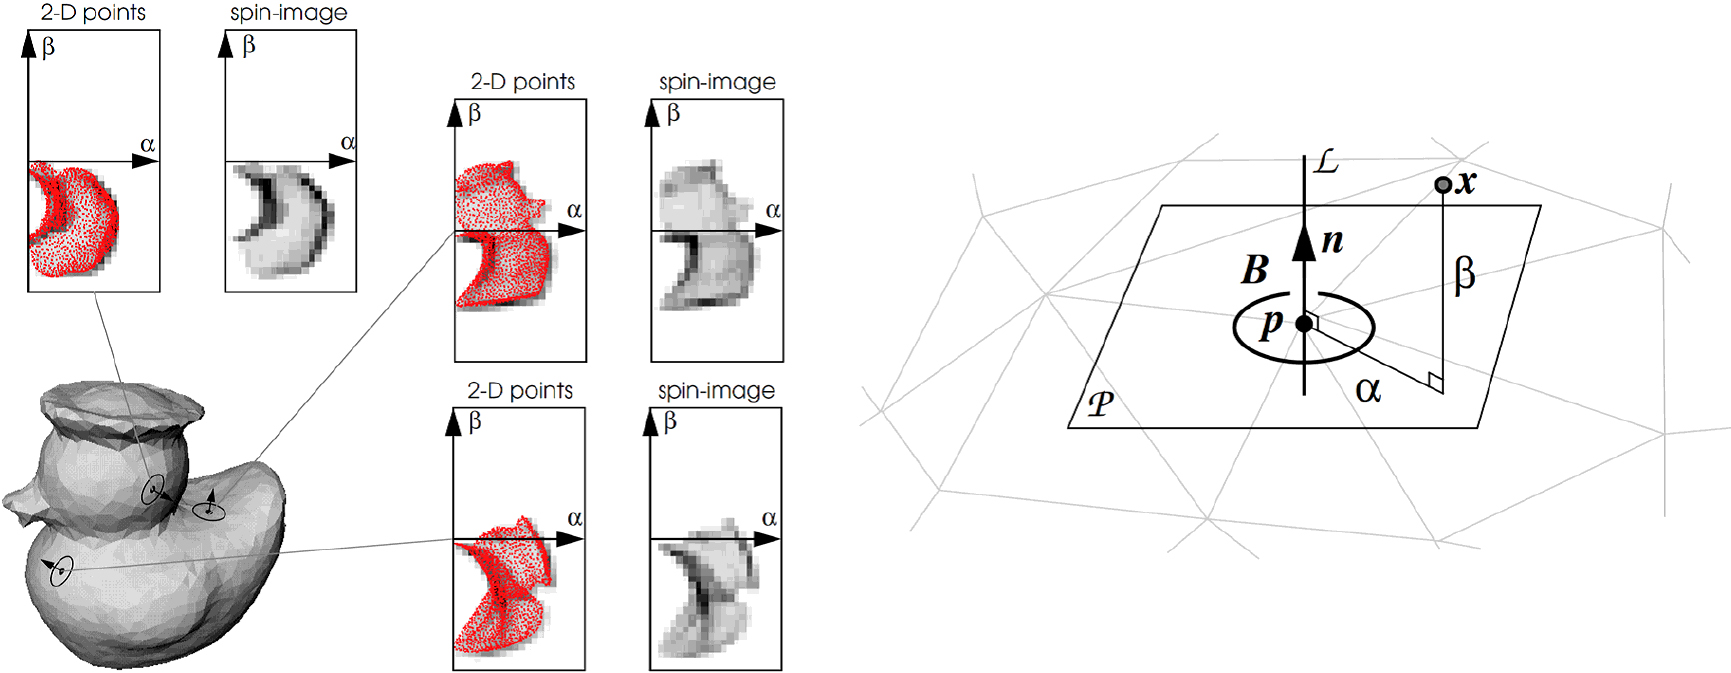
Johnson and Hebert generated a spin image by rotating the surrounding vertices on a cylindrical surface centered about the normal vector of the vertex [52, 53]. The authors then proposed a method of correspondence by performing a similar image search using spin images compressed by primary component analysis [54].
Current research aims to collate the information with an input distance image by projecting the positional relationship with respect to the peripheral points in 2D based on the normal vector at the target point of the model and acquiring posture-independent features (Fig. 18) [55, 56, 57].
Although this method can perform matching independently of the viewpoint, points having similar local shapes may be selected because the points used for matching are randomly selected at all points of the object model; thus, mismatching can occur. In addition, because many points are used for matching, the processing cost is high [58, 59].
Deep learning
For learning and recognition, deep learning methods have been studied, using feature quantities obtained by the voxel-based, multi-view, an spin image solution described above [8, 9, 60]. However, unlike 2D shapes, 3D shapes must be observed from various directions in order to determine whether the object remains the same when rotated [7]. In addition, the rage of notable shapes may be broad, or a detailed range may be required. Therefore, it is difficult to apply a learning method using CNNs (Fig. 19) [61, 62].
Deep learning method for 3D figures [61].
Rather than applying conventional methods, we propose a method for classifying primitive figures using solid angles as features.
As described above, the processing required for a solid angle can be time-consuming because many trigonometric functions are used. Further, when a solid angle is obtained for all points of a 3D object, the dataset becomes huge and the number of unnecessary target points increases. Therefore, as shown in Fig. 20, we applied the solid angle inside the target object within the radius r of each vertex of the given 3D figure.
The proposed method targets the solid angle inside an object within a radius 
Differences in data input methods for 2D and 3D shapes.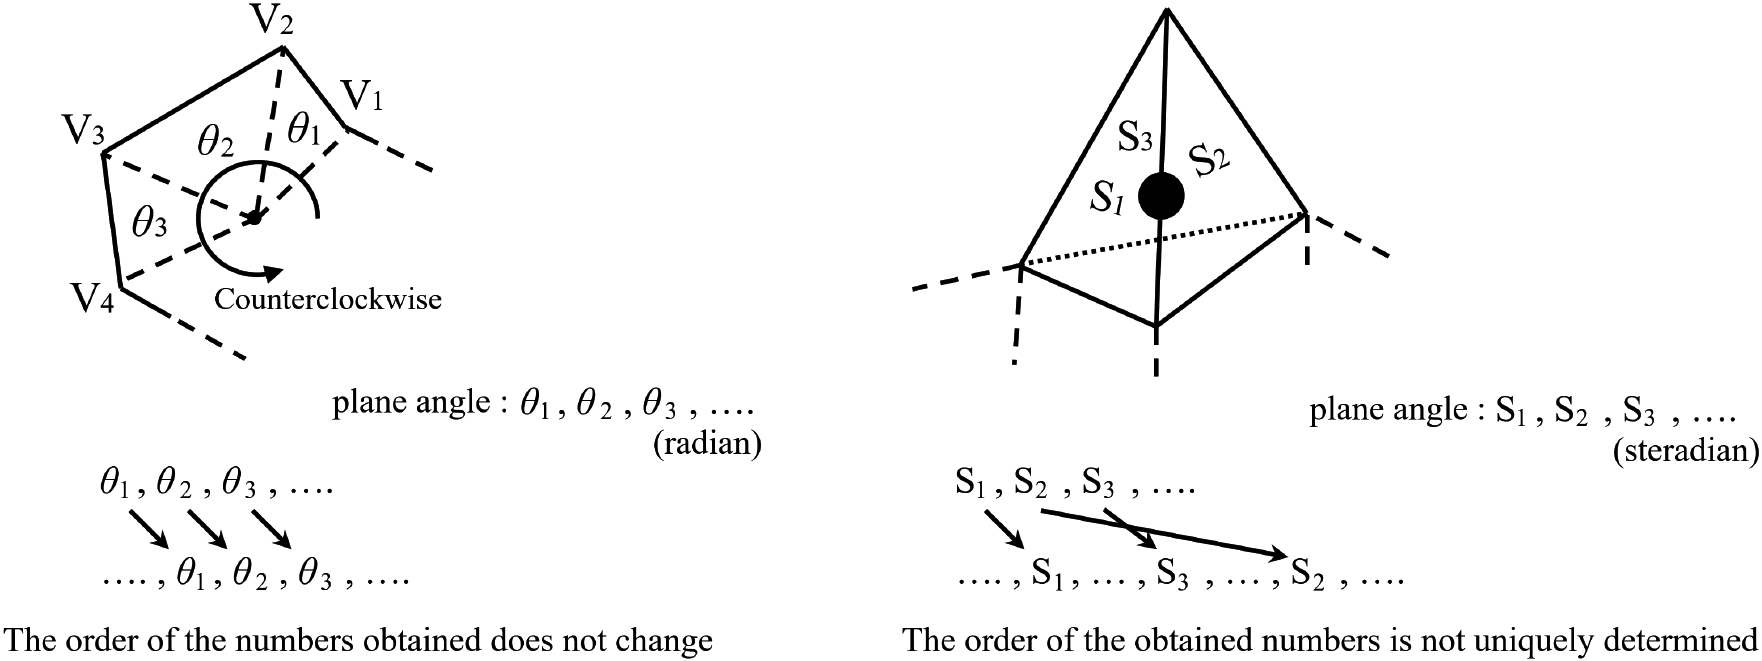
Process of acquiring features for classification.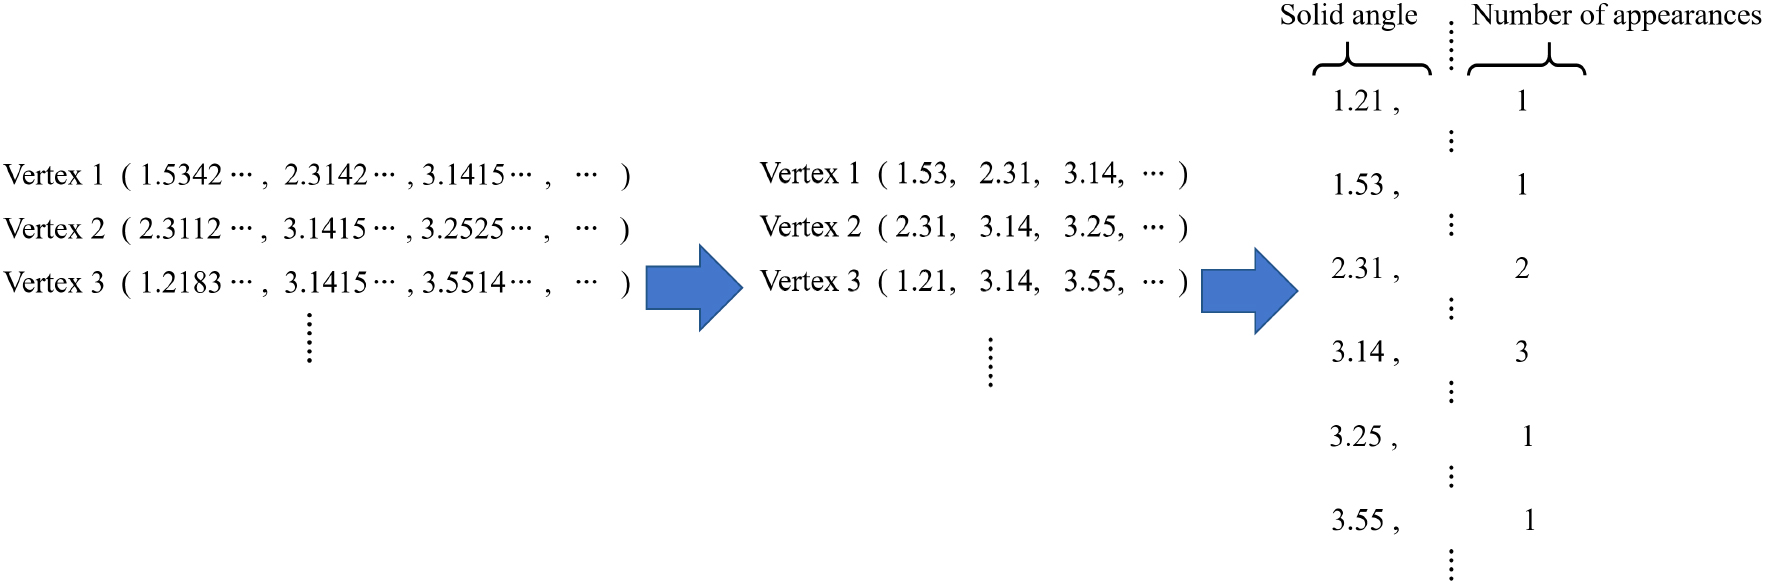
Changes in solid angle due to differences in the 3D shape.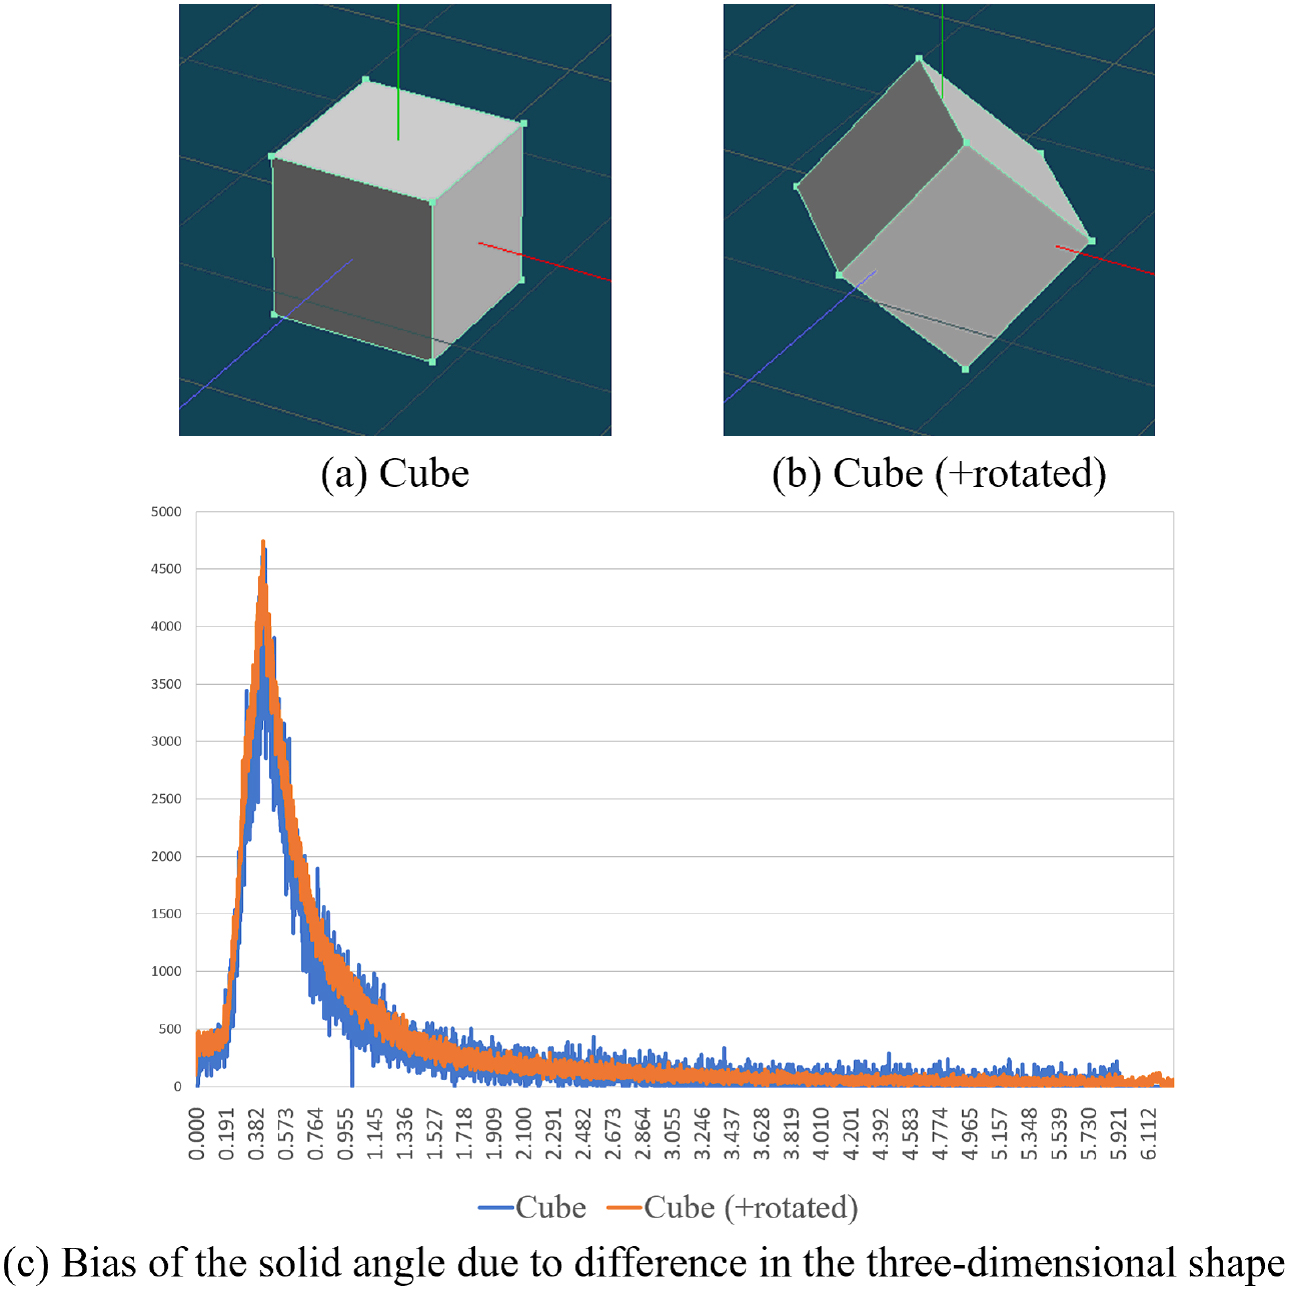
Changes in solid angle due to differences in the 3D shape.
Changes in solid angle due to differences in the 3D shape.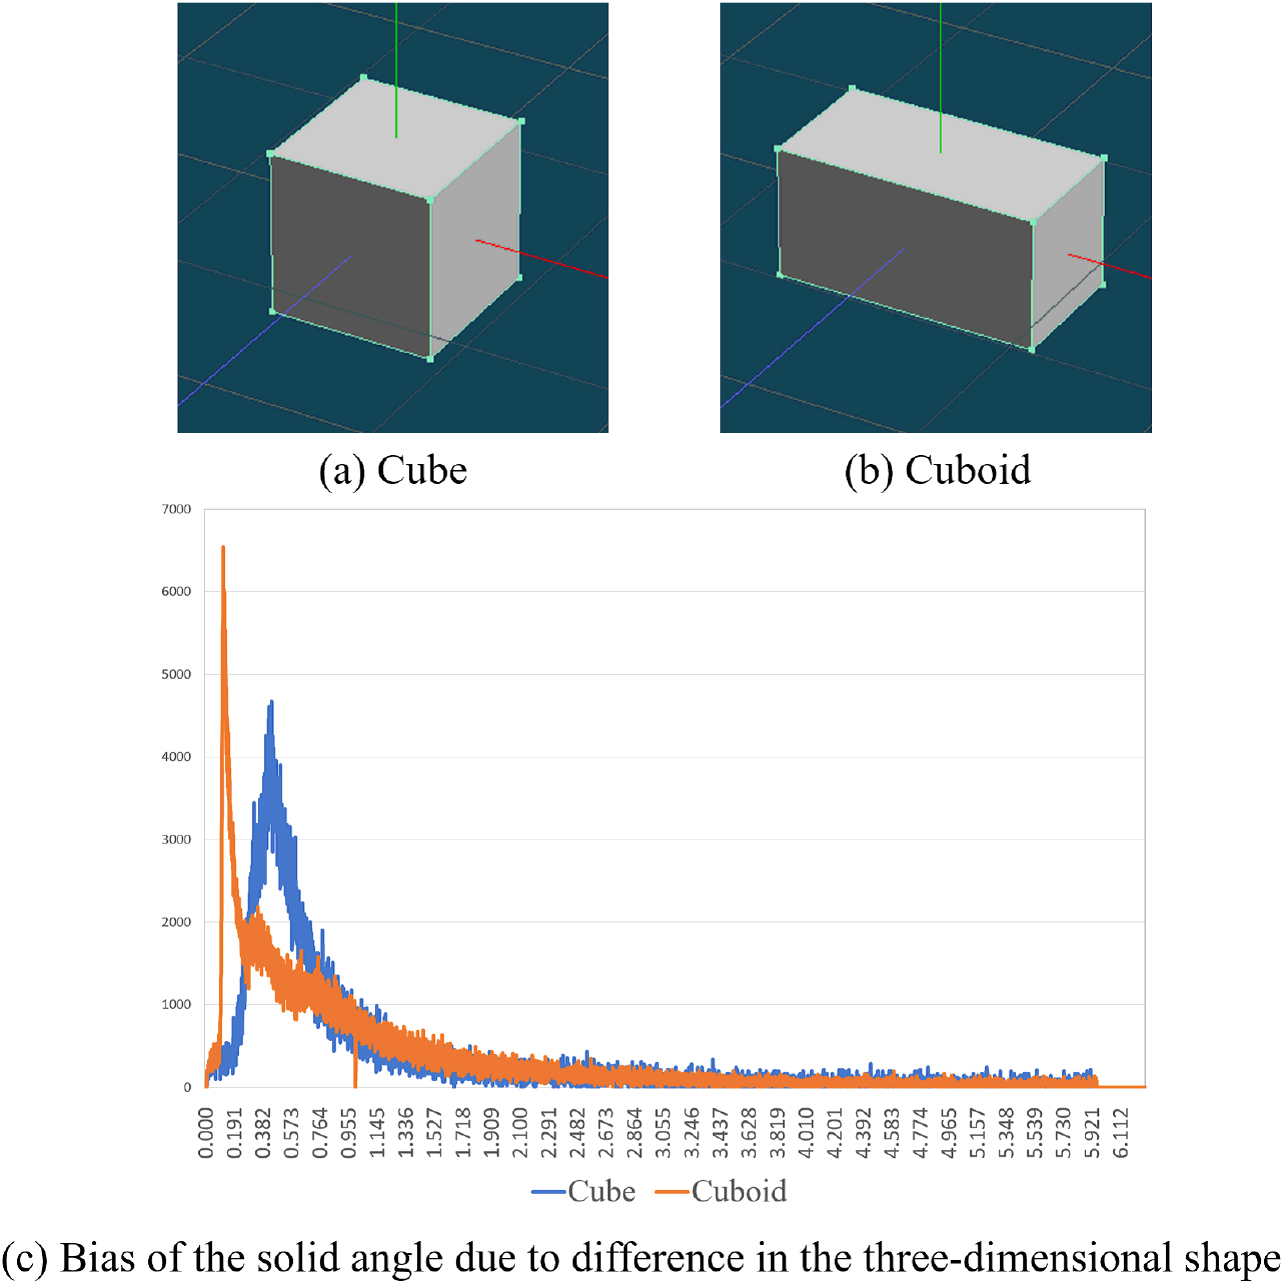
Changes in solid angle due to differences in the 3D shape.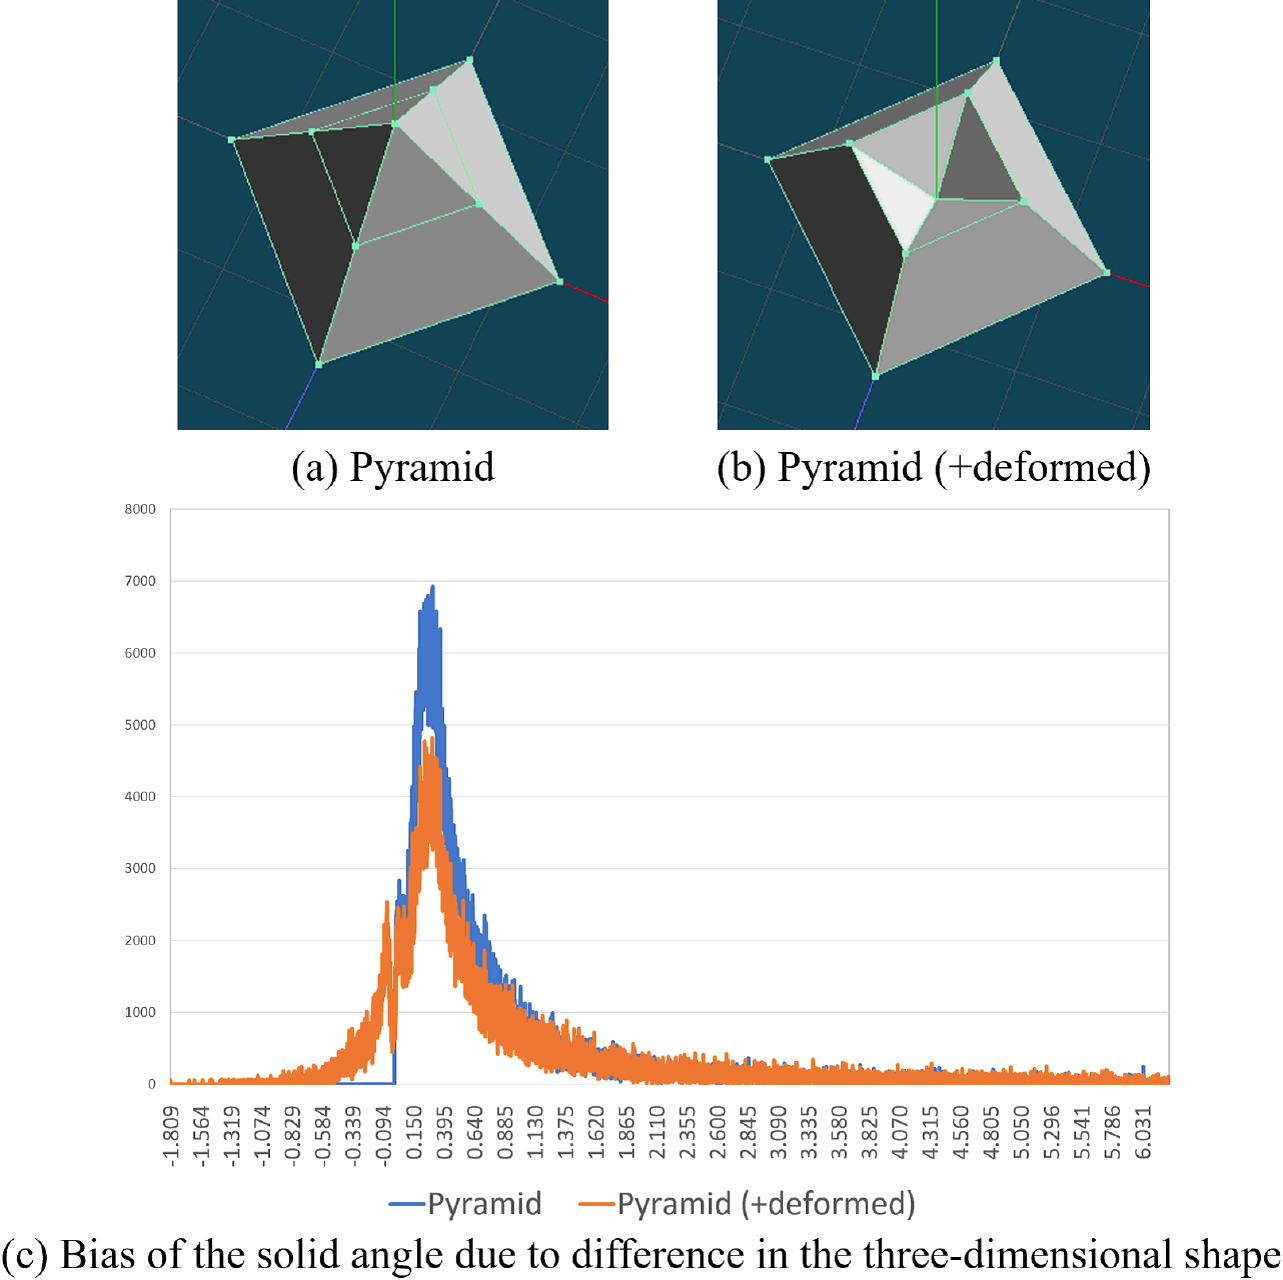
In contrast to 2D shapes, the order of data input cannot be uniquely determined for 3D shapes (Fig. 21). Therefore, the solid angle values were sorted in ascending order for each of the obtained polygons. In addition, because the resulting dataset will be large and many combinations can be created, we rounded the numerical values of the obtained solid angles and further counted the number of these solid angles to obtain the feature values of entire primitive 3D shape for classification (Fig. 22).
For example, the feature values for a standard cube and a rotated cube are shown in Fig. 23. In addition, the feature values for a cube (Fig. 23a) and an enlarged rotated cube (Fig. 23b) are shown in Fig. 24. Furthermore, the solid angle features for a cube and a cuboid (shapes with different classifications) are shown in Fig. 25. Moreover, for the case in which part of the primitive shape is deformed, the feature quantities of the pyramid shape and a deformed pyramid shape are shown in Fig. 26. In both cases, the radius r is set to 35, and the solid angles are given in 0.001 increments.
We used an SVM to classify shapes based on the features described above. We compared primitive cubes, triangular pyramids, cylinders, and spheres. Moreover, each object was transformed to verify whether the shape could still be identified. We also created locally deformed objects, in which part of the primitive shape was deformed. We compared the deformed shapes with the primitive shapes to determine whether they could be classified correctly. In this experiment, the radius
The parameters of the experimental environment are shown in Table 1.
Specifications for the computers used in the experiment
Specifications for the computers used in the experiment
We prepared 10 cubes, triangle pyramid, cylinders, and spheres for training. We then created five similar shapes for each basic shape and determined whether these shapes could be classified correctly.
Classification of cubes and cuboids
We prepared cubes and cuboids for training (Figs 27 and 28). In addition, we created test cubes and cuboids for classification (Fig. 29). The experimental results obtained using the SVM are shown in Fig. 30. In this experiment result, the correct classification rate was approximately 90%.
Cubes used for training.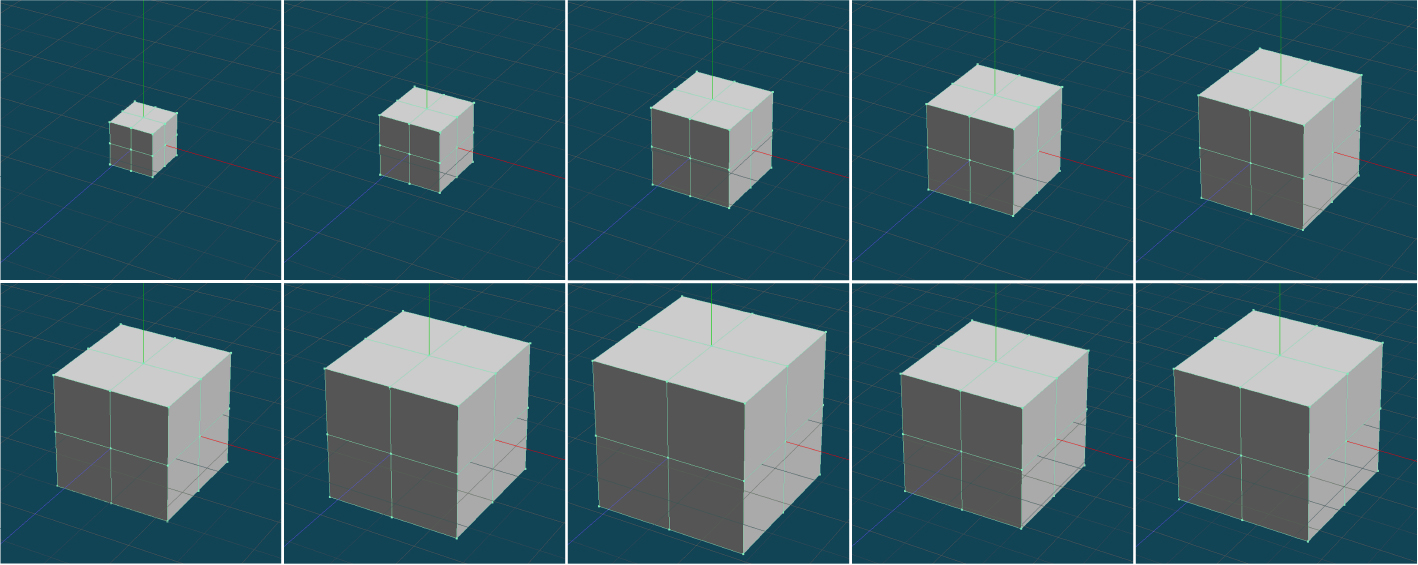
Cuboids used for training.
Cubes and cuboids used for testing.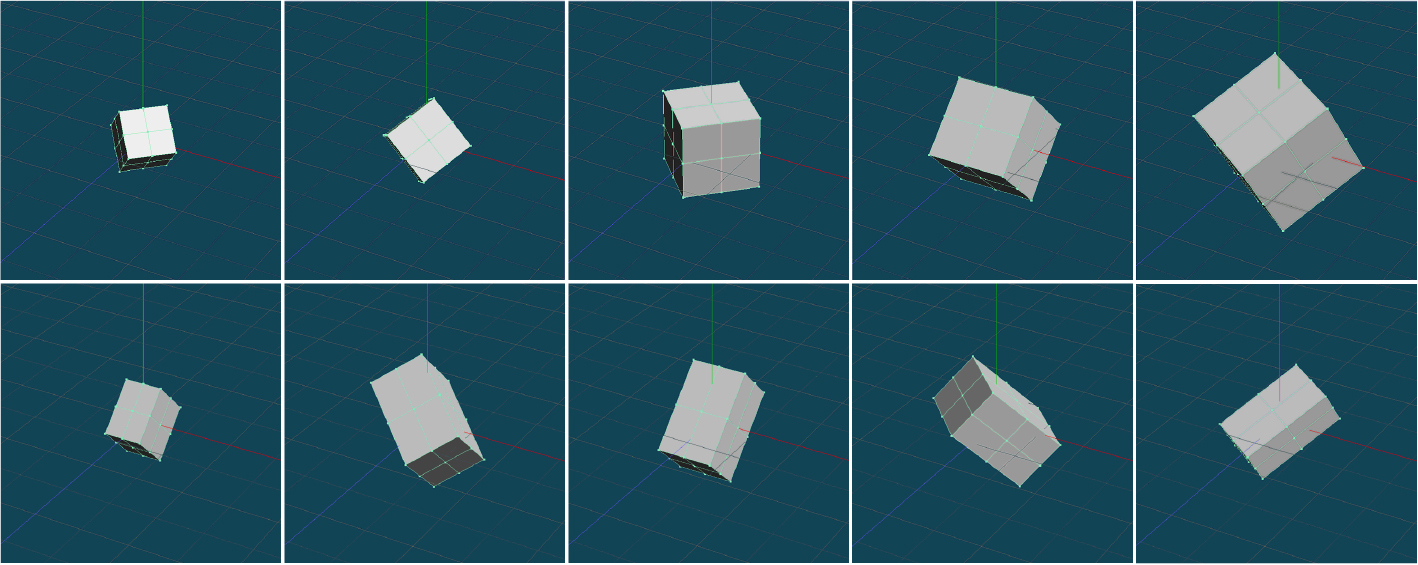
Experimental results for cubes and cuboids.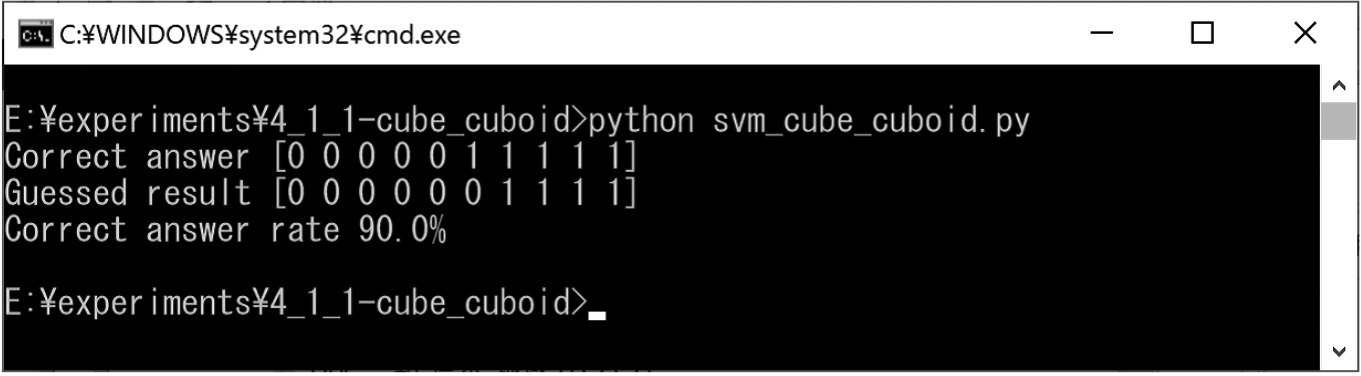
Cones used for training.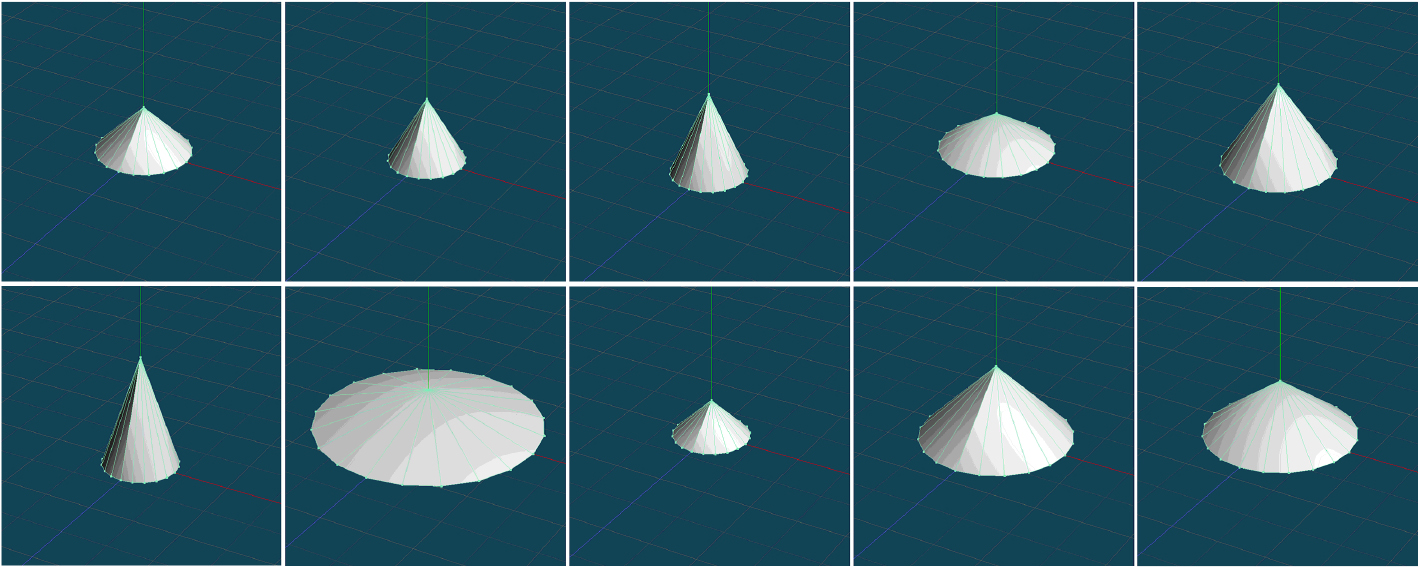
Pyramids used for training.
Cones and pyramids used for testing.
Experimental results for cones and pyramids.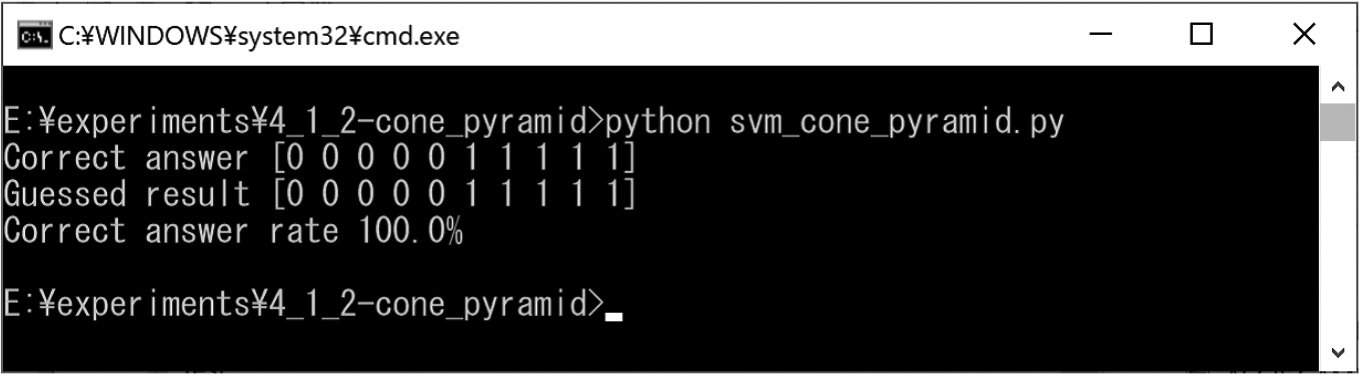
Cylinders used for training.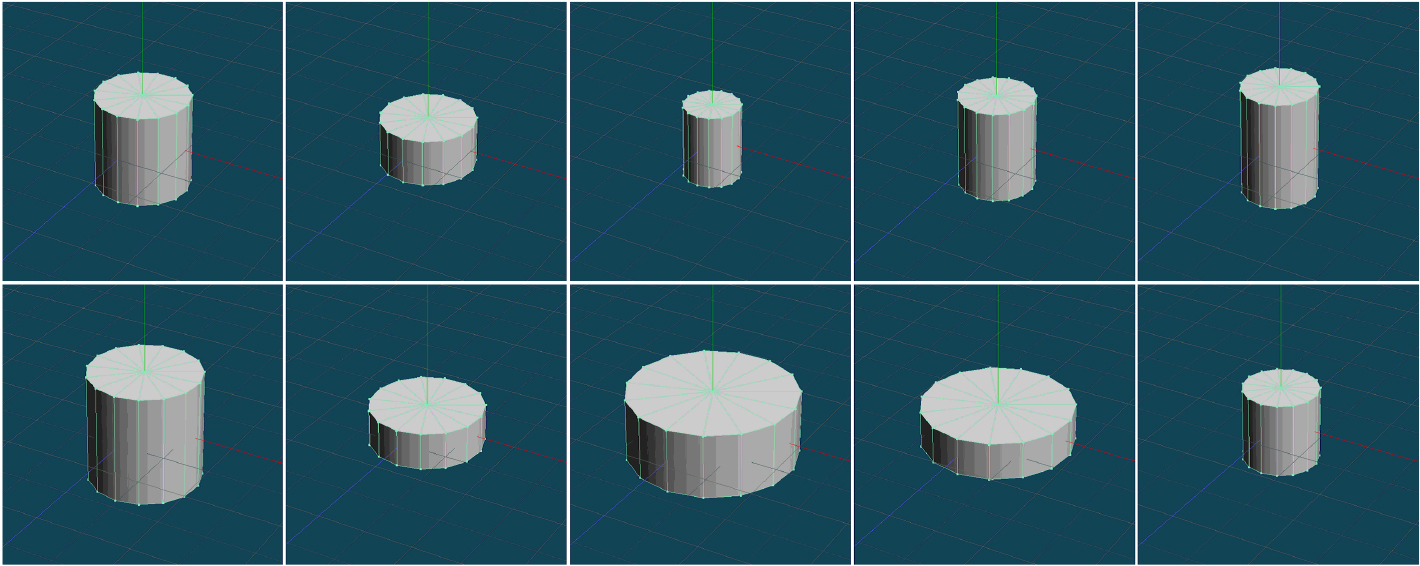
Cones and cylinders used for testing.
Experimental results for cones and cylinders.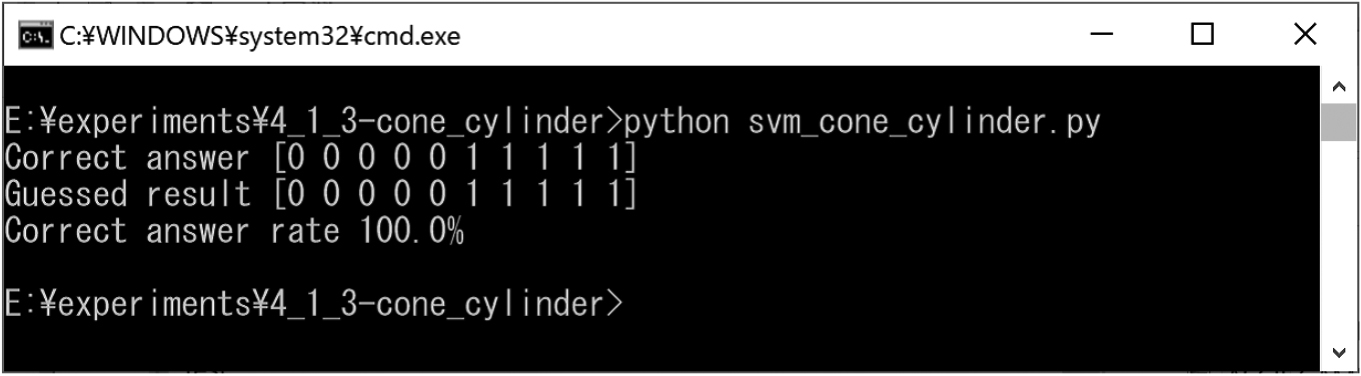
Cubes and pyramids used for testing.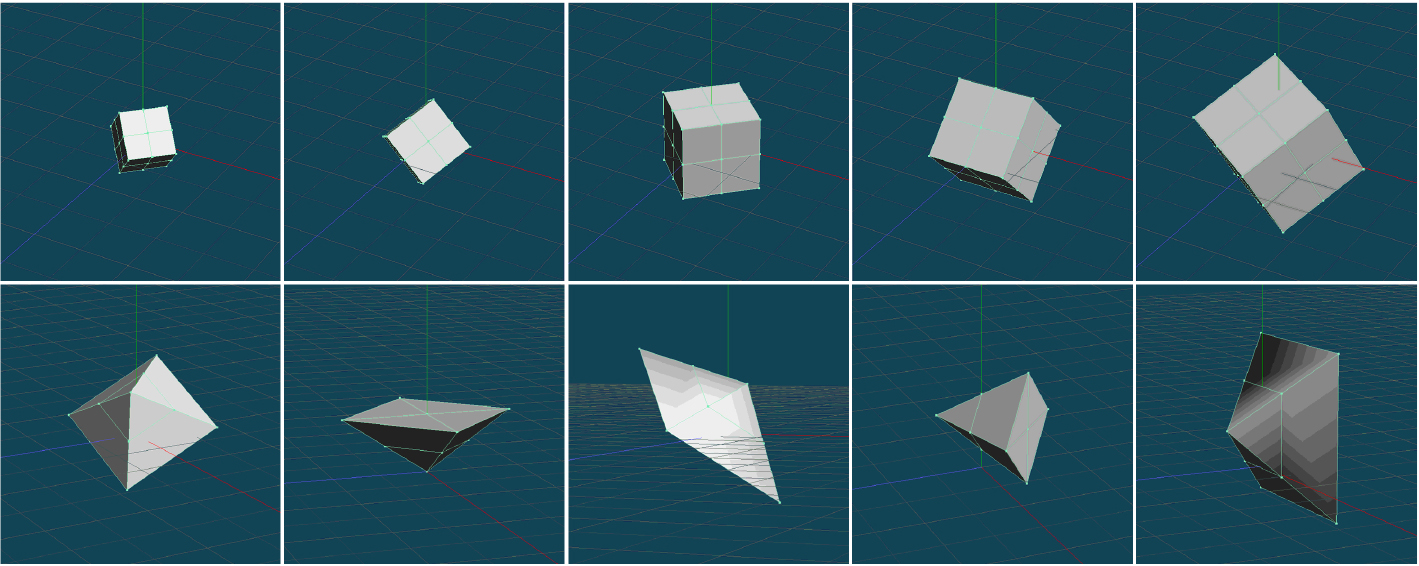
Experimental results for cubes and pyramids.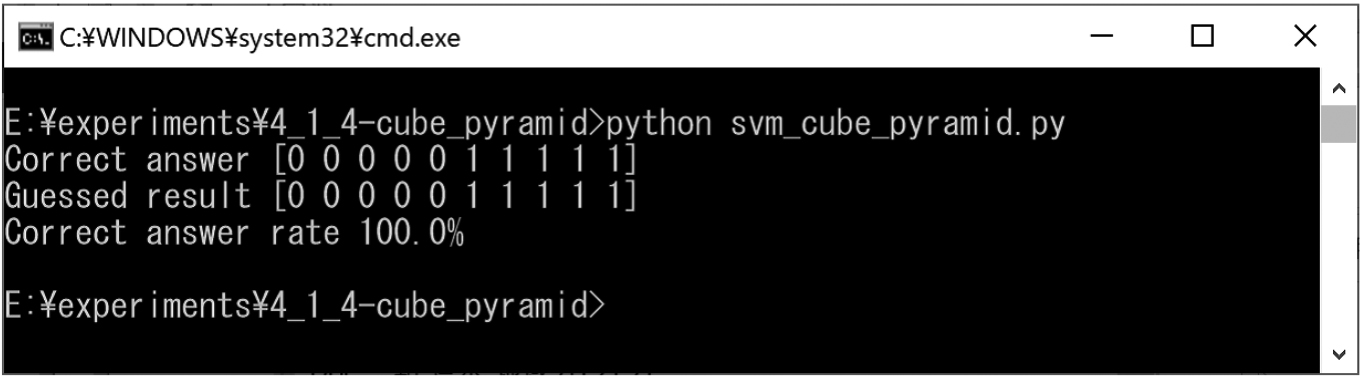
Deformed cubes used for training.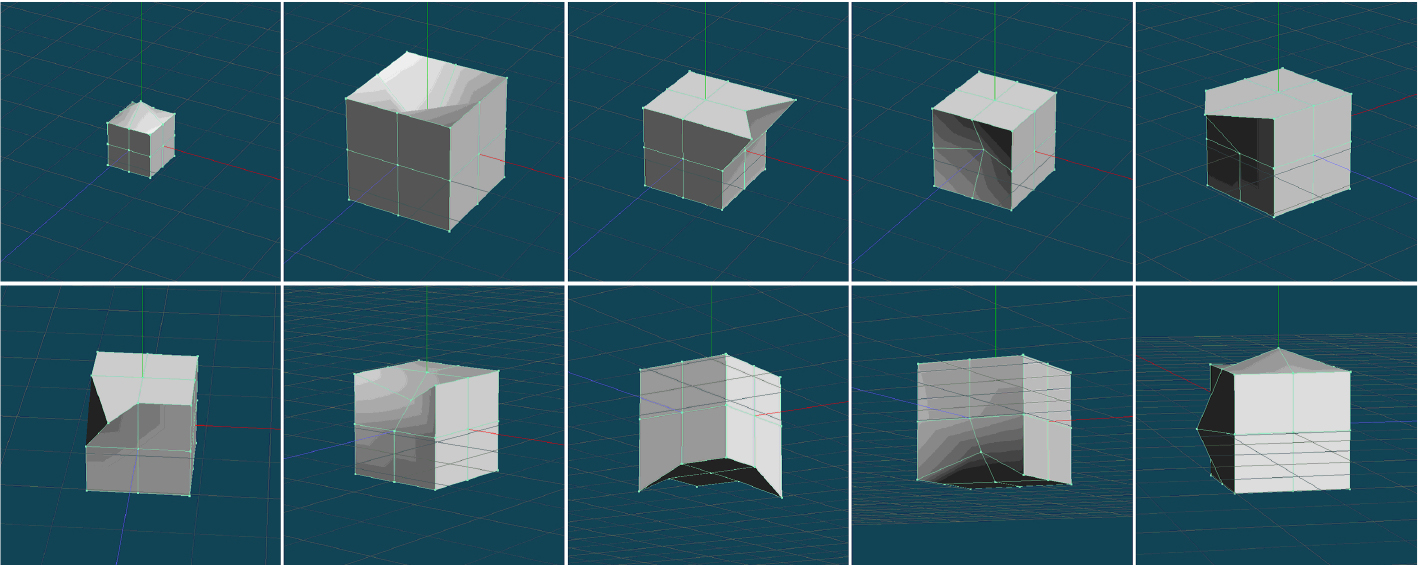
Cubes and deformed cubes used for testing.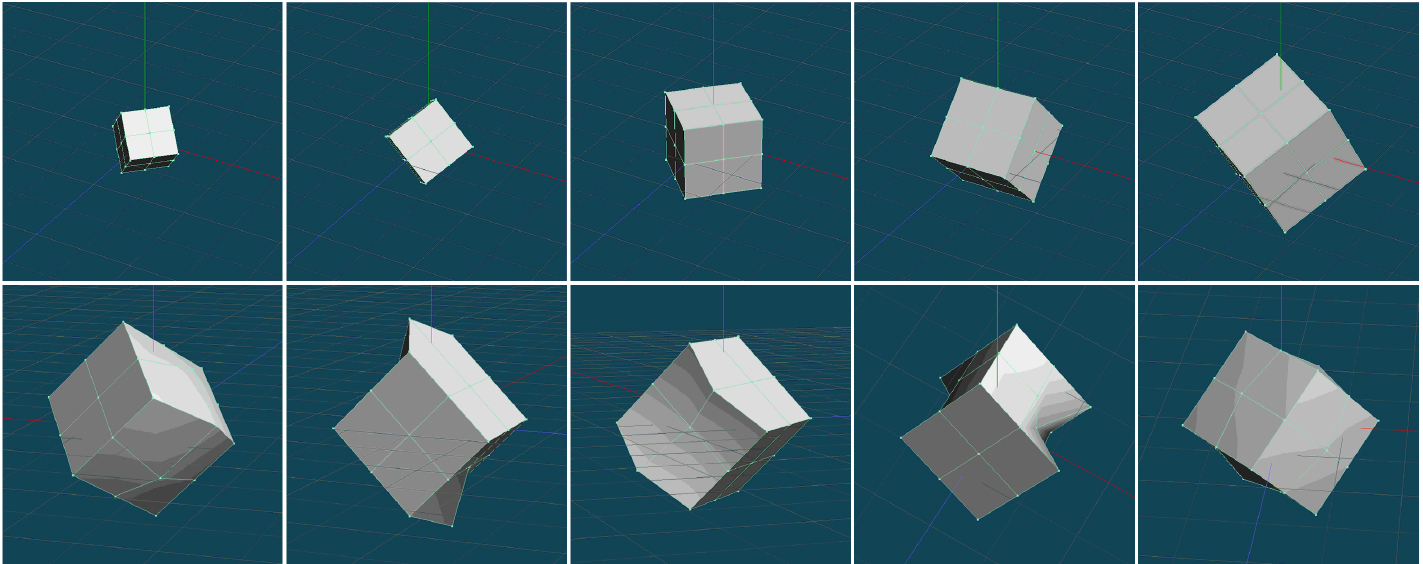
Experimental results for cubes and deformed cubes.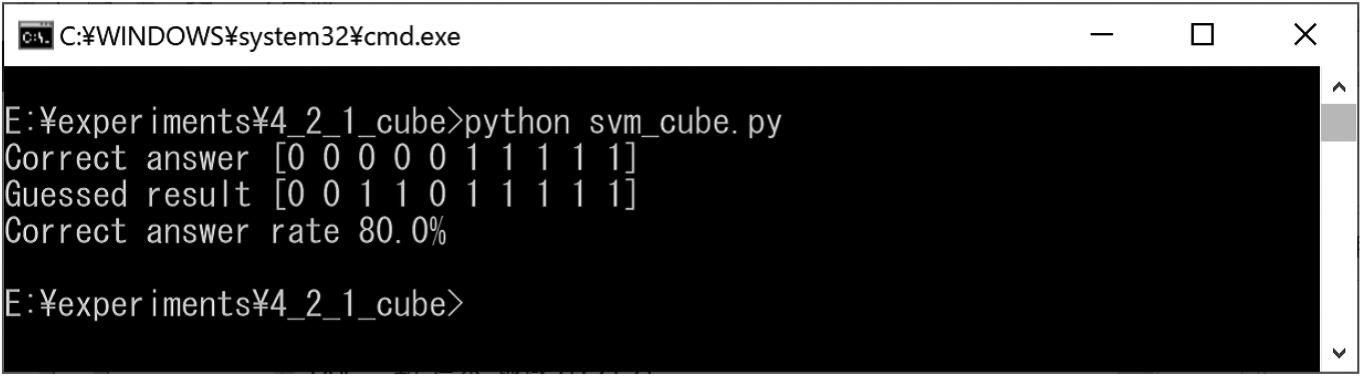
Deformed cuboids used for training.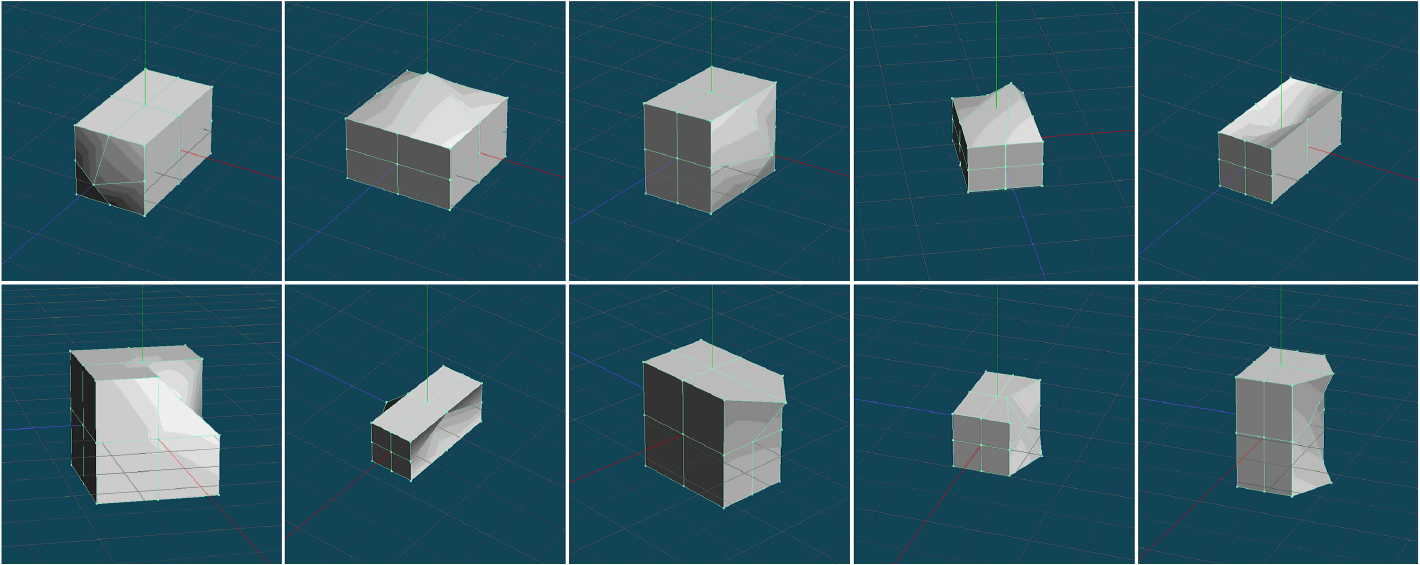
Cuboids and deformed cuboids used for testing.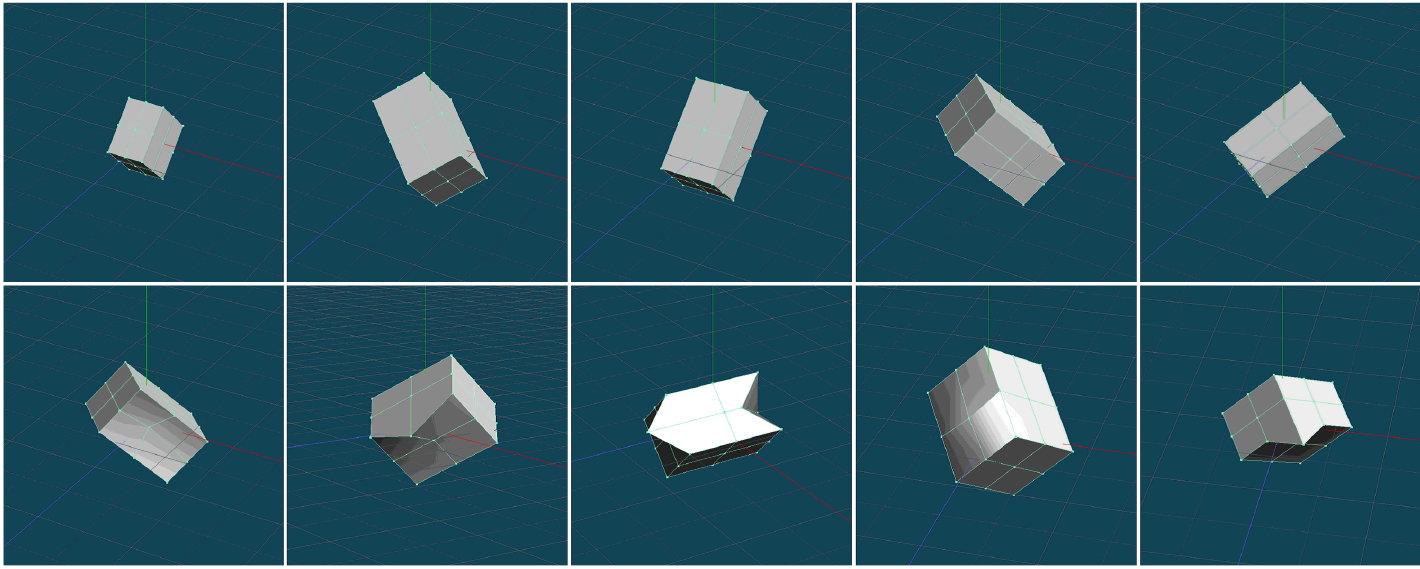
Experimental results for cuboids and deformed cuboids.
Deformed cones used for training.
Cones and deformed cones used for testing.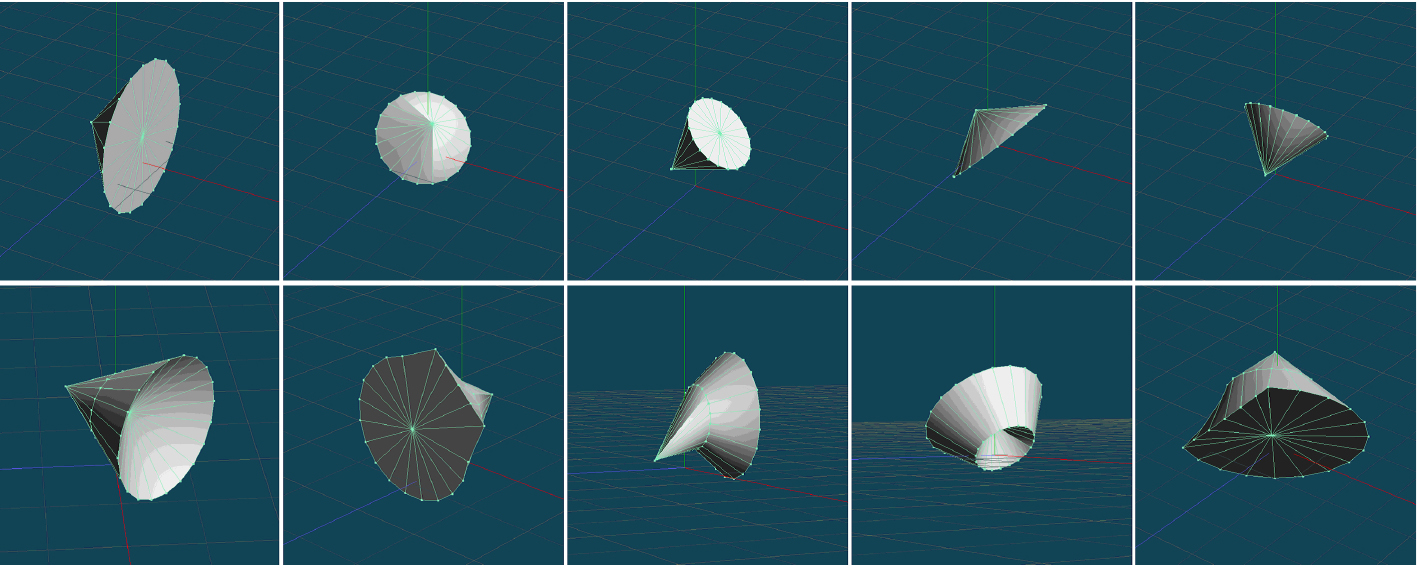
Experimental results for cones and deformed cones.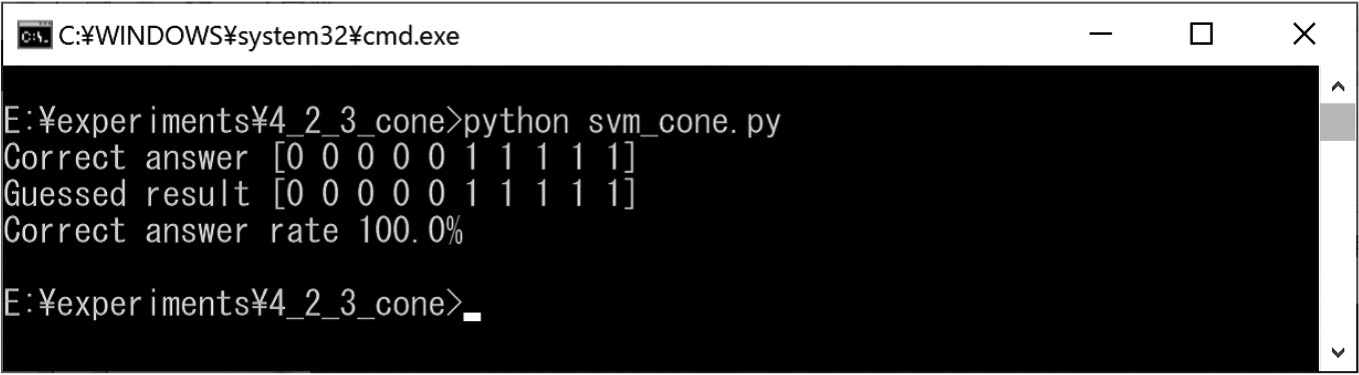
Deformed pyramids used for training.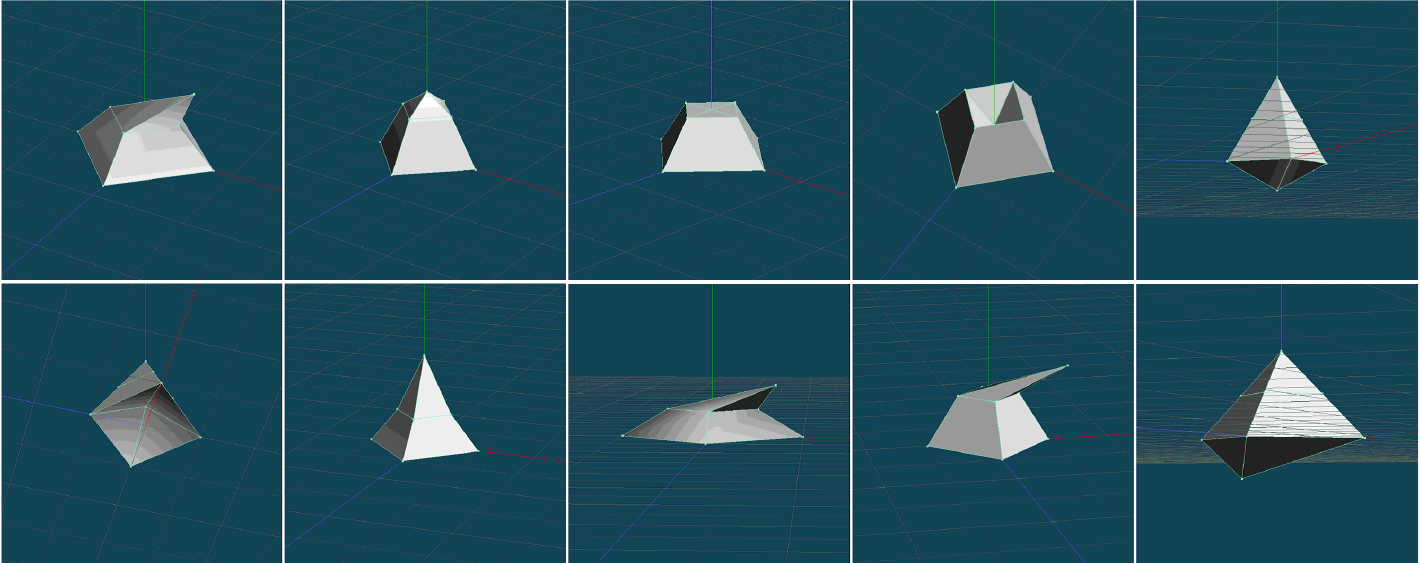
Pyramids and deformed pyramids used for testing.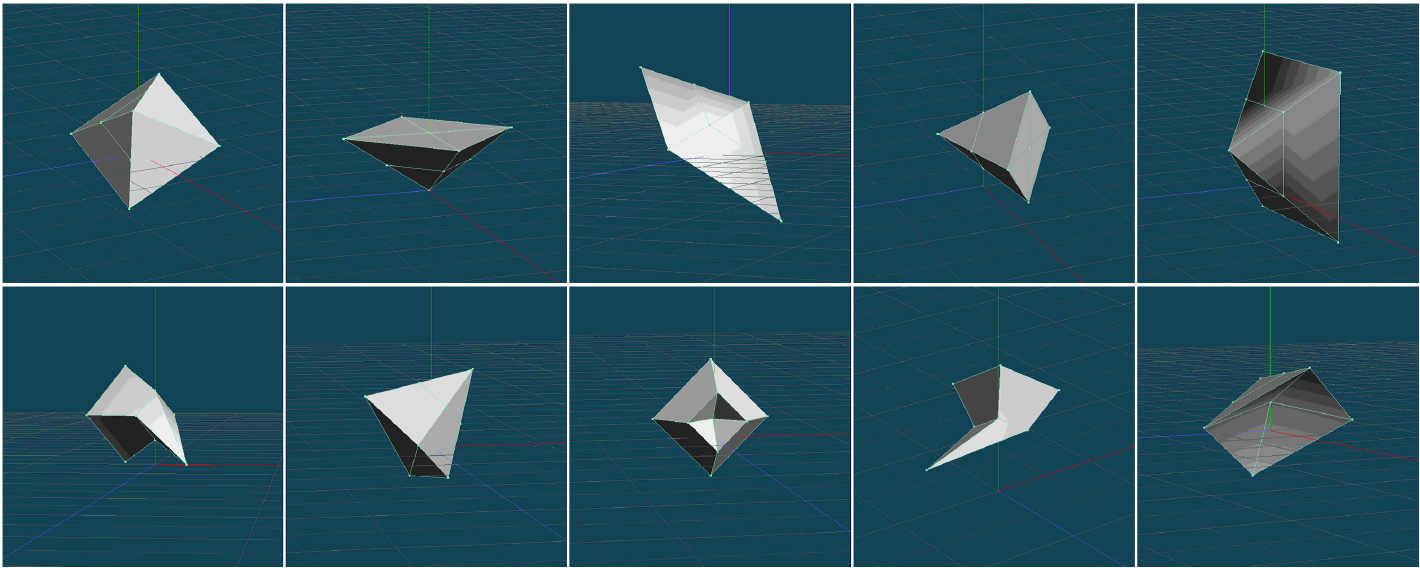
Experimental results for pyramids and deformed pyramids.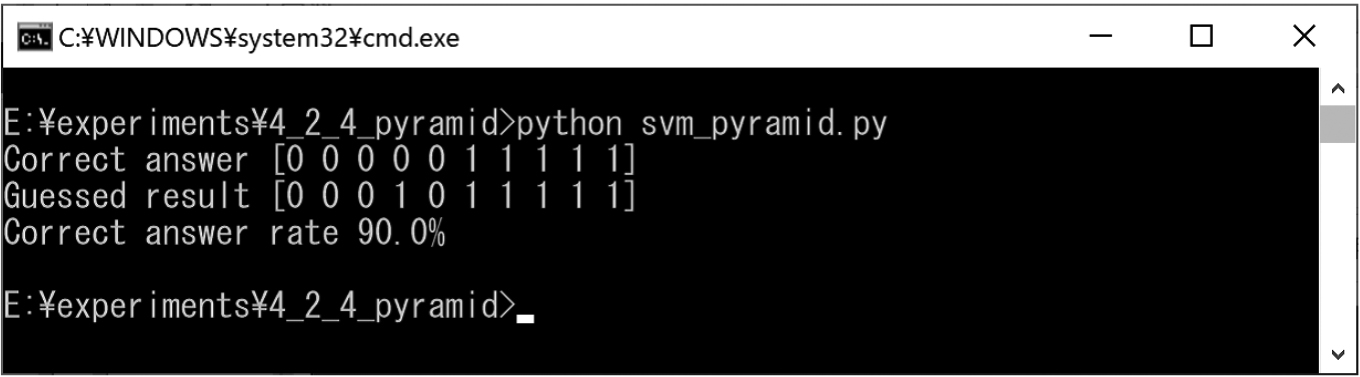
Deformed cylinders used for training.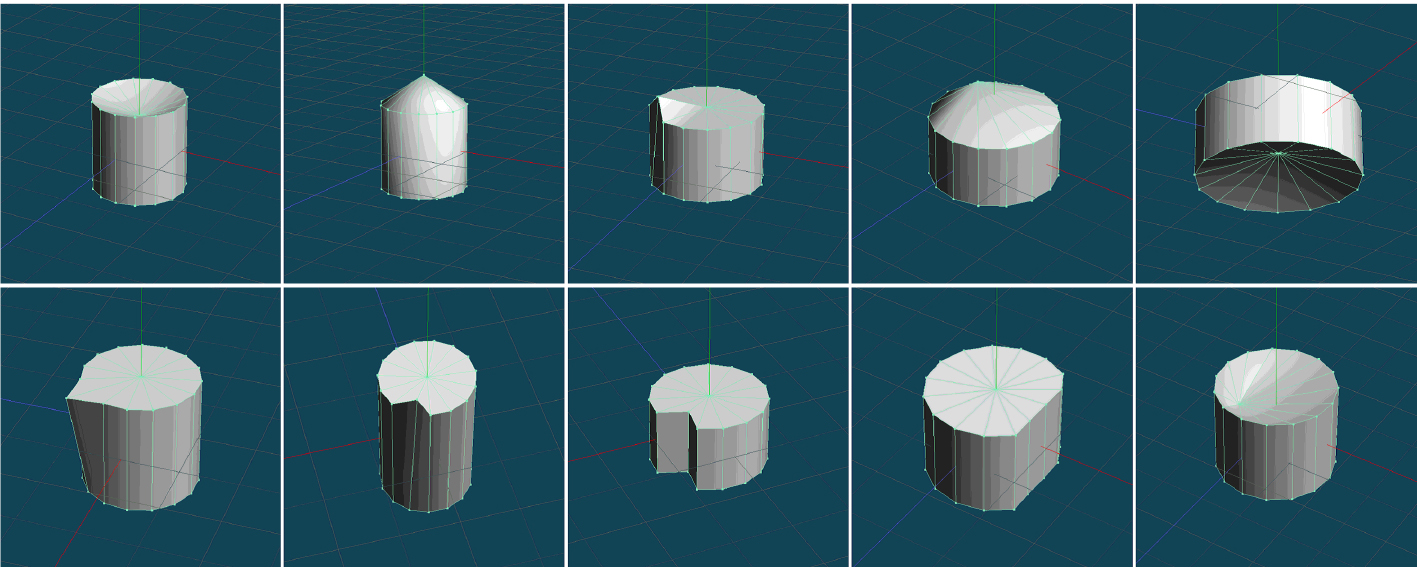
Cylinders and deformed cylinders used for testing.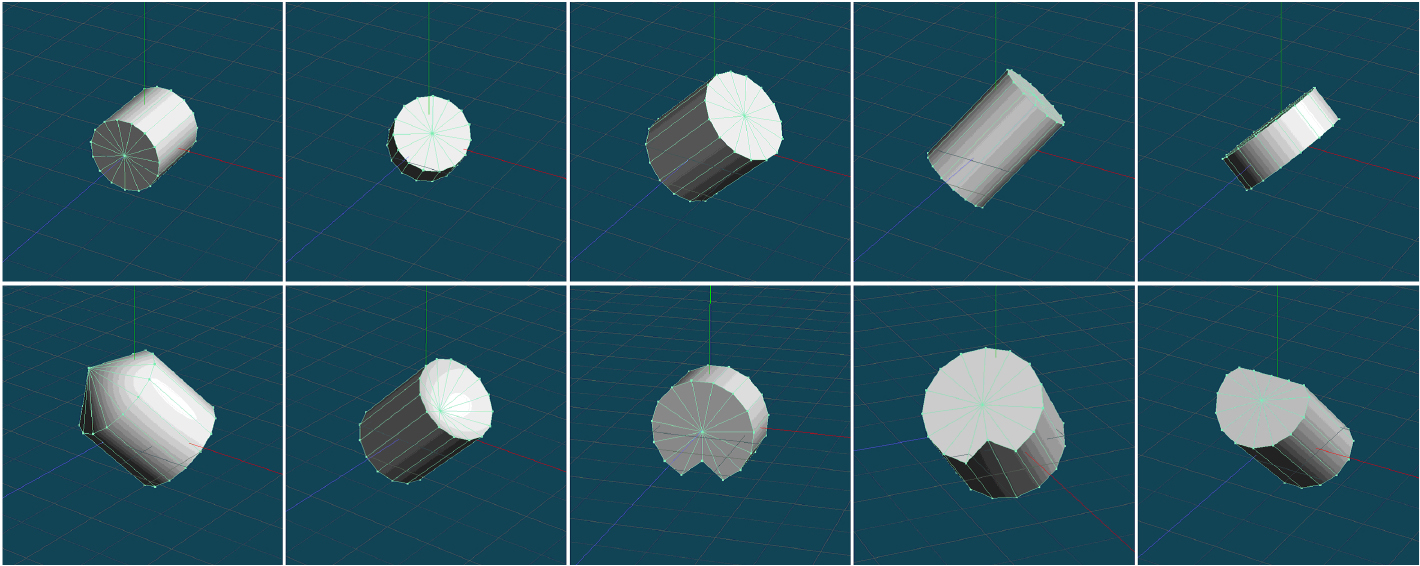
Experimental results for cylinders and deformed cylinders.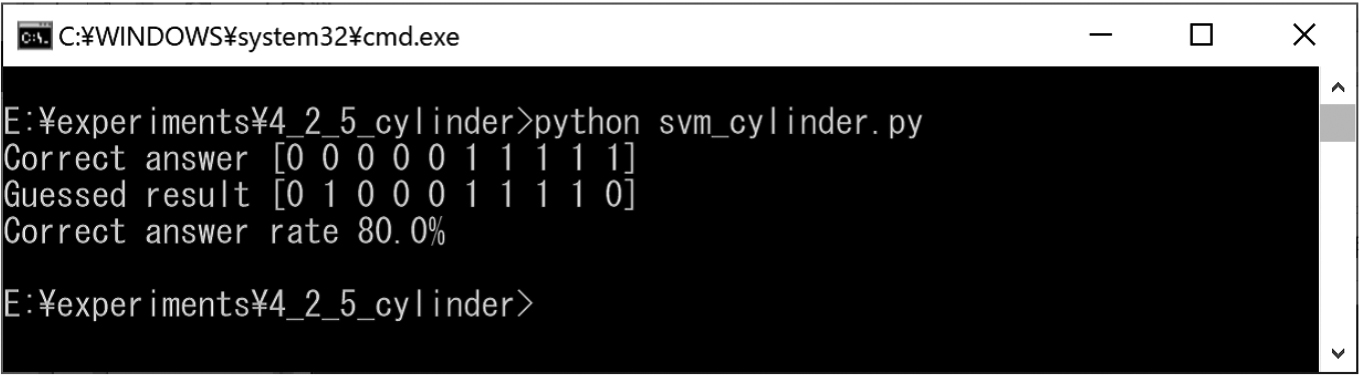
We prepared cones and pyramids for training (Figs 31 and 32). In addition, we created test cones and pyramids for classification (Fig. 33). The experimental results obtained using the SVM are shown in Fig. 34. In this experiment result, the correct classification rate was approximately 100%.
Classification of cones and cylinders
We prepared cones and cylinders for training (Figs 31 and 35). In addition, we created test cones and cylinders for classification (Fig. 36). The experimental results obtained using the SVM are shown in Fig. 37. In this experiment result, the correct classification rate was approximately 100%.
Classification of cubes and pyramids
We prepared cubes and pyramids for training (Figs 27 and 32). In addition, we created test cubes and pyramids for classification (Fig. 38). The experimental results obtained using the SVM are shown in Fig. 39. In this experiment result, the correct classification rate was approximately 100%.
Verification of classification between primitive shapes with and without local deformation
We prepared 10 transformed primitive shapes for learning. We then compared five primitive shapes with the same shape and five deformed objects to determine whether they could be classified correctly.
Classification of cubes and deformed cubes
We prepared cubes and deformed cubes for training (Figs 27 and 40). We also created test cubes and deformed cubes for classification (Fig. 41). The experimental results obtained using the SVM are shown in Fig. 42. In this experiment result, the correct classification rate was approximately 80%.
Classification of cuboids and deformed cuboids
We prepared cuboids and deformed cuboids for training (Figs 28 and 43). We also created test cuboids and deformed cuboids for classification (Fig. 44). The experimental results obtained using the SVM are shown in Fig. 45. In this experiment result, the correct classification rate was approximately 80%.
Classification of cones and deformed cones
We prepared cones and deformed cones for training (Figs 31 and 46). We also created test cones and deformed cones for classification (Fig. 47). The experimental results obtained using the SVM are shown in Fig. 48. In this experiment result, the correct classification rate was approximately 100%.
Classification of pyramids and deformed pyramids
We prepared pyramids and deformed pyramids for training (Figs 32 and 49). We also created test pyramids and deformed pyramids for classification (Fig. 50). The experimental results obtained using the SVM are shown in Fig. 51. In this experiment result, the correct classification rate was approximately 90%.
Classification of cylinders and deformed cylinders
We prepared cylinders and deformed cylinders for training (Figs 35 and 52). We also created test cylinders and deformed cylinders for classification (Fig. 53). The experimental results obtained using the SVM are shown in Fig. 54. In this experiment result, the correct classification rate was approximately 80%.
Conclusion
In this work, we proposed a method based on solid angles combined with an SVM to classify shapes for primitive 3D figures. Out results showed that by applying solid angles, similar primitive shapes can be correctly classified with a probability of more than 80%. In addition, the same classification rate was achieved when deformations were added. Therefore, the solid angle is considered as an effective feature for classifying 3D shapes.
However, if the object was enlarged or reduced, the feature values changed, even for similar shapes. This change may be caused by the fact that, in this features; thus, the ratio of the solid angle obtained as a whole changes, even for the same type of shape. In addition, the feature value changed when the object was rotated. This change occurred because the target is an integer value within a radius, and the change in the coordinates caused by rotation may have changed the value of the solid angle.
Future work
The proposed method was able to perform classification with a relatively high accuracy, even when enlargement, reduction, and rotation were added. However, to achieve classification with higher accuracy, it is necessary to appropriately select the coordinates to be used as feature points. Therefore, we plan to apply voxelization and other methods in which the value of the solid angle remains constant, even when the object changes due to expansion, contraction, or rotation. In addition, we will aim to improve the classification accuracy by increasing the number of data points used and by treating the change as an error.
In this paper, the decision was made in the limited object of the primitive shape and its deformation. Although primitive shape analysis is the basic technique for constructing complex shapes, it will be necessary to show the effectiveness of this method for more general shapes. Therefore, we intend to verify the accuracy by acquiring the triangular mesh structure using a sensor. In addition, since it is thought that it can be used in the fields of numerical integration and simulation by methods such as the Monte Carlo method, we would like to take an approach from the perspective of applicability.
Footnotes
Acknowledgments
This work was supported by JSPS KAKENHI Grant Number JP19K14599.