
Abstract
Stock trend forecasting, which refers to the prediction of the rise and fall of the next day’s stock price, is a promising research field in financial time series forecasting, with a large quantity of well-performing algorithms and models being proposed. However, most of the studies focus on trend prediction for stocks with a large number of samples, while the trend prediction problem of newly listed stocks with only a small number of samples is neglected. In this work, we innovatively design a solution to the Small Sample Size (SSS) trend prediction problem of newly listed stocks. Traditional Machine Learning (ML) and Deep Learning (DL) techniques are based on the assumption that the available labeled samples are substantial, which is invalid for SSS trend prediction of newly listed stocks. In order to break out of this dilemma, we propose a novel Adversarial Unsupervised Domain Adaptation Network (AUDA-Net), based on Generative Adversarial Network (GAN), ad hoc for SSS stock trend forecasting. Different from the traditional domain adaptation algorithms, we employ a GAN model, which is trained on basis of the target stock dataset, to effectively solve the absence problem of available samples. Notably, AUDA-Net can reasonably and successfully transfer the knowledge learned from the source stock dataset to the newly listed stocks with only a few samples. The stock trend forecasting performance of our proposed AUDA-Net model has been verified through extensive experiments conducted on several real stock datasets of the U.S. stock market. Using stock trend forecasting as a case study, we show that the SSS forecasting results produced by AUDA-Net are favorably comparable to the state-of-the-art.
Keywords
Introduction
Stock trend forecasting has always attracted the attention of artificial intelligence and finance industry. Different from the stock price prediction, the stock trend prediction refers to the prediction of stock price direction. In other words, we need to predict the rise and fall of the next day’s stock price. Hence, the nature of stock trend prediction is a binary classification problem rather than a regression problem. However, stock time series data is essentially unstable, complicated, and nonlinear [1]. In addition, stock trend is easily affected by many external factors, including national policies, international events, personnel transfer of the company, and economic conditions of the firm, etc. Therefore, effectively predicting the stock trend has become a challenging and valuable task. The traditional time series forecasting models, such as Stochastic Volatility (SV) model, Moving Average (MA) model, and other statistical ones, have their limitations in stock trend prediction, since the stock time series data, which cannot be reflected by analytic equations with parameters, is complex and noisy [2].
Machine Learning (ML) models, which possess strong feature extraction capability, are suitable for dealing with complicated and nonlinear data. Therefore, ML models have a wide range of applications in the field of stock trend prediction. In the past few years, DL algorithms have become the best ML algorithms in various research fields. Sezer et al. [3] showed that the performance of the DL models notably surpasses traditional ML models in financial time series forecasting.
Stock trend prediction, as one of the hot research topics in financial time series prediction, is no exception [4, 5]. The existing research on stock trend forecasting is mainly focused on stocks with a large number of samples while neglecting those newly minted public stocks with few samples. There exist a number of newly listed stocks in the stock market that have only very few samples. However, the general ML models, such as Support Vector Machines (SVM), Convolutional Neural Networks (CNN), and Long Short-Term Memory (LSTM), etc., require massive samples. Consequently, it is a challenging and valuable task to investigate how to predict the trend of the newly listed stocks with a few samples.
There exists a special research field of ML, which is called the few-shot learning, to solve the problem of too few available samples, specifically [6]. However, the few-shot learning paradigm is not employed to tackle such problems in this work, with the reasons being explained as follows.
In the general few-shot learning scenario, the datasets usually contain many classes with a few samples [7]. We assume that the number of classes is
Another serious problem lies in that, few-shot learning algorithms are developed based on the assumption that, although there are not massive samples in the target classification task, there are a quantity of similar classification tasks with a small number of samples. However, in the scenario of this work, this assumption is not tenable, because there are no other similar classification tasks in our datasets. Based upon the above analysis, we did not adopt the few-shot learning paradigm for this research work.
Generally, there are many stocks with numerous samples in the stock market, with the distributions of which being different. Motivated by this observation, we innovatively introduce the domain adaptation paradigm into the research of SSS stock trend forecasting. We use the stock with massive samples as the source domain, and the newly listed stock, with a few samples, to be predicted, which is our concern, as the target domain. Domain adaptation paradigm is used to fulfil the target learning task for the target domain, under the circumstances that the distributions of source domain and target domain are inconsistent.
Nowadays, DL algorithms play a crucial role in domain adaptation. One typical domain adaptation method projects the source and target domains into a common representation space by learning a deep transformation [9, 10]. Another classical method reconstructs the target features according to the source domain [11], with the adversarial adaptation method being its mainstream [12]. However, most studies of the domain adaptation methods focus on the problem setting that the target domain has a large number of samples, while, in contrast, there are few studies of domain adaptation on the problem setting that the target domain has few samples.
Motiian et al. [13] proposed a supervised domain adaptation algorithm using a few samples. However, this algorithm trains the model by randomly selecting a few labeled samples from a large number of labeled samples. In essence, it still requires that there exist massive labeled samples in the target domain. In reality, newly listed stocks do not possess many samples, and therefore, supervised domain adaptation algorithms for small samples are not suitable for the research topic carried out in this work. While we innovatively propose here, based on Generative Adversarial Network (GAN), and specifically for SSS stock trend forecasting and other similar application problems, a novel Adversarial Unsupervised Domain Adaptation Network (AUDA-Net), which breaks the dilemma of requiring a large number of samples in the field of stock trend forecasting, and can effectively predict the trend of newly listed stocks with a small number of samples.
Our proposed AUDA-Net model consists of two parts. The design aim of the first part, which is composed of one GAN, is to solve the problem of insufficient samples in the target domain. We attempt to train a GAN model to generate a large quantity of fake samples with the same distribution as the target domain samples. Then, the fake samples and real target samples are combined to form a new target domain dataset. The second part is an Adversarial Unsupervised Domain Adaptation (AUDA) model. We embed the domain adaptation phase into the representation learning process. We attempt to train the feature extractor
The overall architecture of AUDA-Net.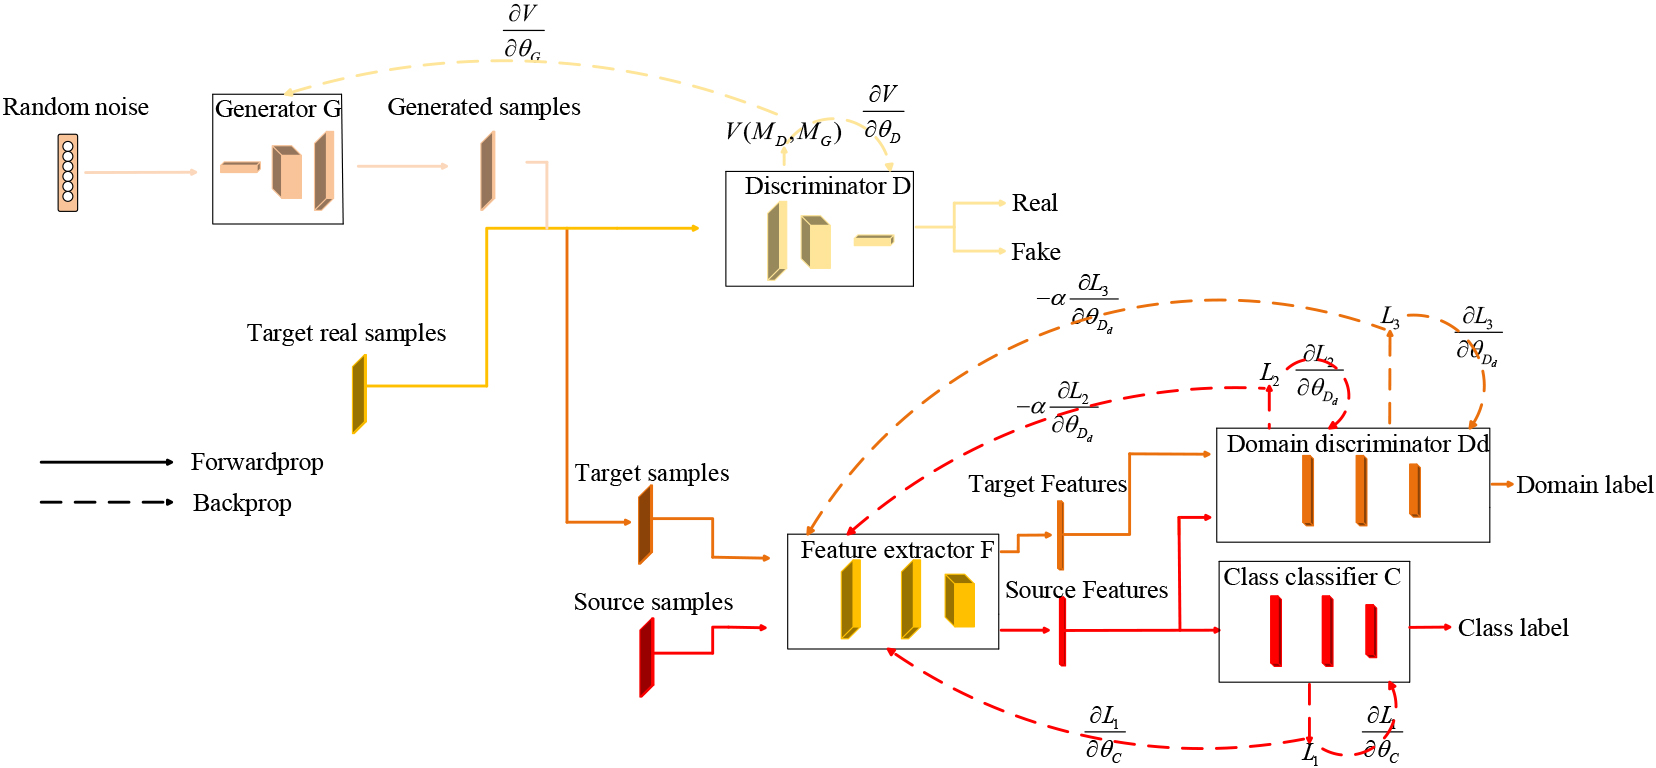
Data augmentation methods in few-shot learning usually leverage some prior knowledge, such as hand-crafted rules and transformation procedure, to augment samples in order to enrich the supervised information in sample set [8]. In computer vision field, the hand-crafted rules include flipping images [14, 15], rotation images [16], and scaling images [17]. According to what samples are selected to transform and added to the target dataset, data augmentation methods based on transformation procedure are categorized into three classes [8]: transforming samples from the target dataset [18], transforming samples from an unlabeled large dataset which contains target label [19] and transforming samples from other similar large datasets [20]. In general, the augmentation strategy using the prior knowledge of the target classification task is often specific to a dataset, such that we cannot easily use this strategy on other datasets. To solve the Small Sample Size (SSS) problem, the sample generation part in our proposed AUDA-Net model trains a GAN model to generate abundant fake samples. Different from the data augmentation methods in few-shot learning, the augmentation methods of our model are not specific to a dataset, and can be well applied to the other datasets.
The major innovations and contributions of this work are summarized as follows:
First of all, we, to the best of our knowledge, are the first to predict the trend of newly listed stocks with a few samples, which fills the gap in the research of SSS stock trend prediction. The trend forecasting effectiveness of the proposed AUDA-Net model has been verified through extensive experiments conducted in this work.
Secondly, we, to our knowledge, are the first to introduce the domain adaptation paradigm into the research field of stock trend prediction. We seek to implement transfer learning across different stock datasets. It has been proved through the largely conducted experiments that, knowledge transfer can be realized between stocks, and the knowledge learned from one stock can be used to help implement trend forecast for another stock.
Thirdly, we propose a novel Adversarial Unsupervised Domain adaptation Network (AUDA-Net) model based upon GAN, ad hoc for SSS stock trend forecasting and other similar applications. AUDA-Net can effectively tackle the problem of lacking sufficient samples of newly listed stocks, and can desirably forecast their trends.
It is worth noting that, the proposed AUDA-Net model can also be applied to solve other SSS time series trend prediction problems, whereas the research focus of this work is on SSS stock trend forecasting.
In this paper, we evaluate and compare the SSS stock trend forecasting performance of our AUDA-Net model and some other state-of-the-art rival models by carrying out experiments on real stock data of the U.S. stock market, i.e., Oracle Bone Inscriptions (ORCL), Inter (INTC), eBay (EBAY) and Qualcomm (QCOM). Experimental results demonstrate the performance superiority of the proposed model for SSS stock trend prediction.
The remaining part of paper is organized as follows. In Section 2, existing research works on stock trend forecasting and domain adaptation are introduced. In Section 3, our proposed AUDA-Net model is described in detail. Experimental results and an analysis of the results are presented in Section 4. Finally, Section 5 concludes the paper and discusses prospects of future research work.
Stock trend forecasting
In recent years, stock trend forecasting has always been the research focus of financial time series forecasting. In financial and artificial intelligence circles, there are three main methods to predict stock trend.
The first method is to use econometrics, technical analysis of stock trend and other theories to analyze the stock trend [21, 22, 23]. The second method is to use the traditional statistical models, such as SV model, Autoregressive Integrated Moving Average (ARIMA) model and MA model, to predict stock price trend [24, 25, 26]. The third method is to use the ML models to forecast stock trend. Because we use the ML model to forecast the stock trend, we mainly introduce the research of stock trend prediction using ML algorithms.
There are many different models and methods in the research of stock trend prediction using ML models. Some studies use original stock data, while others use news, technical indicators, twitter mood, social media data, etc. Some studies use traditional ML algorithms, such as SVM and Single Layer Perceptron (SLP), while others use DL algorithms, such as LSTM, CNN and Recurrent Neural Network (RNN) [27, 28, 29].
There are many methods on stock trend prediction using original stock data. In [30], Das et al. used Neural Network (NN) model to forecast the trend of S&P 500 Index. In [31], Probabilistic Neural Network (PNN), RNN and Time Delay Neural Network (TDNN) are used to forecast the trend of stocks. Of course, there are some relatively new methods to predict the trend only using the original stock data. In [32], the raw stock data is transformed into two-dimensional images, and then the CNN model is used for trend prediction. In [33], the Empirical Mode Decomposition and Factorization Machine based Neural Network (EMD2FNN) is used to predict the stock trend.
There are also some studies on stock trend forecasting using raw stock data, technical indicators and other types of data simultaneously. In [34], four different artificial neural networks, SVM, Naïve Bayes and Decision Tree (NBDT) are compared for stock trend prediction. In [35], technical indicators, raw stock data and LSTM model are used to forecast the trend of stocks from Brazil stock exchange. In [36], Liang et al. used Restricted Boltzmann Machine (RBM), technical indicators and OCHLV to forecast stock trends. In [37], the feature combinations are used as the model input, and the CNN model is used to forecast the stock trend.
In addition, some text information, such as news and twitter, have an important impact on the stock price [38]. Therefore, there exist some studies on the prediction of stock price trend using text information. In [39], Peng et al. proposed an algorithm for stock trend forecasting using Deep Neural Network (DNN) and word embedding technology. In [40], DNN model and Twitter sentiment are used for trend prediction.
At present, almost all the existing stock trend prediction studies are focused on the stocks with a large number of samples. However, the research on the trend prediction of newly listed stocks, which is both valuable and challenging, is virtually blank. And our work fills this gap.
Domain adaptation
Definition
In this section, we introduce the formal definition of domain adaptation [41]. Assume there exist two datasets: a source domain
Existing works on domain adaptation
Domain adaptation is a very popular field in transfer learning [42, 43, 44]. The early domain adaptation methods focused on the problem in the field of natural language processing [45, 46, 47]. But recently, domain adaptation methods are widely used in the field of computer vision [48, 49, 50]. At present, domain adaptation methods have not been applied in stock trend prediction. To the best of our knowledge, we are the first one to use domain adaptation methods in the field of stock trend forecasting.
Because our algorithm uses the adversarial domain adaptation method, this paper mainly introduces the adversarial domain adaptation.
In [51], through the confrontation between generator and discriminator, the performance of generator and discriminator is improved. The goal of the generator is to generate fake samples that can fool the discriminator. The goal of the discriminator is to accurately judge whether the samples come from the fake samples or the real samples. The thought of adversarial domain adaptation is very similar to this algorithm. The adversarial domain adaptation methods exploit the confrontation between domain discriminator and feature extractor to acquire domain-invariant features [52].
In [12], the Adversarial Discriminative Domain Adaptation (ADDA) algorithm achieves domain adaptation by training the target encoder and the discriminator to make the features extracted by the target encoder closer to the source features. In [53], CDAN learns the transferable and disentangled features by embedding the adversarial learning into the deep architectures. In [54], Rios et al. proposed an adversarial domain adaptation algorithm for solving the problem of relation classification. In [55], ADA matches the distributions between the real-world domain and the simulation domain through the adversarial domain adaptation process.
In the Unsupervised Domain Adaptation by Backpropagation (UDAB) algorithm, innovatively, the gradient reversal layer is used to maximize the loss of domain classifier, and the domain adaptation process is integrated into the deep feedforward network [56]. This idea gave me a lot of inspiration. We use their ideas for reference in the domain adaptation part of our model. But our work is very different from UDAB. Its work is for the target domain with a large number of unlabeled samples, while we focus on the target domain with few unlabeled samples. The issue we address is much more difficult than UDAB, and the performance on the target domain with a few samples is much better than it.
Proposed method
In this section, firstly, we briefly introduce the working principle of GAN. Secondly, we explain our proposed Adversarial Unsupervised Domain Adaptation Network (AUDA-Net), in detail.
GAN
The goal of GAN is to generate fake samples with the same distribution as real samples. In order to achieve this goal, GAN uses a generator for generating fake samples and a discriminator for judging whether the samples are real or fake [51]. GAN improves the ability of generator and discriminator through the game between them. GAN is mainly used in the field of computer vision. Next, we explain how we train a GAN model to generate fake images that are as similar to real images as possible. Firstly, we generate some fake images by inputting random noise vectors into the generator. Secondly, we input both fake images and real images into the discriminator, at the same time. After that, we update the generator and the discriminator according to the feedback of the discriminator, so that the fake images generated by the generator can fool the discriminator, and, simultaneously, the discriminator can judge whether the images are real or fake. Figure 2 illustrates the general architecture of GAN, intuitively.
The general architecture of GAN.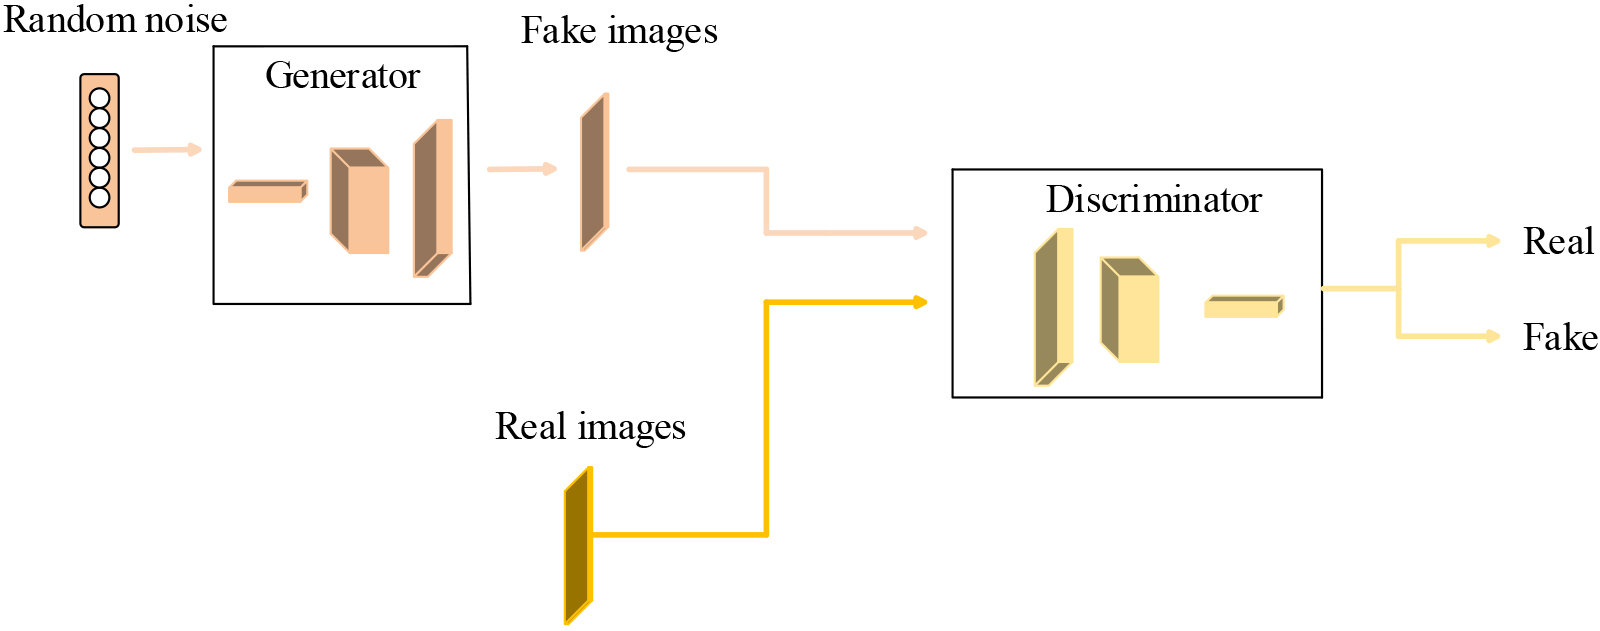
In this section, we describe, in detail, our proposed model for the trend prediction of stocks with few samples. Firstly, we expound the two parts of the proposed AUDA-Net model, i.e., a sample generation part and a domain adaptation part. Secondly, we explain the process of searching for the optimal parameters of our model.
Sample generation part
We suppose that the input of our model comes from the source and target domains with different distributions. The source domain is assumed to contain
The sample generation part of our proposed AUDA-Net model is composed of a generator
The generator
Obviously, this is an optimization problem. Firstly, we optimize discriminator
For the optimization problems of Eqs (4) and (5), we adopt the stochastic gradient descent method to solve.
According to the above series of processes, we obtain the generation distribution
Our ultimate goal is to accurately predict the real class labels of the unseen samples from the target domain. Since we lack the class labels of the training target samples, we have no way to train our model in a supervised way. In other words, our main goal is to train the class classifier
In order for the class classifier
We suppose all the parameters of feature extractor
Next, we present the formal definitions of feature extractor
where in Eq. (6),
Similarly, the domain discriminator
In the training stage, we need to find the optimum parameters
where
According to Eqs (9)–(12), the loss function Loss is composed of three parts.
Next, we introduce how to adopt the Stochastic Gradient Descent (SGD) method to solve all the optimization problems in Eqs (4)–(5) and Eqs (13)–(14). We suppose that
The gradient of Eq. (5) for
We suppose
The gradient of Eq. (14) for
In the process of solving all optimization problems by using SGD, the update of each parameters is shown in the following formula:
where the parameters
The computational cost of our AUDA-Net model comes from its sample generation part and domain adaptation part. In order to generate massive fake target samples, the time spent by the sample generation part is
In this section, we introduce an example of using the proposed AUDA-Net model to predict the stock trend. We assume that the newly listed stock, which is needed to be predicted, is the target stock, and the stock with large samples, which is used to help implement trend forecast, is the source stock.
The raw stock data and technical indicators of source and target stocks are combined as the source and target domains respectively. And we divide the target domain into two parts: i.e. training set and test set. Since the value ranges of different variables in source and target domains are very different, we standardize each variable. Similar to the other stock trend prediction methods [57], we reconstruct samples collected from the source and target domains according to time window size
where in Eq. (25),
where
Next, we introduce the training process of the proposed AUDA-Net model. In each iteration of the sample generation part, we firstly input a random noise vector into the generator
After the sample generation phase, the trained generator
In each iteration of the domain adaptation part, we firstly input the training samples of source and target domains into the feature extractor
In the testing phase, we use the feature extractor
Experimental data
In our work, we evaluate the trend prediction performance of our proposed AUDA-Net model on eight groups of real stock data of the U.S. stock market, with the specific setting of these eight groups of experiments being explained in Section 4.3. The stocks used in this paper include Amazon (AMZN), ORCL, Apple Inc. (AAPL), EBAY, INTC, Alibaba Group (BABA) and QCOM. All the stocks are from Yahoo Finance.
In order to better show the favorable trend prediction performance of our algorithm in the trend forecasting of newly listed stocks, we compare our model with some supervised learning algorithms that require a large number of labeled samples. Therefore, the stock datasets with massive samples are selected as the target domain, i.e., ORCL, INTC, EBAY and QCOM. While the focus of this research is on SSS trend forecasting for newly listed stocks, therefore, only 23 samples from July 10, 2019 to August 12, 2019 are selected as the training set of target domain. And 42 samples from August 12, 2019 to October 10, 2019 are selected as the test set of target domain. The samples incorporated into the source domain are from the listing date of stocks to July 10, 2019.
In financial community, a lot of investors and fund managers use technical indicators to study the trend of stock price [58]. We select the original stock data and some technical indicators as the input of the model. The model output is one of the rise and fall of the next day’s stock price. The raw stock data include the lowest price, the highest price, close price, adjusted close price, open price and volume.
We now introduce our selected technical indicators in detail. The first technical indicator is the Simple Moving Average (SMA). SMA reflects the trend of stock price change. If SMA rises within a period of time, it indicates that the stock price has a tendency to rise; otherwise, it indicates that the stock price has a downward trend. The second technical indicator is the Exponentially Weighted Moving Average (EWMA). EWMA, which is an improvement of SMA, gives a different weight to the data of each day. The weight of daily data decreases with the increase of time intervals. The third technical indicator is the Force Index (FI). FI reflects the strength of the upward or downward trend of the stock price. The fourth technical indicator is the Commodity Channel Index (CCI). CCI is used to detect whether the stock price is abnormal. The fifth technical index is Ease of Movement Value (EMV). EMV reflects the trend of stock price fluctuation according to the change of stock price and trading volume. The sixth technical indicator is the Price Rate of Change (ROC). ROC is used to detect whether the trend of the stock will change. The seventh technical indicator is the Bollinger Bands (BB). BB reflects the normal wave range of stock price by calculating the standard deviation of stock price.
We assume that,
where in Eq. (30),
where in Eq. (32),
The model we proposed in this work is a new Adversarial Unsupervised Domain Adaptation Network (AUDA-Net), therefore, we compare it with two other adversarial unsupervised domain adaptation algorithms, including UDAB and ADDA. The stocks for trend prediction only contain a small number of samples, consequently, we also choose two classical few-shot learning algorithms for comparison, including MAML [59] and Prototypical Networks [60].
In order to solve the Small Sample Size (SSS) problem, the traditional statistical methods such as Bootstrapping also can be used. However, general traditional methods are based on some statistical assumptions, such as assuming that the parent sample distributions are normal [61]. Due to the instability and complexity of stock time series data, these assumptions may not be valid for the SSS stock trend prediction problems. Consequently, the traditional approach for SSS problems is not compared in this paper.
In addition, we also compare our proposed model with the DL methods which assume that the target domain has a lot of labeled samples, including LSTM and CNN. The experimental performance of these DL algorithms using abundant labeled samples can serve as the experimental performance upper boundary of our algorithm and the other baseline algorithms using only a small number of samples. Experimental comparison with the DL algorithms can intuitively reflect the predictive performance of our proposed algorithm and the benchmark algorithms. These two DL algorithms use four stock datasets as training sets, including samples from March 12, 1986 to August 10, 2019 in ORCL dataset; samples from January 2, 1999 to August 10, 2019 in INTC dataset; samples from September 24, 1998 to August 10, 2019 in EBAY dataset; and samples from December 13, 1991 to August 10, 2019 in QCOM dataset.
The technical indexes we used in the experiment are 3-day SMA, 5-day SMA, 7-day SMA, 3-day EWMA, 5-day EWMA, 7-day EWMA, 7-day CCI, 7-day EMV, 5-day ROC, 7-day upper trajectory of BB, 7-day lower trajectory of BB and 1-day FI. In our experiments, the selected time window size is 3. Consequently, in the target domain, the training set contains 12 samples and the test set contains 31 samples.
Since the value ranges of different variables in our input data are very different, we standardize each variable. We suppose
where in Eq. (38),
In order to compare the performance of different algorithms intuitively, we use trend prediction accuracy as the indicator of algorithm performance.
Our proposed AUDA-Net model consists of two parts, i.e. the sample generation part and the domain adaptation part. The sample generation part is composed of a generator and a discriminator. The generator comprises four fully-connected layers, followed by a BatchNorm layer and a LeakyReLU layer, and one fully-connected layer with tanh non-linearity (
The second part, i.e., the domain adaptation part, is constituted with a feature extractor, a class classifier and a domain discriminator, all together. The feature extractor consists of two convolution layers, followed by a BatchNorm layer, a max-pooling layer and a ReLU layer. The class classifier consists of two fully-connected layers, combined with a BatchNorm layer and a ReLU layer, and one fully-connected layer, followed by a LogSoftmax function (
Experimental results
Next, we will report our experimental results. As stated in Section 4.1, ORCL, INTC, EBAY and QCOM are selected as the target domains. Eight groups of experiments are planned and implemented, with their specific settings being presented in Table 1. And the trend prediction accuracies acquired by each corresponding algorithm in these eight groups of experiments are reported in Table 2.
The specific settings of source and target domains in each group of experiments
The specific settings of source and target domains in each group of experiments
Trend predictive accuracy of each corresponding algorithm in each group of experiments
Remark: Since there are only 31 test samples in the target test sets, it is common for the corresponding algorithms to obtain the same prediction accuracies in different groups of experiments.
Different algorithms verified on ORCL (AMZN as the source domain).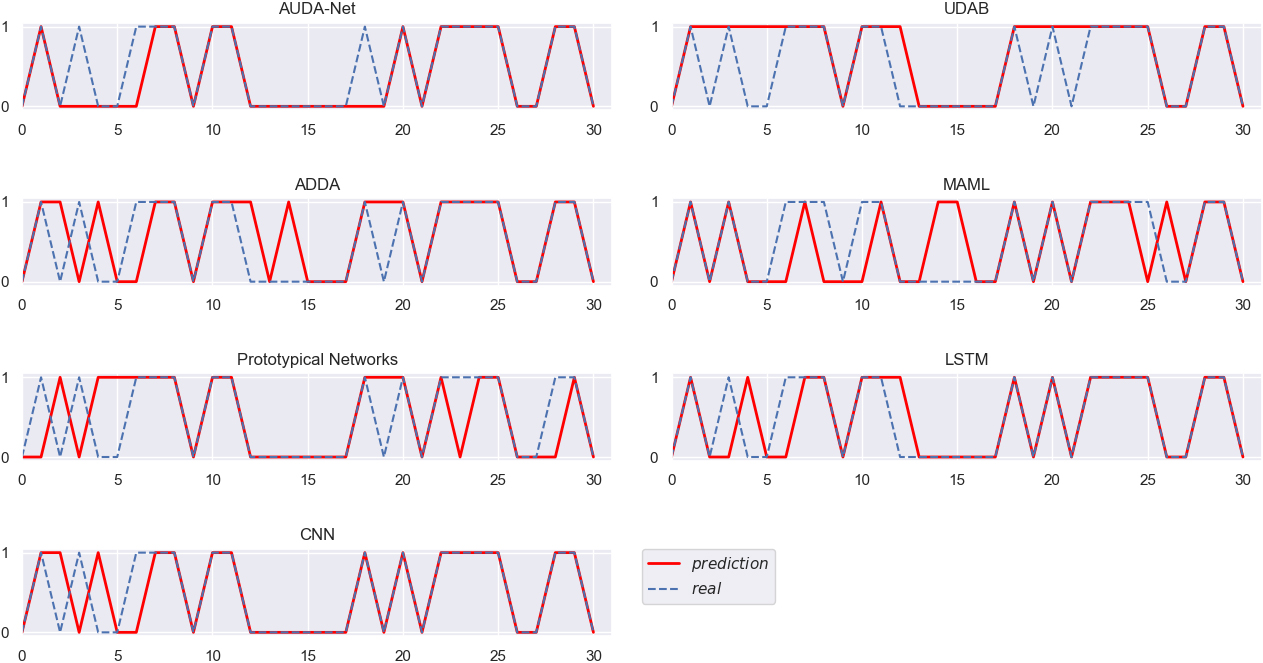
The real trends of stocks and the stock trend prediction results obtained by different algorithms in the eight groups of experiments are displayed in the Figs 3–10, clearly and intuitively. In Figs 3–10, the x-coordinate, ranging from 0 to 30, represents the specific target test samples, while the y-coordinate represents the class of the target test samples, i.e., the rise or fall of the next day’s stock price, with “1” indicating the rise and “0” the opposite.
Different algorithms verified on ORCL (AAPL as the source domain).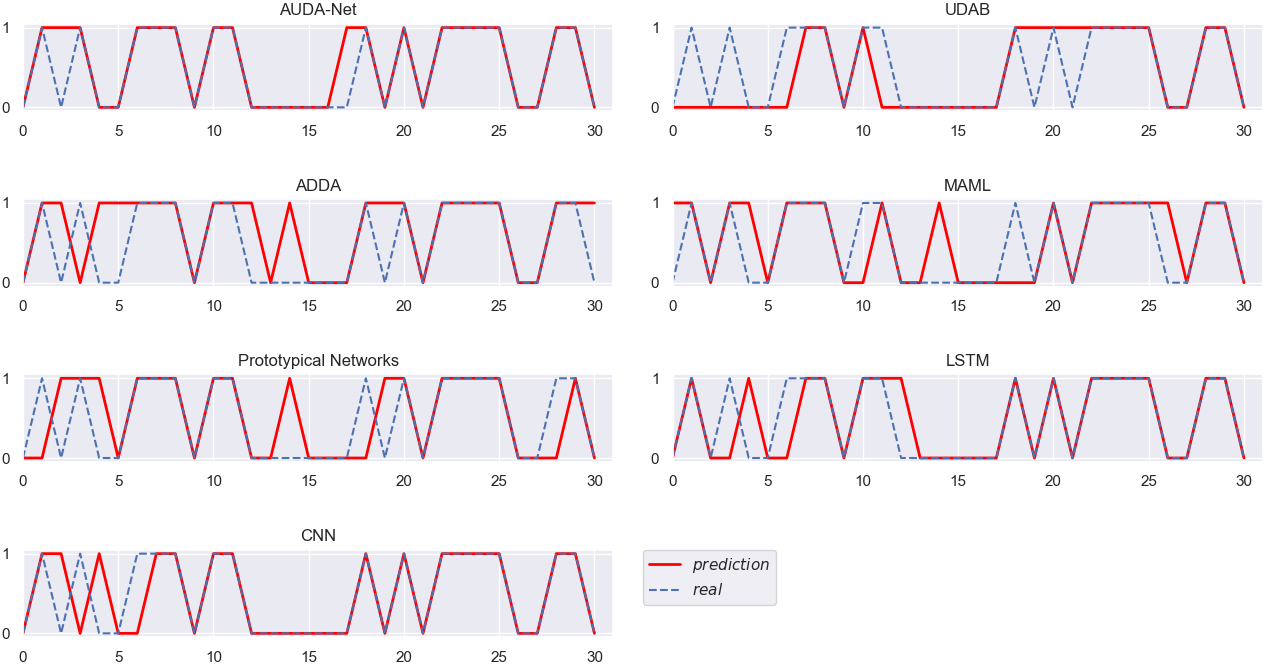
Different algorithms verified on INTC (EBAY as the source domain).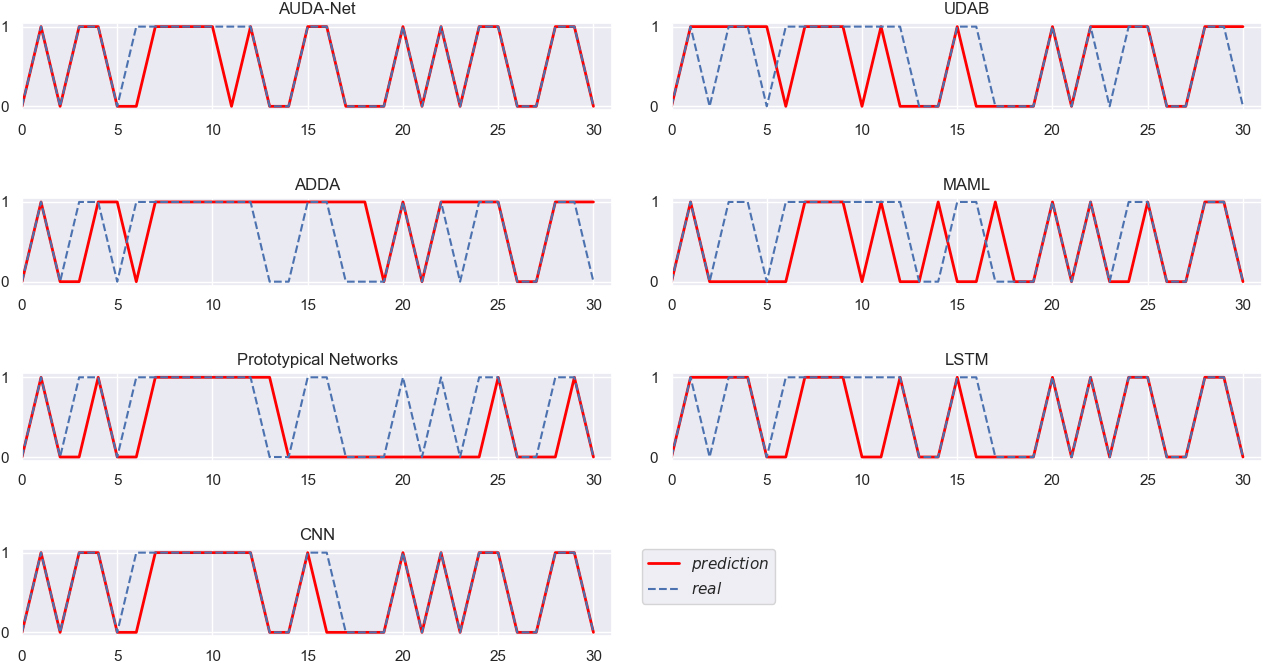
Different algorithms verified on INTC (AMZN as the source domain).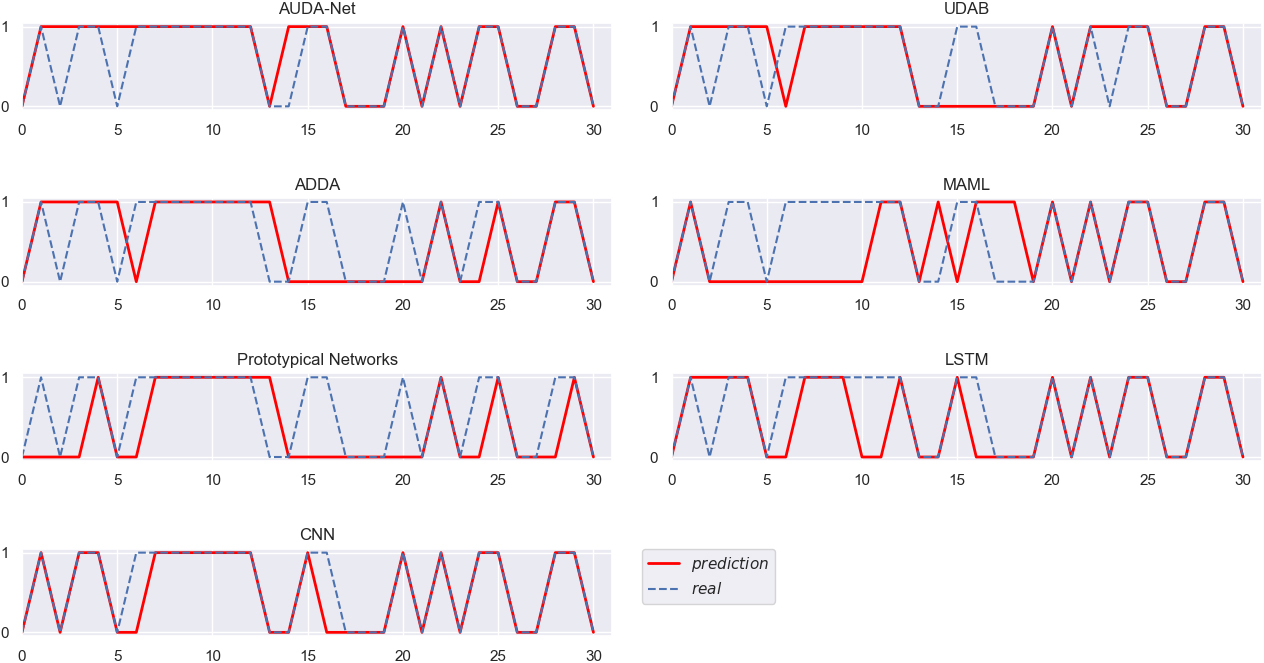
Different algorithms verified on EBAY (BABA as the source domain).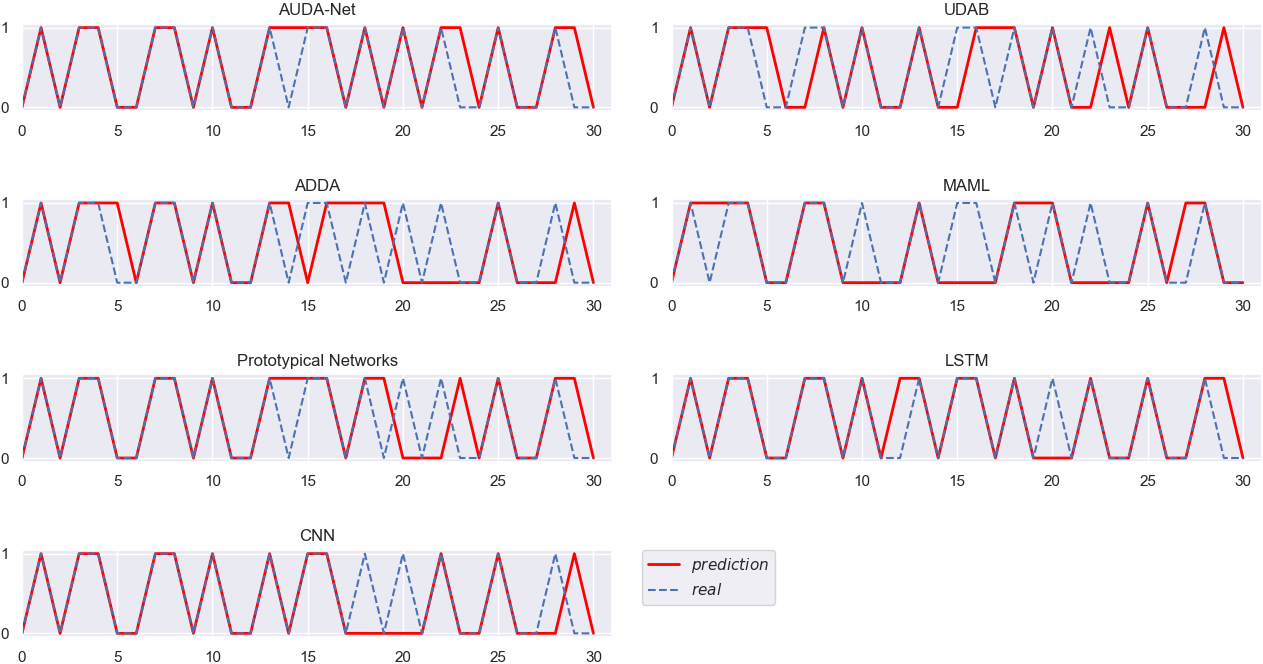
Different algorithms verified on EBAY (ORCL as the source domain).
Different algorithms verified on QCOM (INTC as the source domain).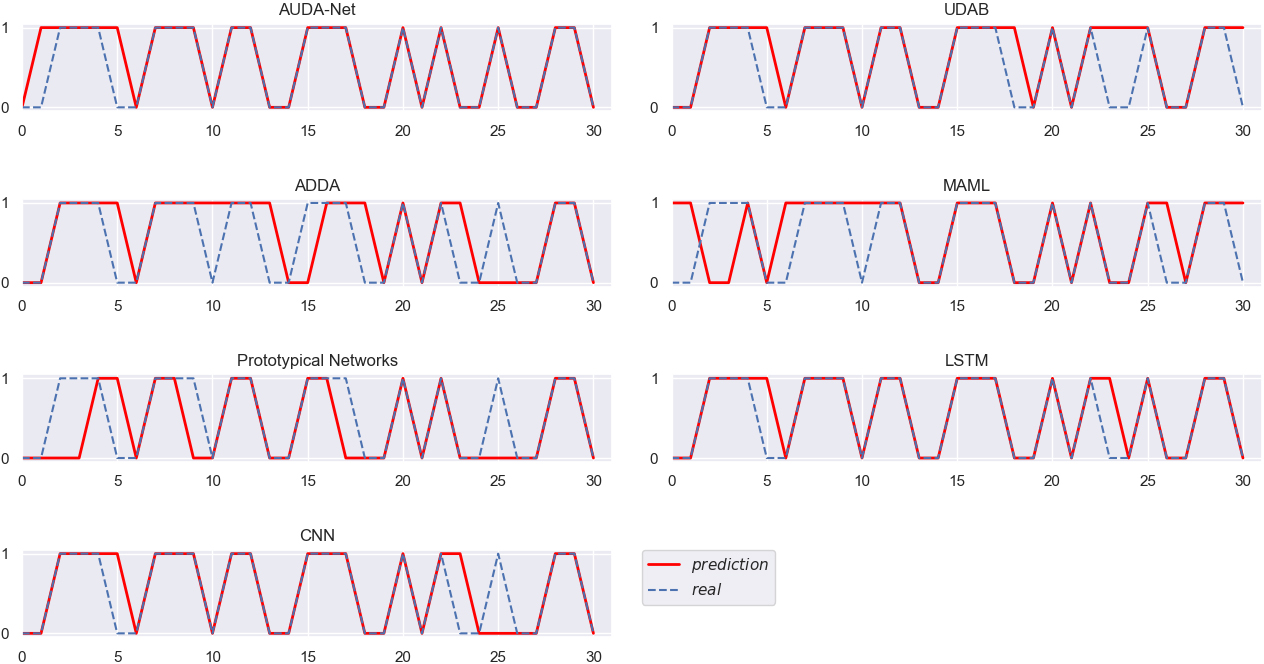
Figures 3–10 intuitively show the real stock trend and the stock trend predicted by the corresponding algorithms. It can be found from the experimental results reported in Figs 3–10 and Table 2 that, among all the conducted algorithms suitable for SSS problems, our proposed model achieves the best trend prediction accuracy, far better than those of the other comparison algorithms. While the UDAB model achieves the suboptimal accuracy in all but the fifth group of experiments. In the second and sixth groups, the prediction accuracy of the MAML algorithm is suboptimal, while the Prototypical Networks achieve the second best accuracy in the fifth and eighth groups. In the three groups including the second, fifth and sixth groups, the ADDA model achieves the worst accuracy, while the accuracy of the MAML algorithm is the worst in four groups, i.e., the third, fourth, seventh and eighth groups. The Prototypical Networks achieve the worst trend prediction accuracy in two groups of experiments, i.e., the first and sixth groups.
In order to prove whether the prediction performance of our proposed AUDA-Net model is significantly higher than other benchmark algorithms using only a small number of samples,
Predictive accuracies t-test results between AUDA-Net and the other benchmark algorithms on the eight groups of stock datasets
Remark: In Table 3, H
Different algorithms verified on QCOM (EBAY as source domain).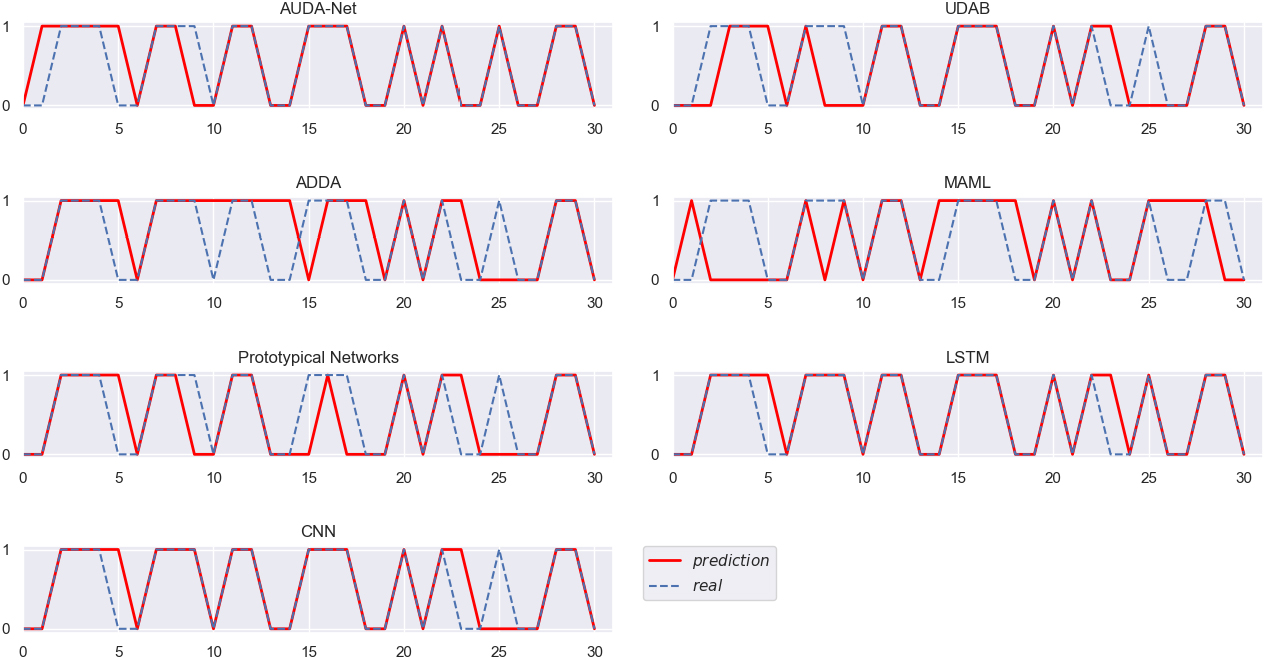
In this part, five-fold cross validation is employed to further evaluate the predictive performance of our proposed model and other benchmark algorithms. Since the LSTM model and CNN model are trained on a large number of labeled samples, we only use cross validation to test the trend prediction performance of our proposed model and the other comparative algorithms using a few samples in this paper. As with Section 4.4, in each group of experiments, the stock samples from July 10, 2019 to October 10, 2019 are selected as the datasets of target domain. In Section 4.4, the dataset of target domains is divided into two parts. The stock samples of the first month are used as the training set of target domain and the remaining stock samples are selected as the test dataset of target domain. Specially, in cross validation, the dataset of target domains is divided into five equal-sized folds. For each repetition, four folds are selected as the training dataset of target domain and the remaining one is selected as the test dataset of target domain. The dataset of source domain is the same as Section 4.4. After five repetitions, the mean prediction accuracies for the five repetitions are computed to evaluate the predictive performance of our proposed model and other benchmark algorithms using a few samples. The mean prediction accuracies of the different methods trained on a few samples are presented in Table 4. The results of Table 4 show that, in cross validation, the average accuracies of our model are obviously higher than other algorithms using a few samples.
Experimental results of cross validation obtained by each corresponding algorithm on the eight groups of stock datasets
Experimental results of cross validation obtained by each corresponding algorithm on the eight groups of stock datasets
The specific settings of source and target domains in each group of experiments
The listing date of target domain stocks
In this section, four groups of experiments on newly listed stocks of the U.S. stock market are added to evaluate the performance of the AUDA-Net model in the trend prediction of newly listed stocks. As with Section 4.5, due to the lack of training samples, the LSTM and CNN models cannot be used to predict the trend of newly listed stocks. The newly listed stocks, which are selected as the target domains, include TPG Inc. (TPG), Amylyx Pharmaceuticals, Inc. (AMLX), Credo Technology Group Holding Ltd (CRDO) and ProFrac Holding Corp. (ACDC). The specific settings of source and target domains in each group of experiments are presented in Table 5. In order to simulate the trend prediction scenario of newly listed stocks in reality, the target domain is consisted of four months of data after the listing. Out of these four months of data, the data for the first two months is used as the training set and the remaining data is used in testing. Table 6 shows the listing date of newly listed stocks which are added to the target domain. The trend prediction accuracies acquired by each corresponding algorithm in these four groups of experiments are reported in Table 7.
Trend predictive accuracy of each corresponding algorithm in each group of experiments
Trend predictive accuracy of each corresponding algorithm in each group of experiments
As shown in Table 7, among all the conducted algorithms suitable for the stock prediction problem of newly listed stocks, our proposed AUDA-Net model achieves the best trend prediction accuracy, far better than those of the other comparison algorithms. It can be found from the experimental results reported in Tables 2 and 7, the AUDA-Net model has significant advantages in predicting the trend of Small Sample Size (SSS) stocks whether the target domain comes from large and older stocks or newly listed stocks.
The above experimental results on the eight groups of datasets demonstrate that our proposed model possesses the best SSS trend prediction performance among all the experimental models. UDAB and ADDA, which are also adversarial unsupervised domain adaptation algorithms, have lower predictive accuracy than our proposed model, and are not stable enough. The possible causes of these experimental results are analyzed as follows:
Firstly, because there are too few samples in the target domain, it is difficult for the feature extractor to extract the basic law of target samples, and the phenomenon of over-fitting is easy to occur.
Secondly, the large gap between the number of source samples and the number of target ones leads to the imbalance of domain categories. The classification results of the domain discriminator may be biased to the source domain, resulting in the different distributions between source features and target ones.
Thirdly, the imbalance of domain categories may leads to the situation that the class classifier trained on the source samples cannot be well applied to the target ones.
The predictive performance and stability of MAML and the Prototypical Networks, both of which belong to few-shot learning algorithms, are also worse than our proposed model. After our analysis, the possible problems of the MAML algorithm might be as follows:
Firstly, each task only contains the same combinations of sample categories, i.e., the rise and fall of the next day’s stock price. Consequently, it is difficult for the MAML algorithm to obtain a model with strong generalization ability by learning a large number of similar tasks.
Secondly, the few-shot learning algorithms assume that, although there are not a large number of samples in the target classification task, there are a quantity of similar classification tasks with a small number of samples. However, this assumption is not valid for the SSS stock trend prediction problems studied in this paper.
After our in-depth analysis, Prototypical Networks may also face the following issues:
Prototypical Networks project all the training samples of the target domain into a shallow space, and calculate the mean values of the samples of different classes as the prototypes of classes. Then, the class of the test sample will be determined depending on the class of its nearest prototype. However, the number of training samples in the target domain is too small, and consequently, it may lead to inaccurate calculation of the prototype of each class in the target domain.
By comparing with the DL algorithms using a large number of labeled samples, we find that our proposed model can basically achieve the same level of predictive accuracy as them, or even higher accuracy on some groups of experiments. The possible reasons are analyzed as follows:
Firstly, in the few-shot problems, due to the large gap between the numbers of the source and target samples, traditional adversarial domain adaptation algorithms may confront with the imbalance problem of domain categories. Therefore, in order to overcome the problem of insufficient samples in the target domain, we generate massive fake samples with the same distribution as target samples by training a GAN model.
Secondly, in order to minimize the difference between the source and target domains, we train a feature extractor and a domain discriminator to make the features extracted from the source samples and the target ones have the same probability distribution. Consequently, the classifier trained based upon the source samples can be well applied to the target ones.
Conclusions and future works
In recent years, there are many innovative attempts in the field of stock trend forecasting. But almost all of the studies are about the stocks with massive samples, and there are few studies on newly listed stocks with a few samples. In order to fill the blank of stock trend prediction in this aspect, we propose a novel Adversarial Unsupervised Domain Adaptation Network (AUDA-Net) based on GAN.
The main advantages of our model are summarized as follows:
Firstly, newly listed stocks only have a small number of samples. Therefore, if we seek to effectively predict the trend of newly listed stocks, the first problem to be solved is the SSS problem. To this end, we train a GAN model to generate massive fake samples with the same distribution as the target samples, and then design the AUDA-Net model for trend prediction. Our proposed model can effectively solve the problem of insufficient samples of newly listed stocks, and accurately forecast their trend.
Secondly, we embed a domain adaptation sub-procedure into the representation learning process. By minimizing the difference between the extracted source features and the extracted target ones, the class classifier trained on basis of the source samples can make trend prediction, reasonably and effectively, for the target samples.
Thirdly, only a small number of samples can be obtained in many other actual application scenarios of time series classification. Our model can also be applied to the time series classification scenarios with only a small number of samples. Moreover, we do not need to use any labels, which reduces the cost of labeling.
Looking forward to the future, we will improve our model in the following aspects. Firstly, in this work, we employ the most basic GAN model to generate transferable samples. In our future research, we will attempt to replace GAN with its improved variant models, such as Conditional Generative Adversarial Nets (CGAN) and Wasserstein GAN (WGAN). Secondly, the single-source domain adaptation paradigm intensively studied in this work will be extended to a multi-source one, aiming at better implementing SSS stock trend prediction.