
Abstract
The amount of information nowadays is rapidly growing. Aside from valuable information, information that is unrelated to a target or is meaningless is also growing. Big data and broader digital technologies are considered the primary components of smart city governance and planning. Big data analysis is considered to define a new era in urban planning, research, and policy. Effective data mining and pattern detection techniques are becoming very important these days. Processing such a large amount of data entails the use of data mining, a technique that clarifies the association between valid information and excludes irrelevant data to implement a practical decision tree. A large amount of data affects processing time and I/O costs during data mining. This study proposes to distribute data among multiple clients and distribute a large amount of data computation equally to improve the resource cost problem of exploration. Following that, the main server consolidates the computation results and generates the survey results. Experiment results show that the proposed algorithm is superior, thus allowing a larger amount of data to be processed while producing high-quality results.
Introduction
The amount of information nowadays is growing rapidly. Aside from valuable information, information that is unrelated to a target or is meaningless is also growing. Big data and broader digital technologies are considered the primary components for smart city governance and planning. The analysis of big data is considered to define a new era in urban research, planning, and policy. These days, effective data mining and pattern detection techniques have become important. Processing such a large amount of data entails the use of data mining, a technique that clarifies the association between valid information and exclude irrelevant data to implement a practical decision tree. During data mining, the processing time and I/O cost are affected by the large amount of data. With the aim of improving the resource cost problem of exploration, this paper proposes to distribute data among multiple clients and distribute the large amount of data computation equally. The main server then consolidates the computation results and generates the survey results. Experiment results demonstrate the superiority of the proposed algorithm, thus allowing a larger amount of data to be processed and producing high-quality results.
Background
With the rapid evolution of technology nowadays, the volume of information of all types has increased. Such data are not only increasing in terms of their total amount but also their types. Computing has expanded from desktops to mobile devices, and it is now a ubiquitous part of the entire human environment. Buildings, vehicles, infrastructure, and manufactured goods can be detected and analyzed from the surrounding environment by using chips and sensors. The amount of such readings is gathered as terabytes, providing a rich amount of raw information about urban living. The following are some examples of urban big data that are currently in use: high-resolution time series satellite imagery of metropolitan areas, a city’s health care records, or the location of handsets in an urban area over a long period of time. However, unprocessed data are merely a string of meaningless data. Value is created only by information that is explored, analyzed, and processed, and the new data age we are experiencing uses information to create value. Data mining involves processing a large amount of data. It can be used in daily life; it can infer the preferred usage patterns of most customers in terms of the videos they watch and the products they buy. For example, data mining can be used to infer the combination of beer and diapers during family purchases, and other information such as weather and traffic situation can be analyzed and predicted to compile useful information for the public.
Data mining can be divided into six categories: classification, clustering, regression, time series forecasting, association, and sequential pattern. This paper focuses on classification analysis, especially the popular decision tree algorithm. Different types of algorithms are included, such as ID3 [1], CART [2], CHAID [3], and QUEST [4], the most popular of which is ID3, which is easy to understand and is preferred by most decision tree researchers. However, ID3 is a relatively simplified computational method and thus has some drawbacks, such as an inability to process continuous data and vacant data. The C4.5 algorithm [5] is based on the ID3 algorithm and improves some of its defects. Currently, with the large amount of data processing being performed, many researchers have improved their computing methods to distributed computing and parallel computing to enhance the execution efficiency by processing data simultaneously.
Motivation
C4.5 is a topic of heated discussions and widely cited in various fields nowadays. C4.5 has been used to predict the dropout rate of some school districts [6], predict academic success of higher education [7], or generate targeted advertising systems [8]. Although C4.5 has been widely adopted in many fields, the amount of information has increased and become more varied with the continuous progress of science and technology. Thus, several problems, including lengthy processing time, insufficient access space, and high I/O costs, impede the technical development of C4.5:
1) Lengthy processing time: With the exponential growth of data volume today, the data available for use or analysis are growing, not only terms of the total amount but also the variety and complexity. The time spent accessing, classifying, and analyzing a large amount of data is seriously affected by these alterations and will become significantly worse. 2) Insufficient access space: With the growth of data, the space for temporary data records needs to grow as well. Increasing memory and disk space availability only temporarily solve the problem of inadequate space. Over time, the problem of lack of space will come to the forefront again. 3) Excessive I/O cost: When the size of data exceeds the capacity of the memory, storing temporary data in a database or a disk will entail the cost of access time, thus causing the processing of a large amount of data to take much longer than expected.
To overcome these problems, some researchers propose to combine C4.5 with distributed systems. In the C4.5 algorithm, the dataset is accessed several times, sorted, classified, and then computed according to the result. When a dataset is too large, more time is needed to access the dataset and process its contents, resulting in poorer computational performance. Using a distributed system to perform the computation can reduce the execution time of the algorithm. The Hadoop system is a well-known distributed system that can store and process large amounts of data and perform distributed computing through the MapReduce architecture [9].
Many researchers have attempted to implement C4.5 in MapReduce with the goal of reducing the execution time with this framework [10, 11, 12, 13], but none of the research results showed significant improvement in reducing the running time. The reason for this lack of improvement is that the data are more evenly dispersed, thus resulting in a more complex structure of the result tree. It is clear from the algorithm’s procedure that it has existing problems. The dataset has to be accessed multiple times during the computation and the data have to be transferred frequently to each node device before the execution is completed, thus generating heavy I/O cost loading. That is, the MapReduce approach has the disadvantage of taking a long time to access and transfer data.
To address the above problem, we abandoned the MapReduce approach and completely redesigned it. In this study, we propose storing data separately in each node device so that each device can maintain data integrity, and the primary device only allocates data that needs to be computed. The node devices can access and classify the data respectively, analyze the data according to the number of computations required, and then return the computation results to the node devices. This approach addresses the load of frequent communication and the I/O cost of accessing and classifying data on the primary device, thus accelerating the execution time.
Contribution
With the advancement of science and technology, the amount of data has grown not only massive but also extremely diverse. The purpose of this research is to reduce transmission costs between master and servant devices by reading datasets from each device through a decentralized computing architecture and to speed up the execution of the C4.5 decision tree. Performance tests for various scenarios are conducted in this research. The experimental results show that the algorithm tends to be more stable when the number of data points increases. The performance also improves as the number of attributes increases. When we experimented with different data set sizes, the algorithm’s performance improved from 42% to 32% when the data set size changed from 5000 to 30000 K.
As for the experiments on various parameters, when the number of meaningful attributes is increased, the performance of HEC4.5 not only retains the advantage of only 29% of the execution time speed but also shows a stable trend. Regarding the number of data classifications, the execution speed of the algorithm proposed in this study remains more than twice as fast, requiring only 34% of the execution time. Additionally, as the number of redundant attributes increases, so does the execution speed of both standalone and HEC4.5, whereas the proposed algorithm takes only 32% of the execution time. Finally, the number of repetitive features was observed, and it was found that HEC4.5 can mitigate the effect of the data set when the number of parameters increases, and it can outperform the standalone version in terms of time performance, requiring only 32% of the execution time.
The proposed algorithm’s performance in experiments on the characteristics of various large data sets shows not only a stable trend but also obvious superiority in the performance when the data becomes larger or more complex.
This paper is organized as follows: Section 2 briefly introduces the C4.5 algorithm, related research, and previous research on the C4.5 distributed system. Section 3 describes in detail the proposed distributed C4.5 algorithm and its operation process. Section 4 presents the experiments and results of the research, and analyzes the benefits and drawbacks of the proposed method with respect to another related research. Section 5 concludes the research and discusses future development trends.
Related work
This section introduces previous studies that are closely related to the proposed method. Section 2.1 introduces the data mining principle, Section 2.2 introduces the ID3 decision tree algorithm, Section 2.3 introduces the C4.5 decision tree algorithm execution steps, and Section 2.4 introduces the reference decision tree decentralized research framework.
Data mining
Data mining involves using a developed model to identify associations between data from large datasets or databases, and analyzing and utilizing the associations found. For example, the sales records of a shopping mall can be used to determine which products are frequently purchased together and under what circumstances, thus enabling some consumer patterns of the mall to be identified and used to promote merchandize or adjust the order of products on the shelves.
The models developed for data mining are mainly divided into six types: classification, clustering, regression, time series forecasting, association, and sequential pattern analysis. This study highlights classification analysis and improves the problems of the C4.5 algorithm.
ID3 decision tree
In 1986, J.R. Quinlan proposed the ID3 decision tree algorithm [1], which computes the magnitude of the effect of each data item on the result from previously collected data items and their corresponding results. The algorithm uses magnitude as a reference for the node weights to derive a decision tree that can infer the results with the new data content. The authors used the training dataset in Table 1 as an example based on weather, temperature, humidity, and wind intensity. The ID3 algorithm was used to generate a tree structure with high accessibility and usability, which was then used to determine whether it was appropriate to go out and play golf on a certain day. The following dataset and diagram illustrate the steps of ID3 implementation.
Example dataset for ID3
Example dataset for ID3
ID3 uses entropy and information gain formulas to select the appropriate attribute split point. Outlook is taken as an example. With the use of the following entropy formula (Eq. (1)), we can compute Sunny as 0.97, Overcast as 0, and Rainy as 0.97. The following information gain formula (Eq. (2)) is used:
The information gain of Outlook as 0.246 is derived by taking the entropy
The authors of the ID3 algorithm found that the entropy is incorrect if any omission occurs in the attribute data during the selection of attributes. If the attribute data are continuous, then the computation will be heavy and multiple branches will appear, thus making the decision and computation difficult. The ID3 algorithm tends to select attributes with more values, but in practice, it may not be very useful for classification. For this reason, the authors proposed the C4.5 algorithm in 1993 [5] based on ID3 and improves some of its more influential properties.
1) The data processing method was improved to improve ID3’s capability to process continuous data; 2) Gain ratio was used as the reference for selecting attributes to enable the attributes to be selected more equitably and prevent meaningless attributes from being selected; 3) Calculation was performed on a proportional basis to avoid calculation errors caused by missing data; 4) When building a tree structure, it can be pruned to avoid overfitting.
The C4.5 algorithm was the first among the top ten data mining algorithms published by Springer LNCS in 2008 and has become widely known in the field of data mining [14]. The steps of C4.5 implementation are shown below, and Table 2 illustrates the details of the computation.
The data are accessed according to specific conditions, and whether the data to be analyzed are continuous or discrete is determined. The data are distinguished so that the continuous attributes can be preprocessed. For continuous attributes, the data are sorted according to size, and all the data that can be regarded as split points are evaluated. Then, the information gain of all split points is evaluated and for the discrete attributes. The gain ratio of each attribute is computed and compared, and the attribute with the largest value is selected as the best attribute for this splitting. This attribute is added as a new condition node to classify the data when analyzing again. The data are accessed again with the new conditional node tree, and whether the analysis could be continued is determined. If so, then step 1 is performed again for analysis and integration until the analysis is finished.
Example dataset for ID3
Classified data for C4.5.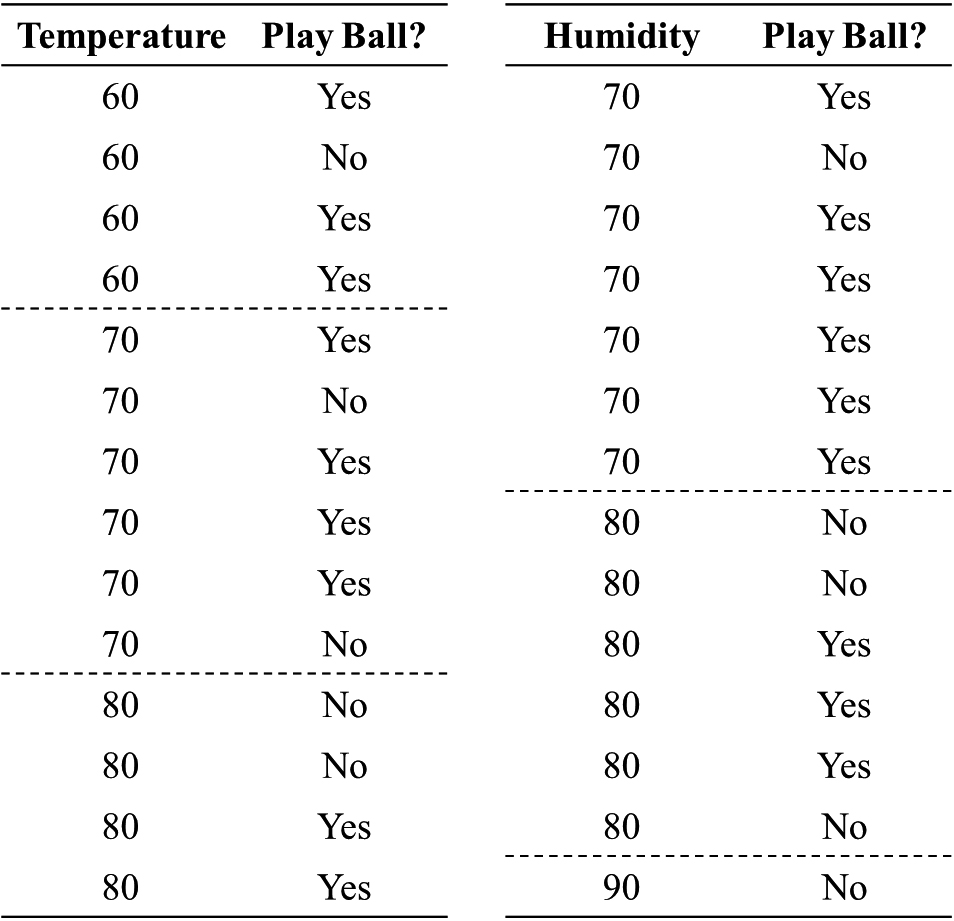
The first step is to determine the continuous attributes. Continuous data need to be preprocessed; thus, temperature and humidity are used as examples for classifying continuous data. First, we sort the accessed data and then calculate all the split points in the attributes. The information gain and gain ratio of each split point are evaluated as well. As shown in Fig. 1, the split points obtained after sorting by temperature are 60, 70, and 80; the split points of humidity are 70, 80, and 90.
Selecting the best attribute
To select the best attribute, the evaluation is performed on the obtained split points. The entropy of the split dataset is evaluated first. From the Play Ball column of Table 2, 14 data with 9 “yes” and 5 “no” are derived. Substituting
We take the first split point 60 as an example and divide the dataset into two parts
In this procedure, the split point 70 of temperature is 0.025, and the split point 80 is close to 0. The information gain of all the split points of temperature can also be determined, and the split point 70 with the highest information gain can be taken as the best split point of the attribute. In the same way, the information gain of each split point of humidity can be determined, and the best split point is selected.
Evaluated information of split points for C4.5.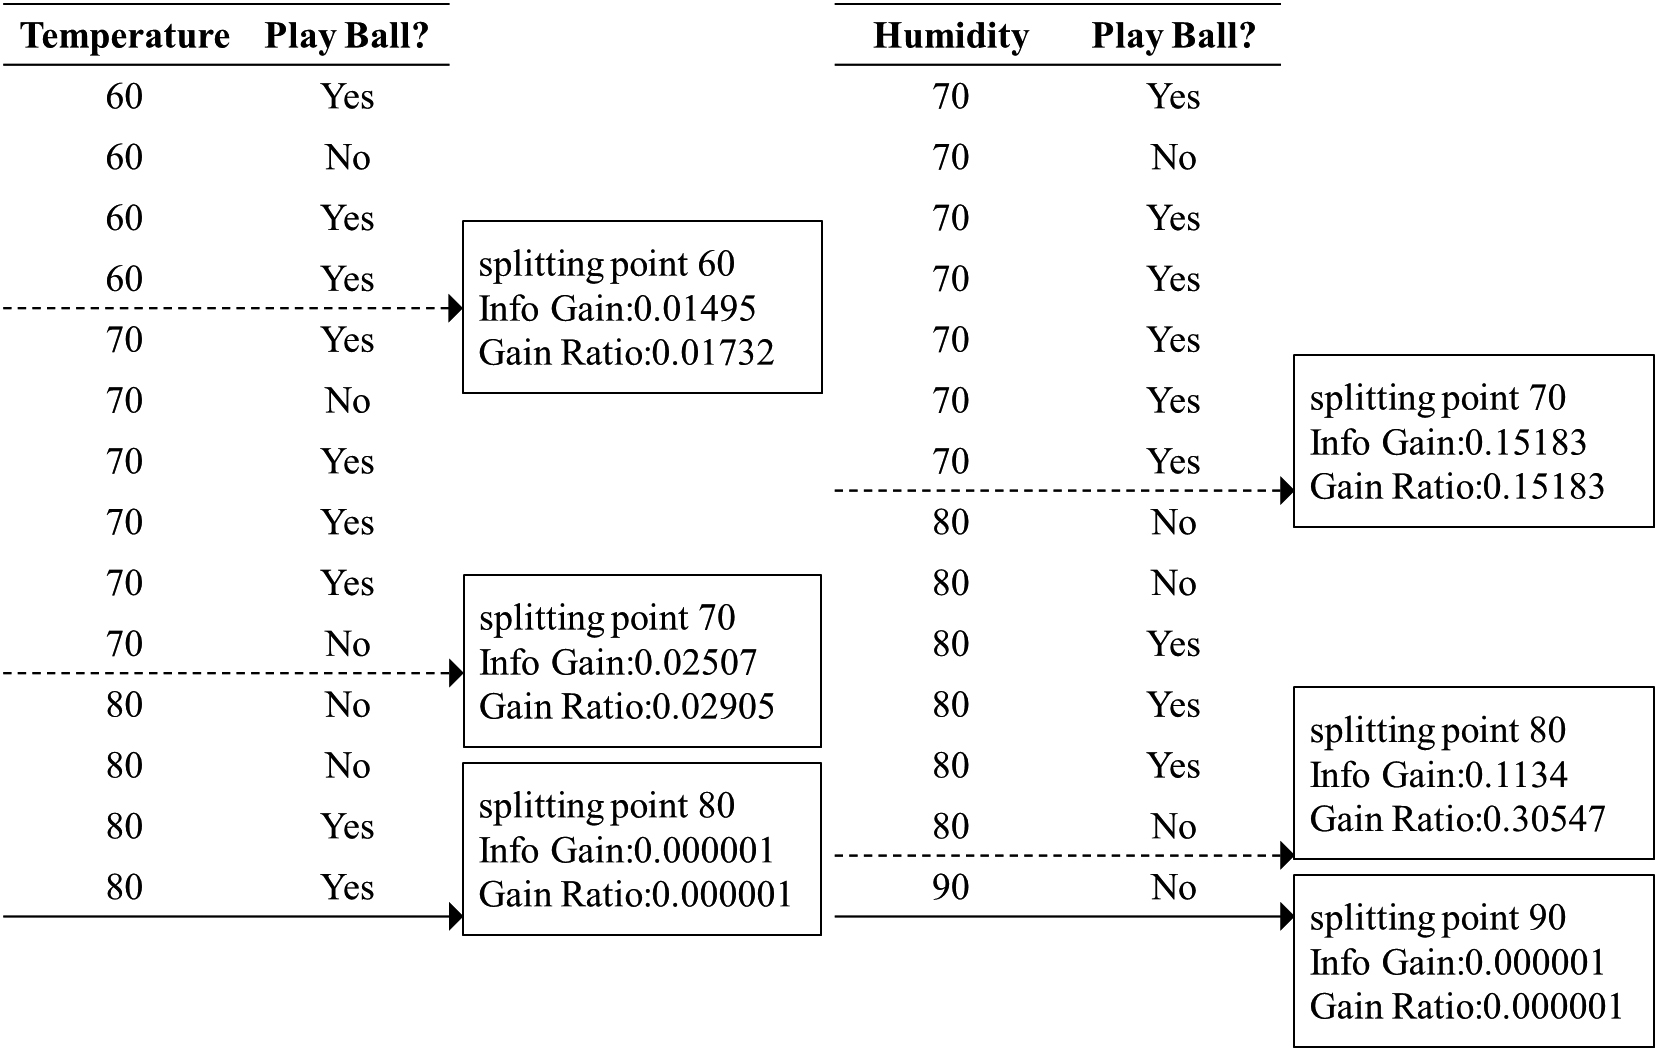
Then, the split information of the attribute is determined to show the dispersion of the split point of the attribute. The temperature attribute 70 is taken as an example. The amount of data in the dataset is 14, where 4 for temperature
Finally, the information gain and split information of each of the above attributes are substituted into Eq. (6) to obtain the gain ratio, e.g., the gain ratio of the temperature attribute 70 is 0.029.
Figure 2 shows gain ratio for the humidity attribute 70 is 0.151, and the gain ratio for the outlook attribute is 0.156 and the gain ratio for the wind attribute is 0.049. The gain ratio for each attribute can be used for evaluation, and the maximum gain ratio is used as the best attribute. The value of the attribute is used as a filtering criterion and for analyzing and integrating the dataset into each criterion when the data are read next time. This cycle continues until the data analysis is completed.
As the amount of data increases, the access time lengthens due to the memory space limitation, thereby degrading the performance of the C4.5 algorithm. To address the space and time problems, scholars proposed integrating decision trees with distributed systems by using data organization and distribution. To overcome memory capacity constraints, Wei Dai et al. integrated the C4.5 algorithm with MapReduce to produce a new analytic architecture [11]. They customized several structures by using MapReduce combined with a custom attribute table. However, the results did not show a significant time cost reduction for I/O. Moreover, because MapReduce continuously stores the data to the hard disk, the access speed of the program is slower than the memory access, thus delaying the execution time. The integration of MapReduce and the C4.5 algorithm with distributed processing was proposed by Mu Y. et al. [9]. This method utilizes two distributed approaches to build tree nodes: MR-A-S and MR-D-S. MR-A-S utilizes the formula of the C4.5 algorithm to evaluate the optimal attributes and the values of the split points. MR-A-S uses the formula of the C4.5 algorithm to calculate the optimal attributes and the values of its split points. MR-D-S divides the training data into several subdata for subsequent processing. These two methods are performed several times until the results are obtained, and a decision tree is built. However, the size of their test datasets in the paper is below 120 KB, which cannot highlight the advantages of their algorithm. Arati Koli et al. proposed to combine C4.5 with MapReduce [13], with a similar structure to the approach proposed by [11]. The difference between these two approaches is how the map function and reduce function process the data; the map function mainly evaluates the value of split points, while the reduce function uses the gain ratio and determines whether the decision tree is completely constructed. Their results show no significant improvement in the execution speed. G. Wu et al. combined C4.5 and MapReduce with integrated learning and proposes a new set of algorithms [10]. This method uses the concept of machine learning bagging to divide the dataset into several subsets and generate a classifier from each subset. Finally, the classifiers of all subsets are integrated, and the complete decision tree of the dataset is compiled. Their results show that the architecture not only improves the execution time and computational accuracy for distributed processing but also improves the execution speed and accuracy with more subnodes. J.R. Quinlan proposed the integration of bagging and boosting with C4.5, achieving significantly improved accuracy [15]. z.-Y. Xiang reduced and simplified the attributes through rough set theory, prompting an acceleration effect [16]. J. Chen et al. proposed to utilize the cumulative distribution function of statistics to propose KS-tree [17]. Cheng Wang et al. used MRC4.5 in combination with the SVM model and applied it to generate automatic responses to marriage-related legal questions to improve consultation efficiency [18]. Rahman et al. also used MRC4.5 in combined with the SVM model and applied it to distinguish the behavior patterns among networks to improve information security [19].
MR-C4.5 algorithm
This approach [9] was proposed in 2017 by integrating MapReduce with C4.5. The size of the tree can be limited by setting the tree height, data accuracy, and sample size to avoid overfitting. The algorithm is divided into attribute selection, dataset splitting, and tree construction.
1) Attribute selection
This paper utilizes the MR-A-S algorithm to select the best attributes. The algorithm is based on the MapReduce architecture, as shown in Fig. 3. MapReduce can be executed in two parts.
Map stage: The computation task is divided into several subtasks and assigned to each subnode device. The output will be stored as Reduce stage: The output of the previous stage is used to integrate the data with the same key and compute the integrated data to derive the computation result.
MapReduce slices the dataset into several subsets and distributes them into map functions. Each map function analyzes its corresponding data, outputs the best split point attribute and its gain ratio for each attribute, and finally outputs it in
The explanation that follows is also based on the C4.5 example dataset. First, the data set is divided into several sub-datasets as shown in Fig. 4, and the scattered data are classified into Map Function with each attribute as a category, as shown in Fig. 5. Each attribute’s split points and gain ratio are selected in map function. Then, they select the largest gain ratio attribute among all attributes in reduce function, and return their split points and attribute names, as shown in Fig. 6.
MR-A-S architecture.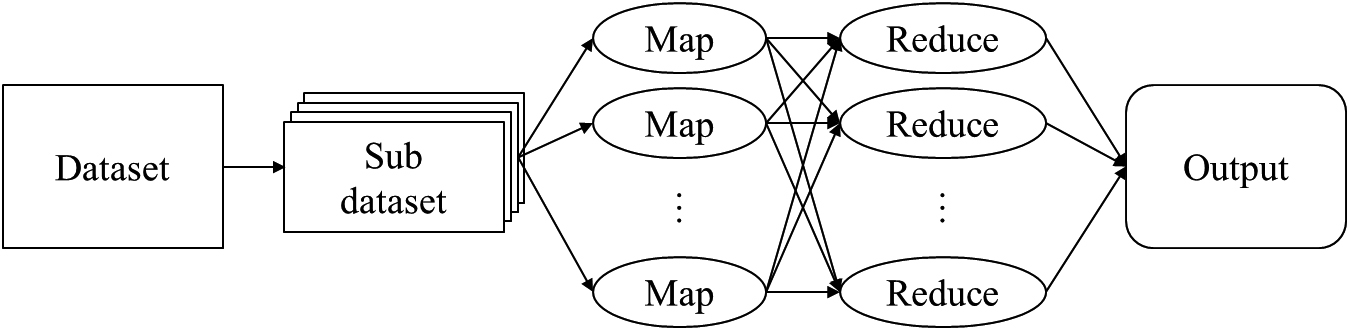
MR-A-S data splits.
MR-A-S data classification.
MR-A-S data integration.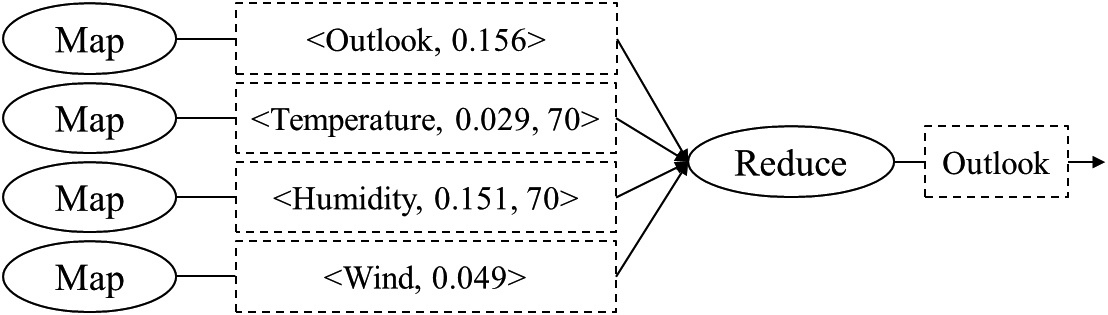
MR-D-S architecture.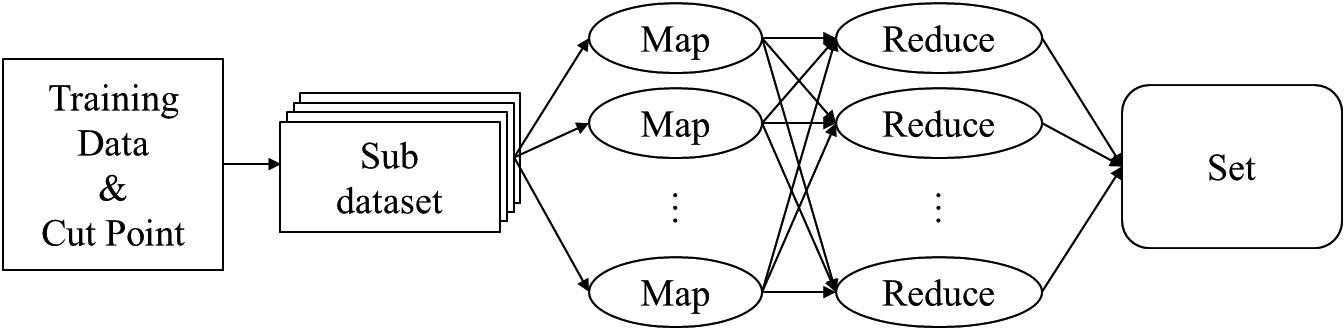
MR-D-S data splitting.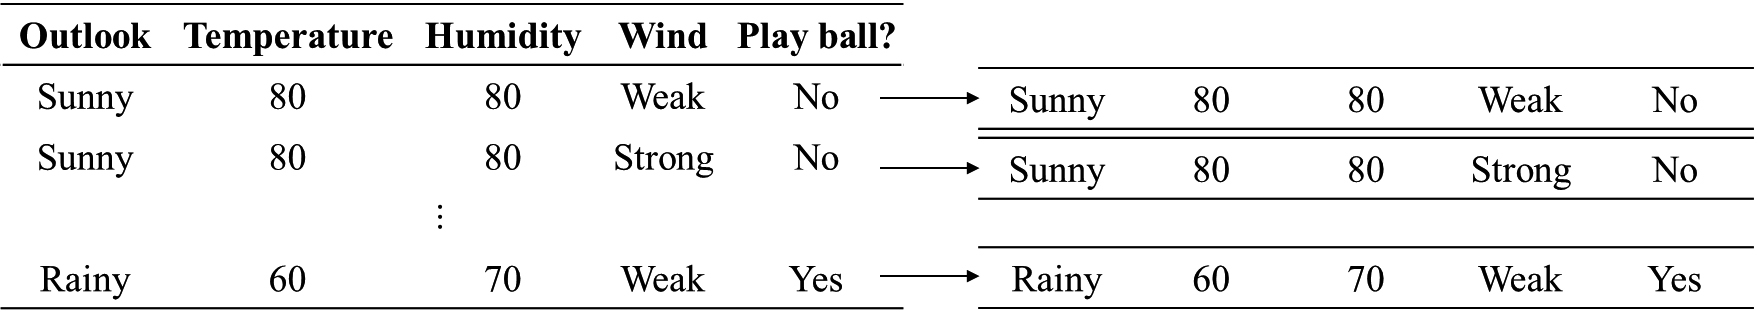
MR-D-S data classification.
2) Dataset splitting
The paper uses the MR-D-S algorithm, with inputs as datasets, attribute nodes, and attribute split points. This part is the same architecture based on MapReduce, as shown in Fig. 7. The dataset is divided into several sub-datasets, and the sub-datasets are considered as the input of the map function. If the node attribute is continuous and greater than the node attribute, then the split point value will be marked as 1 and used as the ID of the data; otherwise, the ID of the data will be 0. If the node attribute is not continuous, then the value of the data is used as the ID, and the output format is
We also use the C4.5 example dataset for illustration. First, the dataset is divided into several subsets, as shown in Fig. 8. In the map function, the values of each attribute are classified by the splitting characteristics of the best attribute, as in Fig. 9. In the reduce function, the threshold value is set and the classification result determines whether the node should be built, as shown in Fig. 10.
MR-D-S classification result compilation.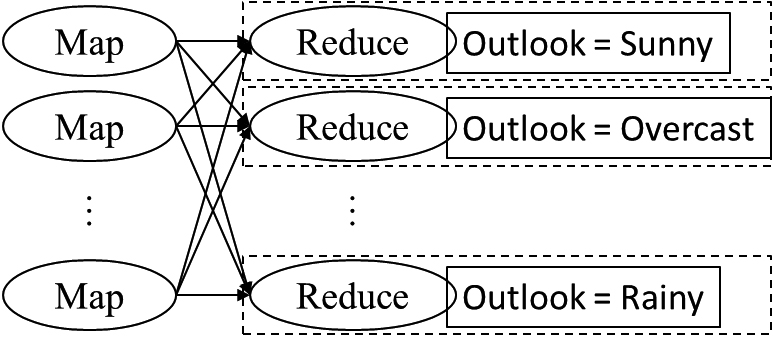
3) MR-C4.5-Tree construction
The growth of the tree is controlled in this part, and MR-A-S and MR-D-S are called recursively to build the tree with a restricted height. The best attributes are selected by MR-A-S, and the data are sliced and new subnodes are created by MR-D-S, and the sliced set is used as a new input. MR-A-S and MR-D-S are performed until the peak of the limit is reached.
The algorithm described above clearly shows that the algorithm proposed in this study will significantly increase the I/O time cost since the data needs to be continuously accessed in the hard disk. This is also the main motivation behind the redesign of C4.5 in our research. Additionally, the test data sets used in this study are insufficient in size for the advantages of the architecture to be highlighted.
In this section, the proposed algorithms are introduced and discussed in detail. In Section 3.1, the problems experienced in the current environment are first defined, and then the improvements are presented after the parts that were modified by previous scholars are discussed. In Section 3.2, the proposed system architecture is described. In Section 3.3, the operation procedure of the algorithm is described in detail with the implementation of an example, and a complete elaboration is given through pseudo code.
Problem definition
The C4.5 algorithm has improved on the deficiencies of the ID3 algorithm, being able to process continuous data and avoid the selection of meaningless attributes. However, the size and complexity of the analyzed dataset are different from before because data collection nowadays has become more diversified. As a result, the memory space is not sufficient for the algorithm to be performed, thus making it difficult to analyze the files. Another problem is that the execution time is too long to obtain effective results for further utilization. Therefore, some scholars proposed to integrate the MapReduce architecture with algorithm to accelerate the operation speed of algorithm and thus overcome the above-mentioned problems. However, the I/O cost increased because the data are stored outside the memory, such as in a database or hard disk, where the access speed is slower and the storage space is larger. The transmission cost between nodes also increased considerably. These conditions make it difficult to improve C4.5.
To addresses the above problem, this paper proposes an algorithm called high-efficiency C4.5 algorithm in distributed computing system (HEC4.5). The dataset files are transmitted to each node so that each node can access the files and analysis by itself, thus reducing the impact of server access efficiency on the overall performance. Whether the number of nodes has reached the optimal number of nodes to be distributed during transmission is determined. This approach reduces the number of nodes that cause excessive transmission time and affect the overall execution time of the algorithm. In each analysis, the number of nodes and the conditions are given to each node so that it is analyzed for only a portion of the data, resulting in a more even and efficient distributed evaluation.
System framework
This section introduces the proposed HEC4.5 algorithm architecture. As shown in Fig. 11, this architecture is divided into two main components: server and client.
System framework for the proposed algorithm.
The main task of the server is to compress the dataset, transmit the file to each client, and then assign the conditions to be analyzed and the number of calculations to each client so that the client can access the file and evaluate the attributes and split points. After the results of all client evaluations are returned, the results of all client evaluations are integrated, and the best attribute for each condition is selected. The split point of that attribute is then recorded. Finally, the selected best attribute is integrated with the original condition content and added as a new condition. After the new condition is generated, it is distributed to each client and the number of attributes is calculated for the client. This sequence then proceeds until the file analysis is finished, and then the distribution of the conditions and the number of counts to the clients is stopped.
The main task of the client is to receive the files transmitted by the server. After file decompression is completed, the client receives the conditions and computes the quantities assigned by the server. All the split points and gain ratios of each attribute are computed under the target condition. Then, the calculation results are returned to the server, and then the server waits for the rest of the clients to finish the evaluation and return the data. After the server has finished consolidating the results, it will receive the conditions and the number of calculations to be analyzed from the server, access the file again, and evaluate the split points of each attribute under the target condition. This procedure is repeated until no new target conditions and computed quantities are received.
This section illustrates the process of the proposed algorithm HEC4.5, which is divided into three parts.
Dataset transmission
The server first compresses the dataset and then transmits the compressed file to the first client. After the first client receives it, it decompresses the file and then proceeds to access and analyze the data. The server then starts to transmit the files to the second client so that the server’s I/O stays at high utilization and keeps data analysis and file transmission in parallel until the file analysis is completed.
Distribution conditions and evaluation
After the client has finished decompression, it can be added to the server’s available client list for the server to assign the target condition and the computation range in the next analysis. The server will distribute the conditions equally among the clients and inform each client of the number of clients assigned to the target condition so that each client can filter the content of the target condition when the file is accessed.
To illustrate the algorithm proposed in this study more explicitly, we refer to the data set used by J.R. Quinlan et al. [1]. Table 3 is taken as an example. Suppose three clients have already finished receiving files, and outlook has been identified as the first node. The conditions to be analyzed are Outlook
Example dataset for the proposed algorithm
Example dataset for the proposed algorithm
Distributed conditions for HEC4.5.
Data count for HEC4.5.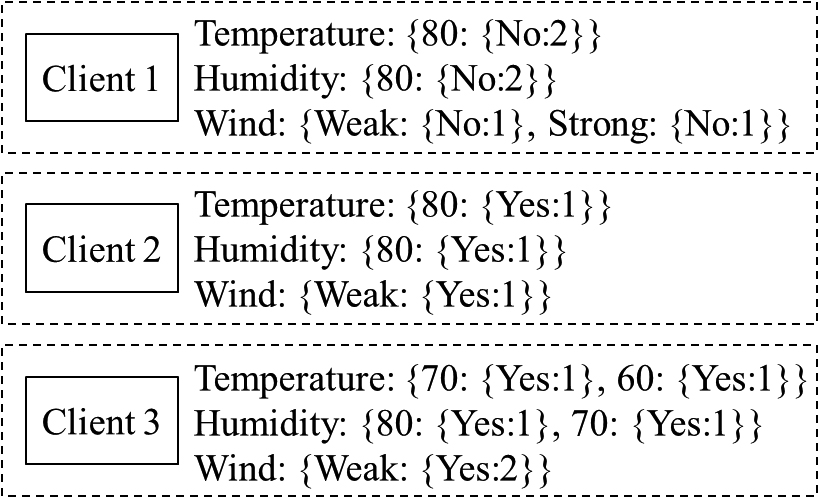
Distributed conditions.
Retransmission and consolidation
After all clients have completed their assigned conditions and calculation ranges, the server will consolidate the best attributes and best split points for each condition returned by each client. The best attributes and split points for each condition are selected and added to the condition column to generate a new list of conditions, as shown in Fig. 15. The new condition column is used to determine if the data analysis is complete. If analysis is still necessary, then the conditions are reassigned to each client, and the number of clients assigned to the target condition is informed. This procedure will continue until the data analysis is completed.
HEC4.5 consolidation result.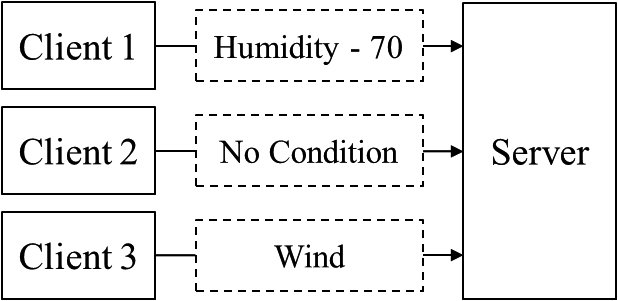
This section will follow up on the previous section and will be complemented by the algorithm pseudo code to make the algorithm procedure more complete.
Server
The following are the server pseudo codes for HEC4.5 and will be explained separately as follows.
1) Transmitting the data and determining the completion of the main server, as shown in Fig. 16
The input is the dataset to be analyzed, and the output is the finished decision tree. The first line compresses the dataset first to reduce the time to transmit the dataset considerably. The second line transmits the compressed dataset to the first client, which is followed by the analysis. The third line keeps the transmission channel active and continues to transmit the dataset to the next client that has not yet finished receiving the dataset, and the fourth line determines whether the analysis is completed through the results returned by each client. The fifth line acquires the list of clients that have completed the file transmission to ensure that classification and evaluation can be initiated immediately after distribution. The sixth line assigns the compiled list of conditions to the acquired client list and starts the classification and computation. The seventh line obtains a new list of conditions from Algorithm 2. The eighth line verifies that the condition list is clear, indicating that the analysis is complete. If it is clear, then it leaves the loop in the ninth line to announce that the data analysis is finished.
Pseudo code for the main server.
2) Assign the method details data processor, as shown in Fig. 17
The input is an unoccupied list, and the output is a consolidated list of conditions. The first to fifth lines confirm if all clients have completed their tasks. If a client has not yet completed its tasks, then the process is put on hold until it is finished. Lines 6–8 define the data returned by each client. Lines 9–13 determine the best attributes of the condition and whether the attributes in the current list are the same. If so, then the information gain is compared, and the larger one is placed in the list. In lines 14–18, the best gain ratio attribute among the different attributes is added to the list and finally returned to the main server in line 21.
Pseudo code for data processor.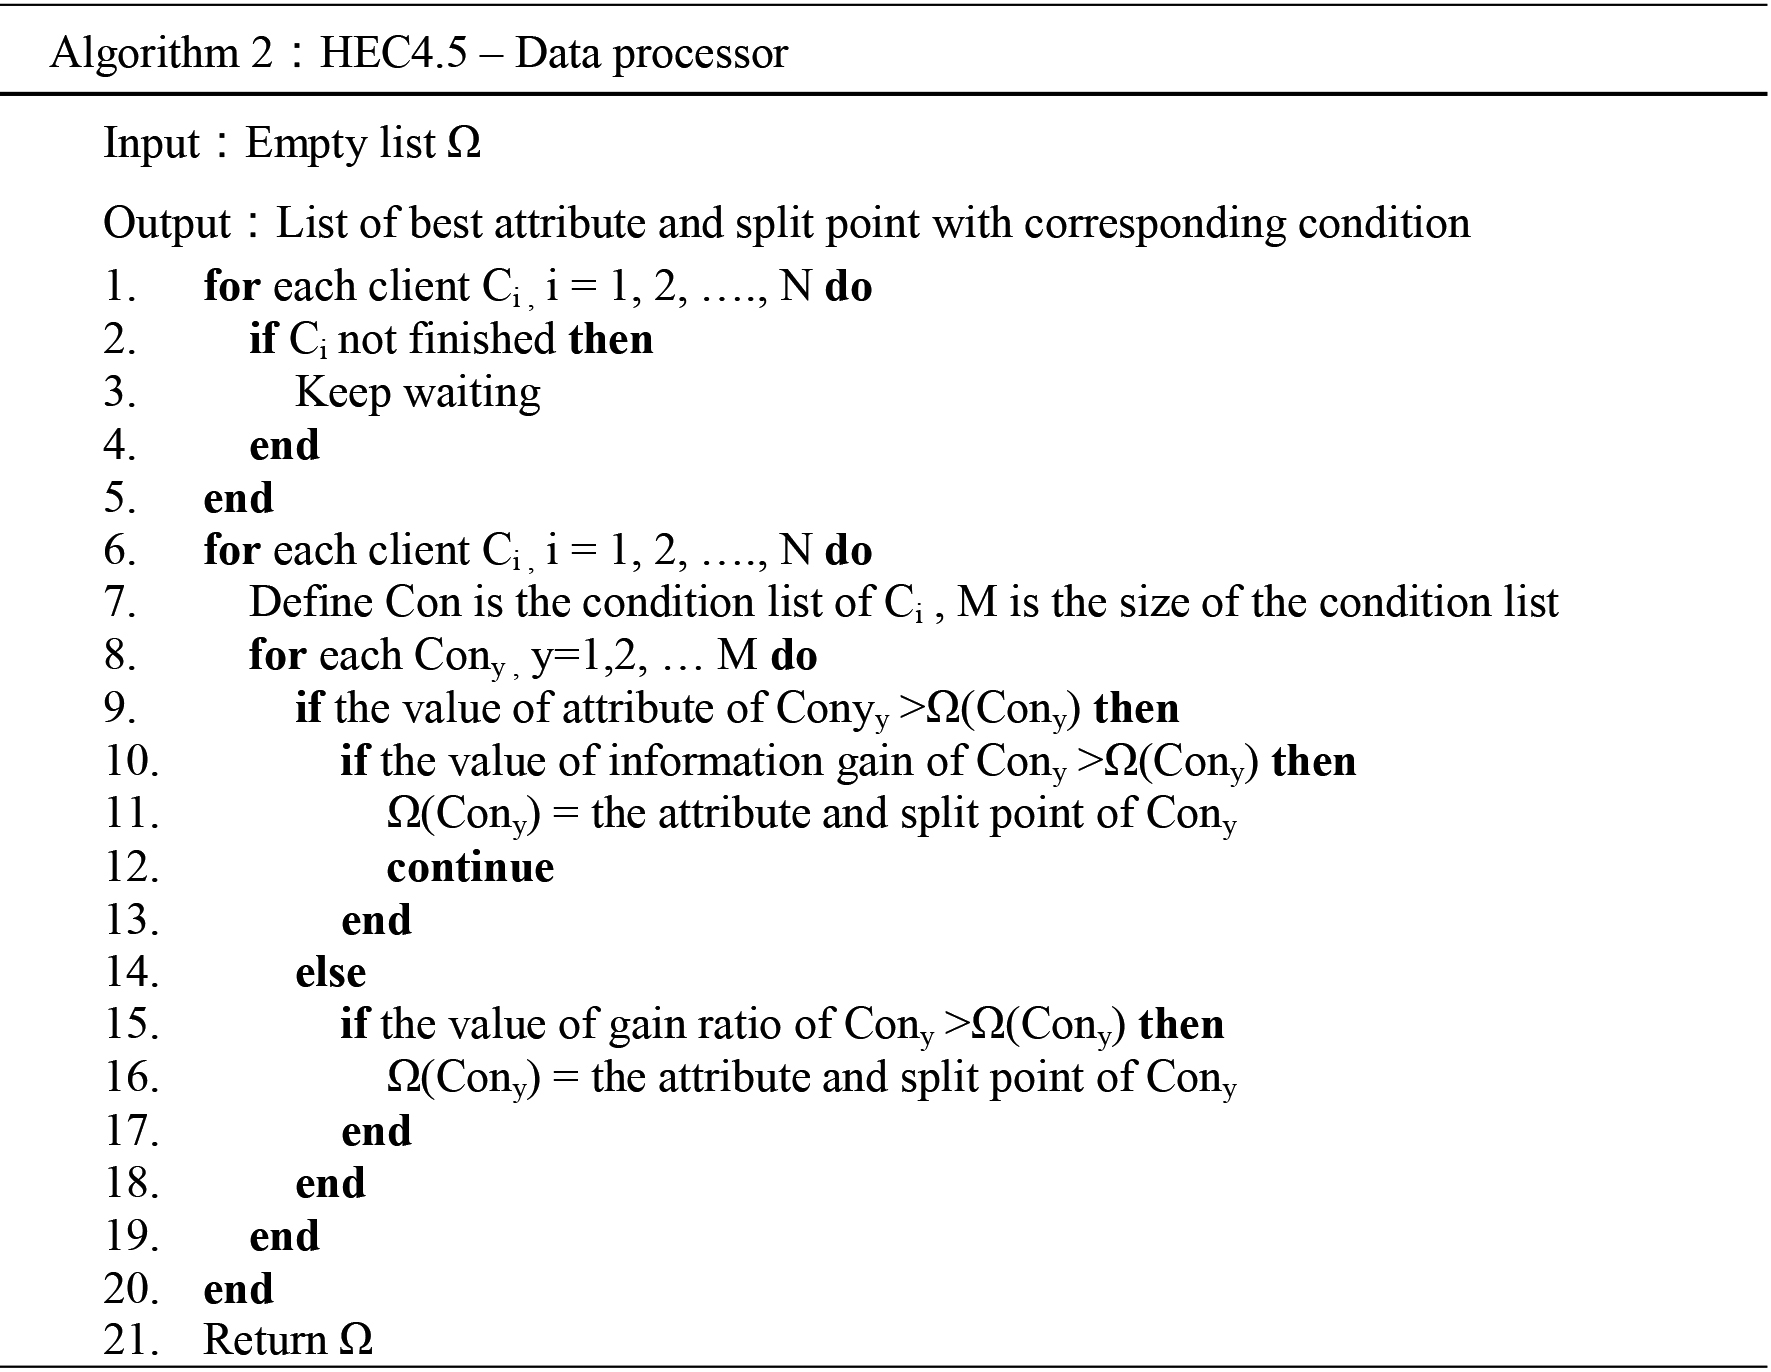
Pseudo code for the main client.
Client
The following is the server pseudo code for HEC4.5 and will be explained separately as follows.
The main client for receiving data and evaluation conditions is shown in Fig. 18. The input is the server setting, and there is no output. The first line is for receiving the compressed dataset, the second line is for decompressing the received file, and the third line informs the server that the decompression is complete and the condition can be assigned. The fourth line confirms whether the data classification has been processed. In the fifth line, if the conditions and the number of calculations are received from the server, then the classification process begins. In the sixth line, Algorithm 4 retrieves the best attribute, split point, and split point information. In the seventh line, it returns the best attribute, split point, and gain ratio for each condition to the server. 2) The data are accessed and classified in detail Statistics, as shown in Fig. 19. The input is the list of conditions, the number of evaluations and the empty list, and the output is the best attribute, split point, and gain ratio for each condition. The second to the seventh rows read the data and classify them according to the list of conditions. If the data in the column match the condition, then the column is counted. In the eighth to 12th rows, the classified data are evaluated, and the attributes and split points with the highest information gain are added to the list. In the 13th row, the list is returned to the main client.
Pseudo code for statistics.
In this section, a series of experiments is designed to evaluate and investigate the effectiveness of the proposed HEC4.5 algorithm, and the experimental results will be analyzed and discussed. The experimental datasets are generated randomly using the Python machine learning library scikit [20], using make_classification library. Different parameters such as number of data items, number of attributes, data repetition, and weight will be entered to generate various datasets that correspond to the requirements. We use the experimental results as a basis to observe the effect of adjusting the number of clients, the number of data items, the number of attributes, and other parameters on the overall execution performance. The experiments are implemented by using the standalone C4.5 algorithm, MRC4.5 [9], and the proposed algorithm.
The experimental environment, dataset, and parameter settings are described in Section 4.1; the results are compared and discussed in Section 4.2; and the conclusions are presented in Section 4.3.
Experimental setup
The proposed algorithms discussed in this paper are distributed system computations and therefore require the deployment of several computers. The computer specifications are divided into server and client. The server uses an i7-9700F @3 GHz processor and has 32 GB RAM and 500 GB SSD capacity, and runs on Windows 10 Professional. The client uses an i7-6700 @3 GHz processor, has 12 GB RAM and 1 TB HDD capacity, and runs on Windows 10 Professional.
The data sources of this experiment were obtained from the make_classification library of [20] provided by scikit, and the experimental data can be generated in accordance with the input parameters.
The dataset is shown in [1], some of its data are presented in Table 3, and its parameters are given in [20]. The experimental plan is shown in Table 4, referring to the experiments on the number of nodes, the number of attributes, the size of data, and the parameter exploration.
Experimental design information list
Experimental design information list
Introduction to the experiment
The experiments are divided into four major items: 1. the number of nodes, 2. the number of attributes, 3. the dataset volume, and 4. the make_classification parameter exploration. The following are the implications of each experiment.
1) Experiment on the number of nodes
This experiment explores the performance of various datasets under different node numbers and aims to set the number of nodes with higher efficiency on the basis of their calculation performance for later experiments. The number of nodes tested is 5, 10, 15, 20, while the number of datasets is 3K, 30K, 300K, 3000K, and 30000K.
2) Experiment on the number of attributes
This experiment was performed on the standalone C4.5 and the HEC4.5 algorithms to explore the impact of the variation in the number of attributes on various algorithms with different dataset items. The number of attributes is 5, 10, 15, 20, 25, 30, 35, 40, 45, and 50, while the number of dataset items is 3K, 30K, 300K, and 3000K.
3) Experiment on dataset size
This experiment is performed on the standalone C4.5 and the HEC4.5 algorithms to explore the impact of dataset size variations on various algorithms. The dataset sizes are 796 MB, 1.55 GB, 2.33 GB, 3.11 GB, 3.88 GB, and 4.66 GB.
4) Experiment on parametric exploration
This experiment is performed on the standalone C4.5 and the HEC4.5 algorithms to explore the impact of the variation of the input parameters of the make_classification library on various algorithms. The parameters being adjusted are n_classes, n_informative, n_redundant, and n_repeated.
Number of nodes experimental dataset information table
Number of nodes experimental dataset information table
Make_classification parameters for node number experiment
Number of nodes experimental results
Number of nodes experimental results – 1.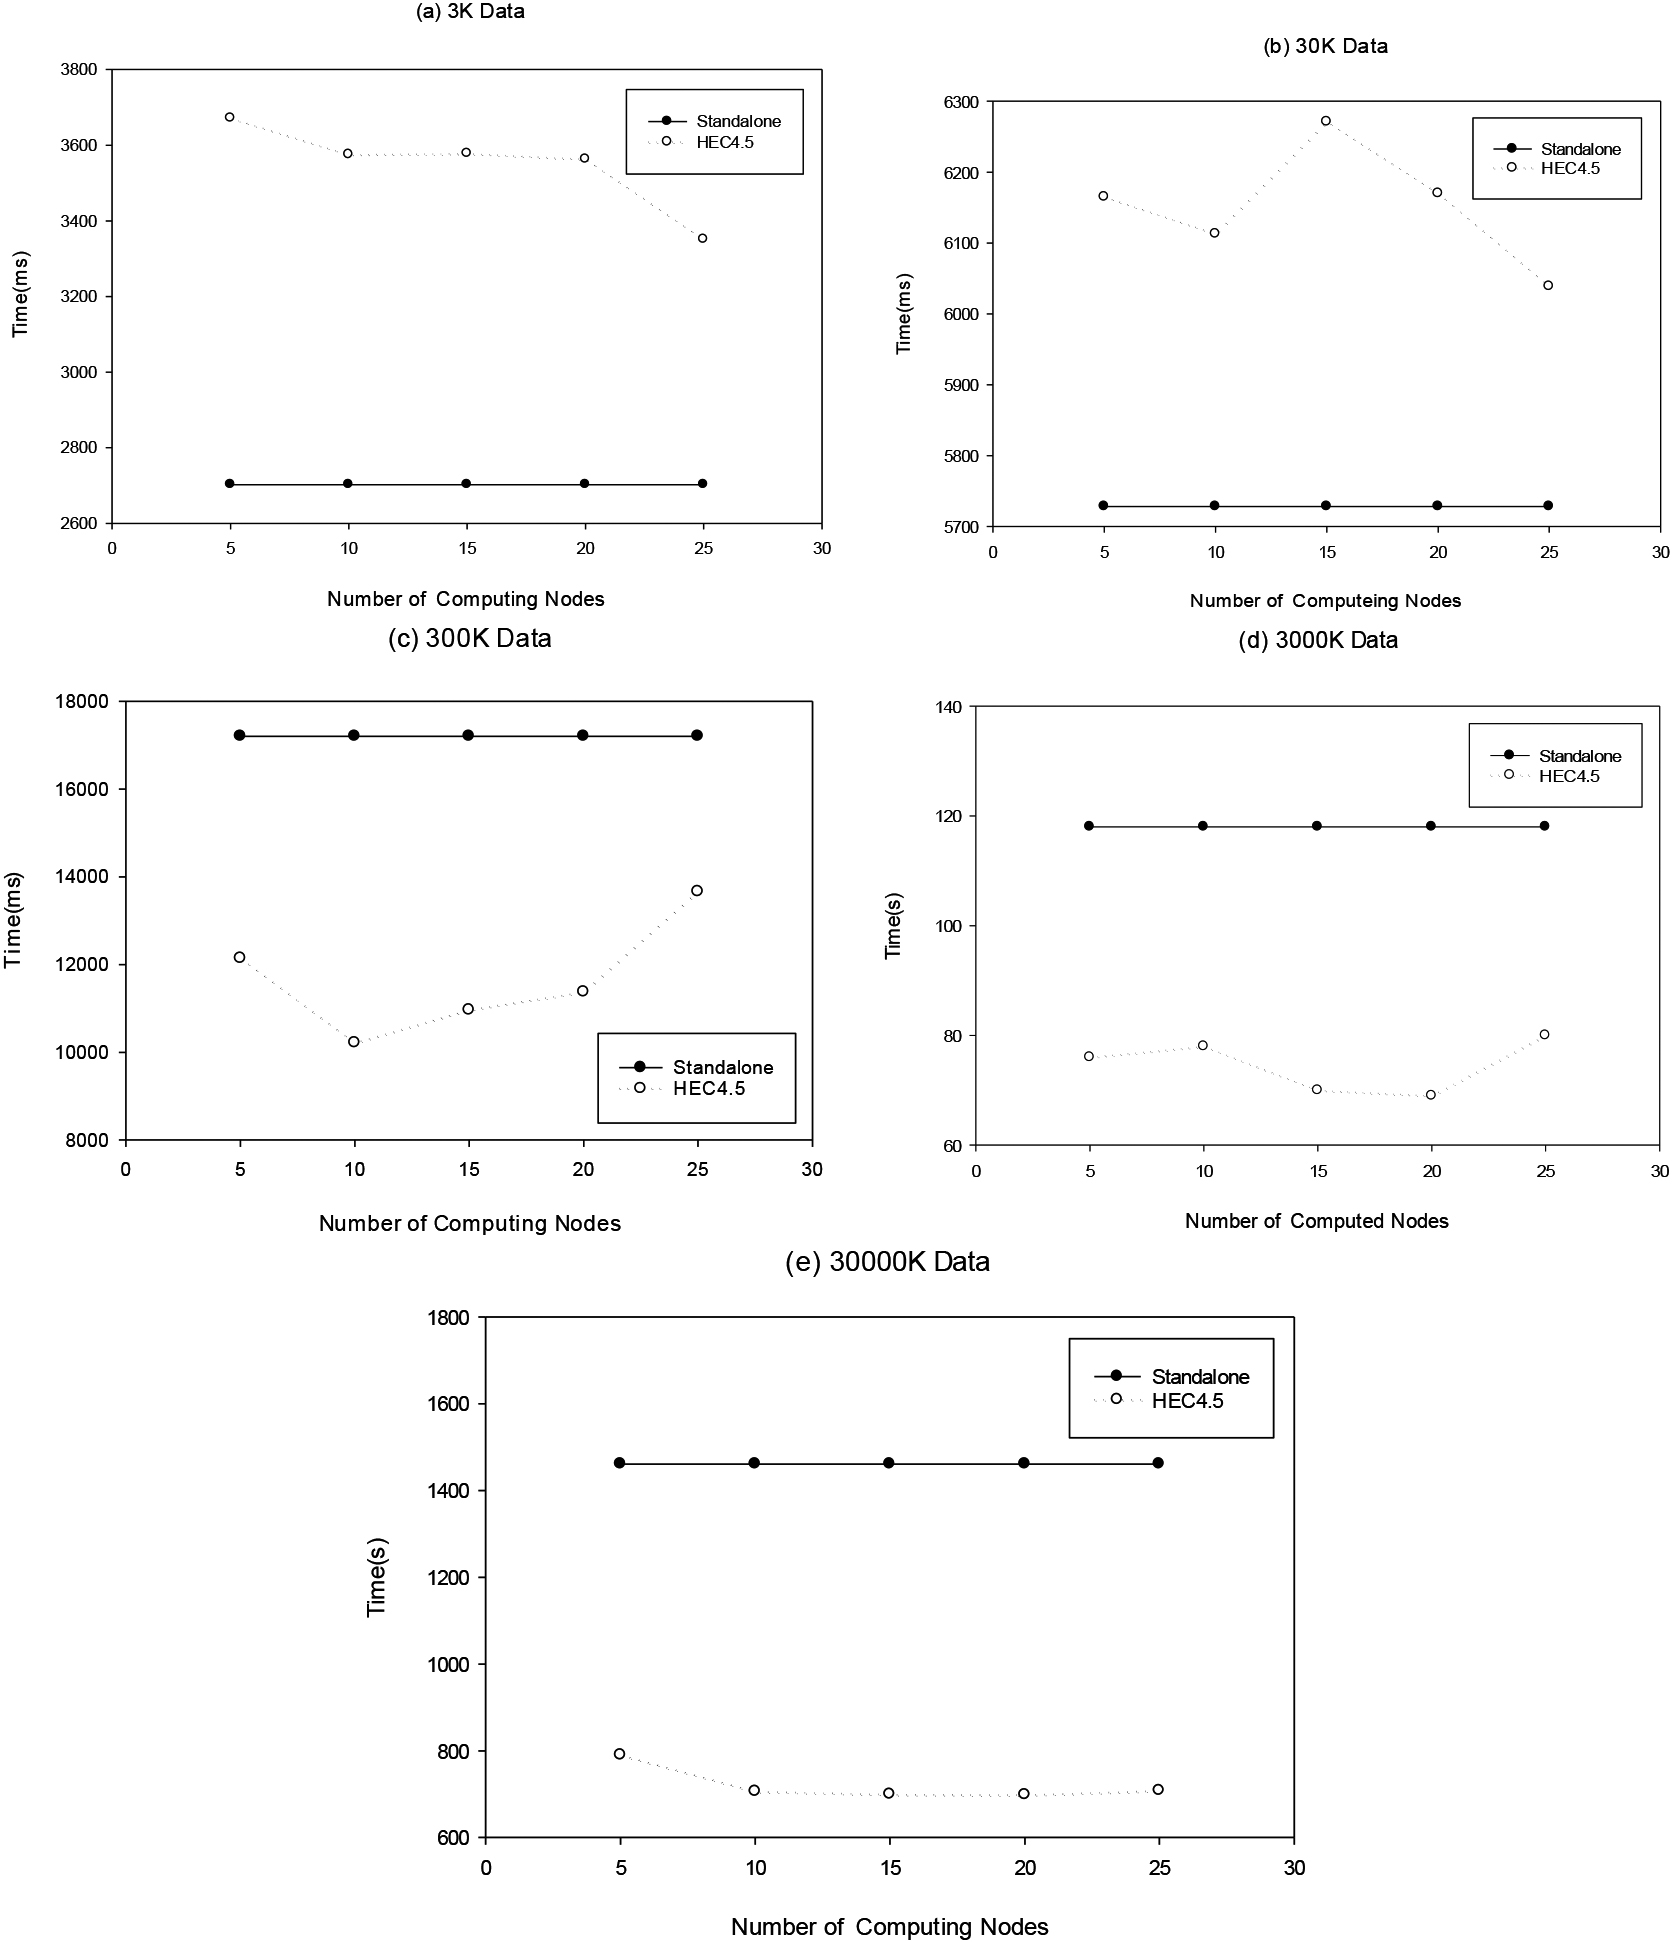
Number of nodes experimental results – 2.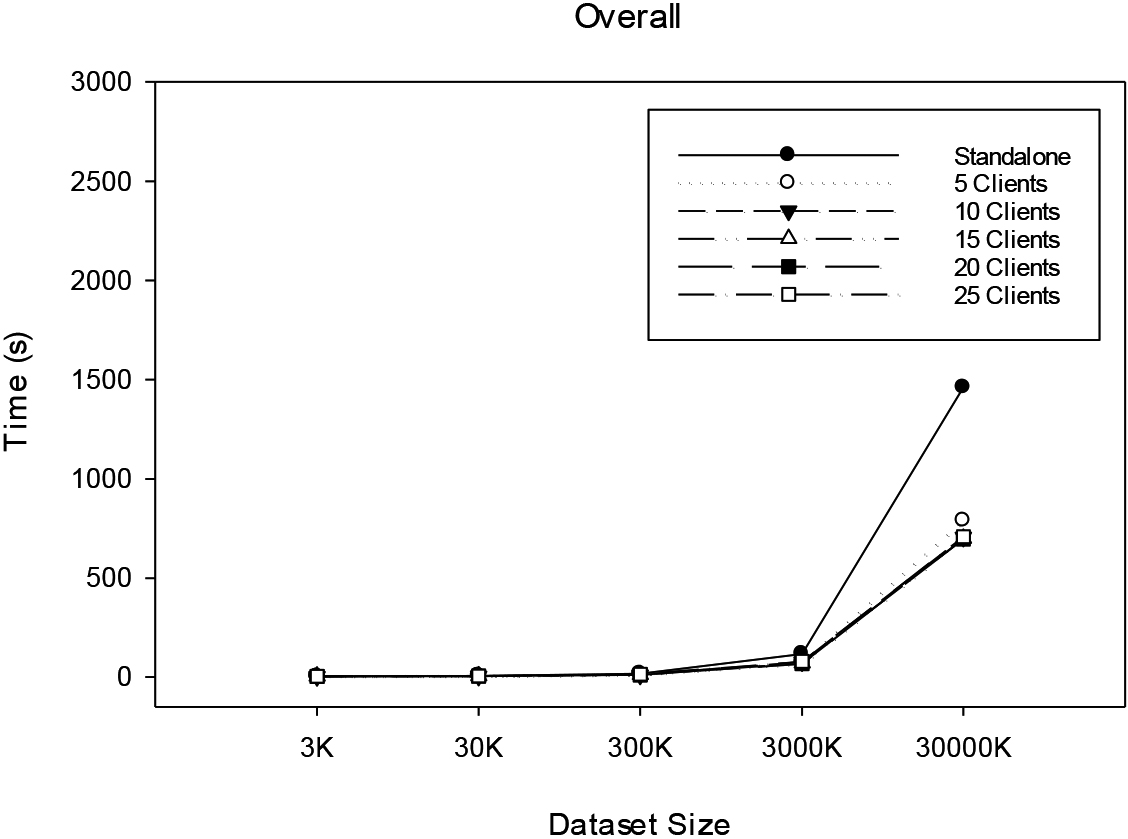
Experimental results for various attributes under various amounts of data.
Experimental data and analysis
1) Experiment on the number of nodes
In this experiment, a comparison is performed between the standalone version and the proposed HEC4.5 algorithm. How the overall execution performance of the algorithm changes when the number of nodes increases is then observed. The experiment results are explored by using different dataset sizes. The number of nodes is initially 5 and is gradually increased to 25 with a difference of 5. The experimental information is shown in Table 5. The dataset is generated by make_classification and the parameters are shown in Table 6.
Table 7 and Figs 21 and 22 indicate that when the number of data is 3K, the execution performance is slower than that of the standalone version because of the small amount of data and the time cost of compressing and transferring files in HEC4.5, as shown in Fig. 20a. Although the execution speed tends to accelerate after the number of nodes increases, the growth is not significant, and it is still not faster than the standalone version. In Fig. 20b, HEC4.5 slightly outperforms the standalone version when the number of nodes is small, but the execution speed decreases slightly after the number of nodes increases due to the time cost of compression and transmission. Overall, HEC4.5 has a similar execution performance as the standalone version for this dataset. According to Fig. 20c, when HEC4.5 has 300K data items, it can already outperform the standalone version with fewer nodes in terms of execution speed. The experimental results show that there is a more obvious difference as the number of nodes increases. However, when the number of nodes is increased to 20, the execution time tends to decrease slightly because of the increase in transmission cost due to the spread of data, but still maintains an overall increase. In short, the performance suffers slightly when the number of nodes is increased to 20 as the number of data is increased. However, it can be seen that the algorithm appears to become more stable.
In Fig. 20d, when the data size is 3000K, the performance of each node is much better than that of the standalone version. When the number of nodes increases, the execution speed tends to accelerate. In Fig. 20e, when the number of data is 30,000K, the performance is basically similar to that in Fig. 20d, the speedup is maintained, and the trend is more stable than that of the standalone version. The experiment results show the superiority of HEC4.5 in larger datasets.
Attribute experiment dataset information
2) Experiment on various numbers of attributes
In this experiment, the standalone version is compared with the proposed HEC4.5. The overall execution performance of the algorithm is affected by increasing the number of attributes. More diverse experiment results are obtained by using different dataset sizes and varying the number of attributes in the datasets. In this experiment, the number of attributes in the dataset is first set at 5 and is then gradually increased to 50 by a factor of 5. The number of datasets is gradually expanded from 3K to 3000K. The experimental information is shown in Table 8. The dataset is generated by make_classification, and the parameters are shown in Table 9.
In short, the method proposed in this study, HEC4.5, is less effective when the data set is small due to the cost of transmission. The development of this method is mainly based on its application to the large data processing context; as scientific technology advances, the amount of data becomes larger and more diverse. Therefore, when there are more attributes, it performs better.
Experiment on the number of attributes make_classification parameter table
Table 10 and Figs 23 and 24 indicate that, as shown in Fig. 22a, the speed of the standalone version is better than that of HEC4.5 when the nodes are fewer than 25 for a dataset of 3K. The main reason is that HEC4.5 performs poorly with a smaller dataset and the higher transfer cost between nodes. As the number of nodes increases, the proposed HEC4.5 has better execution performance mainly because HEC4.5 allows nodes to read the data by themselves and need to perform only a part of data computation. Figure 22b shows that the performance of the experiment before 15 attributes with 30K data items is very similar to that in Fig. 22a. This performance is inferior to that of the standalone version because of the transmission cost, but the threshold of the number of attributes that can outperform the standalone version is reduced. The experimental results show improved performance with a higher number of attributes. With an increasing amount of data, the experiment results in Fig. 22c and d show that the proposed HEC4.5 outperformed the standalone version, especially with 5 attributes.
The experimental results show that although the transmission cost is higher, the main feature of the proposed algorithm is that it enables nodes to reduce the computation time during data analysis. Therefore, it can outperform the standalone version even when the number of attributes is less than 5.
Experimental results for various attributes under various amounts of data
Various dataset experiments
Make_classification parameter table for the dataset size experiment
Results of the dataset size experiment
3) Various dataset experiment
In this experiment, the standalone version is compared with the proposed HEC4.5. The main objective is to observe how the overall performance of the algorithm is affected by increasing the dataset size. In this experiment, different dataset sizes are used to make the results more equitable. The dataset size in this experiment is set to 5000K, and then the difference of 5000K is gradually increased to 30000K. The experiment information is shown in Table 11. The dataset is generated by make_classification, and the parameters are shown in Table 12.
The results in Table 13 and Fig. 23 show that the standalone version is unable to distribute the conditions, thus taking a long time to read the files and process the data numbers. The time difference between HEC4.5 and the standalone version varies with data size, from 42% execution performance advantage at 5000 K to 32% at 30000 K. The difference between HEC4.5 and the standalone version can be observed from the performance change. In short, the method proposed in this paper can see a change in performance advantage when the data set size increases.
4) Parametric experiment
In this experiment, the performance of the algorithm is observed for various datasets under the adjustment of various parameters to prevent the dataset from becoming too large, which would hinder the library from being generated. The previous node number experiment shows that HEC4.5 has more stable performance after 3000K items. This experiment uses 3000K data items as the base and the middle value of 30 in the range set by the attribute number experiment as the basis. In this experiment, the four parameters of n_classes, n_informative, n_redundant, and n_repeated were adjusted.
(1) Parameter n_informative
This parameter is the number of information features, thus making the attributes in the dataset more informative, and it affects the node selection of the decision tree during execution. When the amount of information increases, more time for analysis and calculation is needed. In this experiment, n_informative is set to 2, 4, 6, 8, and 10 to explore the variation of dataset and various algorithms with varying numbers of information features. The experimental information is shown in Table 14.
Experimental dataset of various parameters for n_informative
Results of the dataset size experiment.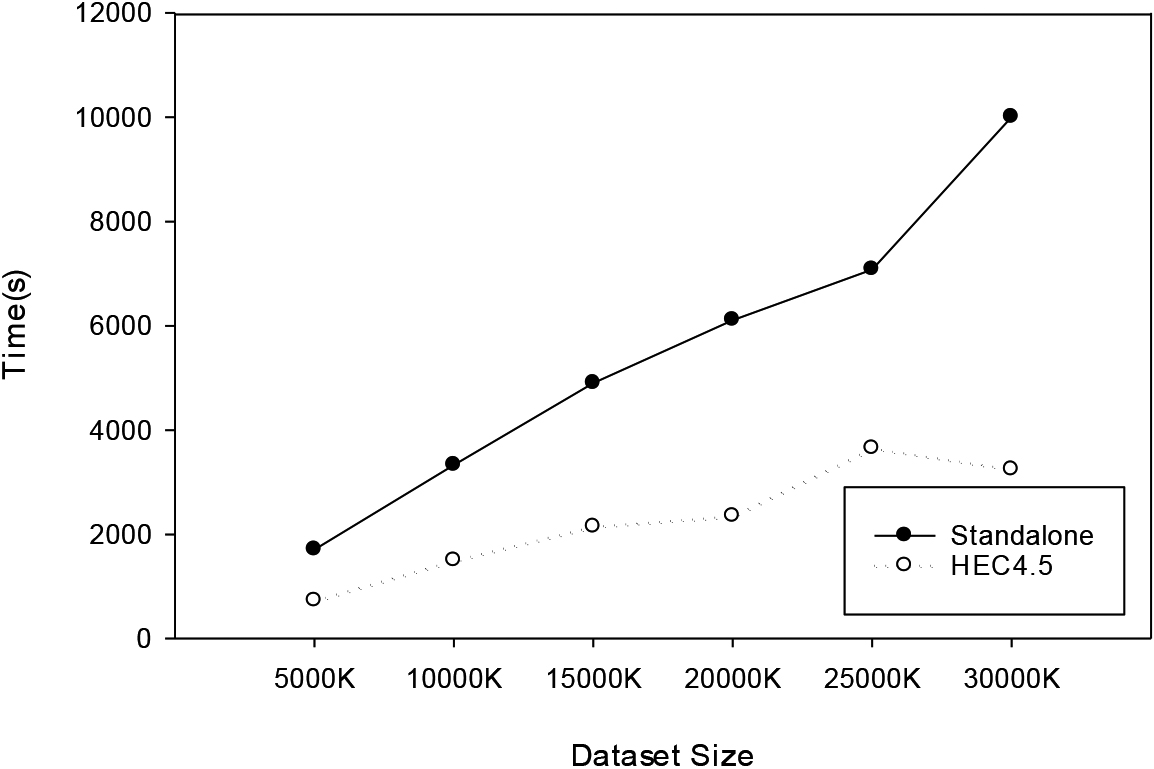
The results in Table 15 and Fig. 24 show that the meaningful attribute data increases as the number of n_informative parameter increases. The execution time of the standalone version has a significant impact. In contrast, HEC4.5 can spread the data evenly, thus enabling the execution performance to have a more stable trend. In terms of execution speed, HEC4.5 still outperforms the standalone version by 29%. This shows that HEC4.5 performance not only maintains the 29% speed advantage in execution time when the meaningful attribute data increases but also shows a consistent trend.
Experimental dataset of various parameters for n_informative
Various parameters for n_classes
Experimental dataset of various parameters for n_informative.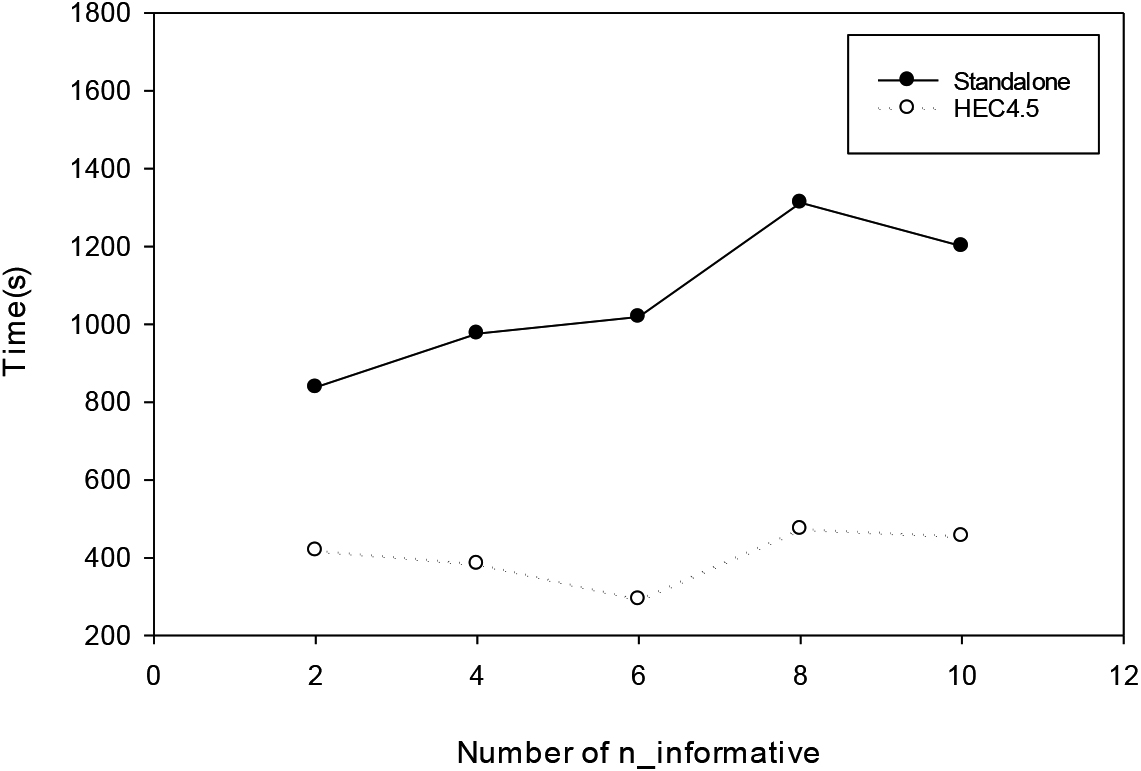
(2) Parameter n_classes
This parameter is the number of classes for the generated data. The complexity of the data increases with this parameter. With the condition n_informative
The results in Table 17 and Fig. 25 show that the execution performance of the standalone version and HEC4.5 is higher when n_classes are 2 and 10. The n_informative2 is 0 and 25; thus, the value of n_classes is near the limit of the above two values, thereby making the data more scattered and resulting in a longer execution time. HEC4.5 outperforms the standalone version in terms of overall execution time, with a 34% advantage.
Experimental results of various parameters for n_classes
(3) Parameter n_redundant
This parameter is the number of redundant attributes in the dataset that is less informative and generated by the random line combination of n_informative. Having a larger number of redundant indicates that a longer time is needed for eliminating redundancies. This approach sets a requirement that n_informative must not be less than 2 and the condition that n_features
Various parameters for n_redundant
Experimental results of various parameters for n_classes.
The experimental results in Table 19 and Fig. 26 show that the execution performance of the standalone version and HEC4.5 tends to improve with the increasing number of redundant attributes. However, the performance of the standalone version has a stronger tendency to improve because it cannot be dispersed in parallel. In the dataset without redundant attributes, HEC4.5 has a 43% speedup advantage over the standalone version, while in the dataset with 8 redundant attributes, HEC4.5 outperforms the standalone version by 32%.
Experimental results of various parameters for n_redundant
(4) Parameter n_repeated
This parameter is the number of repeating features. The parameter is randomly selected among the attributes of the n_informative or n_redundant parameters. The condition n_features
Various parameters for n_repeated
The experimental results in Table 21 and Fig. 27 show that the execution performance of both tends to increase as the n_repeated parameter increases. As the number of parameters increases, a larger amount of data needs to be analyzed. The amount of data to be analyzed grows as the number of parameters increases. However, HEC4.5 can mitigate the effects of the data set in an average analysis manner, outperforming the standalone version by only 32% of the execution time.
Experimental results of various parameters for n_repeated
Experimental results of various parameters for n_redundant.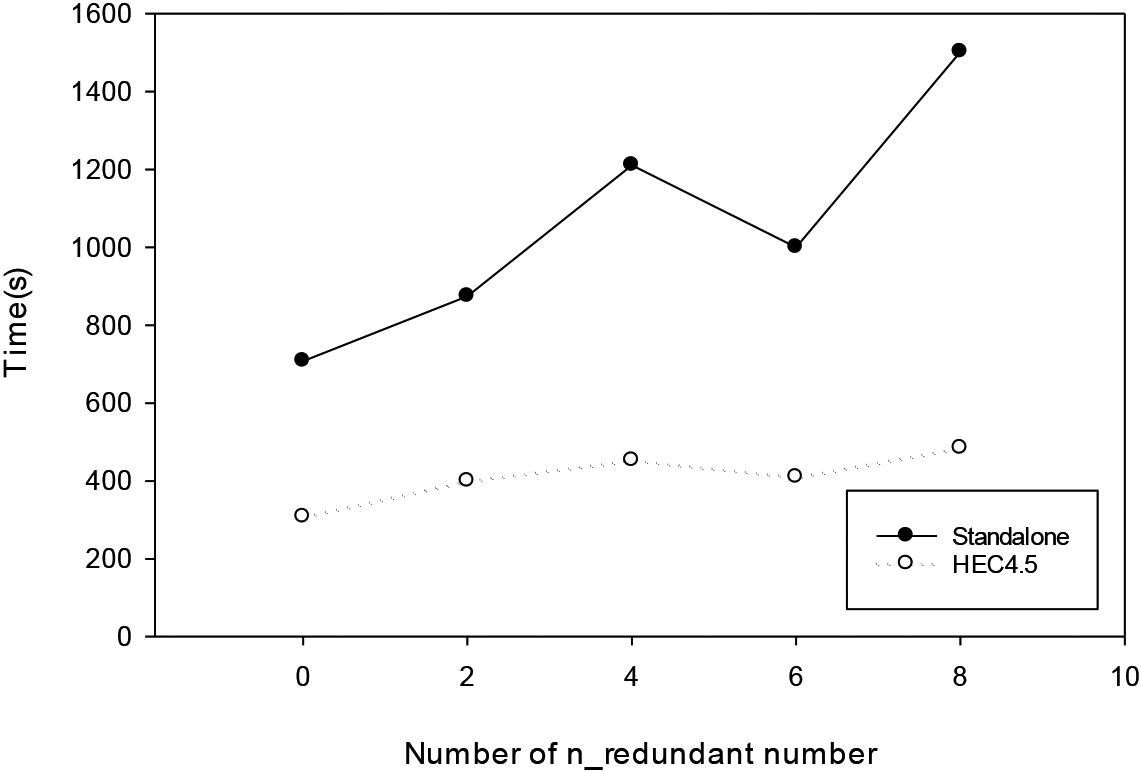
Experimental results of various parameters for n_repeated.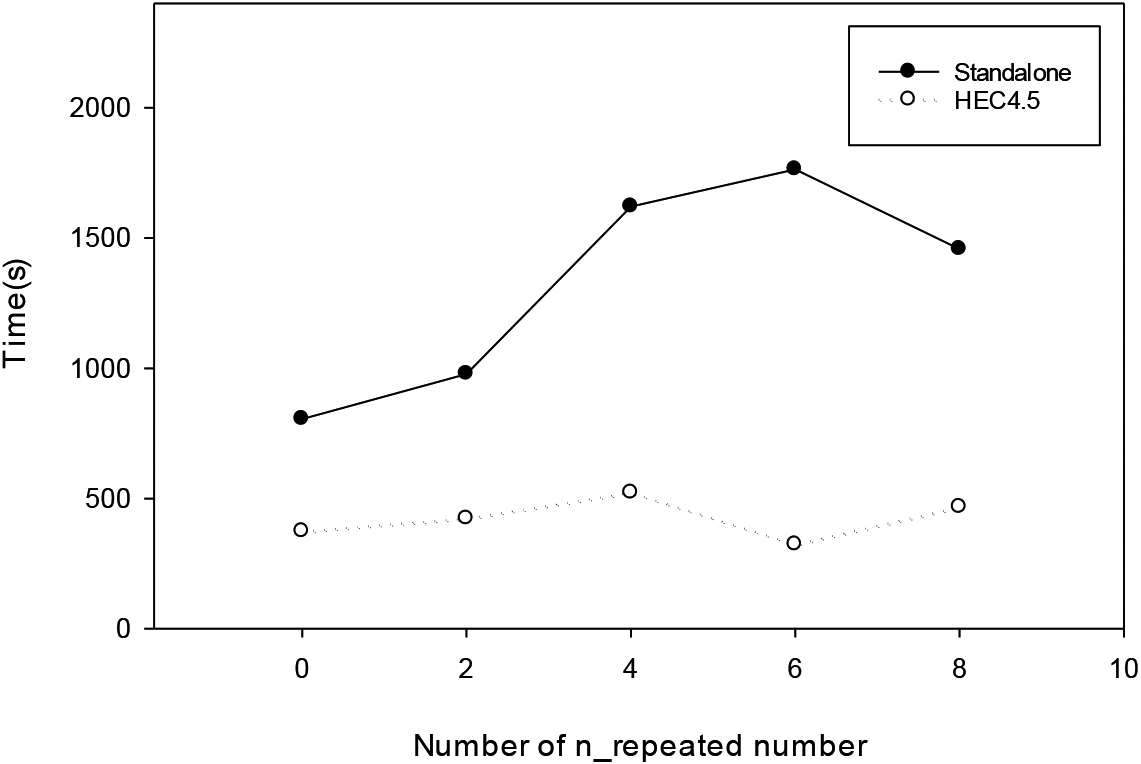
This paper compares the execution performance of the standalone C4.5 and the proposed HEC4.5 through the above four types of experiments.
The experiment on the number of nodes shows that although the distributed algorithm has a better execution performance as the number of nodes increases, the increase in performance is affected by the size of the dataset. For the datasets with 3000K and 30000K data items, HEC4.5 performs better on 20 nodes, which is the best number of nodes.
The results of the experiment on the number of attributes show that as the number of attributes increases, the computation amount also increases, thus resulting in a longer execution time. The experiment results also indicate the superiority of HEC4.5 when the number of attributes increases and the number of datasets fetched repeatedly increases. For a 3000K dataset, HEC4.5 outperforms the standalone version by 1.29 times at 5 nodes and by 3.4 times at 50 nodes.
The results of the experiment on dataset size show that as the amount of data increases gradually, the file access time becomes longer, thereby gradually increasing the execution performance of the standalone version and HEC4.5. However, the performance of HEC4.5 in terms of speed on all datasets is better than that of the standalone version by more than two times.
The parametric experiments show that, despite the increased complexity of the huge amount of data characteristics, the method proposed in this study takes only 18%–34% of the best execution time of the standalone version.
Conclusion
Finding a technique that can assist municipalities in improving city governance is crucial, especially a technique that uses urban big data, which is defined as the collective body of information about urban assets and activities. Emerging tools and techniques ensure better sustainable load balancing for managing urban big data. With the emergence of big data and artificial intelligence in recent years, the field of data mining has grown rapidly, and various related technical applications and research are being conducted. This paper mainly adopts a distributed system architecture that enables each client node to have datasets so that the effect of server access performance on the overall execution performance can be reduced. The distribution conditions and the number of clients enable each client to reduce the access and computation time, thereby reducing the overall computation time and accelerating the computation performance. This improves the execution performance of the C4.5 algorithm at multiple attribute nodes. The proposed method still has potential for improvement. For example, the number of conditions or calculations can be distributed based on the performance of the client to ensure that each client can fully benefit from the computational power and achieve a better balance. Another approach is to compress and split the dataset into several files, thus enabling the client to start decompressing the dataset after receiving the first split file to reduce the processing time of the dataset. As a result, the overall algorithm can achieve a more efficient performance.