
Abstract
With the development of smart cities, the demand for personal financial services is becoming more and more importance, and personal investment suggestion is one of them. A common way to reach the goal is using a technical indicator to form trading strategy to find trading signals as trading suggestion. However, using only a technical indicator has its limitations, a technical indicator portfolio is further utilized to generate trading signals for achieving risk aversion. To provide a more reliable trading signals, in this paper, we propose an optimization algorithm for obtaining a technical indicator portfolio and its parameters for predicting trends of target stock by using the memetic algorithm. In the proposed approach, the genetic algorithm (GA) and simulated annealing (SA) algorithm are utilized for global and local search. In global search, a technical indicator portfolio and its parameters are first encoded into a chromosome using a bit string and real numbers. Then, the initial population is generated based on the encoding scheme. Fitness value of a chromosome is evaluated by the return and risk according to the generated trading signals. In local search, SA is employed to tune parameters of indicators in chromosomes. After that, the genetic operators are continue employed to generate new offspring. Finally, the chromosome with the highest fitness value could be provided to construct transaction robot for making investment plans in smart city environment. Experiments on three real datasets with different trends were made to show the effectiveness of the proposed approach, including uptrend, consolidation, and downtrend. The total returns of them on testing datasets are 26.53% 33.48%, and 9.7% that indicate the proposed approach can not only reach risk aversion in downtrends but also have good returns in others.
Keywords
Introduction
In recent years, with the popularization of wireless networks and mobile devices, the construction of smart cities has become a development trend [39, 5, 16, 14, 29]. There are many services should be prepared for building the smart cities, and one of the services required by smart cities is personalized financial service, e.g., asset allocation [22], stock recommendation [23]. For investors, stock price information is the key point that must be understood before investing, and accurate prediction of stock price is the goal that investors have been pursuing. Because stock prices are inherently volatile, dynamic, messy, and influenced by a multitude of factors, stock price forecasting has been and is still a difficult challenge [3]. Therefore, how to judge the current stock market trend, minimize the risk, and be able to obtain good performance in the unpredictable market is a topic of great concern to investors.
The research of stock market analysis can be divided into three analytic types: (1) fundamental analysis, (2) chip analysis, (3) technical analysis [27]. Fundamental analysis can be used to known fundamental information of a company based on different indicators, e.g., price-earnings ratio, return on equity, and price-book ratio, from various financial reports that could be the monthly revenue, quarterly report, annual report, etc. Hence, the stock price may be reacted and the time to enter the market may be too late. In other words, if using those fundamental analytic indicators to predict the company’s future prospects, it may have bias on the prediction result. Chip analysis can be used to observe the possible directions of institutional investors or market leaders. Following the operations of them, parts of investors believe considerable profits can also be obtained. But institutional investors or market leaders are always one step faster, and the early layout also ends early, so that the profit margin is limited and even getting loses. Technical analysis can use different types of technical indicators to find the behavioral model of the stock price as the basis for buying and selling decisions. Using of technical indicators to determine stock price trends must rely on extensive investment experience. Thus, it is not easily task for every investor to find a useful set of technical indicators to form the effective trading strategies.
In the stock market, the researches of technical indicators have always been one of the hotly discussed topics, and investors often use various technical indicators as the basis for stock trading. In recent years, many studies have shown that technical analysis can assist investors making trading decisions and getting profit in the financial markets [33, 19, 38, 9]. For instance, Zhong et al. indicate that financial variables, such as stock prices, stock market index values, and the prices of financial derivatives, are predictable [38]. Chong et al. also show that financial markets are to some extent predictable [9]. In addition, many studies present approaches to reveal that trading strategies can be formed to predict stock price trends using technical indicators. For example, Alsubaie et al. used classifiers to select the types of technical indicators to increase the investment income rate [1]. Uygun et al. established the trend of stock prices Model by using all possible combinations of technical indicators and various machine learning algorithms [25]. When the number of factors should be considered increases, it can be known that those factors tend to have collinearity and interfere with each other. The optimization algorithms are then suitable to be employed for solving the problems. For example, Li et al. considered the cross-entropy and the firefly algorithm to design a hybrid meta-heuristic algorithm for solving large scale optimization problems [18]. Utilizing genetic programming (GP), some approaches have also been designed for finding technical trading rules [17, 8, 28]. In those approaches, technical indicators such as the moving average and the rate of change and logical operations such as greater than and less than are used as variables in the tree structure to generate trading rules.
However, to generate effective and useful trading rules that can reduce the risk and increase return, the following two issues should be considered: (1) what technical indicators are suitable used together for a target stock to obtain more reliable trading signals; (2) what hyperparameters setting is appropriate for the used technical indicators to generate more accurate trading signals. In this paper, firstly, the memetic-based stock trend prediction framework that consists of three phases, including the data collection, data preprocessing, and optimization process, is proposed. In the third phase, an optimization algorithm is designed to obtain suitable technical indicators and their hyperparameters using the memetic algorithms (MAs). It utilizes the genetic algorithm (GA) and the simulated annealing algorithm (SA) for global and local searching. In GA, the technical indicators and their hyperparameters are encoded into a chromosome using a bit string and a real number array. Then, the risk and return values calculated by the generated trading signals from a chromosome are used as the fitness value. After reproduction process, the population is sent to SA for tuning hyperparameters of technical indicators. Next, the genetic operators are applied on the population to form new chromosomes. The process is repeated until reaching the termination conditions. Experiments on three datasets with different trends that are collected from Taiwan stock market were conducted to show the effectiveness of the proposed approach. Therefore, the contributions of this paper are listed as follows:
Firstly, the memetic-based stock trend prediction framework that consists of three phases, including the data collection, data preprocessing, and optimization process, is proposed for finding effective and useful trading rule. Secondly, to obtain suitable technical indicators and their hyperparameters for target stock, an optimization algorithm based on MA that using GA and SA for global and local searching has been proposed so that more profitable trading signals can be generated. Thirdly, empirical analysis on three real datasets with uptrend, sideway trend, and downtrend are given to show the merits of the proposed approach in terms of getting returns and avoiding risks. Finally, the designed algorithm can be used to build investment robots to provide investment suggestions to users as part of personalized financial services in smart cities.
The rest of the paper is organized as follows. Section 2 presents the literature review. Section 3 describes the design framework and the proposed approach. Section 4 contains the results and analysis of the experiments. Conclusion and recommendation for future work are given in Section 5.
Related literature discussion and MA are given in this section. Review of technical analysis is described in Section 2.1. MAs is introduced in Sections 2.2.
Review of technical analysis
Technical analysis attempts to use various patterns or quantitative indicators to analyze past trends based on historical stock price data, and then to speculate on future trends to get benefits. Technical analysis is based on the analysis of different historical data, e.g., stock price series, stock volume series. The characteristics of them are aggregated into technical indicators. In the following, literature of technical analysis is introduced.
About effectiveness of using technical indicators for trading, Ülkü et al. studied the gap between 22-day, 56-day, and 200-day moving average and obtained that macroeconomic fluctuations increase the profitability of technical trading rules, especially long-term rules such as 200-day moving average [32]. In other words, the interaction of the return volatility with the return persistence and macroeconomic volatility has a significant positive effect on profitability of technical rules. It is consistent with the view that technical signals are correlated with new information arrivals rather than noise. Metghalchi et al. used various technical indicators, including moving average (MA), relative strength index (RSI), moving average convergence divergence (MACD) and breakthrough (TBO), to show their prediction ability [21]. The results indicated that trading rules formed by technical indicators were effective and better than the buy-and-hold strategy. Ni et al. also indicated that the Taiwan weighted index (TWSE) could be beaten with the trading signals issued by Taiwan 50 through the Bollinger bands [24].
To generate more robust trading signals for target stock, it is necessary to combine multiple technical indicators. It can be reached by relying on the trained investment models for finding optimal parameters for these models based on one or several criteria. The other is to use the selected technical indicators to determine the appropriate trading time point. For instance, Ye et al. proposed a forecasting method for stock trend prediction by utilizing technical analysis, multi-order fuzzy time series and GA [37]. In their approach, technical indicators such as rate of change (ROC), MACD, and stochastic oscillator (KD) are used to construct the multi-variable fuzzy time series. In their approach, in order to get good performance, GA is used to find appropriate domain partition for the time series. Huang et al. proposed an approach which combined the biclustering pattern mining and fuzzy modeling, named the BM-FM approach, to automatically discover trading rules from a combination of technical indicators in the financial markets using particle swarm optimization [15]. Yazeed et al. investigated in how to select suitable number of technical indicators to build prediction model [1]. In that approach, five feature selection approaches were applied on fifty technical indicators to obtain appropriate features to construct nine classifiers based on cost-sensitive concept. As a result, authors suggest that naïve Bayes classifier is better than others. Besides, Li et al. proposed a multi-indicator feature selection method for stock price prediction based on Pearson correlation coefficient and the broad learning system to show trading based on a small number of technical indicators can outperform the broader market [20].
Because deep learning is popular in recent years, Peng et al. used three feature selection methods, including sequential forward floating selection, tournament screening, and LASSO, to obtain a suitable set of technical indicators to build prediction model using neural networks [26]. Next, Alotaibi proposed a hybrid red deer-grey algorithm that consisted of three main steps that are feature extraction, optimal feature selection, and prediction, for Saudi stock market prediction [2]. In the algorithm, it first generated related attributes using statistic measurements. For instance, they could be mean and variance, etc. Then, technical indicators were calculated using those generated data. The red deer adopted wolf algorithm which is a hybrid model was used to find crucial features. At last, using crucial features, the ensemble approaches were used to build prediction model.
Memetic algorithms
GA has been proposed in 1975 by John Holland, which is an optimization algorithm used to find near optimal solution for optimization problem. The main concept comes from Darwin’s characteristics of “Natural selection and survival of the fittest”. By simulating the competition between organisms, it has a strong ability to adapt to the environment. The parents in a population can generate next population through selection, reproduction, crossover, mutation, and other processes. The offspring will continue to evolve through the above process until the population reaching adaptive capacity. GA is not only applied in the financial field, but also in many different fields, such as engineering design [34], electrical engineering [31], investment portfolio [10], etc.
To enhance the searching ability of optimization algorithm, MAs, also known as cultural genetic algorithms, which consists of the population-based global search and individual-based local search phases, has been proposed for solving optimization problems. According to “The Selfish Gene” published by Dawkins [12], meme is the unit of information exchange between people, and it is everywhere. The reason why it is called meme is that information will be changed along with time, and leave only the important part of the process. In other words, the main concept of MAs is to used heuristic approaches together so that more useful solution can be found during the evolution process. For instance, in the population-based global search phase, the global search optimization algorithms can be used, including GA [7], particle swarm optimization [40], whale optimization algorithm [30], etc. In individual-based local search phase, the local search optimization algorithms can be used, including SA [36], hill climbing, tabu search [13], etc. The applications of MAs are very wide. For example, Chen et al. used MAs to solve the travelling salesman problem which is using a given series of cities and the distance between each pair of cities, the goal is to find the shortest path that the traveling salesman must pass through each city without repeating it, and return to the starting city [11]. Based on company-wide insurance simulation model, Yu et al. proposed a hybrid algorithm for solving multi-period asset allocation problem [35]. They indicated that the asset allocations derived by their proposed approach is better than existing investment strategies. Afsar et al. proposed an enhanced memetic algorithm by combining multiobjective evolutionary algorithm, called MOEMA, for solving green job shop scheduling [4]. The results also showed that their approach is effective to discover the good scheduling.
Proposed algorithm
Proposed memetic-based stock trend prediction framework
Using the given technical indicators and stock price series, the proposed memetic-based stock trend prediction framework is shown in Fig. 1.
From Fig. 1, we can know that the framework is divided into three phases. In first phase, the stock price datasets are collected from the Internet. Once the data collection is done, based on the technical indicators, the trading signals are calculated and marked in the second phase. The technical indicators used in this study cover both price and volume indicators. The main reason for using them is that they are commonly used to analyze behaviors of investors in the stock market. They include relative strength index (RSI), moving average (MA), stochastic oscillator (KD), money flow index (MFI), commodity channel index (CCI), rate of change (ROC), bias rate (BIAS), directional movement index (DMI), moving average convergence & divergence (MACD) and several other technical indicators. As a result, the trading signals for every day in the given time period are stored in a matrix. In the third phase, the proposed memetic algorithm is employed to find suitable technical indicators and their parameters for the desired target stock for trading. The proposed approach utilizes GA and SA for global and local searching to find appropriate technical indicators and tuning their parameters. In phase 3.1, it first encodes the technical indicators and corresponding parameters into a chromosome using a bit string and real numbers. Then, according to trading signals generated from a chromosome, the return and risk are calculated and set as the fitness value. After selection, the local searching is started for tuning the parameters using SA. In phase 3.2, parameters for the technical indicators will be tuned one by one to find the most suitable setting, and local optimized parameters are updated to the population. At last, the evolution process is repeated to obtain not only suitable technical indicators but also their parameters for the given target stock for trading.
Stock information
Stock information
Proposed memetic-based stock trend prediction framework.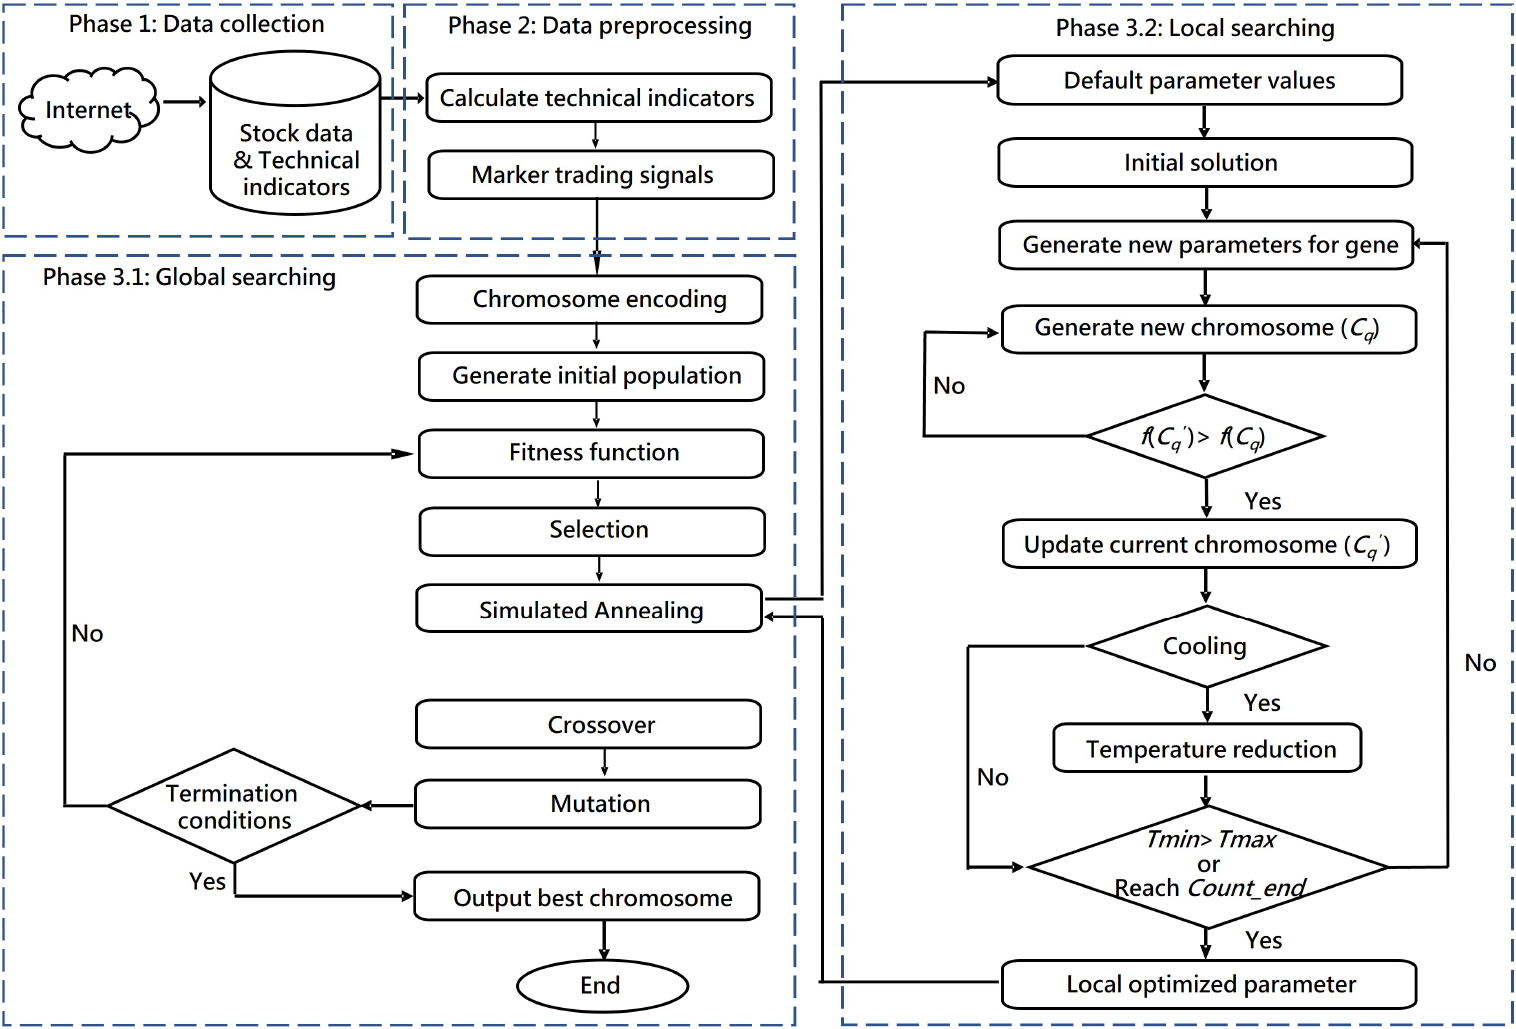
The relevant stock information is captured from the Taiwan Stock Exchange (TWSE), and three characteristics including upward trend, consolidation trend, and downward trend are collected as experimental datasets. Details of data preprocessing are described in the following sections.
Stock information crawler
The datasets used for training and testing the stock trend prediction approach is collected from the following link:
Technical indicators
The trading signals generated in this study by the used technical indicators that are determined according to the related literature and those commonly used by investors, including price and volume indicators, include RSI, MA, KD, MFI, CCI, ROC, BIAS, DMI, MACD. Continue using the collected instances in Table 1, according to the formulas of technical indicators, values of them are calculated and shown in Table 2.
Calculated values of the used technical indicators
Calculated values of the used technical indicators
Trading rules of used technical indicators
Generated trading signals
Based on the calculated values and trading rules of each technical indicator, buying and selling signals can be generated. The trading rules used in the proposed approach are shown in Table 3.
In Table 3, take the strategy using MA: “When
Using trading signals showed in Table 4, the trading results can then be calculated based on what technical indicators are used and their buying and selling signals. To find appropriate technical indicators and their parameters will have influenced on the trading results, in this paper, we attempt to design an optimization algorithm to solve the problem.
Components of proposed trend prediction approach
Encoding scheme and initial population
In designing an optimization algorithm, how to encode a solution into a chromosome is important. The goal of the proposed approach is to find a set of appropriate technical indicators as well as their parameters to identify trading signals for a certain stock. Hence, the given technical indicators and their parameters are encoded into a chromosome. The chromosome representation is shown in Fig. 2.
Chromosome encoding scheme.
Figure 2 shows that
An example for chromosome representation.
From Fig. 3, we can see that ten technical indicators are encoded in a chromosome. According to the
After the initial chromosomes are created, the fitness function of each chromosome is calculated to determine the fitness score in the evolution process. In this study, two factors are utilized to evaluate a chromosome. The first one is the average rate of return of a chromosome which is calculated according to its used technical indicators, and the second one is the risk for a chromosome which is set as the maximum rate of decline in returns. Thus, the fitness function of a chromosome
where
Let there are
Evolutionary process including used genetic operators.
In GA, genetic operators are employed to generate new offspring. In general, crossover and mutation operators are used to form new chromosomes, and selection operator is utilized to form next population. In this paper, the flowchart of the evolutionary process including the used genetic operators is shown in Fig. 4.
In Fig. 4, using Eq. (1), the fitness values of all chromosomes are calculated. Then, the selection operator is performed. The top-
Selection operation.
In Fig. 5, chromosomes are sorted based on their fitness values, and when
An example of crossover operation to generate a new offspring.
From Fig. 6, the crossover point is located at “ROC”. Hence, the genes from “MA” to “MFI” of first chromosome, and “ROC” to “DMI” of second chromosome are combined as a new offspring. The crossover is repeated until generating requirement number of chromosomes for next population. After that, the mutation operator is applied on the population to get new offspring, and it gives ability for the proposed algorithm to avoid falling into local optimal solution. An example for mutation is given in in Fig. 7.
An example of mutation operation.
From Fig. 7, it mutated on the gene “MACD”, therefore, the value is changed from 1 to 0, which means that the technical indicator “MACD” doesn’t use to find trading signal. The evolutionary process is repeated until reaching the termination condition.
In this study, the parameters of the technical indicators are tuned in the local searching phase using the SA algorithm. For a chromosome, it will randomly generate values based on the given domains of technical indicators to replace the original parameters. Then, fitness value of the new offspring is calculated. If the fitness value of new offspring is better than original, the new one will replace the old one. However, when the fitness value of the new offspring is worse than the original one, SA still can accept it with a certain probability. The probability of accepting a poor solution decreases as the number of iterations increases, or as the temperature
where
SA used in the proposed approachPopulation population and predefined domains for parameters of technical indicators Dom. Initial temperature
In Algorithm 3.3.4, it first selects the current best chromosome
Based on the descriptions in previous subsections, the pseudo code of the proposed memetic-based algorithm for finding suitable technical indicators and their parameters to identify trading signals for a target stock is shown in Algorithm 3.3.5.
[h] The proposed methodA stock price series
In Algorithm 3.3.5, lines 1 to 13 describes the entirety process of the proposed approach. It first initializes the population according to population size pSize, technical indicators
An example
In the following, an example is given to illustrate the proposed approach on the real stock dataset collected from Taiwan stock market from 2015 to 2019. The used dataset contains number of shares traded, amount traded, opening, high, low and closing prices, spread, and turnover, etc. The used technical indicators include RSI,
Step 1: Data Preprocessing. In data preprocessing, the values of the used technical indicators are first calculated, and the trading signals are then generated. Parts of results are shown in Tables 2, and 4.
Step 2: Chromosome encoding. Because ten technical indicators are used, a bit string contains 10 bits is used to represent them, where 1 and 0 means to use and not to use an indicator. As to parameters of technical indicators, they are encoded by a real number string. An example is shown in Table 5.
An example of chromosome representation
An example of chromosome representation
From Table 5, because there are three “1” in the bit string, it indicates that three technical indicators, MA, RSI and K, are used in the chromosome. According to their parameters shown in the real number vector, the indicators used to generate trading signals are
Step 3: Generating the initial population. Let population size is 10, the initial population with 10 chromosomes are generated randomly according to the encoding scheme.
Step 4: Calculating Fitness function. After the initial population is generated, the designed fitness function is employed to calculate fitness value of each chromosome. Continue using the chromosome showed in Step 2, the trading rules are formed as follows:
RSI: Buying when
Based on the trading rules, buying and selling signals can be generated. When the number of buying signals is greater than half of the number of used indicators, a buying action is suggested. On the contrary, when the number of selling signals is greater than half of the number of used indicators, a selling action is suggested. After the last buying action is executed, if there is no selling action before the end of the testing data, a selling action is executed on the last trading day, and vice versa. In the five-year training data, a total of 22 transactions were made, and the average return rate is 68%.
Step 5: Selection operation. Assume the retain rate is set at 50%, the selection operator is selected top-50% chromosomes based on their fitness values. For other half chromosomes, they will be generated via crossover operator.
Step 6: Using SA for tuning parameters. The SA algorithm is used to tune parameters for the technical indicators. An example for parameter tuning of MA is given in Fig. 8.
From Fig. 8, the return rate of MA using original parameters,
Step 7: Crossover operation. In this step, the goal is to generate not only new offspring but also enough number of chromosomes for population. Two different chromosomes were selected from the top-50% chromosomes as the parent chromosome. It then generates a crossover point randomly. First half genes of first chromosome are combined with last half genes of second chromosome according to the crossover point to form a new offspring, as shown in Fig. 6.
Step 8: Mutation operation. After crossover, based on the given mutation rate, genes in the population are randomly selected for mutation, with 0 becoming 1 and 1 becoming 0, as shown in Fig. 7. If the number of iterations is not yet finished, it will go back to Step 4 for calculating fitness of new chromosomes, and keep repeating the evolutionary process.
Step 9: Outputted final result. When reaching termination condition, the chromosome with the largest fitness value is selected as the best solution. In this example, the best one is shown in Table 6.
The final best chromosome in this example
An example of parameter turning using SA.
In Table 6, it shows that the five technical indicators, including MA, RSI, ROC, K, and DMI, are used at the same time to find trading signals. The parameters used for the used technical parameters are shown in the second row of the table.
Experimental datasets and environment descriptions
To evaluate the effectiveness of the proposed approach, the three datasets, including uptrend, sideway trend, and downtrend, are collected from Taiwan stock market. The collected period is from 2015 to 2020, and time periods from 2015 to 2019, and 2020 are used for training and testing, respectively. The stock symbols for the collected companies are 2330, 2492, and 2498, and the stock prices series of them are shown in Figs 9–11.
Information of experimental environment
Information of experimental environment
Uptrend dataset.
Sideway trend dataset.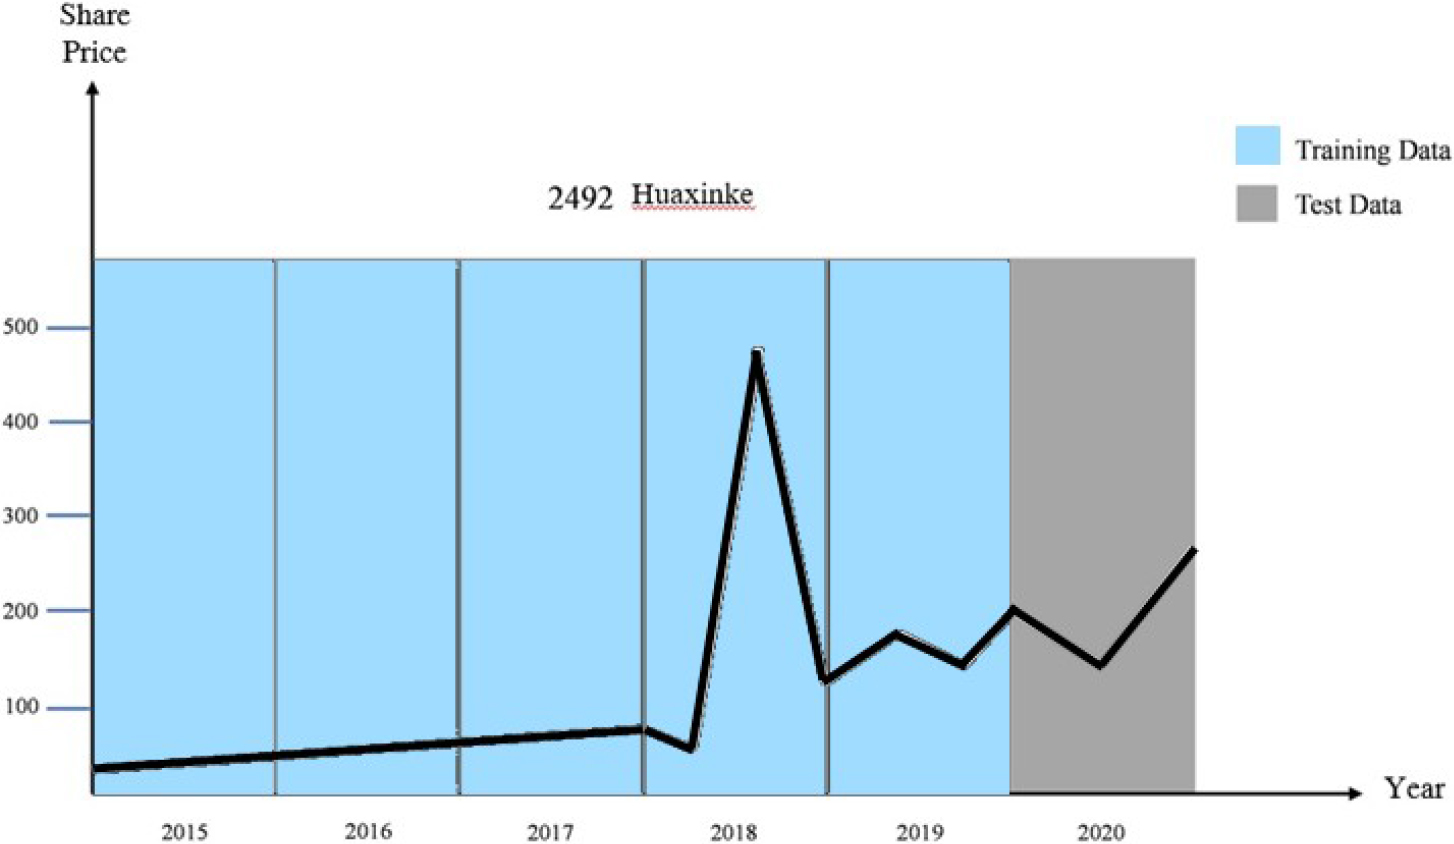
From Figs 9–11, the blue and gray areas are used as training and testing periods in the following experiments. As to the experimental environment, information of hardware and software is shown in Table 7.
Downtrend dataset.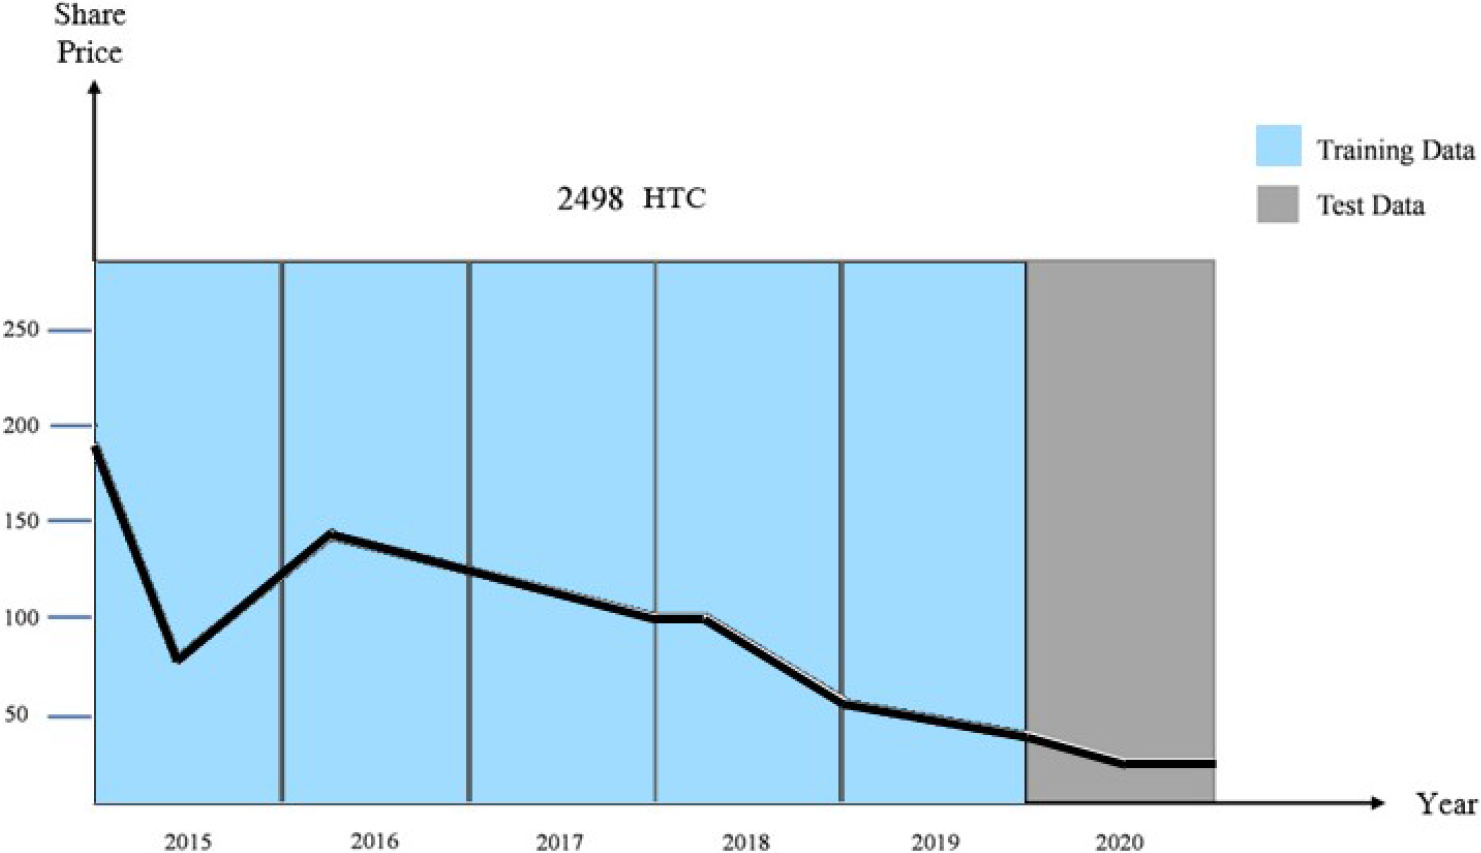
The parameters that used in SA are set as follows: initial maximum temperature Tmax is 5000, minimum temperature Tmin is
Based on the collected three datasets, the experimental results are shown and discussed in this section.
Analysis on uptrend dataset
After generations, the best chromosome for the uptrend dataset obtained from 30 runes is shown in Table 8.
Best chromosome of uptrend dataset
Best chromosome of uptrend dataset
From Table 8, it shows that four indicators are used to identify trading signals. In the training phase, the highest return is 78.35%. Then, using a-year (2020) testing dataset, the related trading results are shown in Table 9.
Trading results in testing period on uptrend dataset
From Table 9, it shows that the number of transactions is six in the year 2020, and returns of them are -3.12%, -2.01%, 20.6%, 0.71%, 4.14%, 6.21%, respectively. In other words, the cumulative return is 26.53% for the whole year. The winning rate is 66.67%.
Using the same parameter setting, after generations, the best chromosome discovered by the proposed approach is shown in Table 10.
Best chromosome on sideway trend dataset
Best chromosome on sideway trend dataset
From Table 10, it suggests that the suitable technical indicators are MA, KD, ROC, and BIAS, and the return of it is 494.42%. Applying the obtained chromosome to the year of 2020 for testing, the related trading results are shown in Table 11.
Trading results in testing period on sideway trend dataset
From Table 11, it shows that there are totally four transactions when the four technical indicators are used, and returns of them are 2.43%,
In downtrend dataset, after 100 generations, the best chromosome obtained by the proposed approach is shown in Table 12.
Best chromosome on downtrend dataset
Best chromosome on downtrend dataset
From Table 12, it shows that when using MA, RSI, CCI, and K together to find trading signals, the highest return which is 26.68% can be generated. The trading results on the testing period using the obtained chromosome are shown in Table 13.
Trading results in testing period on downtrend dataset
In Table 13, it shows that number of transactions is five, and returns of them are
Next, to show the merits of the proposed approach, comparison results of the proposed approach and the well-known buy & hold strategy (BHS) [6] in terms of cumulative return were made on the three datasets, and the results are shown in Figs 12–14.
Comparison results of proposed approach and BHS on uptrend dataset.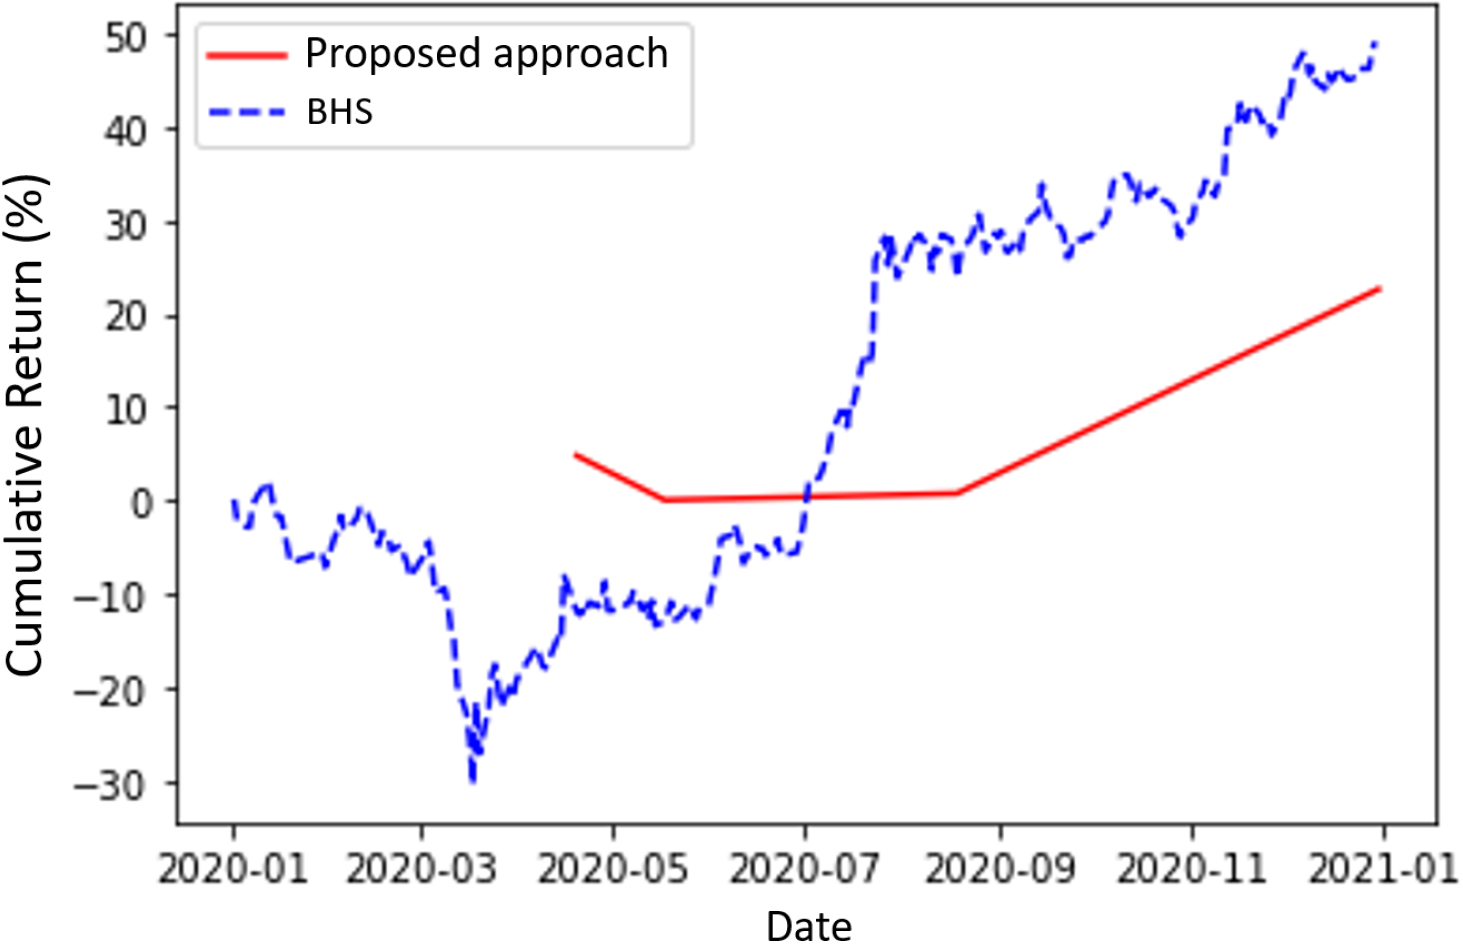
From Fig. 12, the red and blue dotted lines are cumulative returns of the proposed approach and BHS. It shows that the returns of the proposed approach and BHS are 26.53% and 53.24%, which means that BHS is better than the proposed approach on uptrend dataset. Besides, we can also see that HBS dropped significantly in March 2020 due to the impact of COVID-19. However, when using the obtained technical indicators for trading, it can avoid the event in that period of time. In other words, although the proposed approach provides less return than BHS, it has better ability to avoid risk.
Comparison results of proposed approach and BHS on sideway trend dataset.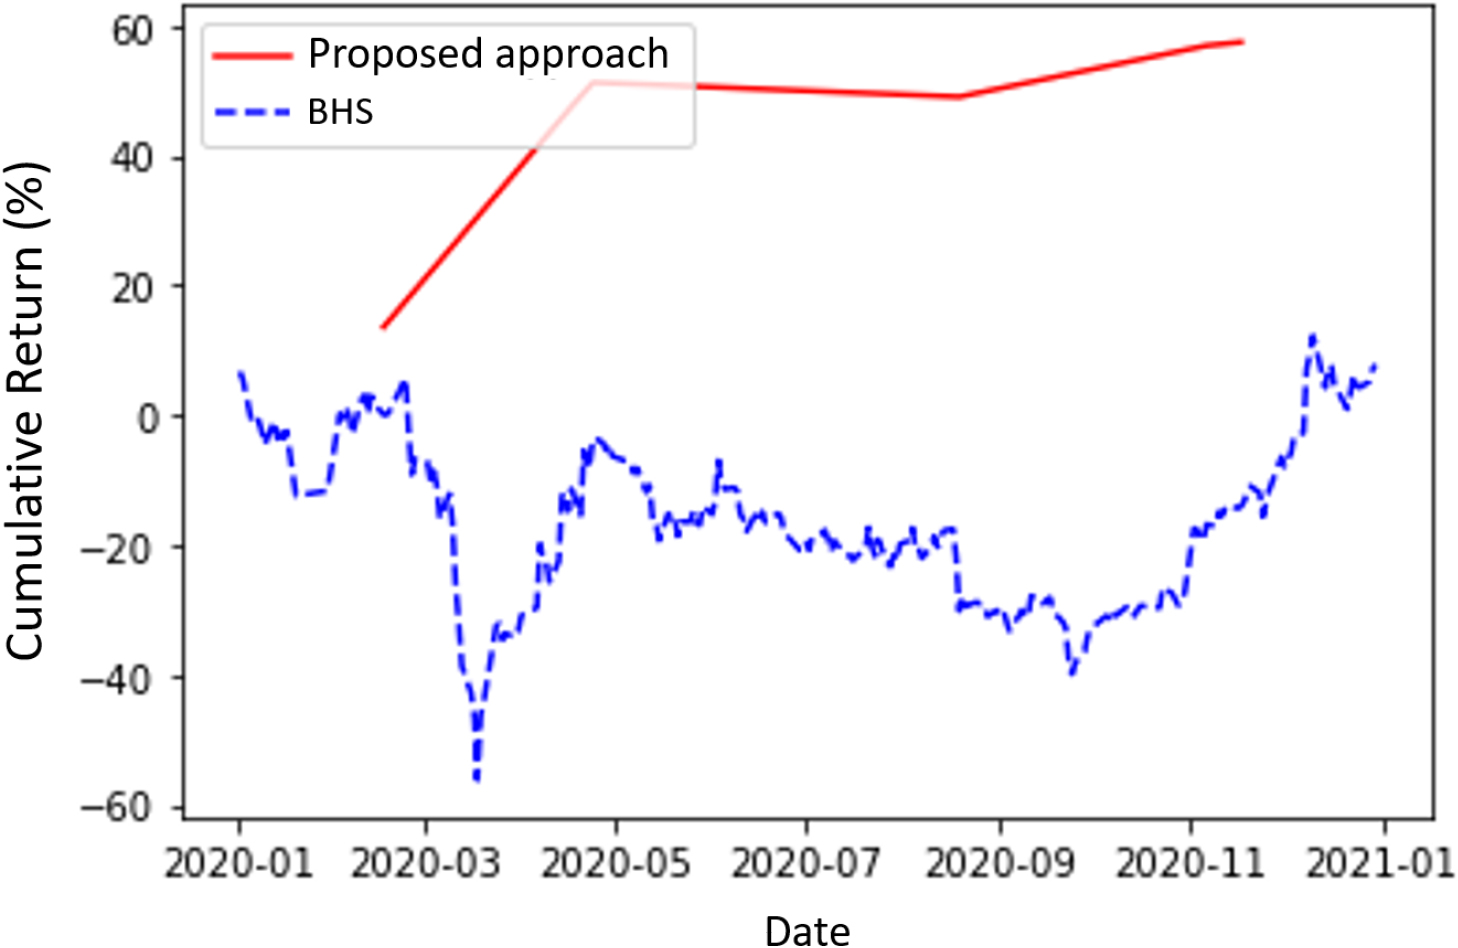
From Fig. 13, it shows that cumulative returns of the proposed approach and BHS are 33.48% and 8.19% on testing dataset. Based on the results, we can know that the proposed approach is better than BHS in terms of cumulative return and ability to avoid loss on sideway trend dataset.
Comparison results of proposed approach and BHS on downtrend dataset.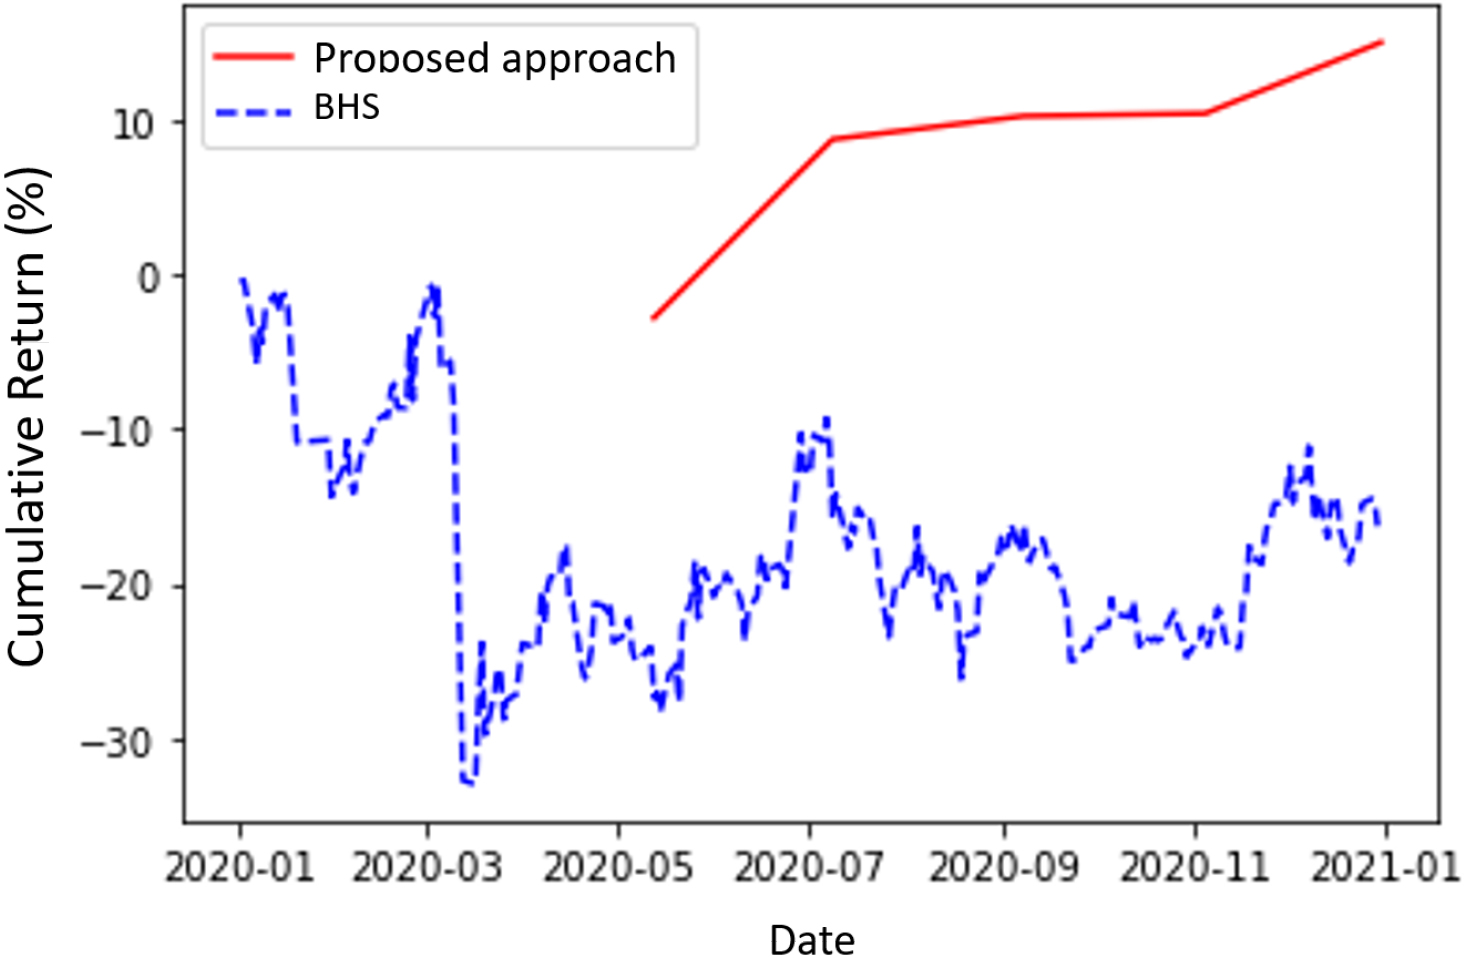
From Fig. 14, it shows that the cumulative returns of the proposed approach and BHS are 9.7% and
At last, experiments were conducted on the three datasets to show the effectiveness of the proposed approach with and without SA. When using the proposed approach without SA, it means that only GA is used. Experimental results on the three datasets are shown in Figs 15–17.
Proposed approach with and without SA on uptrend dataset.
From Fig. 15, it shows that cumulative return of the proposed approach is similar or a little bit better than it without SA. As showed in previous section, its cumulative return and average return are 26.53% and 4.42%. When using only GA for optimization, five transactions are made, and cumulative return and average return are 25.44% and 5.09%. Besides, the interesting observation is that the first transaction of two approaches are both made after May which mean that the obtained technical indicators can successfully avoid the previous time interval with a large decline.
Proposed approach with and without SA on sideway trend dataset.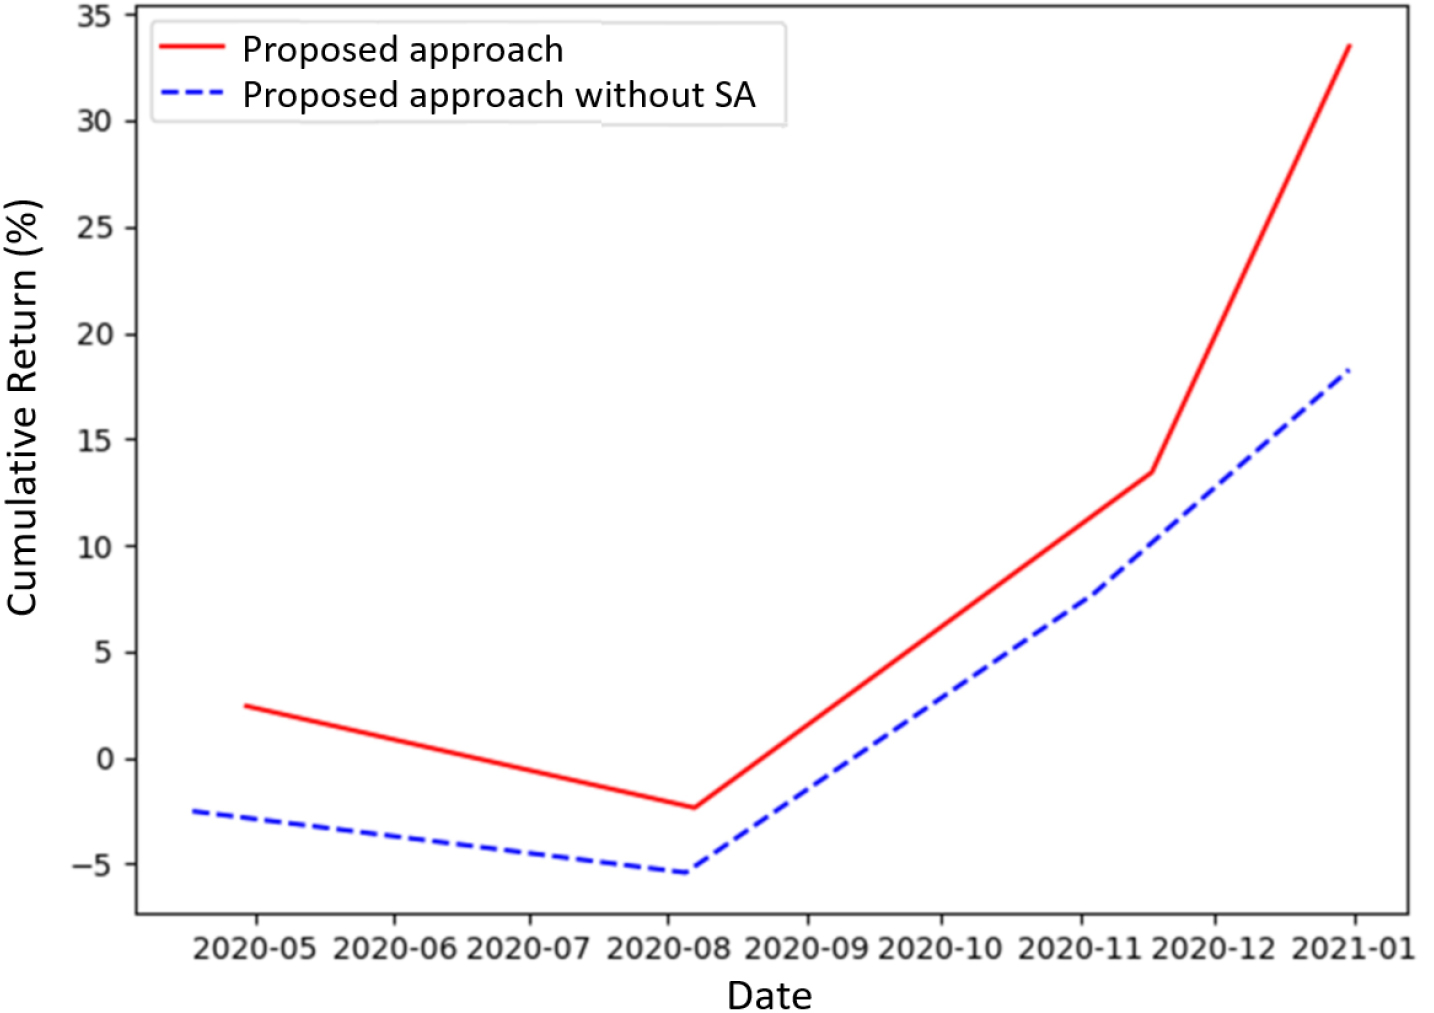
From Fig. 16, it shows that the proposed approach is better than it without SA. Its cumulative return and average return are 33.48% and 8.37%. When using only GA for optimization, four transactions are made, and cumulative return and average return are 18.26% and 4.57%. The first transactions of them are again made after May, which shows their ability to avoid risk. Hence, based on the results, we can say that the proposed approach on sideway trend dataset is effective to find reliable trading signals.
From Fig. 17, it shows that the proposed approach is also better than it without SA. The cumulative return and average return of the proposed approach are 9.7% and 1.94%. When using only GA for optimization, six transactions are made, and its cumulative return and average return are 5.04% and 0.84%. In addition, it shows that when using SA for parameter tuning, the cumulative return is around two times better than that without SA. Based on the results, we can say that the obtained technical indicators and parameters by the proposed approach are effective on not only to avoid massive loss but also to get profit even the downtrend dataset used.
At last, the execution time of the proposed approach and GA with different population sizes of a generation is shown in Table 14.
Comparison of the proposed approach and GA in terms of execution time (Sec.)
Proposed approach with and without SA on downtrend dataset.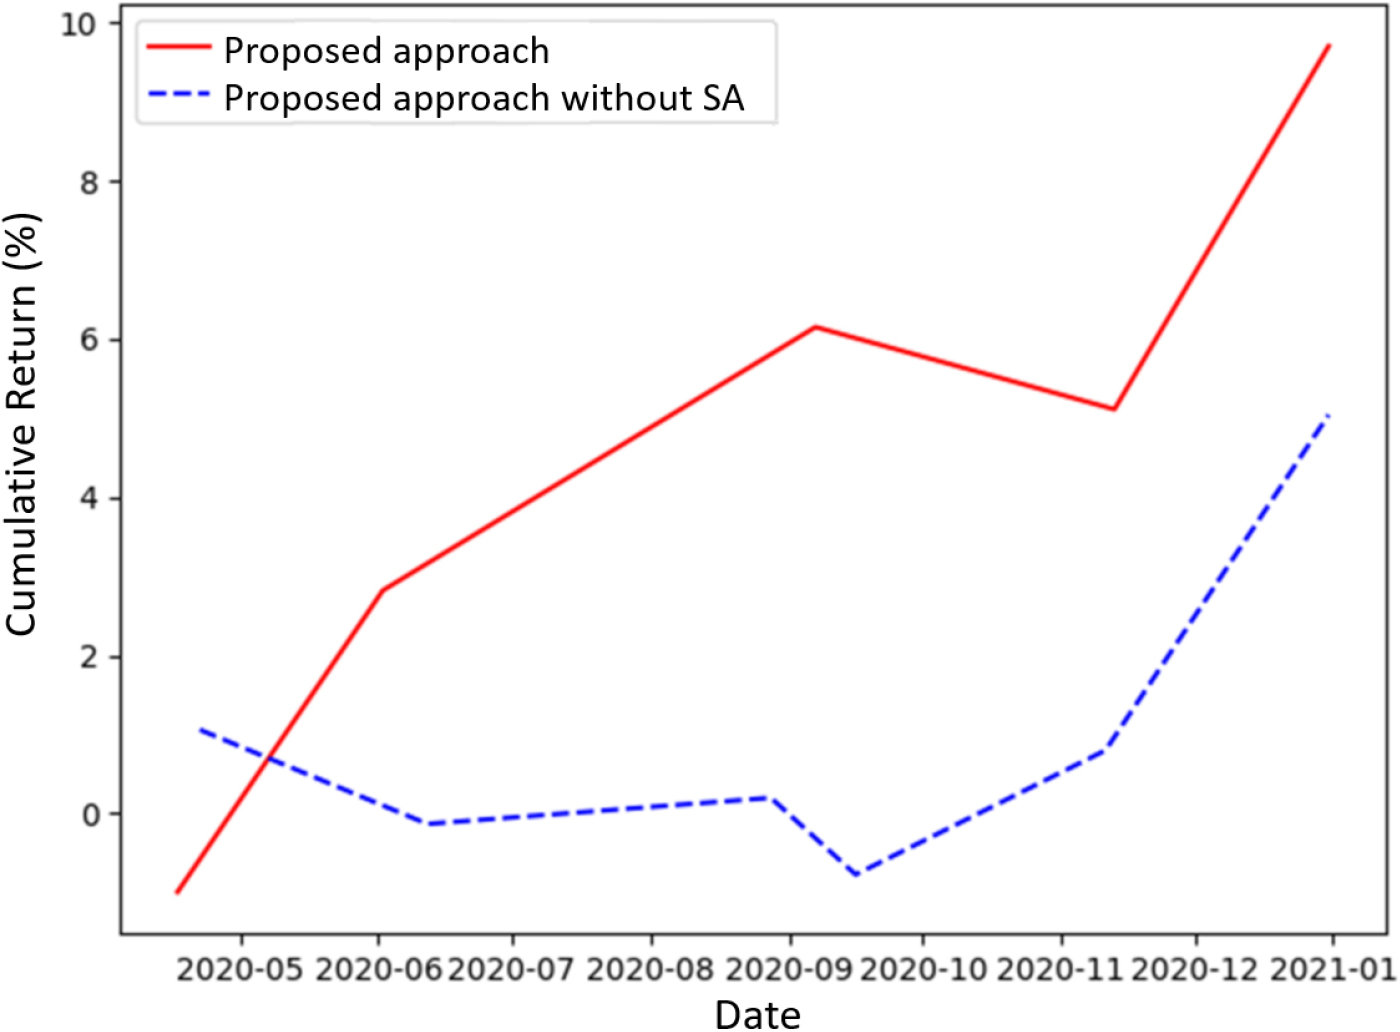
In Table 14, we can observe that when the population sizes are set at 10 and 30, the execution time for GA and the proposed approach are 7.7 and 22.2, and 3434.1 and 7055.8 seconds. It indicates that the execution time of finding appropriate technical indicators and their parameters by using the proposed approach is higher than that by GA. This results are reasonable because SA is used in the proposed approach as local search algorithm.
Based on the experimental results, following observations can be found: (1) The first one is that the final chromosomes derived by the proposed approach can reach positive returns no matter what trends of datasets are in training and testing phases; (2) The second observation is that different technical indicators and their parameters can be obtained for stocks with different trends to reduce the risk by using the proposed approach; (3) The third observation is that number of transactions by using the obtained chromosomes is few for the three datasets and the winning rates of them are around 60%, which mean that the used technical indicators can identify more profitable and safe trading signals; (4) Comparison results also indicate that the cumulative return of proposed approach is better than BHS and that using only GA. In other words, we can conclude that the proposed approach is effective.
Conclusions and future work
Due to the demand for personal financial services in smart cities, in this study, the memetic-based stock trend prediction approach has been proposed to find a set of technical indicators as well as their parameters for identifying more reliable trading signals for constructing the effective transaction robot. In the proposed approach, GA and SA are used as the global search and local search algorithm. In the global search, technical indicators and their parameters are encoded into a chromosome by a bit string and real numbers. Fitness value of a chromosome is evaluated by returns and maximum risk of transactions. In local search, SA is used to tune parameters of the used technical indicators. Then, genetic operators are executed to generate new offspring. The evolution process is repeated until reaching termination conditions. To show the merits of the proposed approach, experiments were conducted on the uptrend, sideway trend, and downtrend datasets, and reveal that: (1) Experimental results show that the proposed approach provides useful technical indicators and their parameters as well for target stock to increase profit and avoid massive loss; (2) Comparing to the proposed approach without SA shows that the proposed approach is effective in finding more useful parameters to increase profit. In the future, based on the proposed approach, we will continue to design more advanced algorithms. For instance, considering types of technical indicators to enhance the fitness function so that a more robust set of technical indicators and parameters can be found. In addition, different types of global and local search algorithms could be employed to enhance the proposed approach. Besides, we will also try to build a fair platform to compare the proposed approach to the existing approaches.
Footnotes
Acknowledgments
This research was supported by the National Science and Technology Council of the Republic of China under grant NSTC 111-2221-E-992-088-MY2.