



Abstract
Since the outbreak of COVID-19 (Corona Virus Disease 2019), the Chinese government has taken strict measures to prevent and control the epidemic. Although the spread of the virus has been controlled, people’s daily life and work have been affected and restricted to varying degrees. Thus people have different sentiments, these may affect people’s implementation and compliance with the policies, thus affecting the effectiveness of epidemic prevention and control. At present, few pieces of literature have analyzed the relationships between people’s feelings, policies, and epidemic trends. The object of this paper is to analyze the text content on social media, to find out the impact of the epidemic blockade policy on the public mood and the concerns expressed by the public about policies changes, and the interaction between policies and epidemic states at different stages of the epidemic. In this paper, we collected the posts of two cities where the epidemic occurred at the same time for analysis and comparative study. On the one hand, we revealed the changes in public attention and attitudes in the two regions during the epidemic, the other hand, it also reflects the differences in public sentiment between the two regions, as well as the correlation between emotions and policies and epidemic trends when different policies are adopted under different circumstances. The obtained results have a certain guiding significance for public health departments to formulate reasonable epidemic prevention policies.
Introduction
COVID-19 has caused a global health crisis [19], which is affecting the global economy and society. While competing with novel coronavirus, some countries have chosen to coexist with the virus to restore the social economy and order. In contrast, others have taken some restrictive measures to control the spread of the epidemic. At the same time, in this ever-changing era, social media [5, 9, 23] has penetrated all aspects of public life in different ways, and people transmit and obtain information through the Internet. Weibo is a social networking site commonly used by Chinese people, through which they express their views on the pandemic. The purpose of this paper is to use the method of text analysis, combined with the public epidemic data of Shanghai and Jilin, to reveal the public opinion related to the epidemic posted by people in these two cities on Weibo. We are more concerned about the following issues:
What topics are people more concerned about during the epidemic? How does the public’s mood fluctuate during the epidemic management and control period? What is the relationship between public sentiment, epidemic prevention policy, and epidemic trends?
In this paper, we chose two cities, Shanghai and Jilin, as the two cities found the first local case on the same day. In the face of the outbreak, people in cities posted a large number of related posts on Weibo. We analyzed these COVID-19-related posts based on policies data from two cities during the epidemic to extract emotional and semantic thoughts related to Weibo. Specifically, we use the method of automatically extracting COVID-19-related posts from social media and using an emotional dictionary to determine the emotional value of posts and various problems related to COVID-19 revealed from public opinion. The main contributions of this paper are as follows:
Our findings provide local health organizations with civic insights into formulating epidemic prevention policies for COVID-19. Our research illustrates the importance of using public opinion and appropriate computing techniques to understand COVID-19-related issues and guide relevant decisions. We provide the idea of studying the relevance of pandemic dynamics and government policies from the perspective of public opinion.
In recent years, there have been many studies on the use of deep learning to analyze public sentiment during the epidemic. A deep learning-based sentiment classification model was designed [33] to analyze COVID-19-related comments to uncover people’s positive or negative opinions using NLP (Natural Language Processing) techniques based on topic modeling algorithms to automatically extract meaningful topics. An analysis of public sentiment by examining Twitter texts [25] during a pandemic provided insights into human communication and models of human Internet and social media use. In the paper [29], the authors analyzed the Weibo posts related to the COVID-19 epidemic situation, used the unsupervised BERT model to classify the emotions, the TF-IDF (Term Frequency-Inverse Document Frequency) model to summarize the topics of the posts. Based on deep learning methods and sentiment analysis [15] discusses how citizens from different cultures react to novel coronaviruses and how people perceive the follow-up actions taken in different countries. The study [1] aims to assess people’s emotions about various vaccines, as well as an analysis of the timeline of tweets. Cyclic neural network (RNN), including long-term and short-term memory (LSTM) and bi-directional LSTM (Bi-LSTM), is used to evaluate the performance of the prediction model. The authors of [22] proposed a method to detect and analyze the emotion of tweets including fsp (fuzzy sentiment phrases). Experimental results show that this method significantly improves the performance of Twitter emotion analysis. In the work of ChandraX et al., they propose a framework using a language model based on deep learning [4] to conduct emotional analysis through LSTM during the rise of new COVID-19 cases in India. The results showed that during the rise in new COVID-19 cases, most tweets were positive and the proportion of negative emotions was much lower. These forecasts show that while most people are optimistic, a considerable number of people are still annoyed by the way the authorities handled the pandemic. Shana et al., [14] presented the use of recurrent neural networks to analyze the mood of social media data to determine the mood of Indians during a coronal pandemic under a national blockade. The authors classified tweets related to the COVID-19 national blockade using recurrent neural methods. RNN classifies emotions into positive, negative, and neutral emotion scores. The results show that it is possible that the mortality rate is low, the recovery rate is high, and people are still full of hope, so the mood of Indians during this period is more positive and neutral. In [21], norambuena et al. discuss the extraction of emotions and opinions from an international conference, with the main purpose of automatically determining the direction of the comments and comparing them with the assessments made by the reviewers of the articles. Zvarevashe et al., [38] developed a customized 2D convolution neural network, which can extract and classify speech features. The neural network is evaluated according to the depth multilayer perceptron neural network and the depth radial basis function neural network. We found that there were few pieces of literature in existing research that combined public sentiment, policies, and epidemic trends. Then we use text analysis and other tools to study the impact of China’s strict epidemic prevention policies on public sentiment, as well as other issues related to the epidemic. The findings of our study may be of some reference or help to foreign epidemic prevention and control policies.
Material and methods
The reason for choosing Shanghai and Jilin for this study is that the first local cases of infection were found in Shanghai and Jilin on the same day. However, there were significant differences in the mood of the populations of the two cities during the pandemic due to differences in the regional and demographic composition of the outbreak sites and the preventive measures [6, 31]. Considering the economic impact, the Shanghai government did not follow the model of Shenzhen’s direct city closure but hoped to control the spread of the epidemic through network investigation and closed management in some areas. Finally, due to the excessive number of people infected in Shanghai, which directly affected the adjustment of government decision-making, measures were taken to close the city. In addition, Jilin did not pay enough attention to it in the early stage, which led to a clustered infection and the wide spread of the virus, so the government quickly took blockade measures.
Weibo is a social networking platform that is widely used by Chinese users [8, 17, 32]. Weibo provides users with many convenient functions, Users can search for specified keywords within the specified date range, send and receive restricted short posts, and retrieve text content. Using this feature, we collected Weibo posts related to COVID-19 from March 1, 2022, to June 10, 2022. The octopus web crawler tool is used to search for predefined keywords in addition to the collected text content. We also collected five attribute values related to our research: Id: Identity document, which can be used as a unique identifier; Time: The time when the user posted the post; Text: The content of the user’s post; Share: Shared; Comment: Number of comments; Like: Number of likes. To get this data, we used Weibo’s advanced search function. We have a total of more than 210000 pieces of Weibo combined data on our mobile phones, and 200000 pieces of data can be used after removing noise from the data. We know that there is no obvious separation between words in Chinese. In order to get the desired results from the text, we used the jieba participle to divide Weibo posts into space-separated phrases and to delete words and punctuation we didn’t need.
We use theme classification, emotion dictionary, and text analysis to capture the events that the public focused on during the pandemic and the changes in public mood in the two cities under different policies. Figure 1 outlines the analysis process of this study.
Analysis of Weibo posts related to COVID-19.
Text analysis
RQ1: What topics are people more concerned about during the epidemic?
To address the first research question above, in this section, we will describe the experiment in detail based on the data we have collected, and then have a comprehensive discussion of the results. We use the method of thematic analysis to use the collected data to achieve Chinese word segmentation using jieba, and capture the LDA (Latent Dirichlet Allocation) topic model to retrieve potential topics [20].
LDA can be used to identify the most common topics in shared posts on Weibo. LDA is a widely used topic modeling algorithm [10]. The goal of the LDA model is to speculate on the distribution of topics based on a given document. With LDA modeling, we can map a given document to a fixed set of topics and capture representative words for each topic. The LDA model can get the matching degree between each text and each subject word, and finally get the corresponding topic [3, 11]. Before using LDA, in order to determine the appropriate number of LDA topics, we use the perplexity [12] method to select the appropriate number of LDA topics. Through the continuous adjustment of the number of topics, we find that both cities reach their lowest value when the number of topics is 5. The best number of themes in Jilin and Shanghai is derived from the lowest points of the curves in Figs 2 and 3. Then, you can establish a natural cluster in the Weibo release dataset. Tables 1 and 2 show five topics related to the epidemic situation in Jilin and Shanghai respectively.
The degree of Perplexity of Jilin posts.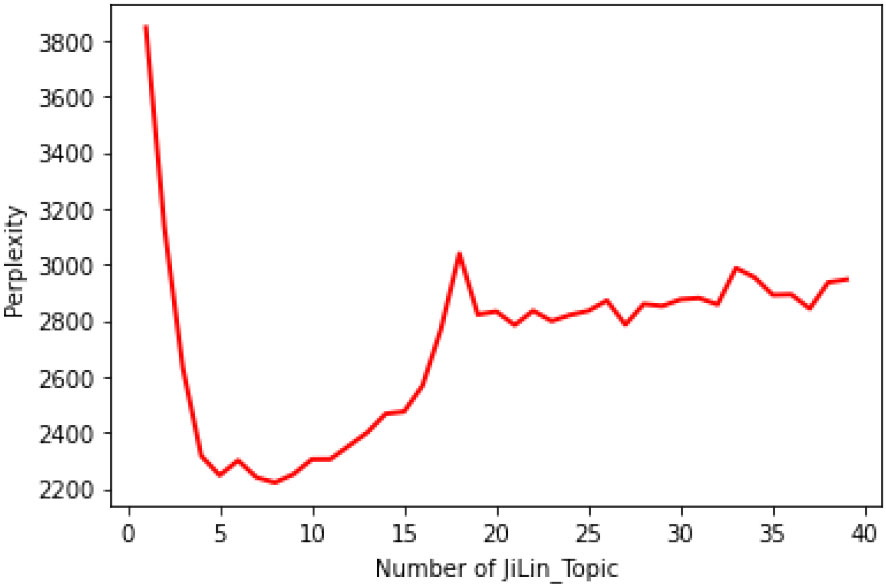
The degree of Perplexity of Shanghai posts
Related topics of Jilin COVID-19
Topics related to Shanghai COVID-19
To solve the first important problem, we took the word cloud tool in data mining by using visualization to derive the weight ratio of each keyword based on the statistics of word frequency, Figs 4 and 5, (Where the larger the area of the graph indicates the larger the data share of the topic).
In Fig. 4, the orange circle has the largest area, which corresponds to the topic0 related to epidemic prevention and control, where “epidemic”, “video”, “material”, “hospital” and “college” are the most discussed keywords by the public in Jilin. We can see the importance of epidemic air defense during a pandemic. This topic is the first ranked topic found from the generated potential topics, most users express their opinions and comments on this issue in this topic. The second red circle corresponds to Topic 1, which contains keywords such as “PCR-testing”, “school”, “video” and “anti-epidemic”, which are related to the national fight against the epidemic. Throughout the pandemic, the public in Jilin had more discussions on the topics of epidemic prevention and control and national resistance to the epidemic.
Figure 5 shows that the keywords are most concerned the Shanghai public during this period are “video”, “life”, “village”, “feeling”, and “school” as shown by the largest red circle in the figure. They correspond to Topic 0 of the Shanghai theme classification. The content of this theme reflects the impact of the epidemic on life. Then there are orange circles, including “anti-epidemic”, “epidemic prevention”, “material”, “village” and “control”, which indicate that the Shanghai public pays close attention to the epidemic prevention work.
Proportion of each theme related to COVID-19 in Jilin
Visual theme distribution class in Jilin.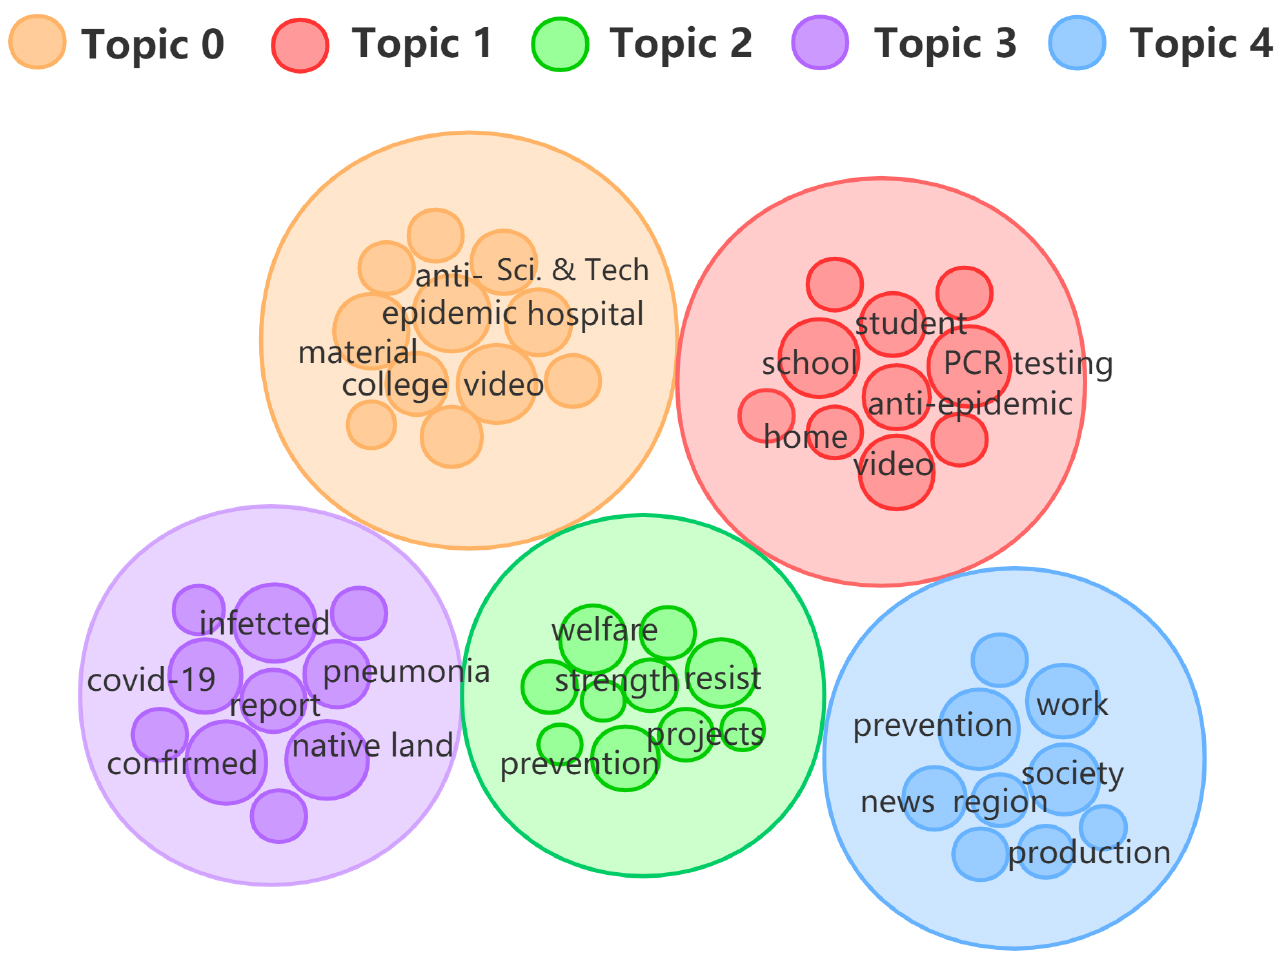
Visual theme distribution classes in Shanghai.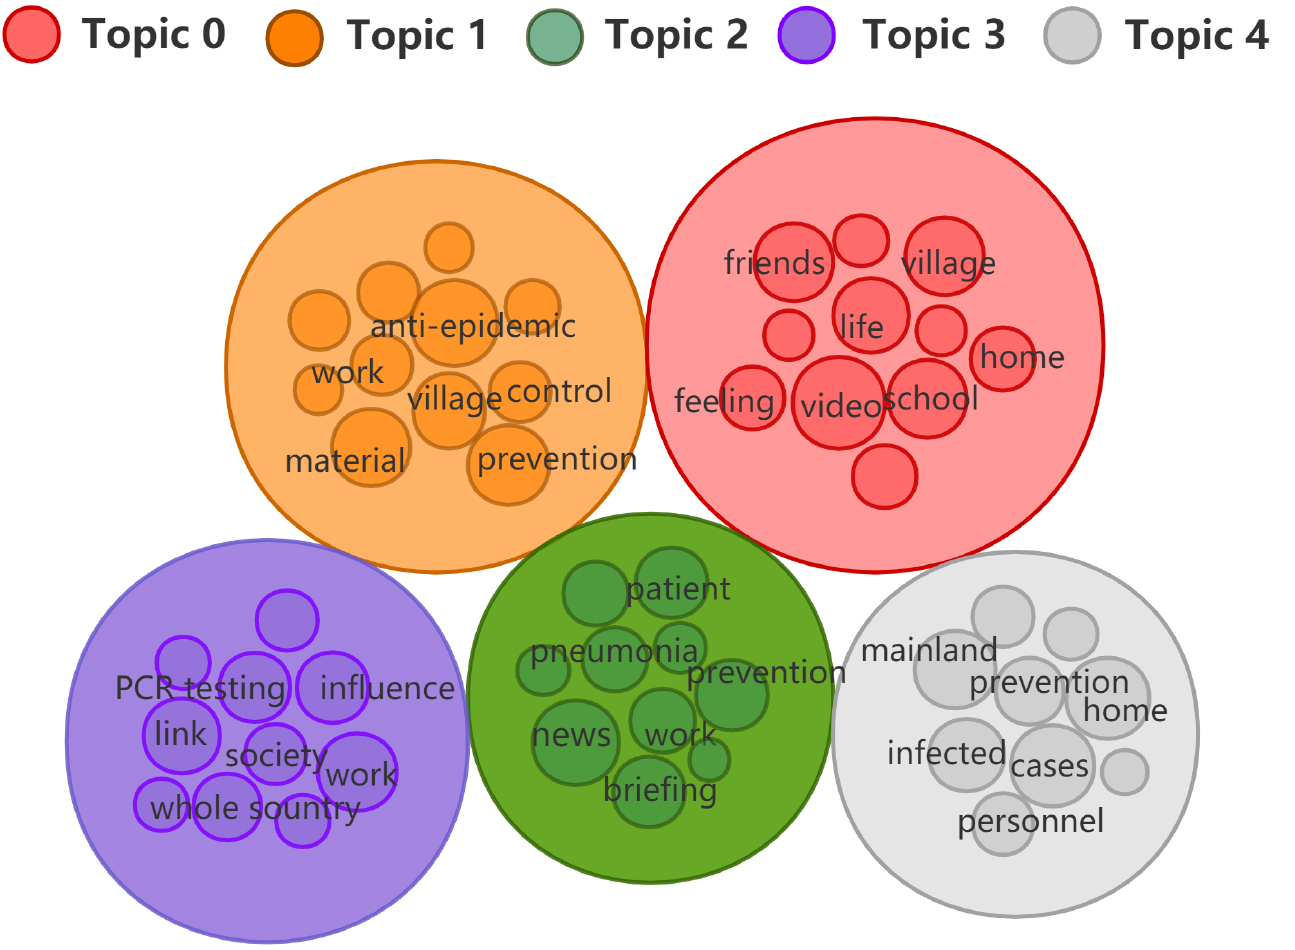
Proportion of each theme related to COVID-19 in Shanghai
In addition, we also studied the proportion of each theme in the two cities and found that there were some differences in the focus of public attention between Shanghai and Jilin during the epidemic, Tables 3 and 4. From the data in Table 3, we can see that during this period, the public in Jilin is more concerned about the epidemic situation and related policies, followed by the work and academic problems brought about by the city’s home management. As can be seen from Table 4, during the pandemic, the Shanghai public posted on Weibo many topics related to the blockade policy, including a series of related social issues, such as the blockade of the community, the postponement of examinations, the postponement of the start of the school year, and so on. From the above discussion, we can conclude that during the whole process of the outbreak, the public in both cities paid more attention to the national anti-epidemic and home blockade.
Finally, according to the pandemic timeline, we sort out the top five keywords that appear most frequently in the Weibo data of the two cities in different periods [34].
Changes of Weibo keywords related to the epidemic situation in two cities.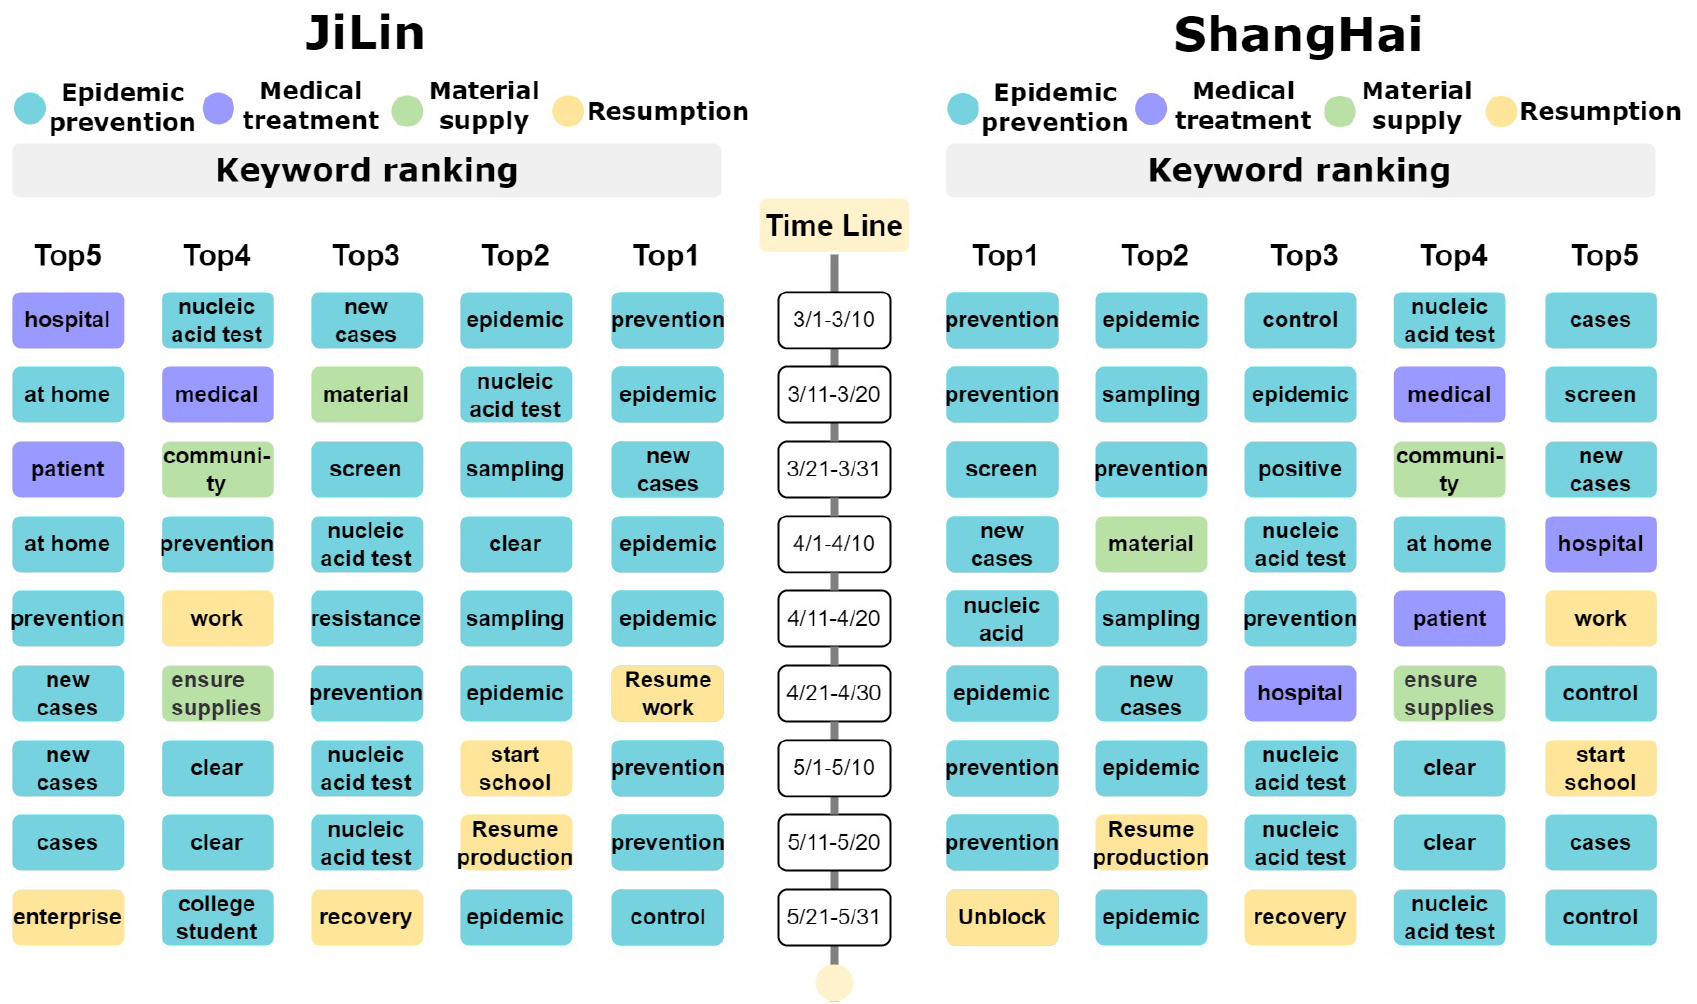
According to the timeline of the outbreak, we found that the keywords discussed by netizens in Shanghai and Jilin were changing at different stages of the epidemic, as shown in Fig. 6. Since the number of infected cases in Jilin increased dramatically in early March, Jilin netizens were more concerned about the dynamics of the epidemic and medical treatment in the early stages of the outbreak. The middle of the epidemic was a state in which the epidemic has slightly abated, so the public in Jilin was more likely to discuss changes in the epidemic situation during this period. In the later stages of the epidemic, more of what Jilin netizens posted on Weibo was related to the resumption of work and production. During the worst time of the outbreak, Shanghai netizens were not only concerned about the outbreak but also their jobs and studies. Over time, after the number of new cases dropped sharply from the highest point, the topic of concern shifted from epidemic prevention and control to the resumption of work and production. The changes in these keywords show the level of concern and worry in these areas, changing with the timeline, and we believe that this result may be a valuable indicator for the government to formulate relevant disease prevention policies [24].
From the above analysis, we can conclude that throughout the epidemic period, the populations of these two cities are focused on information related to epidemic prevention and control. However, according to the dynamic changes of the epidemic, the focus of public attention is also changing.
Give an example of an emotional dictionary to score
A comparison of various emotions between Jilin and Shanghai.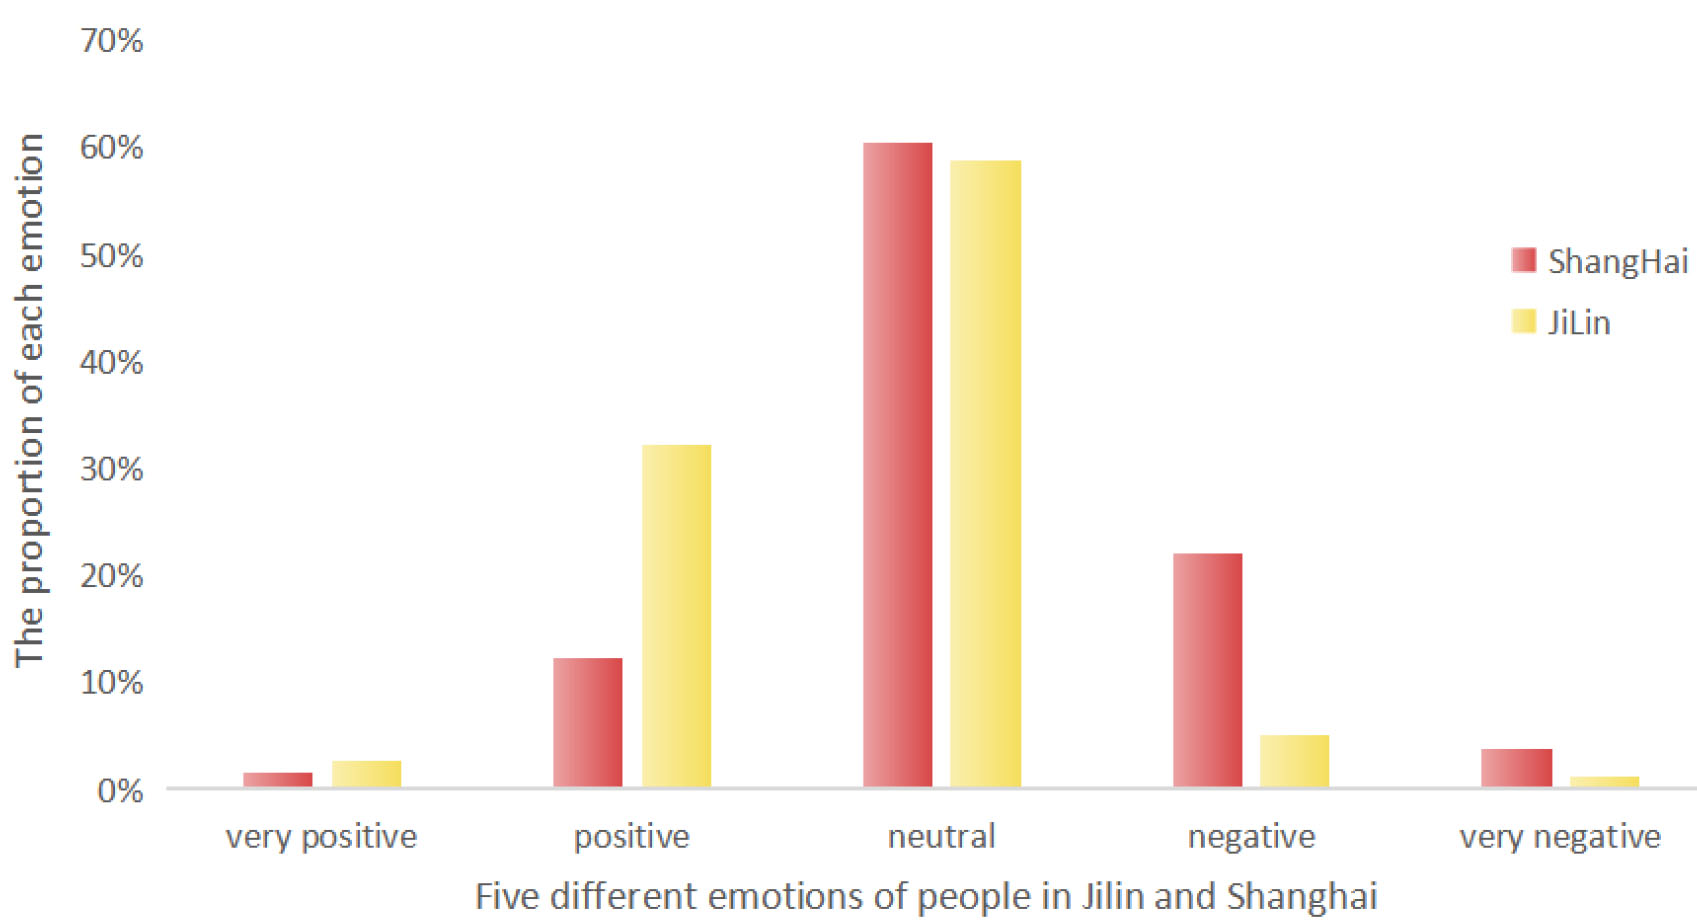
RQ2: How does the public’s mood fluctuate during the epidemic management and control period?
Examples of popular blog articles in Jilin
Examples of popular blog articles in Jilin
To solve the second important problem, we need to study the impact of COVID-19 on public mood [17]. We use the emotion analysis based on the Boson NLP emotion dictionary, which is a well-marked emotion dictionary launched by the Boson Natural Language Processing Company. In the dictionary, each emotional word is scored [18]. We obtained the stop word lexicon, degree word lexicon, and negative word lexicon from the public data on the network. Table 5 illustrates the emotional scoring of COVID-19 posts. Emotional scoring includes some rules, which are as follows:
In the process of traversing the text, the Jieba is used for Chinese word segmentation to filter out the words that match the stopped words. Find out the emotional words, negative words, and degree adverbs in the screened text. Check all the emotional words to see if there are negative words and degree adverbs in front of the current emotional words. If there are no negative words, multiply the current emotional word by 1; if the number of negative words is n, then multiply the current emotional value by the n power of ( Finally, the emotional words of the sentence are summarized. The formula is as follows:
Therefore, we marked all the texts related to COVID-19 in Shanghai and Jilin with emotion scores and calculated the daily average emotion of the two cities. Based on the rules of emotion scoring, we determine that if the score of positive emotion is greater than that of negative emotion, that is, when the total emotion is positive, then a text is positive. If the emotional score is negative, it is the most negative text, and the higher the score, the more positive the text is. We calculated the average emotional value for each day and then divided all the texts into five categories, which are very positive, positive, neutral, negative, and very negative.
From Fig. 7, we can see clearly that the emotions expressed by the public in Jilin are more positive on the Internet than in Shanghai. We know from public data that in this outbreak, the number of asymptomatic infections in Shanghai far exceeds the number of diagnosed on the same day, while Jilin has more confirmed infections than asymptomatic infections. As much as 98.5% of the new people in Shanghai are asymptomatic infections, compared with less than 50% in Jilin. The greater the proportion of asymptomatic infections, the greater the potential risk of infection. Therefore, we reasonably infer that this may also be one of the reasons why the mood of the people in Shanghai is more negative than that in Jilin.
Among Weibo users, Big V users (users who have obtained personal authentication on social media platforms and have a large number of fans) are more influential than ordinary users [28]. We can study the emotions of Weibo users and other conclusions that are helpful to our experiment from the attention paid to the posts [7].
Examples of popular blog articles in Shanghai
Emotional visualization conveyed by popular posts in Jilin.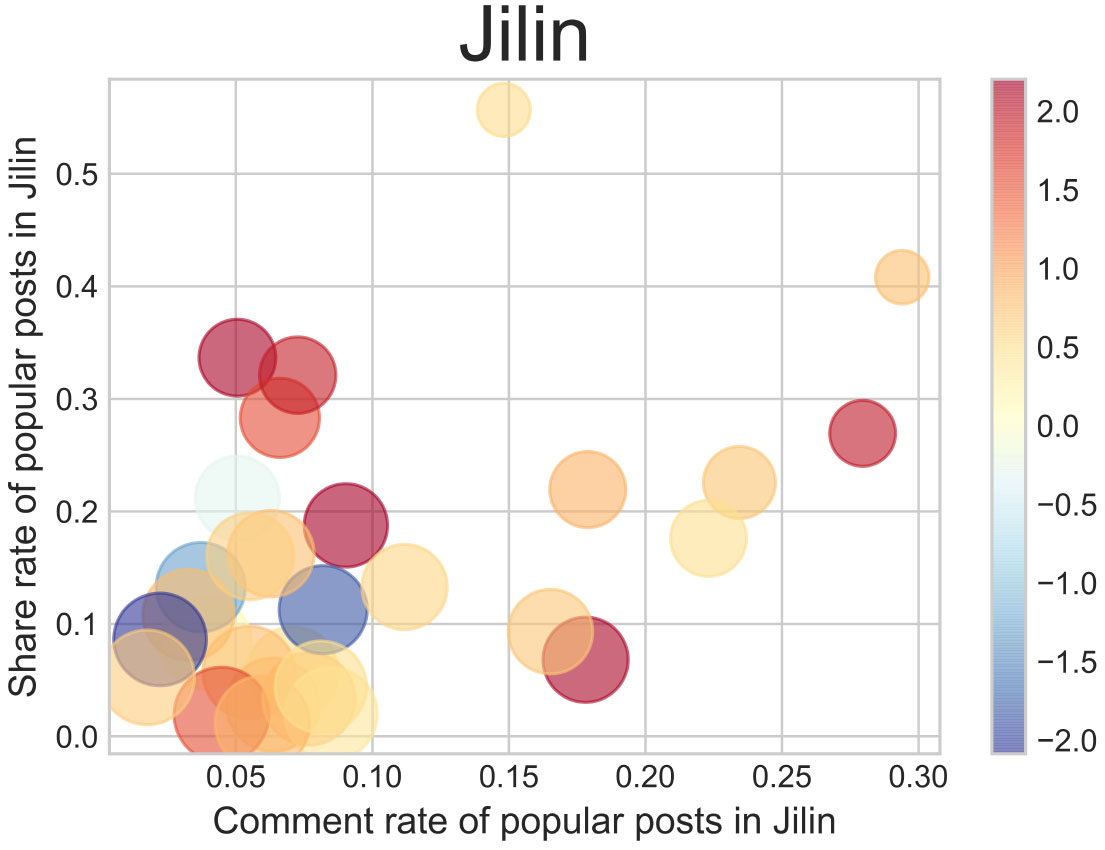
Emotional visualization conveyed by popular posts in Shanghai.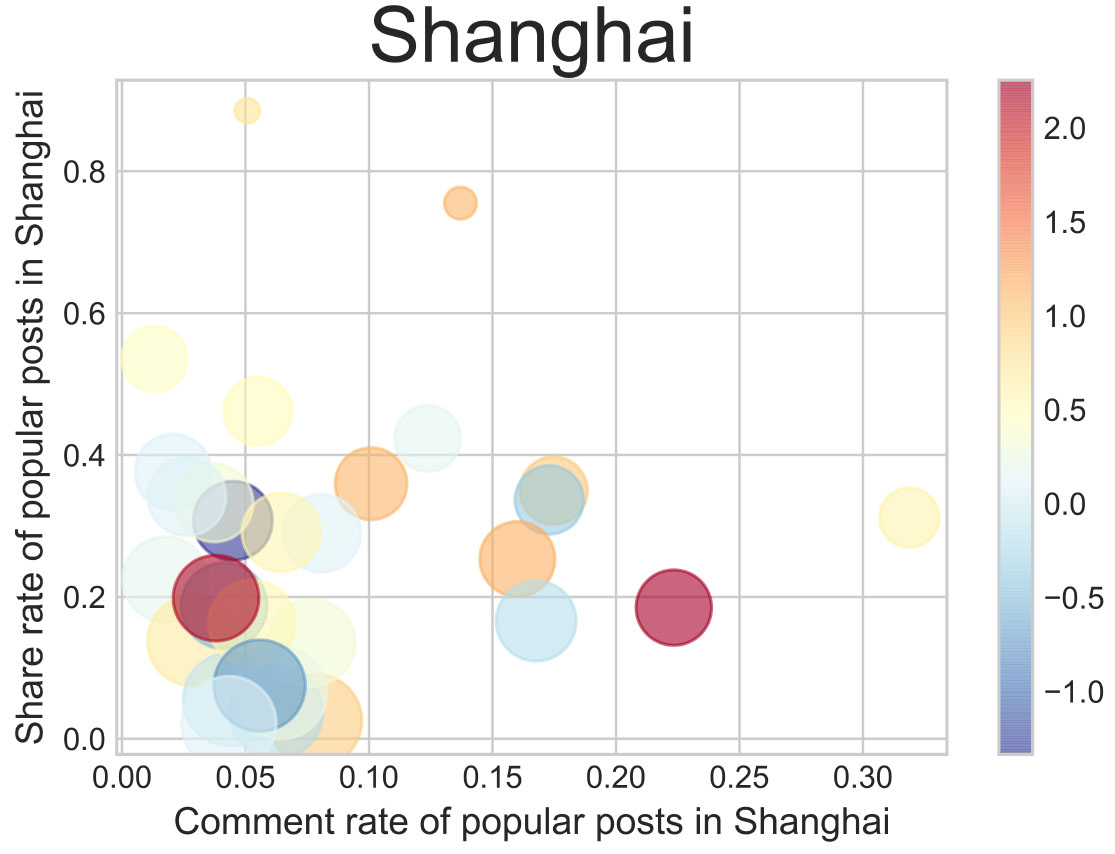
Tables 6 and 7 show the top five hot posts in Jilin and Shanghai from March to early June, respectively. We analyze these posts in three dimensions: retweet, comment, and like. According to the analysis of users’ behavior on social media [9], retweets have more weight than comments, followed by likes. When we collate the data, we find that the number of likes of more popular blog posts is generally about twice as much as the number of retweets and comments combined. So we normalize these three data and use matlab to draw a scatter chart that can show public attention. Through this scatter diagram, the user’s emotional intensity can be expressed intuitively [27]. The color bar indicates the emotional value of the adjustment post, and the higher the color value, the more positive the mood of the post. Through this scatter diagram, the user’s emotional intensity can be expressed intuitively. The horizontal and vertical coordinates indicate the percentage of comments and retweets of the post, respectively. The size of the dot is determined by the weight ratio of the point.
We can see from Fig. 8 that the red and orange colors in the whole chart are more eye-catching. The closer the dot is to 0, the more likes the post has. Although the values near zero in the picture are blue and red, the whole highlight shows a warm tone, which shows that the people of Jilin are more concerned about and agree with the positive posts. Combined with the emotional proportion chart of Jilin, we can see that Jilin netizens show more positive emotions on the Internet.
Figure 9 shows the public’s attention to popular posts in Shanghai. Compared with netizens in Jilin, we can see that the public in Shanghai pays more attention to neutral and negative posts, so the neutral value in the picture is mostly in color. Combined with the proportion chart of emotional polarity in Shanghai, it can be shown that during the whole epidemic period, Shanghai people paid more attention to neutral emotional posts, and this part of the posts expressed more negative emotions.
According to the above research and discussion, we can see that although outbreaks broke out in Shanghai and Jilin at the same time, due to different epidemic trends in the two cities, different epidemic prevention and control measures were taken in the two cities [36], and great differences in the order of magnitude of the number of asymptomatic infections between the two cities, there were obvious differences in the emotions conveyed by people’s Weibo posts in the two cities during the pandemic. On the whole, the overall mood of the Jilin people is more positive than that of the Shanghai people.
RQ3: What is the relationship between public sentiment, epidemic prevention policy, and epidemic trends?
Since January 2020, the Chinese government has formulated various epidemic prevention measures to provide the Chinese public with epidemic prevention and control information and protection during the COVID-19 pandemic. Typical examples of these policies include home officials, social distance requirements, school closures, the workplace, and places of entertainment, and travel restrictions. These policies are effective in reducing the number of COVID-19 infections. However, while we are concerned about the effectiveness of the policy, we also need to pay attention to the changes in public sentiment brought about by the blockade policy [30]. In this part, we mainly discuss the relationship between public sentiment, epidemic prevention policy, and the trends of the epidemic.
In order to address the third important issue in our study, in this section we will discuss the relationship between public emotions, epidemic policies, and epidemic trends from three perspectives.
Epidemic prevention policy and epidemic trend
According to the news information made public in the two cities on the Internet, we recorded some key events in the two cities during this period. Figure 10 shows the timing of the pandemic and the timeline of the pandemic period, which is predicted that it may end in early June 2022.
Timeline of key events during the pandemic.
New daily trend chart of Jilin from March to June.
In the early days of the epidemic, Jilin and Shanghai both adhered to the attitude of “the city will not be closed”. Figures 11 and 12 show the daily diagnosis statistics of Jilin and Shanghai during the pandemic.
According to the public information on the Internet, we learned that there were gathering incidents in Jilin due to lack of attention in the early stage, so there was a large increase in the number of infected people at the initial stage, so Jilin took blockade measures on March 11. Then the increase reached the highest level on March 14. After more than 40 days of hard work for the people of the city, Jilin City achieved a comprehensive social zero in 4.8 (4.14 in Jilin Province). On April 28, Jilin began to unseal gradually, with a lag of 48 days.
Daily trend chart of Shanghai from March to June.
The difference between Shanghai and Jilin is that the number of daily infections in Shanghai was less than 100 before the announcement of “no closure of the city” on March 16. But by late March, the number of infected people began to soar, and the number of infections was almost out of control, so the Shanghai government announced the city closure on April 1st. Half a month after the closure of the city, the increase in Shanghai reached its highest level on April 18 (Point A), many of which were confirmed by asymptomatic infections. On May 18, Shanghai achieved a comprehensive social zero clearance (meaning all new confirmed cases or asymptomatic carriers were found in isolation and control facilities, and there were no more positive infections in non-controlled areas). On June 1, Shanghai lifted the restriction. During the pandemic, the lag period in Shanghai was 61 days. Then the increase reached the highest level on March 14. After more than 40 days of hard work for the people of the city, Jilin City achieved a comprehensive social zero in 4.8 (4.14 in Jilin Province). On April 28, Jilin began to unseal gradually, with a lag of 48 days.
Throughout the entire pandemic period, it is observed that although both cities experienced the discovery of their first local cases of infection at the same time, the trend of the epidemic in the two cities was divergent due to differences in their demographic makeup and geographical location. Jilin Province imposed lockdown measures early on due to early outbreaks of gatherings, while Shanghai, at the forefront of epidemic prevention and control, has consistently implemented precise and effective prevention and control measures while continuously exploring new strategies for epidemic prevention without closing down the city [2].
During the pandemic, the closure policy instituted by the Chinese government served as a common tool for limiting individuals’ daily life and curbing the spread of the disease. As provinces transition from lockdown measures to the gradual restarting of social and economic activities, they are formulating and implementing policies with varying impacts based on local outbreaks.
Combined with Fig. 9, the entire span of the pandemic can be broken down into three stages: pre-blockade, blocking period, and unblocking [26]. Our focus is on the blocking period, where we examine the changes in public sentiment during that time.
First of all, we selected 700 posts from the week prior to the blockade and 700 posts from the week following the blockade from the data of both cities. Using the emotional dictionary for scoring, we get Table 8 and generated Figs 13 and 14. The red lines in the table represent the emotional values and corresponding amounts expressed by the public in their posts on Weibo during the week before the blockade. The green lines represent the change in public mood during the week after the blockade.
Emotional scores corresponding to 700 posts in two cities (Jilin on the left and Shanghai on the right)
Emotional scores corresponding to 700 posts in two cities (Jilin on the left and Shanghai on the right)
Changes of public sentiment before and after Jilin lockdown.
Changes of public sentiment before and after Shanghai lockdown.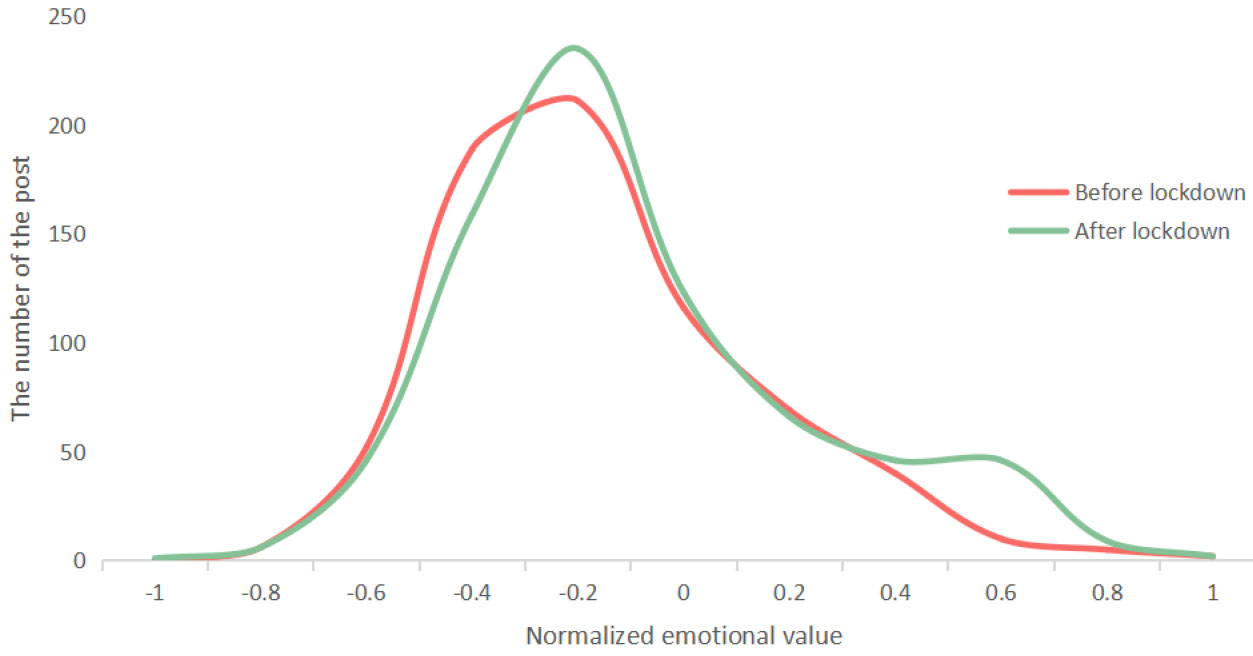
According to Table 8, we can clearly observe that the number of positive posts in Jilin exhibits a declining trend. The quantity of highly positive sentiments (with scores of 0.8 and above) decreased from 48 to 30, while the number of negative posts increased from 192 to 235 after the lockdown. Therefore, Fig. 13 indicates an overall leftward shift in the sentiment distribution in Jilin, implying a more negative sentiment overall. In other words, the public did not feel positive or optimistic about the lockdown policy; instead, negative sentiments prevailed. To identify the reasons behind this disparity, we can combine the timeline in Fig. 10 of the pandemic. Jilin discovered its first case locally on March 1st and implemented the city lockdown on March 11th. However, by March 14th, the number of daily new cases in Jilin reached its peak during the pandemic. Based on this, we can reasonably infer that the reason for this discrepancy is the relatively short interval of 11 days between the discovery of the first case and the city lockdown. For the general public in Jilin, although the lockdown policy seemed to be the quickest and most effective way to contain the virus spread at that time, it fundamentally impacted their daily lives.
Moreover, due to the large number of initial infections during the early stage of the outbreak, the lockdown did not immediately yield significant results, as thousands of new cases were still reported after the implementation. As a result, the overall sentiment of the Jilin public remained negative. From the government’s perspective, the decision to implement the lockdown in Jilin was commendable as it aimed to control the pandemic. Making the most effective decision in the shortest possible time maximizes the preservation of order within the entire city and prevents citizens from falling into panic.
On the contrary, the overall sentiment change among the public in Shanghai is more positive. The number of posts with highly positive sentiments (with scores of 0.8 and above), as presented in Table 8, increased from 17 to 37, while the total number of negative posts decreased from 458 to 435. Therefore, the trend in Fig. 14 shows an overall rightward shift. By combining this with Fig. 10, we can observe that on March 16th, Shanghai announced that it would not implement a city lockdown. Many Weibo users expressed their opinions on the Shanghai outbreak, with a majority of them exhibiting negative sentiments. Consequently, the week before the city lockdown saw a high level of negative sentiment in Weibo posts related to the Shanghai outbreak. However, as Shanghai is China’s largest economic hub, the economic losses resulting from a city lockdown would be immeasurable. Nevertheless, in order to prevent further virus spread, the Shanghai government eventually implemented a city lockdown on April 1st. As a result, within the first week after the lockdown, the sentiments expressed in Weibo posts became relatively more positive compared to the period before the lockdown.
From the above discussion, we can see that the rapid lockdown measures implemented by Jilin have had a significant impact on the daily lives of the public, and the rapid increase in the number of infections has further exacerbated negative emotions. Although the Jilin government decided to implement the lockdown to control the spread of the virus, it is clear that the suddenness of the measure made the public feel caught off guard. In contrast, Shanghai adopted a gradual lockdown approach. We can see that in a situation where the initial situation of the epidemic is similar, adopting a gradual lockdown policy will be more easily accepted by the public, and such a policy is more conducive to epidemic control as well as being more acceptable to the citizens.
We manually marked the data we crawled. We manually marked 6000 pieces of data from Shanghai and Jilin respectively. These data are randomly selected from a complete data set. We divide emotions into six categories: anger, disgust, fear, happiness, hope, sadness, and surprise. Then take 15 days as a time point, and sort out an emotional distribution map of the two cities.
Emotional fluctuations of Jilin people from March to June.
Emotion fluctuations of Shanghai people from March to June.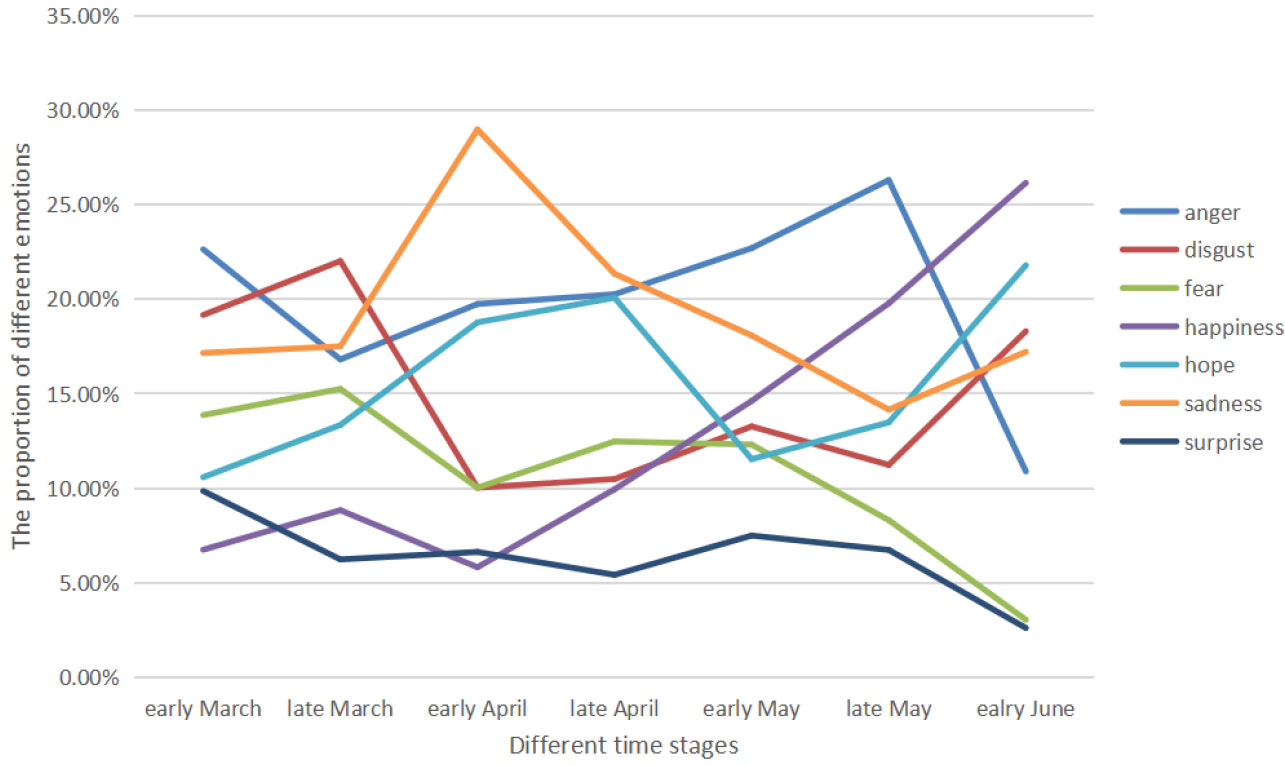
Figure 15 shows the emotional trends expressed in Weibo posts related to the Jilin epidemic between March 1st and June 1st. The different emotions are depicted through different colored lines. In the early part of March, the proportion of positive emotions expressed by the public in Jilin on Weibo was significant, which can be seen from the higher value of hope in the graph. Other negative emotions were present in smaller amounts. Regarding the information presented in Fig. 10, it can be deduced that the reason behind this is the Jilin government’s decision to close the city eleven days after the outbreak. At this point, people had faith in the government’s policies as they were effective in preventing the spread of the virus.
However, from the end of March to the end of April, hope decreased dramatically and other negative emotions, such as disgust, increased. The long-term closure of the city and the impact on daily life likely contributed to the change in public sentiment. Additionally, as the epidemic situation in Shanghai reached its peak, users in other regions expressed concern and their negative sentiment toward the situation increased. The fluctuation of emotions has stabilized since the end of April and a slight increase in negative emotions can be observed after the lifting of the lockdown in Jilin on April 28th. This situation may be due to the growing concerns of the residents of Jilin about their education and employment, after having been confined in their homes for almost two months [35], as shown in correlation with Fig. 6.
Figure 16 shows a picture of mood swings among the people of Shanghai as a whole between March 1 and June 10. We can see very clearly that the mood swings expressed on Weibo posts about the epidemic in Shanghai are relatively large at this stage. One of the most significant is a sharp rise in disgust from late March to early April. According to the epidemic prevention information released by the government, the Shanghai Health and Health Commission issued “Shanghai does not close the city” on March 16. For the public, not closing the city may lead to spillover of the epidemic and cross-infection if no blockade measures are taken, resulting in more cases. In addition, the number of cases in Shanghai reached its first peak on April 15, reaching 3590. At this time, the degree of public panic reached the highest, we can see that the sad mood at this time has a sharp rise in the process. Shanghai is the city with the largest economic lifeline in China, so the epidemic situation in Shanghai has attracted a lot of attention from the whole country. During the period from early May to early June, we can see a significant increase in public positive sentiment, which reached its peak in early June. After two months of closure, Shanghai lifted the blockade on June first and began to resume work. After the release of the seal, the negative mood gradually decreased, the positive mood gradually increased, and the Shanghai public began to pay attention to the issue of resuming work and production.
From the above discussion, we can conclude that public sentiment, epidemic prevention policies, and epidemic trends are inextricably linked. During a pandemic, public sentiment fluctuates not only with the dynamics of the epidemic but also because of different epidemic prevention policies formulated by the government at different points in time of the pandemic. Similarly, the dynamics of the epidemic affect the formulation of epidemic prevention measures, and the targeted epidemic prevention measures formulated by the government according to the real-time status of the epidemic can effectively control the trend of the epidemic. For the public mood and the trend of the epidemic, dynamic changes the epidemic affect the public mood. Although the public mood does not directly affect the trend of the epidemic when the public mood is extremely negative, it will affect the implementation of epidemic prevention measures to a certain extent, thus leading to the deterioration of the epidemic situation. So public sentiment indirectly affects the trend of the epidemic to some extent. Therefore, public sentiment, epidemic prevention policy, and epidemic trends are interrelated, restrict and influence each other.
Due to health and economic reasons, the COVID-19 pandemic is still a topic of widespread concern around the world. In this study, we discuss the three questions in turn. Text data from Weibo was analyzed to understand the problems that could be reflected based on user-provided text content during the pandemic. From the distribution of Weibo posts, the proportion of each topic is significantly different. From the results of the emotional analysis, with time, citizens of the two cities show different emotional attitudes at different stages. Users are most concerned about the dynamics of the epidemic and health issues in the process from seeking information to anger or other expressions of emotion. Then by studying the impact of the blockade policy on public mood, we find that the timing of the implementation of the blockade policy is very important.
There are still many shortcomings in our article, and there is still room for further improvement. Especially in the aspects of comparative research and quantitative statistics related to data. In addition, our survey found that pandemic-related factors are not only public sentiment and epidemic policy, but also non-man-made factors, such as geographical environment, population distribution, and public environment. We will include these potential influencing factors in future research and adopt stricter science to further examine the methods and approaches of our research hypotheses. Through more accurate comparative analysis, we can get some suggestions and opinions which are helpful to the study of sudden public health events.
Footnotes
Acknowledgments
The authors would like to thank the referee for his valuable comments. This work was supported by the National Natural Science Foundations of China (Grant no. 12171065 and 11671001).