
Abstract
While increasingly complex algorithms are being developed for graph classification in highly-structured domains, such as image processing and climate forecasting, they often lead to over-fitting and inefficiency when applied to human interaction networks where the confluence of cooperation, conflict, and evolutionary pressures produces chaotic environments. We propose a graph transformation approach for efficient classification in chaotic human systems that is based on game theoretic, network theoretic, and chaos theoretic principles. Graph structural properties are compiled into time-series that are then transposed into the frequency domain to offer a dynamic view of the system for classification. We propose a set of benchmark data sets and show through experiments that the approach is efficient and appropriate for many dynamic networks in which agents both compete and cooperate, such as social media networks, stock markets, political campaigns, legislation, and geopolitical events.
Introduction
Human systems, consisting of agents and their interactions, tend to evolve chaotically due to natural selection, the blend of cooperation and conflict that such natural selection induces over time, and the maximal adaptability due to self-organization [52, 53]. The field of game theory has expanded considerable efforts in attempting to quantify solutions for human interactions. Solution concepts have been formulated for special types of interactions, such as pure cooperation [65] and pure conflict (also known as zero-sum games) [76]. However, for the general case, namely a mix of conflict and cooperation, there is no universal notion of optimal decision-making.
Unsurprisingly, most human interactions are mixed-motive, as well as non-reductionist, so that it is not possible to partition them into their structured and randomized subsets, solve each subset separately, and combine the results. Hence, understanding the dynamics of human (highly-connected) systems requires the synthesis of elements of network theory (network structure), game or interaction theory (strategic behavior), and non-linear system dynamics or chaos (feedback effects) [17]. We seek to improve the accuracy of classification in human systems by synthesizing solution concepts from these various theories.
In general, the system’s state cannot be adequately represented by a vector of measurements, nor indeed even estimates, of the properties of its constituent parts, as is typically done in most time-series analysis, whether it be the inputs to estimating auto-regressive embedding dimensions [73, 55, 71, 62] or the inputs to echo state architectures [30]. Hence, learning labels for the constituent parts of a system, as in node or link classification, is fundamentally different from learning labels for the system as a whole, as in graph classification.
As such, our proposed approach is to transform a graph time-series classification task into a standard graph classification task by encoding the time-series nature of a number of relevant graph structural properties through fast Fourier transforms. We then use a random forest algorithm to predict the label of each graph through time.
The rest of the paper is organized as follows. Section 2 gives a review of some of the most relevant related work. Section 3 describes our novel approach to graph classification in chaotic human systems. A number of experiments that demonstrate the validity and efficiency of the approach, as well as comparisons with competing methods inspired by state-of-the-art deep learning architectures, are described in Section 4, together with novel benchmark data sets. Finally, Section 5 concludes the paper.
Related work
Our focus is on classification tasks for complex, dynamic, chaotic, human systems. Lines of inquiry in classification learning have generally been restricted to one or two of these system characteristics. We review the most relevant ones here.
Many machine learning and statistical tasks usually are performed in domains with complex, yet highly structured data; thus, a stable data distribution can be assumed. Such is not the case for dynamic systems, where data shift, rather than stability, is the norm. The shift can be a product of an intractably complex system or due to the forecasts themselves in the case of interactive systems. Work has been done in the area of complex adaptive systems, where an explanatory model of the system rather than a black-box prediction are preferred. [18, 1], as well as in reinforcement learning and no-regret learning, especially in the context of autonomous robots where dynamic learning and predictions are needed [20].
Deep learning (DL) has recently allowed major advances in highly complex, yet rather structured and non-chaotic, human domains, such as natural language processing and image classification tasks. The key to moving from the early multi-layer perceptron to the modern state-of-the-art deep learning architectures is the back-propagation of error method [61, 42, 9], which allows for a priori knowledge to be built into the network architecture [41], especially in the form of convolutional layers [36] that essentially act as feature detectors [27, 40]. Further improvements have been made possible, especially in the context of natural language processing, through attention [75] and recurrence [28] mechanisms. Most recently, deep learning has been extended to graphs in the emergent field of graph neural networks (GNNs) [64]. Since all permutations of the orderings of nodes and edges produce isomorphic graphs, tabular representations of graphs for consumption by standard machine learning techniques have proven largely unsatisfactory. GNNs relax the notion of isomorphism in favor of smoother metrics associated with graph structure that can become data points for a standard vector representation [35]. The idea is to use convolution and pooling to extract these permutation-invariant properties [8, 79, 81, 43, 48, 80, 78], where convolution creates embeddings for each node through embeddings of their neighbors, and pooling essentially extracts information from subgraphs. Significant challenges faced by GNNs in their use for human systems include pooling assumptions aligned with unsigned graphs [16], loss of spectral properties for directed and signed graphs [8, 34], weights and signs combination for propagation pooling operators [15], staleness [59], and difficulties with dynamic graphs [8].
DL work is being extended to chaotic physical systems and some human systems. This field is rapidly growing as graphs are now taken as inputs to novel formulations of DL components (and sometimes the components being formulated as nodes of a graph to be learned [21]). We review a few here that represent the general direction taken, which involves composing recurrence and GNN architectures. Work on pollution often combines graph- and recurrence-based neural networks in order to capture both the spatial and temporal nature of the spread of PM2.5 (Particular matter with diameter less than 2.5
Reservoir computing (RC), on the other hand, has been successful at addressing chaotic, but less human-like tasks. Early efforts to predict a chaotic signal estimate the hidden state through a delayed embedding [73, 60]. This approach converts a temporal problem into a spatial one, but also introduces an artificial time horizon, an awkward representation of time, and many parameters [66]. Recurrent neural networks (RNNs) were introduced in conjunction with back-propagation [61], with an elegant theoretical justification as an Euler approximation of time-dependent ordinary differential equations [32]. However, it has been shown that RNNs cannot perform over an arbitrary time period due to the vanishing gradient problem, are not robust to noise, and lack efficiency [3]. The echo state networks (ESNs) and liquid state machines (LSMs) were introduced as a way to employ recurrence like RNNs and to convert the temporal problem to a spatial one, as Takens had done [73], but in a way similar to kernel methods and support vector machines [7]. The idea is that reservoirs of randomly connected networks can act as “a complex nonlinear dynamic filter that transforms the input signals using a high-dimensional temporal map” [66], giving rise to the notion of reservoir computing. The property that has enabled RC to be successful with short-term predictions of chaotic systems is the echo property [29], which informally states “that the current state of the network is uniquely determined by the network input up to now, and, in the limit, not by the initial state. The network is thus state forgetting.” [66] A significant difference between RC and DL is that DL is built on error backpropagation, while RC is built on a feed-forward architecture. In DL, weights are adjusted iteratively according to how a prediction matches the true label; in RC, the inputs change the activation node values, while the weights are held steady. DL learns until it converges to a steady state; RC never enters a steady state. DL is effective for tasks in which the true hypothesis is relatively fixed; RC is best suited for tasks whose true hypothesis changes chaotically. RC provides a clever improvement on the computationally expensive BP process with respect to temporal prediction tasks. The RC approach allows the network to be flexible, yet employ “massive short-term memory” [30] to estimate a nuanced model of recent samples, while forgetting such nuances from samples of the distant past. One underlying issue with RC is that it is dependent on hyper-parameters that are not tuned during training. Current lines of research focus on tuning these hyper-parameters efficiently [32]. Another weakness of RC is its black-box nature, which limits its ability to predict a complex system without attempting to model its underlying structure.
Early violence detection (EVD), in the field of political science, focuses on dynamic human prediction tasks, but scopes such tasks to make traditional statistical methods of analysis suitable. The white-box nature of EVD allows the direct comparison of a proposed model with political theory. The main approach is to identify a few critical factors associated with geopolitical instability and make predictions with logistic regression and Bayesian methods [67], or other machine learning methods [69]. The approach favors smaller data sets of aggregated data over large data sets of repurposed data. Interestingly, this research has identified network-theoretic power structures as most relevant to conflict [23, 74], and has demonstrated outstanding effectiveness, such as 80% accuracy for two-year forecasts. EVD brings two critical insights to graph classification for human systems. First, good data on the power structures of the systems is the most relevant for global predictions [67]. Second, the dynamics of systems composed of larger organizations tend to change more slowly and more predictably than systems of individuals [68]. Hence, to analyze a highly-dynamic, decentralized system which does not exhibit explicit power structures, one may want to 1) identify the implicit power structures and 2) make such an identification efficient computationally in order to keep apace with changes. Our method seeks to do precisely that.
Graph classification in chaotic systems
We seek to bring together the solution concepts for dynamic systems, and cooperative and competitive interactions to improve prediction in the mixed-motive environment. Although the latter two concepts only offer partial solutions to the mixed-motive game, they provide the insight needed to attempt to go beyond simply modeling some low-dimensional input-output signal (as in the Reservoir Computing case) to modeling the internal workings of the system. Essentially, we convert the problem from a purely temporal one to a spatial one, thus combining the various solution concepts in a way that captures the chaotic dynamics ensuing from the mixed-motive interactions, as follows.
Convert event data into dynamic graphs, which are higher-order representations of cooperation and conflict. Transform dynamic graph measures to the frequency domain, which is a higher-order representation of the evolution of cooperation and conflict. Embed the frequency domain distributions into a suitable space for classification.
In step 2, graph data (cooperation) is transformed to the frequency domain (conflict) so as to estimate properties of the chaotic attractor (dynamic systems). In step 3, the resulting feature vector includes static data about the graphs (cooperation) and dynamic data that captures the frequency domain distributions (conflict) of the graph data. We neither claim that these are the only solution concepts for cooperation and conflict, nor that this is the optimal way to combine them. We will show, however, that it improves prediction over other approaches in a number of real-world applications.
Graphs are the most natural abstraction for the representation of interactions among agents. The structure of the graph is a product of the cooperation and conflict within the system it models, and that structure evolves as the balance of cooperation and conflict changes through time.
We focus on tasks whose corresponding graphs are derived from event data. An event is defined as a quadruple
The feature set
of graph structural properties
The feature set
We note that three of the features in
In a mixed-motive environment, the elements of cooperation and conflict induce structure and randomness, respectively. For human systems, the additional element of evolutionary pressure induces chaos, resulting in a chaotic trajectory of the system [58].
We require some way to synthesize the notions of cooperation, conflict, and chaos by estimating the level of chaos in the trajectory’s attractor. Just as the graph is a higher-order representation of human interaction, the frequency domain becomes a higher-order representation of how the balance of cooperation and conflict fluctuates dynamically. The frequency domain captures global properties of a dynamic system, one of which is the structure of its trajectory. We therefore propose to capture the trajectory of the structural properties introduced above by converting them to the frequency domain through a Fast Fourier Transform (FFT).
We can then estimate the degree to which the resulting distribution is uniform in order to gauge randomness, or the degree to which it fits a distribution that would represent a structured trajectory. To illustrate the value of this approach, consider Fig. 1, which depicts three different time series and their corresponding FFTs. In addition to the FFTs, the graph shows uniform (flat, dark gray) and gamma (light gray) distribution fits. The first distribution (1a) exhibits high structure, monotonically decreasing at a constant rate. Its FFT (1d), has pronounced amplitudes in two narrow frequency ranges, and as expected does not fit either uniform nor gamma distributions very well. The second distribution (1b) is random, with no underlying structure. Its FFT (1e) exhibits similar randomness, and as such fits an uniform distribution. Finally, the third distribution (1c) represents the Dow Jones daily closing levels over a period of 100 days. It exhibits chaotic behavior (i.e., both some structure and some randomness), and its FFT (1f) shows a range of pronounced amplitudes at the higher frequencies, as well as good fit to a gamma distribution, as expected for such a chaotic trajectory.
Different time-series and their corresponding FFTs.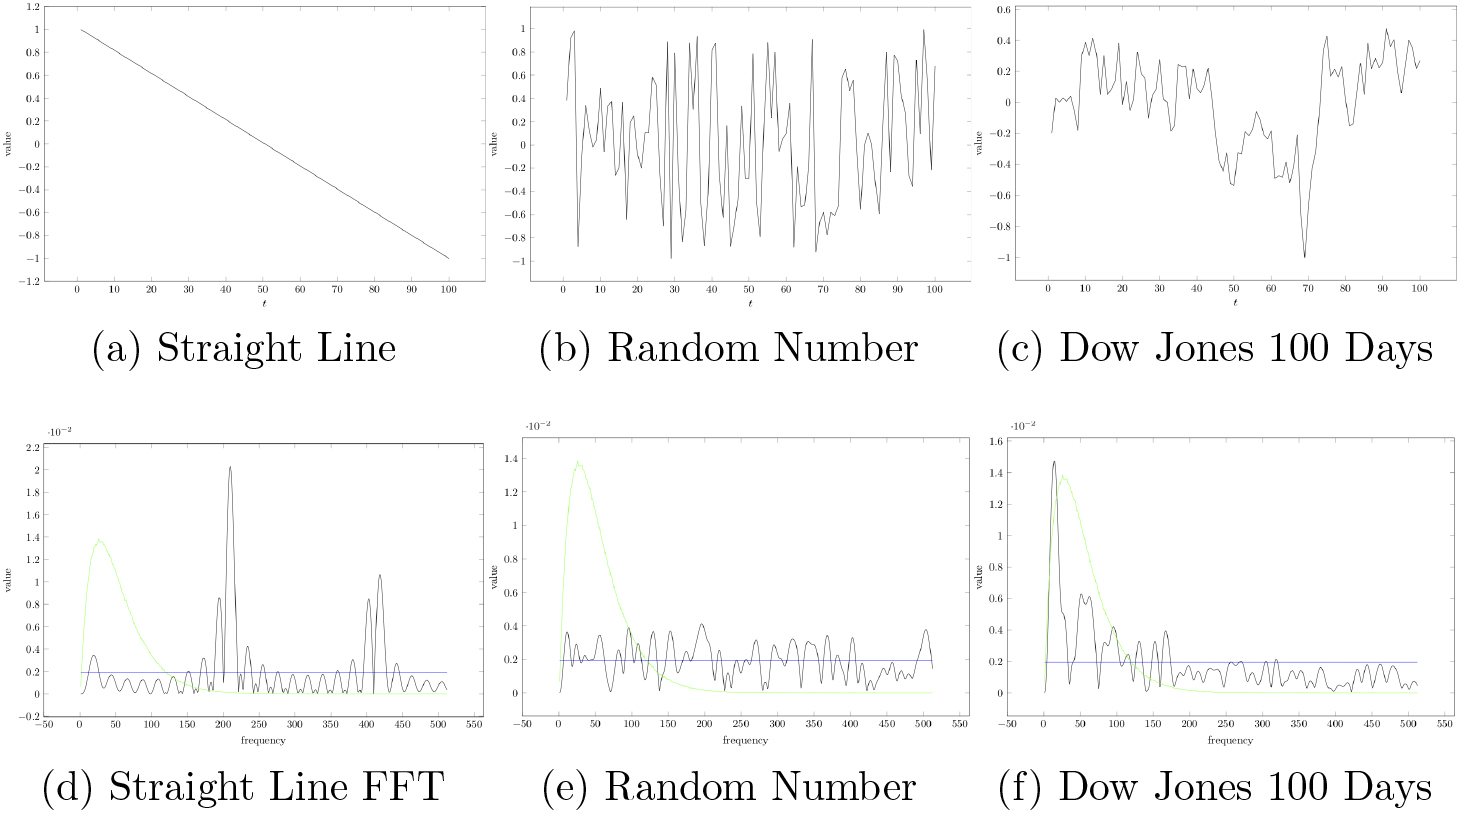
We denote by
We now transform our graph time-series into tabular form by transforming each graph
: GT-CHES Algorithm[1] Extract the values of the properties in
As in all classification tasks, each graph
Note that the proposed transformation allows our applications to still benefit from being framed as graph classification problems, as opposed to just using a feature vector of other related data to classify, or make prediction, at each time step. The graph transformation step allows us to leverage network structure and interaction. Indeed, the feature vector does not consist of aggregated data (e.g., total attacks, number of attacks, etc.) but of graph centrality measures that represent levels of organization and randomness, which are hard to measure with aggregated (non-graph) data.
Experiments
We encountered challenges to assessing the value of GT-CHES and comparing its results against those of others. There are very few models that have been designed specifically for the kinds of problems we address. Two fundamental implications follow from this. First, there is a lack of benchmark data sets, where the domain consists of events in a mixed-motive, evolutionary environment, and the data is sufficiently heterogeneous (i.e., directed, weighted, signed, temporal edges). Second, there are a lack of frameworks for making comparisons if suitable data were obtained for graph classification.
We begin with data sets that may be used as proof-of-concept in the sense that they include mixed-motive event-based data as input, but we have to formulate the labels since no graph labels exist for such data sets. Since these are limited, we also design benchmark data sets, which can henceforth be used by others.
Proof-of-concept data sets
We consider two cryptocurrency networks, namely the Bitcoin Alpha (BCA) and the Bitcoin OTC (BCO) data sets [39, 38]. No governing figure regulates the cryptocurrency, so users self-regulate potential fraudulent or risky behavior by rating each other in terms of trustworthiness. This is crucial in the Bitcoin community since the appeal of the currency is the decentralized nature of transaction management. In this context, the generic game theoretic terms “cooperation” and “conflict” are embodied as trust and distrust, respectively, for Bitcoin users. A user may rate another user only once, and the rating carries through time. Hence, the graph at time
Eurovision is one of the longest-running international songwriting competitions, organized annually since 1956. Each participating country (mainly European) submits an original song that is performed on live television and radio, with competing countries casting votes for the other countries’ songs to determine a winner. Outcomes and statistics from annual contests are collected on the Eurovision’s official web site (eurovision.tv). However, they are difficult to exploit directly. Borsteinn Adalsteinsson has scraped and cleaned the data using an R script, and made it publicly available for download and analysis from his web site (https://data.world/rhubarbarosa/eurovisionvotingstats). Voting values range from 1 to 12, and are based on a complicated voting scheme of jury and televoting. The points are normalized to the range
Benchmark data sets
In order to better assess GT-CHES and compare it against other relevant approaches, we design novel benchmark data sets. We anticipate that these will be useful beyond our own work and make a valuable contribution to research in graph classification in human, chaotic systems.
The problem of designing an acceptable benchmark reduces to assembling a corpus of data sets consisting of graph-label pairings in which:
A graph represents a human system, where the nodes represent a human organization, and the edges represent relationships. The graph set is temporal, signed, weighted, and directed. At a minimum, the graph needs to be temporal, but can be signed or weighted. The label set consists of a labeling for each graph that specifies a property of the system it represents.
Unfortunately, at least one of these elements is missing from extant data sets. The context of the Enron e-mail data set [33], for example, is an evolutionary environment, but the problem formulation is generally link prediction or community detection, rather than graph classification. Similarly, dynamic graph classification, while covering fields such as traffic and weather prediction, is not directly tied to human evolutionary systems. The burgeoning field of social media does cover human systems, but has principally dealt with community detection, or node and link prediction, though recently work has been done on conflict prediction on the web [37]. To circumvent this challenge, we take two complementary approaches, as described below.
Here, we draw graph data and label sets from different sources that have been used as inputs and targets, respectively, though in different studies. The pairing of graphs drawn from event data in source
We draw event data from the Integrated Crises Early Warning System Project (ICEWS) [6], where events have been extracted automatically from English-language news reports, and consist of interactions between socio-political actors for various regions of the world at various times. Events can thus be represented by a quadruple
Graph labels are then drawn from the following sources: Domestic Political Crisis (DPC) [47], Insurgency (INS) [47], International Crisis (IC) [47], Rebellion (REB) [47], Ethnic/Religious Violence (ERV) [47], Irregular Leadership Change (ILC) [2], and State-Based conflict (SB) [49]. The labels come in the form of quadruples year,month,country,class and can thus be naturally joined on month and country with our graphs. The label class is a binary value, defined by an in-country political opposition to government not amounting to an insurgency or a rebellion (DPC); a coordinated effort to overthrow a government (INS); escalating tensions between states/significant deployment of armed forces by one state in another’s territory (IC); seeking independence from a government with ongoing organized, violent actions against it (REB); violence between ethnic or religious groups that is not necessarily related to a government (ERV); unexpected leadership changes in contravention of a state’s established laws and conventions (ILC); and whether the government was at war with any group within or outside the country (SB).
Drawing graphs from recognized sources and creating labels
Here, we draw graph data from known network data sets and create custom labels for each graph. The graphs are the same as those generated in Section 4.2.1 from ICEWS. However, we also use the Computational Events Data System (CEDS) [70] event data sets, which is formatted like ICEWS. While the graph creation process is not novel, the labeling process is, as these graphs represent human evolutionary systems, but there are no labels associated with the graphs.
We then create custom labels for each graph as follows. We focus our attention on levels of violence. Recall that the magnitude of events ranges in
While the graphs contain all values, we restrict our attention to violent events in the
For the purposes of computing the set
Experiment data sets
Experiment data sets
To evaluate GT-CHES, we run a number of experiments involving our Proof-of-Concept data sets and our benchmark data sets, against a number of baseline algorithms as well as graph neural networks and state-of-the-art solutions.
Comparison against baselines
To validate our GT-CHES method, we test it against baselines for dynamic systems. These baselines may seem trivial for current machine learning and statistical tasks. However, as mentioned before, many machine learning and statistical tasks assume a stable data distribution, while dynamic tasks assume a shifting data distribution. We use a majority classifier, a naïve classifier, and a no-regret classifier as baselines. The majority classifier predicts the most common label. The naïve classifier predicts at time
The results on the Proof-of-Concept data sets are shown in Table 3. GT-CHES outperforms all three baselines on all three data sets. We note that the Eurovision data set is smaller and highly imbalanced, which explains the good performance of the majority classifier. While the difference is not statistically significant in that case, GT-CHES still achieves higher accuracy.
Comparative Accuracy on Proof-of-Concept Data Sets. The asterisk denotes statistical significance for a one-sided
-test at the 0.01 level
Comparative Accuracy on Proof-of-Concept Data Sets. The asterisk denotes statistical significance for a one-sided
The results on 152 data sets from ICEWS with Custom labeling are summarized in Table 4. Improvement is the percent improvement in accuracy of GT-CHES over the corresponding baseline averaged across all 152 data sets. Win, Loss and Tie refer to the number of data sets on which the accuracy of GT-CHES is higher than, lower than, or tied with, the accuracy of the corresponding baseline. Again, GT-CHES does generally exceed the baselines.
Comparative Performance of GT-CHES on ICEWS Benchmark Data Sets. Numbers in parentheses refer to the number of data sets for which the difference is statistically significant for a one-sided
Interestingly, Fig. 2 also shows that as the level of chaos increases across the 152 ICEWS data sets, as measured by the Hurst Exponent for the associated levels of violence (smaller values indicate greater levels of chaos), the accuracy of GT-CHES generally tends to increase.
Relationship between accuracy and level of chaos.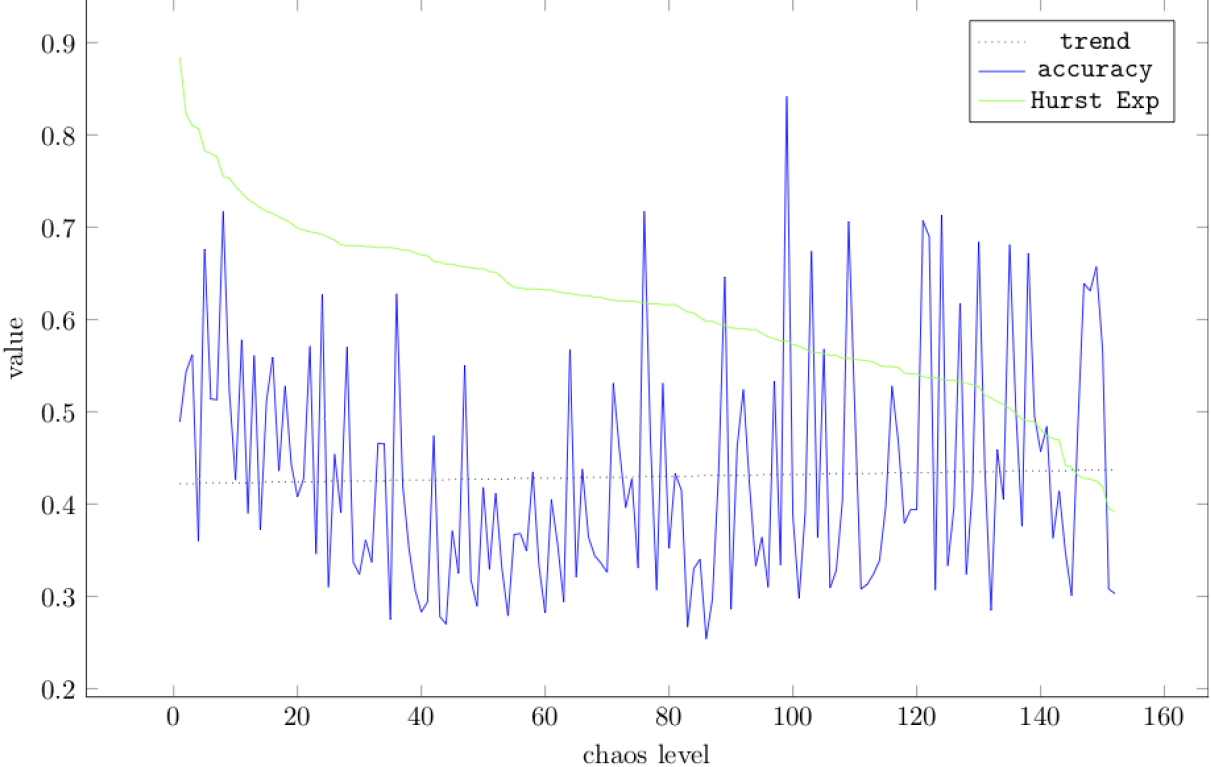
To further validate GT-CHES, we compare it against recent methods that have been designed for the explicit handling of graphs, namely (deep) graph neural networks. The two architectures we consider are the Signed Graph Convolutional Network (SigGCN) [16] and a customized architecture we designed, specifically aimed at fusing graph extraction and time-series analysis. The latter formulation incorporates a deep learning (DL) graph method into a DL recurrence method. Instead of a standard input at each time step, the output of the graph DL method becomes the input to the DL recurrence model. The models are fused in that the errors are back-propagated through the DL recurrence methods back to the DL graph methods, and there is one loss function for the entire architecture. The combined model is an LMU-SigGCN model where an LMUFFT [13] takes the estimates of an FFT over a series of SigGCN outputs as the inputs to its classification block.
Comparative accuracy of GT-CHES and deep graph neural networks on CEDS data sets
Comparative accuracy of GT-CHES and deep graph neural networks on CEDS data sets
It is clear from these results that GT-CHES significantly outperforms existing, and suitably extended, graph-based classification approaches on the selected CEDS data sets. The performance of the LMU-SigGCN is particularly interesting for comparison, because it is so similar to the intuition behind GT-CHES, but it employs back-propagation rather than making a priori game- and network-theoretic assumptions. Furthermore, as it does not rely on error back-propagation, GT-CHES is also significantly faster in terms of training time (results not included).
Finally, we compare GT-CHES to state-of-the-art results from the EVD community in the context of our benchmarks. We consider two distinct frameworks.
The Political Violence Early-Warning System [26] (ViEWS) created a standardized process for training and testing data for various labeling tasks. In addition, the ViEWS team continually develops and publishes their own models and results. The study we reference here involves predicting state-based violence (SB) for 54 countries in Africa over a period of 36 months. The data is partitioned into training, calibration, and prediction/forecast sets. The training set consists of the country-month data from January 1990 to December 2011. Calibration data from January 2012 through December 2014 may be used to tune parameters, when applicable. The final model is trained on the combined training and calibration periods and used to predict labels for each of the 54 countries from January 2015 through December 2017. One peculiarity of this study is that instead of just predicting one month into the future, we are to make predictions for 36 months in a one-step ahead fashion, so that at time
Comparative average accuracy of GT-CHES and ViEWS on 54 countries
Comparative average accuracy of GT-CHES and ViEWS on 54 countries
The results show that GT-CHES compares very favorably with ViEWS. It is interesting that ViEWS considers AUPR the most important metric. On that basis, GT-CHES is not significantly different from ViEWS.
The Disruptive Events Prediction [56] (DEP) also utilizes training and testing sets over a similar time span, namely March 2001 through December 2011, and January 2012 through March 2014, respectively. However, there is no one-step ahead prediction. Once the training and test data sets are partitioned to exclude any leakage, they are just treated as ordinary training and test sets, where graph data at time
Comparative average accuracy of GT-CHES and DEP
The results show that GT-CHES performs slightly better than the SVM model. It does not beat the GRU nor Random Forest model. However, when we add the 6 WGI features, which are estimations by experts of the level of democracy and corruption, GT-CHES’ performance becomes comparable. We do note that using a country-by-country approach, as in the ViEWS study, would likely be greatly advantageous. Given the importance that geography plays on societal networks, especially in Africa, and the diversity of the geography of the continent [31], we would expect networks to behave differently among the countries.
While GT-CHES does not outperform all methods, it is never the worst either. This is interesting considering the differences in the quality of input data among methods. ViEWS and DEP use macro-structural metrics as inputs, while GT-CHES takes repurposed event-based data. The macro-structural measures have proven to be rather reliable predictors of violence [23, 74], and have so far been superior to event-based data under the current paradigms of violence prediction [67]. This may be explained in part by the repurposed nature of event-based data having possibly lower quality (though higher quantity) than the curated nature of WDI and WGI data. Furthermore, we are very much at the experimental level of formulating graphs properly using event data, as well as identifying structural qualities that are generally good predictors of political violence. GT-CHES is certainly a positive and encouraging step in that direction.
We have introduced GT-CHES, an approach for graph classification in the context of human evolutionary systems, based on principles from game theory and chaos theory. We capture explicit structural properties of the graphs at each time step and transform the corresponding time series into the frequency domain. The resulting sets of features are then used by a random forest algorithm to build a predictive model. Results on a number of simple data sets show that GT-CHES matches or exceeds baseline approaches such as a majority learner and a naive classifier. Furthermore, accuracy tends to be increasing as the level of chaos in the system increases. We also compared GT-CHES with deep graph neural networks and showed that GT-CHES outperforms these approaches. This is particularly interesting in the context of very recent findings about the relationships between Fourier analysis and deep learning [72].
Given the relative recency of work in evolutionary graph classification, we designed two real-world benchmark data sets based on well-known geo-political data. These benchmarks are available to the broader community. We showed that GT-CHES performs comparatively to the best published results in political science with approaches based on extensive crafting of predictive features and tuning of models. We expect that tuning of GT-CHES will lead to further improvements. It is also possible that GT-CHES should be viewed as orthogonal to the current macro-structural data approaches. Hence, when used in combination with the current approaches, for example in an ensemble, it may effectively boost performance.
Footnotes
Acknowledgments
We wish to thank Brad Hatch for insightful discussions and help in implementing the GNN models used in our experiments.
Conflict of interest
C. Giraud-Carrier is an Editorial Board Member of this journal, but was not involved in the peer-review process nor had access to any information regarding its peer-review.