
Abstract
Social relationships among students at campus are closely related to their mental health and academic performance. Therefore, it is a very important task for educators to analyze students’ social relationships. However, existing studies have focused on one-to-one social relationships between students, few ones have explored the high-order community relationships hidden in social networks, especially in a visual manner. To solve this problem, a visual analysis system called ViSSR is proposed in this paper, which utilizes the Louvain algorithm to detect the hierarchical community structure of students’ social network at campus, and then provides four coordinated views to visualize the detection results. Among the views, the hierarchical hypergraph view is to visualize the hierarchical community structure that greatly breaks through the limitations of first-order relationships available in a traditional node-link social network, the community analysis view and individual analysis view show the social characteristics of a community and individual student respectively, and the matrix view displays the behavioral features of students. Case studies and experts evaluation have been conducted to demonstrate the usability of the system.
Introduction
Relevant researches in education field have shown that students’ social relations are closely related to their mental health, academic performance, as well as problems such as campus bullying. For example, Mason et al. concluded that the mental health problems of students can be effectively addressed by intervening in their social networks [18]. Zhang et al. suggested that only moderate active social interaction and popularity are positively correlated with the mental health of college students [32]. Mishra et al. found that the social support from family members and friends plays an important role in the academic performance of students [30]. Coelho et al. found that all students who were involved in campus bullying incidents, including both the bullies and the victims have obvious social withdrawal, especially those who were bullied [34]. Therefore, it becomes a very hot topic in educational data mining to conduct social network analysis, which aims to understand the status of students’ social relationships, explore the formation reasons, and make suggestions for improvement [6, 31].
With the widespread use of information technology at campus, various types of behavioral data generated by students are recorded and stored, such as dining behavior, shopping behavior, building entry behavior and so on. Given that two students often have similar trajectories of activities when they have a close social relationship, so many researchers try to construct social networks by calculating the social intensity among students based on their spatiotemporal behavioral data. For example, some researches have established trajectory encounter models based on students’ consumption data at campus to build social networks, and then analyzed these students’ social relationships [23, 19, 33]. As can be seen, these studies can provide valuable information for educators, such as one-to-one social relations between students, social situation of a individual student, and so on. However, in fact, social interactions among students are usually distributed throughout a group, also called a team or community in which students support or influence each other. Such interactions form a high-order community social relationships that goes far beyond a one-to-one first-order interaction. Therefore, educators are more concerned about students’ high-order community social relations that are rarely studied, including that how many groups there are in a network, the social characteristics of each group, how different small groups integrate into a larger one, and so on. In addition, existing researches usually use complex statistical knowledge to analyze social relations, which makes it very difficult for education staff without such knowledge to carry out in-depth analysis.
To address the issues mentioned above, an interactive visual analysis system called ViSSR is proposed in this paper to aid education staff in performing the analysis of high-order community relationships intuitively. The system construct a social network of students based on their spatiotemporal behavioral data at campus, discover the hierarchical community structure of the constructed social network via Louvain algorithm, and then visualize the discovering results using four coordinated interactive views. The main contributions of this paper are as follows:
An interactive visual analytics method called ViSSR is proposed to help educators to explore the high-order community social relationships among students intuitively. A hierarchical hypergraph view is designed to show the hierarchical community structure hidden in the social network, by which educators can clearly understand the hierarchical integration process of different communities. A matrix view is proposed to assist educators to quantitatively understand the behavioral features of students and explore the correlation between behavioral features and academic performance.
The paper is organized as follows. Section 1 is the introduction. Section 2 describes the related works. Section 3 introduces that how to protect students’ privacy and describes the data set used in the paper. Section 4 presents the analytical tasks. The methodological framework is given in Section 5, and how to mine the social relationships and visualize the mining results are presented in Sections 6 and 7 respectively. Sections 8 and 9 discuss the case analysis and expert evaluation. Section 10 states the limitations of the visual system. Finally, Section 11 concludes the paper and suggests further improvements.
This section reviews the general and student-specific methods to social relationship analysis from three aspects: how to infer social relationship based on behavior data, how to discover communities within a social network, and how to visualize social relationships.
Infer social relationship
With the widespread use of equipments having spatiotemporal positioning functionality in people’s daily lives, spatiotemporal data have become the main data source for inferring people’s social relationships. It is generally assumed that two people have a close social association if they often appear at the same place at the same time, also called spatiotemporal co-occurrence. Crandall et al. verified the assumption by a probabilistic model [8], and many researchers have proposed models to infer social intensity based on spatiotemporal data. For example, Pham et al. proposed an entropy-based model (EBM), which extracts the four features of spatial diversity, temporal diversity, duration, and frequency from the spatiotemporal co-occurrence data of two people, and then uses a linear regression algorithm to calculate their social connection strength [11]. Also, Njoo et al. and Cranshaw et al. have distinguished between friends and strangers in similar ways as EBM [10, 12]. In addition, Zhou et al. have measured social relationships based on the themes of co-occurrence activity [24]. Zhao et al. have developed a probabilistic generative model for inferring social intensity among peoples based on their lifestyle patterns [37].
For students, there are generally two categories of social relationships: collaborative relationships in a virtual learning environment and interactive relationships in a real campus environment. Among them, the former relationship has been widely analyzed to find the optimal partners for students to improve their academic performance [3, 42, 4, 28] with the popularization of massive open online course (MOOC) platforms. And the latter one is more important in traditional face-to-face schools because it is not only related to academic performance, but also directly affects students’ physical and mental health. To understand this type of social relationships, now there are also some related studies. For example, Ebadi et al. proposed a mobility pattern model of students on campus [23], on the basis that students with similar patterns have a certain social relationship. Lu et al. created a distributed file system to store, preprocess, compute the trajectory data generated by students at campus, and then designed an encounter model using association rules to mine students’ offline social relationships [19]. Liu et al. developed an unsupervised statistical verification model to determine whether students have social connections on campus [33]. And Desai et al. introduced the concept of temporal diversity to calculate students’ social intensity, which effectively compensates for the spatiotemporal limitations of campus behavioral data [7].
These studies have given us great insight into that how to infer students’ social relationships using behavioral features of co-occurrence. The more types of behavioral data there are, the more accurate the analysis of social relationships will be. So multiple types of behavioral data generated at campus are collected in this paper to infer social intensity.
Explore community social relationship
To facilitate analysis tasks of a social network, especially for a complex social network, it is usually necessary to divide the entire network into several smaller subnetworks, this process is called community detection. The nodes within a subnetwork are connected densely, while the nodes belonging to different subnetworks have sparse connections. Among various community detection algorithms, the Louvain algorithm that based on dynamic modularity optimization can recursively and quickly uncover a hierarchical community structure in networks [35]. Due to its superior performance [43, 1, 13, 25] in terms of calculation time, modularity, accuracy, and recall, the Louvain algorithm has been widely applied in various applications, such as choice of opinion leader [15], and information recommendation [36].
It can be seen that community detection can provide great help for educators to deeply analyze students’ social relations. Although some studies have raised the concept of student communities, for example, Liu et al. uncovered a small-world phenomenon and an obvious community structure in students’ social networks [33], community detection is rarely used in the analysis of students’ social relations, especially hierarchical community structure.
Visualize social relationship
Data visualization can leverage people’s cognitive ability to effectively mine hidden patterns from complex data. Researchers have proposed a range of visualization methods to intuitively understand the community structure. For example, Linhares et al. proposed a statistical visualization method to display the community structure to facilitate users in observing the distribution of nodes in the region of interest [5]. Crampes et al. used visualization techniques to demonstrate community division, cross-coverage, and potential allocation contradictions [17]. Huang et al. described a method for visualizing large-scale hierarchical structured graphs, which can effectively reduce the complexity of the graphs [38]. Abdelsadek et al. proposed a visualization approach for social media analysis, which used a community detection algorithm called Tribase to identify communities, and designed a visualization tool to provide gradual knowledge acquisition [41]. These general methods have greatly advanced social network analysis, however, it may be inefficient to apply these methods to analyze students’ social relationships due to the specific application requirements of student management. So it is necessary to design student-specific methods to visualize students’ social relationships.
Data visualization has also been used in many applications in the education field, for example, some studies have conducted visual analysis of learning behavior of students to improve academic performance [26, 27, 29, 22]. Liu et al. visualized the consumption behavior of students on campus to provide financial aid to poor students [16]. However, there are few studies that focus on the visualization of students’ social relationships, especially on visualizing high-order community relationships.
Data set
In this paper, we invited 29 freshman students in a class of a university as volunteers, and collected their behavioral data produced at campus and demographic data for analyzing their social relationships.
Privacy protection
To protect students’ privacy, this study has been approved by the student management department and information management department of the university participating in the experiment, and it strictly complies with the guidelines of the Declaration of Helsinki and the Personal Information Protection Law of the People’s Republic of China. Meanwhile, all students are requested to sign an informed consent form for the use of campus data upon admission, including scenarios and purposes of data use. No data could be collected from students who did not sign the consent form. In addition, all the data were anonymized by encrypting the student IDs in the collection process.
Data description
The behavioral data was collected from the spring semester over a period of 145 days, which includes consumption behavior, building entry behavior, and gateway login behavior. Consumption behavior has four attributes of data, time, location and consumption amount; building entry behavior contains three attributes: data, time and location; gateway login behavior has five attributes including data, time, location, access duration, and network traffic used. Among those behaviors, consumption behavior was further refined into breakfast behavior, lunch behavior, dinner behavior, and shopping behavior. These behavioral data truly record students’ activities on campus from different aspects. In addition, students’ demograhic information of gender, dormitory, school, major, course grade are also collected.
For behavioral data we use statistics and entropy to extract their features. The attributes of behavioral data are divided into two types: nominal and numeric. Among them, behavioral location is nominal, and all other attributes are numeric. To express the value distribution of numeric attribute, its central tendency is measured using the range, mode and mean, and its dispersion is measured using a five-number summary consisting of the minimum, Q2, median, Q3, and maximum. For nominal attribute behavioral location, the Shannon entropy is calculated to measure the regularity of behavior from the spatial dimension [39]. The name of the behavioral feature extracted is prefixed with the abbreviation of the behavior name, for example, “SH_FRE” indicates shopping frequency, “NMINT_MEAN” indicates the average earliest time of login to the network gateway.
In addition, through communication with the class instructor and five students randomly selected from the class, we marked the social relationships of these 29 students, 1 for friend relationships and 0 for non-friend relationships.
Task analysis
To gain a comprehensive understanding of the requirements for the visual analysis of high-order community social relationships, in addition to reading the studies mentioned above, we also conducted in-depth communication with 15 educators. These educators include two administrators, four head teachers, four counselors and five course teachers, their majors are spread across several different disciplines such as computer science, education theory and social science, and they have 5–15 years of experience in student management. The following analysis tasks are identified:
T1. How to discover the groups from the social network of students? Although the traditional social network can express the one-to-one social relationship between students [19], educators are more interested in group relationship [34], because it can help to understand the team relationship from a higher level, rather than focusing on individuals. T2. How to integrate different groups to enhance the cohesion of the network as a whole? Related studies have shown that diverse social interactions can not only improve students’ ability to acquire information, but also has a very positive effect on their physical and mental health [2]. Therefore, educators are expected to break down the boundaries between different social groups, and integrate them into a larger group to enhance the social diversity of students. T3. How to understand the distribution of group members and their behavioral characteristics? It is very important to understand the formation reasons of a group by knowing the membership distribution in a group [33, 28]. For example, how many males and females there are in a group, how many dorms the members of a group live in and how many group members there are in each dorm, is there a class leader in the group. Meanwhile, educators want to know members’ behavioral characteristics and then determine whether the members behave regularly [16]. Based on this information, educators can determine if and how community need to be improved. T4. How to evaluate the social relationships of an individual student and his or her behavioral characteristics? To fully understand the social relationships of individual student, it is necessary to observe all of his or her social members who may be not in the community the student belonged to. Based on this information, educators can find lots of helpful results. For example, those students who have fewer social members or weaker social intensity with others, can be regarded as socially withdrawn, so they need more attention and immediate intervention [32]. In contrast, the students with many social members can be considered to be socially active, they can be candidates for leaders [15]. In addition, the causes or effects of such social relationships can be understood by understanding students’ behavioral characteristics. T5. What types of social relationships can improve or affect the academic performance of a student? Academic performance is a matter of great concern to educators, they are very interested in exploring the correlation between social relationships and academic performance [42, 30], so as to enhance their academic level by improving social relationships.
To complete the aforementioned tasks, a visual analysis method is proposed in this paper, which consists of four modules, as shown in Fig. 1.
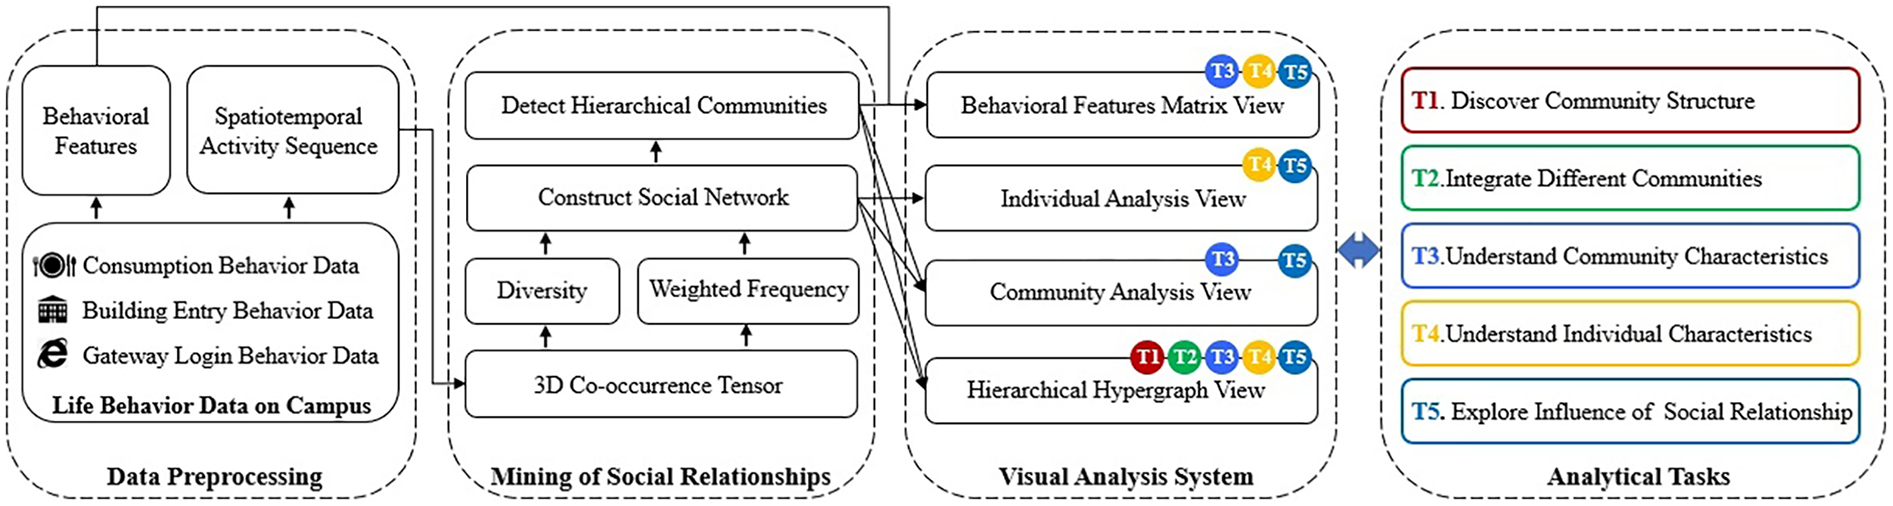
Illustration of ViSSR system diagram, which shows the process of visually analyzing students’ social relationships using four modules: data preprocessing, mining of social relationships, visual analysis system, and analytical tasks. The identifiers (T1, T2, etc.) within the solid colored dots at the upper right corner of each box in the visual analysis system module indicate the analytical tasks supported by each view. For example, the behavioral features matrix view can be used to analyze the tasks of understanding community characteristics (T3 in blue), understanding individual characteristics (T4 in orange) and exploring the influence of social relationship (T5 in steel blue).
To infer students’ social relations, various types of behavior data on campus can be used to construct the spatiotemporal activity sequence of students. Due to that these different types of activity data are stored separately in their own databases with different formats, the Extract-Transform-Load (ETL) tool is firstly used to aggregate all these data into a central database, and then encode all locations and timestamps in a uniform format. For the date attribute of behavioral data, its value was converted into an integer starting from 1 by referring to the university calendar, that is, 1 represents the date corresponding to the first day of the calendar, and so on. Regarding the time attribute, in the first step, the 24 hours in a day were evenly divided into
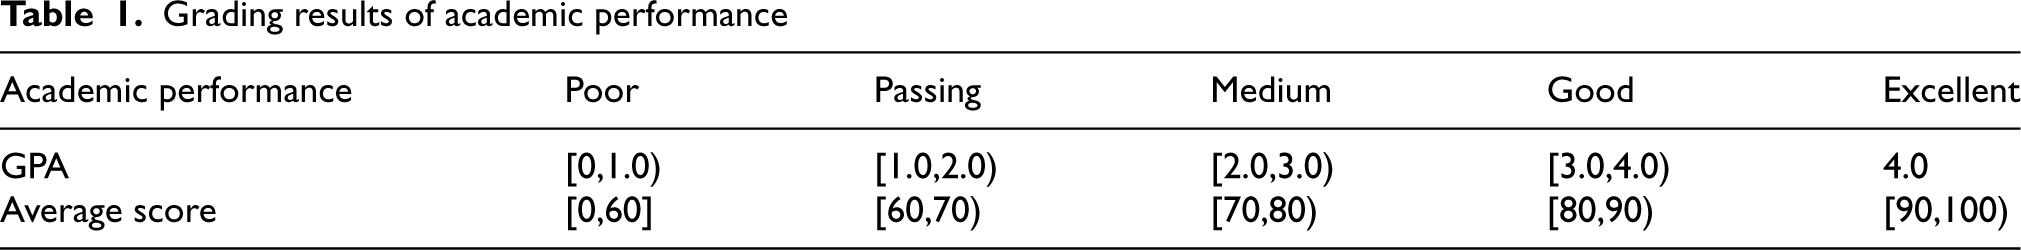
In addition to the behavioral data, the grade point average (GPA) of each student is calculated and divided into five levels: poor, passing, medium, good, and excellent, the detailed division criteria is shown in Table 1.
Grading results of academic performance
Grading results of academic performance
As stated in Section 2.1, the social relationships among students can be inferred from their co-occurrence information containing location and time obtained from their spatiotemporal activity sequences [21, 33]. However the activity sequences at campus usually has limited resolution of geographical location but rich temporal information “year-month-day, hour-minute-second”, the traditional co-occurrence matrix does not efficiently express the information to support the calculation of social intensity among students. To solve the problem, the timestamp is subdivided into two dimensions: date and time, a three-dimensional (3D) tensor is proposed in this paper to represent the co-occurrence information that consists of location, date and time. The social network among students is constructed based on the 3D tensor, in which the social intensity between two students was calculated using a linear regression algorithm that takes the two co-occurrence features of diversity and weighted frequency. Moreover, the hierarchical community social relationships of a social network is detected via the classical Louvain algorithm.
Visual analysis system
To help educators intuitively understand the social relationships mined, four coordinated views were designed and implemented in this modle. Among them, the behavioral features matrix view shows students’ behavioral features and academic preformance, the individual analysis view displays the social characteristics of individual students, the community analysis view displays the social characteristics of communities including social membership distribution and activity time distribution, and the hierarchical hypergraph view illustrates the community structure and the hierarchical integration process of different communities.
Analytical tasks
By interacting with the visual analysis system, educators can carry out the analysis tasks stated in Section 4 easily. The correspondence between the tasks and the visual views used are encoded by colors and identifiers, as shown in Fig. 1. For example, discovering community structure (T1, marked with a red solid box) can be accomplished by interacting with the hierarchical hypergraph view. Understanding community characteristics (T3, marked with a blue box) can be completed with the three views of hierarchical hypergraph view, community analysis view and behavioral features matrix view.
Mining of social relationships
This section describes in detail how to construct a social network of students based on their spatiotemporal behavioral data and how to explore the hierarchical community structure hidden in the network.
Construction of the social network
As mentioned above, the social network among students is constructed via a linear regression algorithm that takes the two features of diversity and weighted frequency extracted from the 3D spatiotemporal co-occurrence tensor.
3D spatiotemporal co-occurrence tensor
A vector or matrix are usually used in existing studies to record co-occurrence information that only contains the location dimension, or two dimensions of time and location. However, due to that the behavioral data of students on campus usually contain limited resolution of geographical location, the co-occurrence vector or matrix does not contain enough information to precisely calculate social intensity. Considering that the behavioral data collected contains the timestamp in the format of “year-month-day, hour-minute-second”, such fine-grained information can be of great help in inferring social relationships. For example, suppose that students A and B often eat together in a cafeteria around 14:00–15:00, while students C and D often co-occur in the same cafeteria from 11:30–12:30. The relationship between A and B is generally thought to be stronger than that between C and D even though they meet in the same place, because the time information 14:00–15:00 indicates that A and B often eat together during the non-peak meal period according to school schedule. So we subdivide the behavioral timestamp into date and time to fully take advantage of the timestamp information, and form a 3D tensor containing date, time and location, where date refers to “year-month-day”, and time refers to “hour-minute-second”.
Based on the collected behavioral data, a spatiotemporal activity sequence
Spatiotemporal co-occurrence diversity
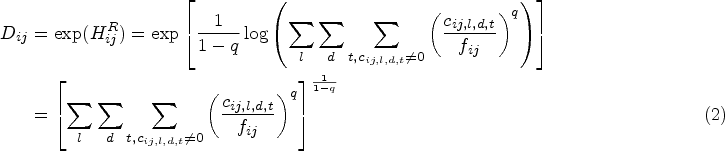
Diversity of spatiotemporal co-occurrence is a key indicator for characterizing social intensity where the more diverse the co-occurrence, the higher the social intensity. That is, two people should have stronger social relationship when they co-ocurr in many different times and spaces. Now many studies have used Shannon entropy to index diversity of co-occurrence. However, Shannon entropy gives higher weight to high frequency events [11], which could affect the determination of social relationships to some extent when two students co-occur frequently in a popular 3D space by coincidence. To overcome this problem, Renyi entropy is used in this paper to measure the diversity of co-occurrence, as shown in Eq. (1), where 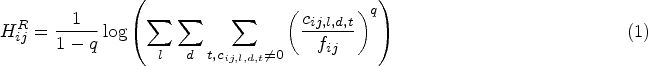
In addition to diversity, co-occurrence frequency is another indicator for inferring social intensity. In general, the higher the frequency of co-occurrence, the stronger the social relationship. However, it ignores an important phenomenon that co-occurrence at different spatiotemporal spaces represent different social meanings. For example, students A and B co-occur 20 times in the cafeteria during the peak dining period, while students C and D co-occur 10 times in the coffee shop during the nonpeak dining period, many people might conclude that the social relationship between A and B is weaker than that between C and D, although the co-occurrence frequency between A and B is higher than that between C and D. Therefore, co-occurrence frequency should be weighted based on the popularity of a spatiotemporal space to more accurately infer social relationships, that is, co-occurrence in a popular space should be given a lower weight, on the contrary, co-occurrence in non-popular space should be given a higher weight. In this paper, the popularity of a 3D space 

Based on the two co-occurrence features of diversity and weighted frequency, a linear regression algorithm is used in this paper to calculate the social intensity
In this paper, the social network of the 29 students in the sample class is constructed, in which there are 364 edges in the social network, and the histogram of the edges weight is shown in Fig. 2. In order to verify the accuracy of this algorithm, the bucket technology divides the calculated social intensity value into several intervals, and then calculates the proportion of real friends in each interval, ideally as the social intensity value increases, the proportion of friends gradually increased. Figure 3 shows the statistical results, it can be seen that the proportion of true friends predicted by the method gradually increases with the increase of social intensity, which indicates that the social network constructed is basically consistent with the their real social relationship.

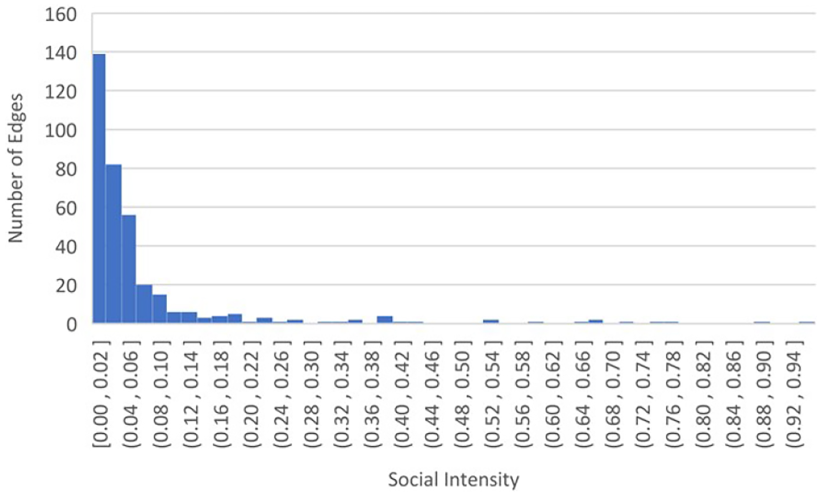
Histogram of social intensity among 29 students in the sample class.
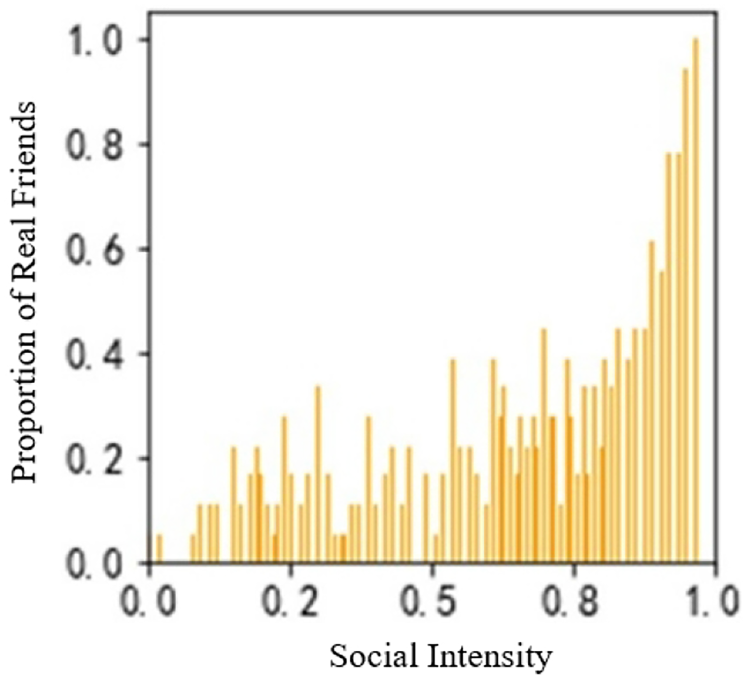
Proportion of real friends in each social intensity interval.
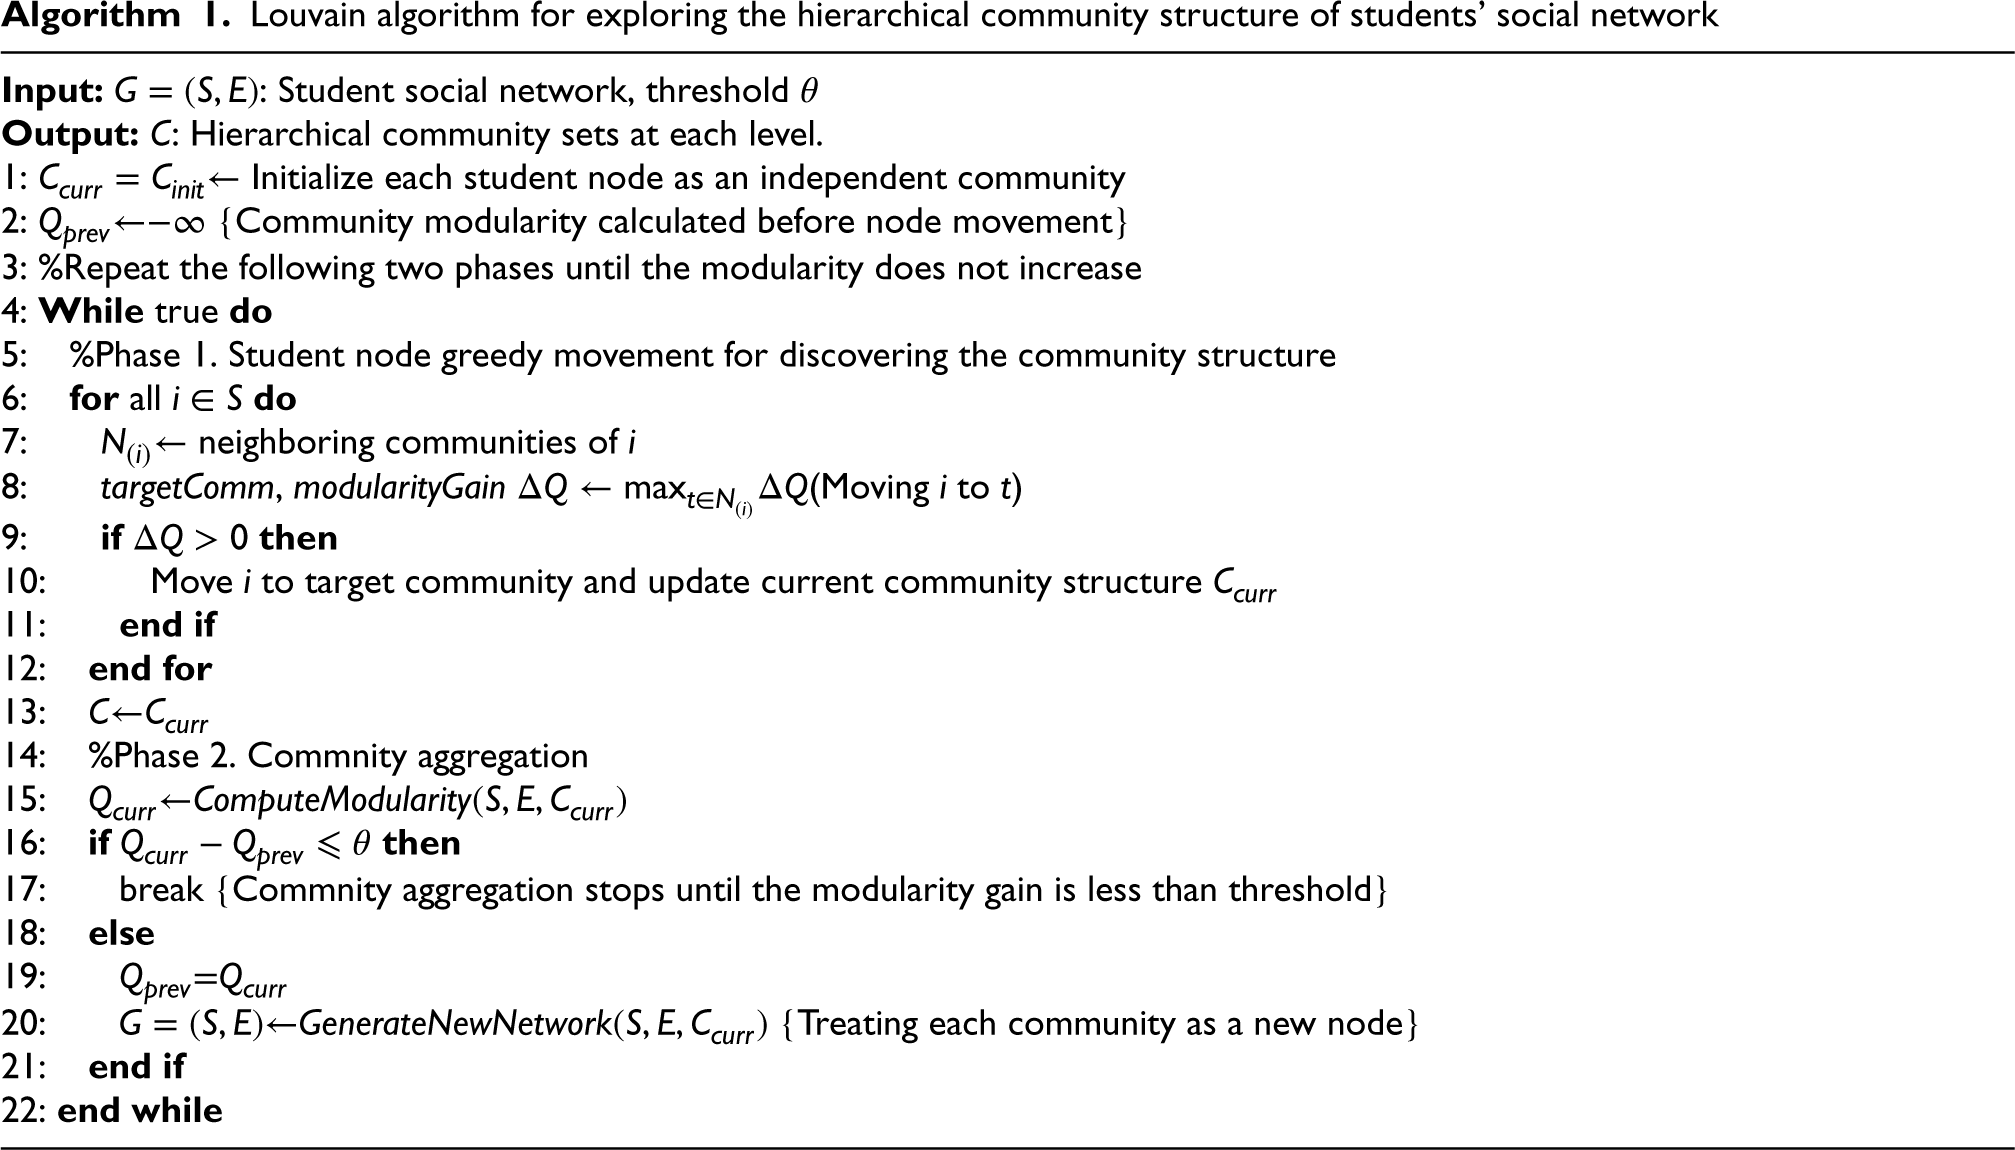
Educators not only pay attention to students’ one-to-one social network, but also want to further explore students’ community social relations hidden in the network. To do that, the Louvain algorithm [35] is applied to explore the hierarchical community structure of a social network due to its advantages mentioned in Section 2.2, as shown in Algorithm 1.
Louvain algorithm for exploring the hierarchical community structure of students’ social network
Louvain algorithm for exploring the hierarchical community structure of students’ social network
Given the social network 
To obtain the hierarchical structure, for the detected student community structure stated above, all nodes in the same community are aggregated into a new node, the sum of the weights of the edges between the two communities is used as the weight of the edges between the new nodes, and the sum of the weights of the edges inside the communities is given to the self-loop edges of the new nodes, so as to generate a new social network. For the newly generated network, the community detection operation stated above is then performed to obtain the community structure of the next layer. The community detection and nodes aggregating operations are performed iteratively until the modularity gain is less than the specified threshold
In this paper the threshold
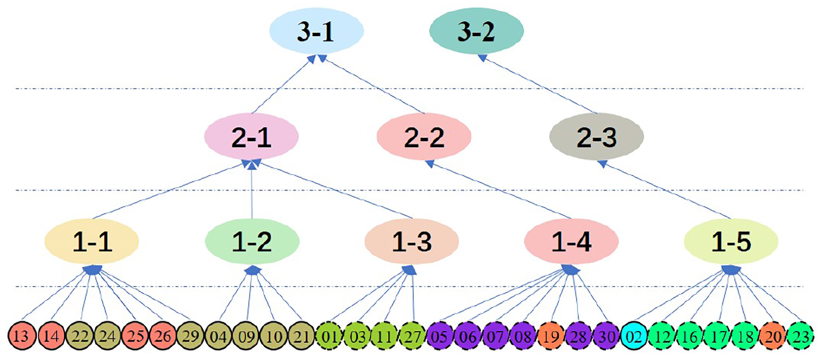
Hierarchical community structure of the social network of sample students expressed by traditional tree diagram.
To help educators understand the mining results stated in Section 6 intuitively, the interface of ViSSR system consists of five functional areas, as shown in Fig. 5, in which the query module at the top, the hierarchical hypergraph view on the left, the community analysis view and individual analysis view at the upper right and the behavioral features matrix view at the lower right. Upon entering the system, users can select the students and time range in the query module, and then analyze these students’ social relationships within the specified time range intuitively and interactively through the other four views.
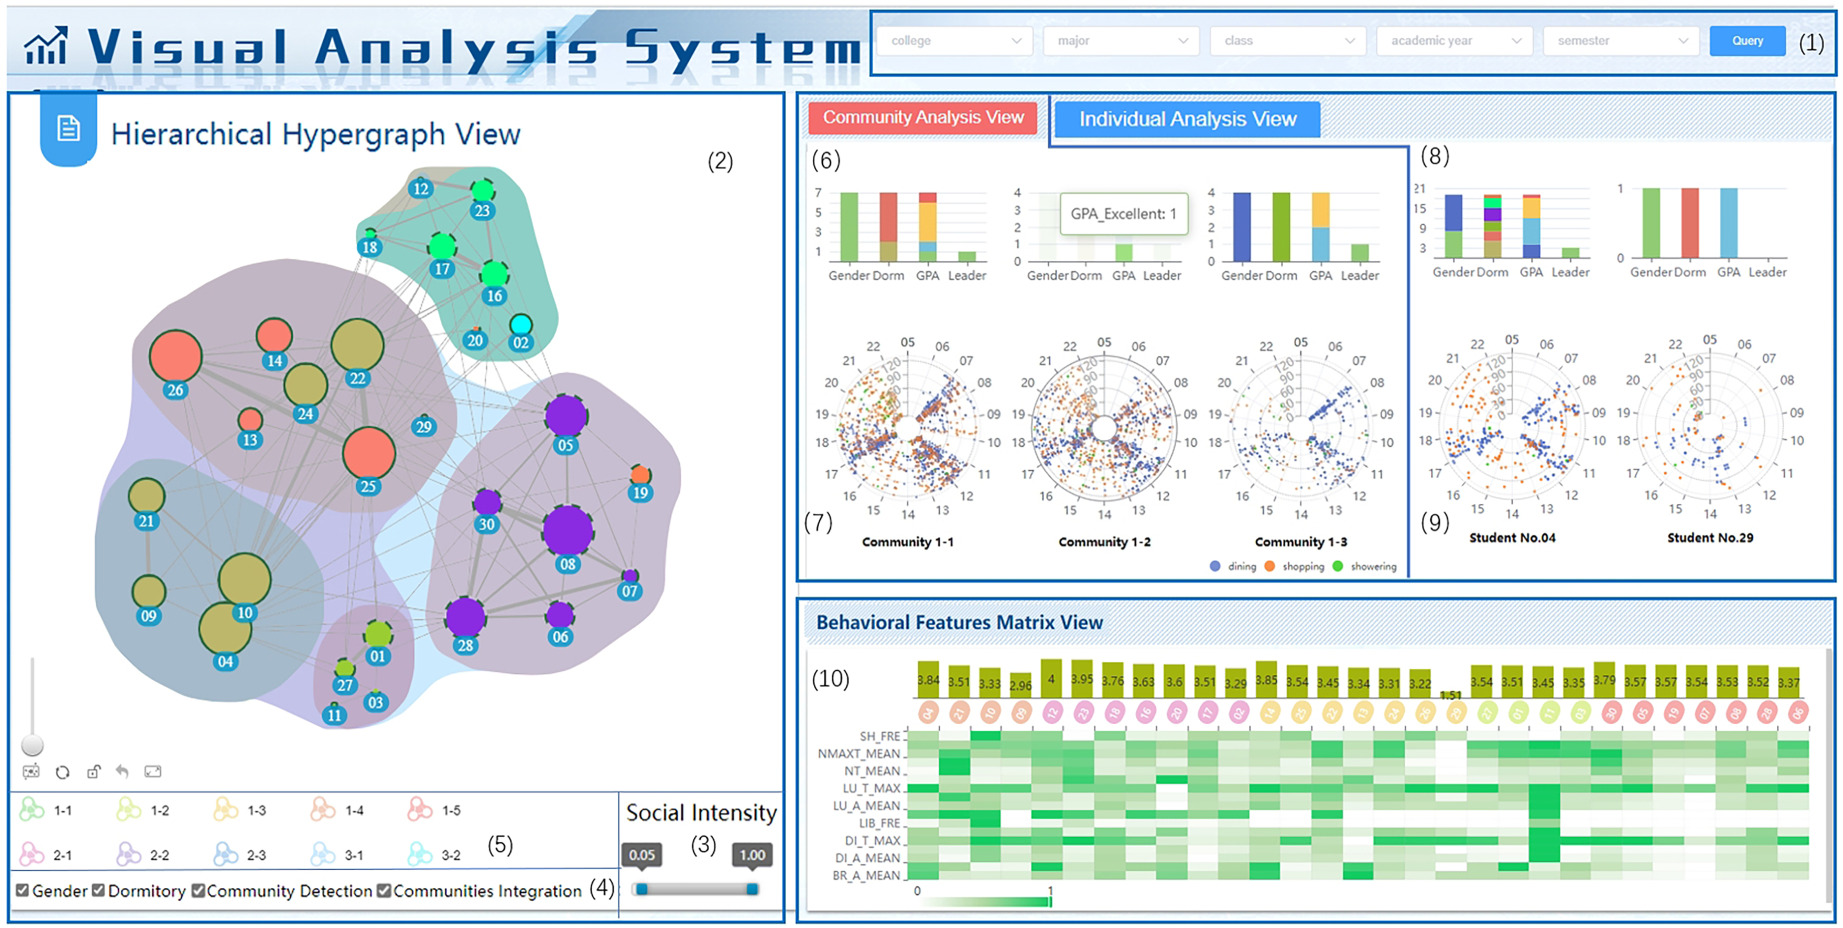
Interface of ViSSR system with five functional areas: query module, hierarchical hypergraph view, community analysis view, individual analysis view, and behavioral features matrix view. And it contains ten subfunctional areas: (1) Query module for selecting students whose social relationships are analyzed; (2) Hierarchical hypergraph view showing the community structure of students’ social network and the hierarchical integration process of different communities; (3) Social intensity filter used to manually adjust threshold range to show or hide edges in a social network; (4) Four checkboxes of “Gender”, “Dormitory”, “Community Detection” and “Communities Integration”, the first two checkboxes are used to control whether gender and dorm information is displayed in the social network, and the latter two are used to control the community detection and integration process; (5) Icons of communities detected from social network, which can be clicked to highlight the community in the hierarchical hypergraph view; (6) A stacked bar chart used to present the multidimensional distribution of community members; (7) A polar coordinate scatter plot used to display the activity time distribution of community members; (8) A stacked bar chart showing the distribution of the social members of individual student; (9) A polar coordinate scatter plot showing the activity time distribution of individual student; (10) Behavioral feature matrix view showing students’ behavioral characteristics and their academic performance.
To quickly select the students whose social relationships are of interest, the organization structure of school, such as college, academic major, and class, are embedded in the query module in the form of a cascading menu, as shown in Fig. 5(1). When a user selects a college, only the academic majors belonging to that college appear in the “major” drop-down list. Next, when the user selects a major, only the classes of that major appear in the “class” drop-down list. Meanwhile, users can select the academic year and semester from the drop-down list. After selecting students and time frame, their social relationships within the specified time range can be analyzed by clicking the “Query” button. For example, we can select a specific class in the Information Management major in the college of Economics and Management, and analyze their social relations in the spring semester of the 2018–2019 academic year.
Hierarchical hypergraph view
The hierarchical hypergraph view shown in Fig. 5(2) is mainly used to visually analyze the natural structure of the social network constructed, its community composition and the hierarchical integration process of different communities. The social network for these selected students within the specified time interval is automatically displayed in the view, and it can be explored further by interaction operations with visualization components including the social intensity filter shown in Fig. 5(3), four checkboxes of “Gender”, “Dormitory”, “Community Detection” and “Communities Integration” shown in Fig. 5(4), and community icons shown in Fig. 5(5) that appears only when checkbox “Community Detection” or “Communities Integration” are checked. Next the social network and its hierarchical community structure are described in detail.
Social network
A social network can usually be displayed in a node-link graph structure [20], however, this structure would become more and more confusing as the number of student nodes and edges increases. To avoid this problem, a force-directed layout [9] is adopted in this paper to display a social network, which simulates a spring model to reduce the intersection of edges, as shown in Fig. 6(1). In the network, a node represents a student, the number attached to a node is student ID, and the size of a node indicates its betweenness centrality. The larger the node’s size, the more socially active the corresponding student is. The width of an edge indicates the social intensity, the thicker an edge, the stronger its social connection. Based on the network, educators can clearly observe the one-to-one social relations between students.
To further enrich the information contained in a social network, the outline of a node is used to express gender information. When the “Gender” checkbox is checked, nodes with smooth outlines represent male students, and nodes with dashed outlines represent females, as shown in Fig. 6(2). Meanwhile, node color is used to represent dormitory information. When the “Dormitory” checkbox is checked, nodes with the same color indicate that the corresponding students live in the same dorm, as shown in Fig. 6(3). By clicking a student node, the node and its connected edges can be highlighted in the network, his or her social membership distribution and activity time distribution can be displayed in individual analysis view described in detail in Section 7.4, and her or his behavioral features are highlighted in matrix view stated in Section 7.5.
In addition, educators may wish to flexibly explore particular social relationships, such as best friends, romantic partners, and even familiar strangers. To do that, a social intensity filter is designed, as shown in Fig. 5(3), by which users can manually set the threshold range to select the social edges they are interested. For example, users can find very close friends by setting a high threshold, and further discover romantic partners combined with gender information.
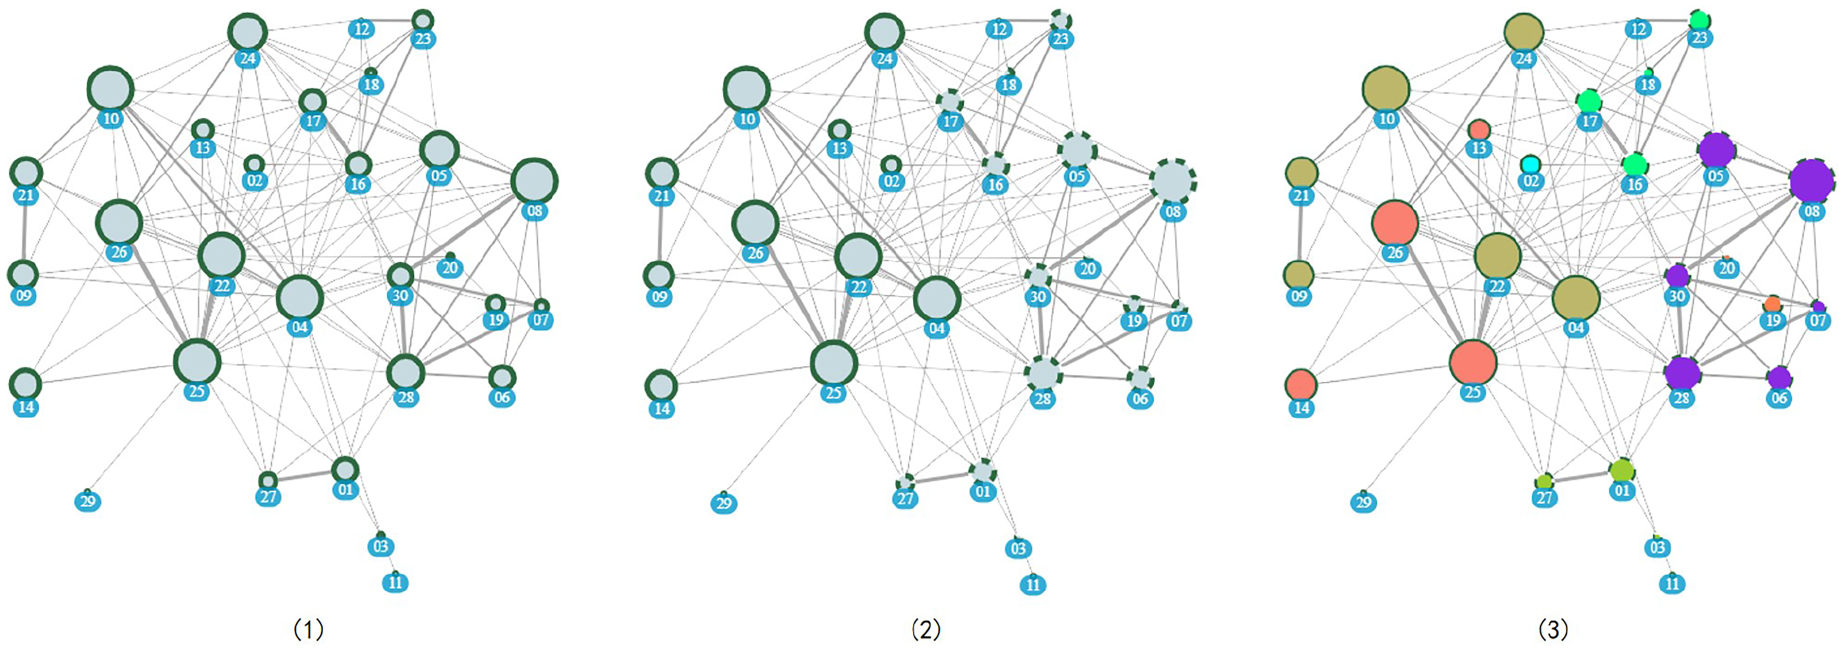
Student social network. (1) Traditional force-directed layout network; (2) Force-directed layout network containing gender information; (3) Force-directed layout network containing both gender and dormitory information.
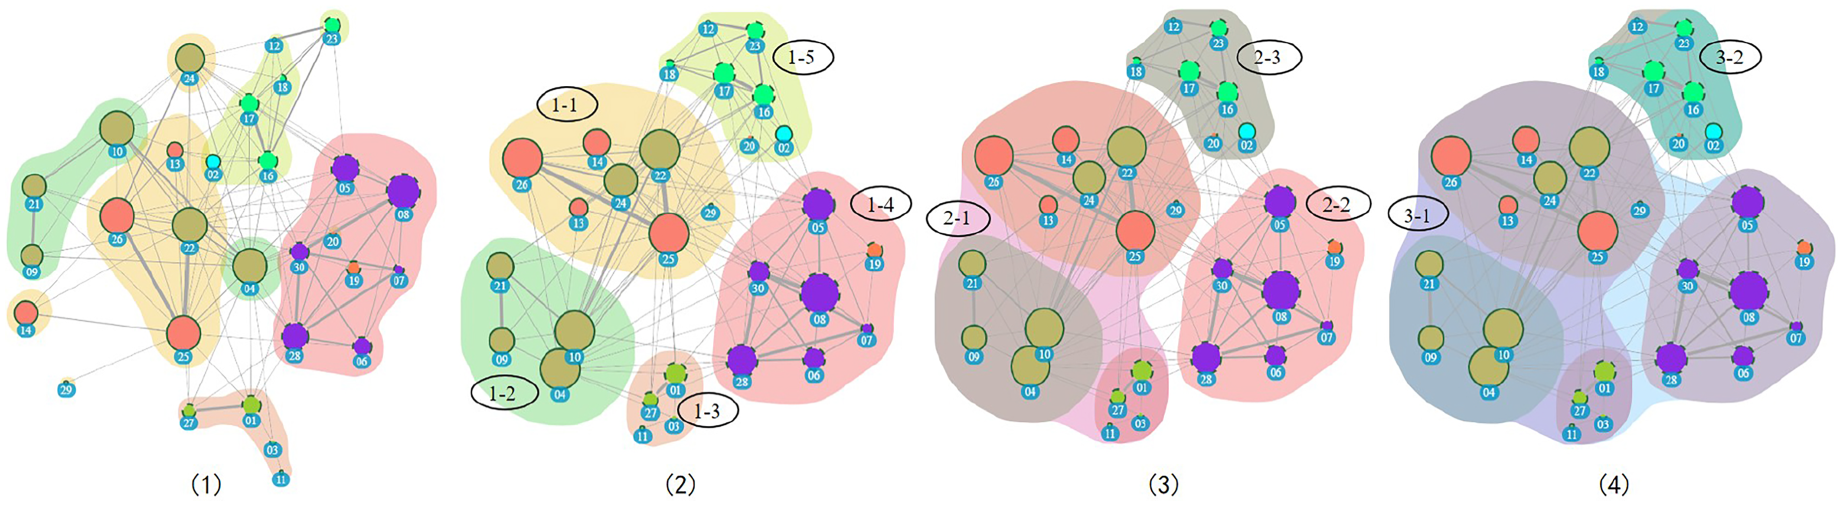
Hierarchical integration of different communities. (1)The initial community structure in which the nodes belonging to the same community are not surrounded by a whole color block; (2) The first layer of community structure with five base communities; (3) The second layer of community structure with three communities; (4) The third layer of community structure with two communities.
To intuitively understand the hierarchical community structure of a whole social network (T1) and the integration process of different communities (T2), we designed the hierarchical hypergraphs to visualize them. When the “Community Detection” checkbox is checked, the base communities of a social network are detected and displayed, as shown in Fig. 7(1), in which student nodes belonging to the same community are surrounded by the same color block, and different colors indicate different communities. And these nodes belonging to the same community can further form a larger hypergraph for clear observation by manually dragging them closer together, as shown in Fig. 7(2), by which users can not only clearly see that there are five communities in the network, but also know which members are included in each community and the social relationships of the members. At the same time, the community icons taking the same naming way as in Fig. 4 are displayed, as shown in Fig. 5(5), users can further understand the social characteristics of a community in the community analysis view described in detail in Section 7.3 by clicking a community icon.
After observing the base communities of a social network, users can further understand the hierarchical community structure in the hierarchical hypergraph view. When the “Communities Integration” checkbox is checked, the hierarchical community structure of a social network is uncovered, and all the community icons within each layer are displayed in Fig. 5(5), by which the number of layers and the number of communities in each layer can be observed intuitively. By clicking the community icons, the hierarchical integration process of different communities can be clearly demonstrated. For example, Fig. 7(2)–(4) show a three-layered community structure of a social network of 29 students. Figure 7(2) displays the first-layer community structure consisting of five base communities whose icons prefixed with “1-”. Figure 7(3) displays the second-layer community structure containing three communities, in which community “2–1” is formed by merging communities “1–1”,“1–2” and “1–3”, and the other two communities “2–2” and “2–3” are the same as communities “1–4” and “1–5” respectively. Figure 7(4) shows the third-layer community structure in which community “3-1” is formed by merging communities “2–1” and “2–2”, and the community “3–2” is same as community “2–3”.
Compared with the traditional tree diagram shown in Fig. 4, in which although the node color, node outline, and community color are the same as that in the hierarchical hypergrahs, the nodes are too independent to express the social relationships among students. In contrast, the hierarchical hypergraph in the paper can not only visualize the processes of student community integration, but also express the social relationships among students.
Community analysis view
In addition to the hierarchical community structure of a social network, educators want to learn more about the characteristics of communities and why they are formed. To do that, the multidimensional distribution of community members can be presented in the form of stacked bar chart as shown in Fig. 5(6), and the activity time distribution of community members are displayed in a polar coordinate scatter plot as shown in Fig. 5(7).
Membership distribution
It is very necessary to understand the distribution of community members (T3) for community management. Based on the distribution information, educators can explore the formation reasons of a community, evaluate the membership diversity, and even determine whether a community is conducive to student development, such as improving academic performance (T5).
A stacked bar chart is used in this paper to display the membership distribution from the four dimensions of: gender, dormitory, GPA, and team leader, as shown in Fig. 5(6), in which each bar indicates a statistical dimension, and the different colored patches in a bar represent different categories in the dimension. For example, the green and blue patches in the gender dimension represent the male and female respectively; the different colors in the dormitory dimension represent different dormitories; the colors of green, blue, light blue, orange and red in the GPA dimension represent the five GPA levles of excellent, good, medium, passing and poor respectively; and the unique green color in the team leader dimension indicates leader. The category and its value that the colored patch in each bar represents is displayed when the mouse moves over the patch, which indicates the number of community members in the corresponding category of a dimension.
Through this graph, we can clearly observe the membership distribution of a community, including the number of male and female students, the number of students living in each dormitory, the number of students with different academic levels, and the number of team leaders. For example, there are four members in community 1–2, which consists of four male students living in the same dormitory, they have four GPA levels of excellent, medium, passing and poor respectively, and there is one team leader. This indicates that the social relationships in community 1–2 are harmonious enough to make every student can obtain sufficient social support from their roommates, which is beneficial to their physical and mental health. However, these students in community 1–2 should be encouraged to help each other academically to get good performance, and to actively socialize with students in other dormitories to further expand their ability to access more information, rather than just limiting themselves to a small scope.
Activity time distribution
Due to the temporal nature of activity data, time related components should be incorporated into the design to better express temporal information. The polar scatter plot is more suitable for metaphorical time based on the polar coordinate system, and is similar to the clock in reality, which is in line with human cognitive intuition. So a scatter plot in polar coordinates is introduced to show the activity time distribution, as shown in Fig. 5(7).
In the scatter plot, the circles represent the semester calendar, the innermost circle represents the first day of the semester while the outermost one represents the last day, and the polar axises represent the activity time. Since few activities are generated by students from 0:00 am to 5:00 am, the time range in this plot is set to be from 05:00 to 24:00 to make full use of the space. Colored points in the plot represent types of activity events generated by a student, for example, a blue point indicates a dining activity event, an orange point indicates a shopping activity, and a green point indicates a showering event. In addition, in order to avoid overcrowding in the innermost circle, which makes it difficult to observe clearly, we designed the innermost circle of the plot as a hollow pattern. By observing all activity records of community members in a scatter plot according to activity date, time, and type, educators can intuitively observe the activity time distribution of community members and evaluate the regularity of various types of behavior according to school’s schedule, and then take timely intervention measures to irregular behaviors (T3).
Individual analysis view
Educators pay attention not only to the community characteristics of students, but also to the social relationships and behavioral characteristics of individual students. In this paper, we take the same visualization components as the community analysis view to display the distribution of the social members of individual students and his or her activity time distribution (T4,T5), as shown in Figs 5(8) and 5(9). By clicking on a student node, all the social members of the individual are statistically displayed, as shown in Fig. 5(8), no longer limited to the members of the community he or she belongs to. Furthermore, the changes in the distribution of social members of individuals can be observed by dynamically setting the social intensity filter. For example, we set the intensity range to
Behavioral features matrix view
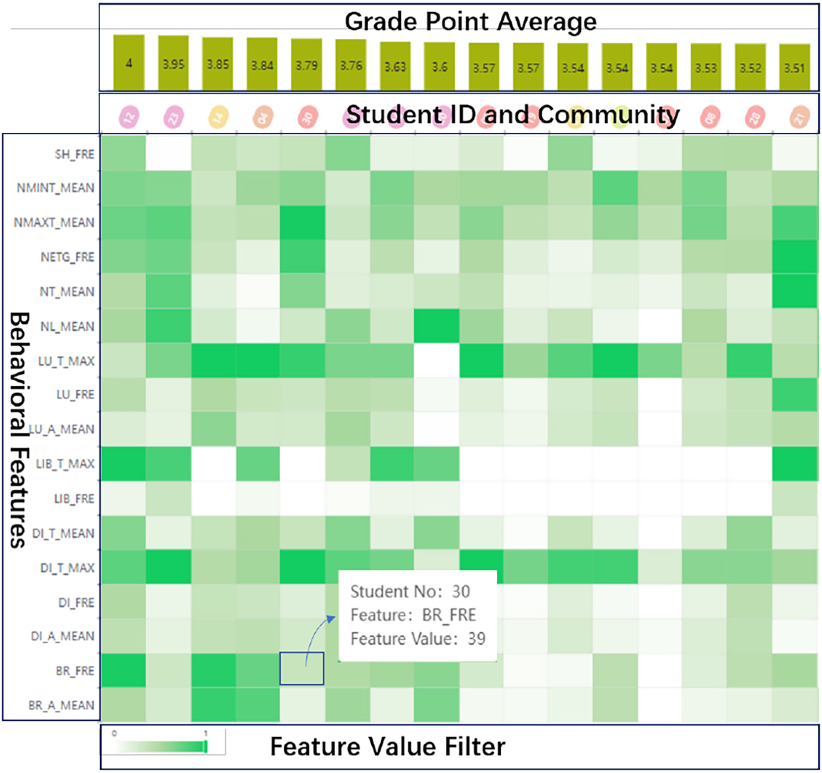
To help educators gain a broader understanding of the behavior characteristics of students (T3,T4), and to explore the influence of behavioral characteristics on academic performance (T5), the behavioral feature matrix view is designed, as shown in Fig. 5(10) magnified into Fig. 8. This view adopts a familiar table style and displays rich information in a limited space [14], in which the columns and rows represent the students and their behavioral features respectively. The number with a colored ellipse located at the column header is student ID and the color indicates the base community the student belongs to. The bar above the student ID represents the student’s grade point average. The symbols on the left of each row represent behavioral features. Each cell in the view represents the behavioral feature information of a student, and its information is highlighted in a pop-up box when the user moves the mouse over a cell.
Behavioral feature matrix view.
Due to the difference in the magnitude of different features, min-max scaling is firstly applied to normalize the value range of each feature into the range [0,1], and then the normalized feature value is encoded into a color, where the higher its value is and the darker the color is. Furthermore, this view allows users to sort the students by academic performance or behavioral features, and to only retain the feature values they are interested in by dragging the feature value filter. Through interaction with this view, users can intuitively understand the behavioral features of students in a community and further analyze whether the community structure contributes to academic achievement.
To demonstrate how educators utilized the ViSSR in analyzing social relationships among students, we describe two example cases in this section.
Case 1 – Class group analysis
This case illustrates how to mine groups from the social network of a class (T1) and analyze their characteristics (T3), and how to integrate these different groups layer by layer (T2).
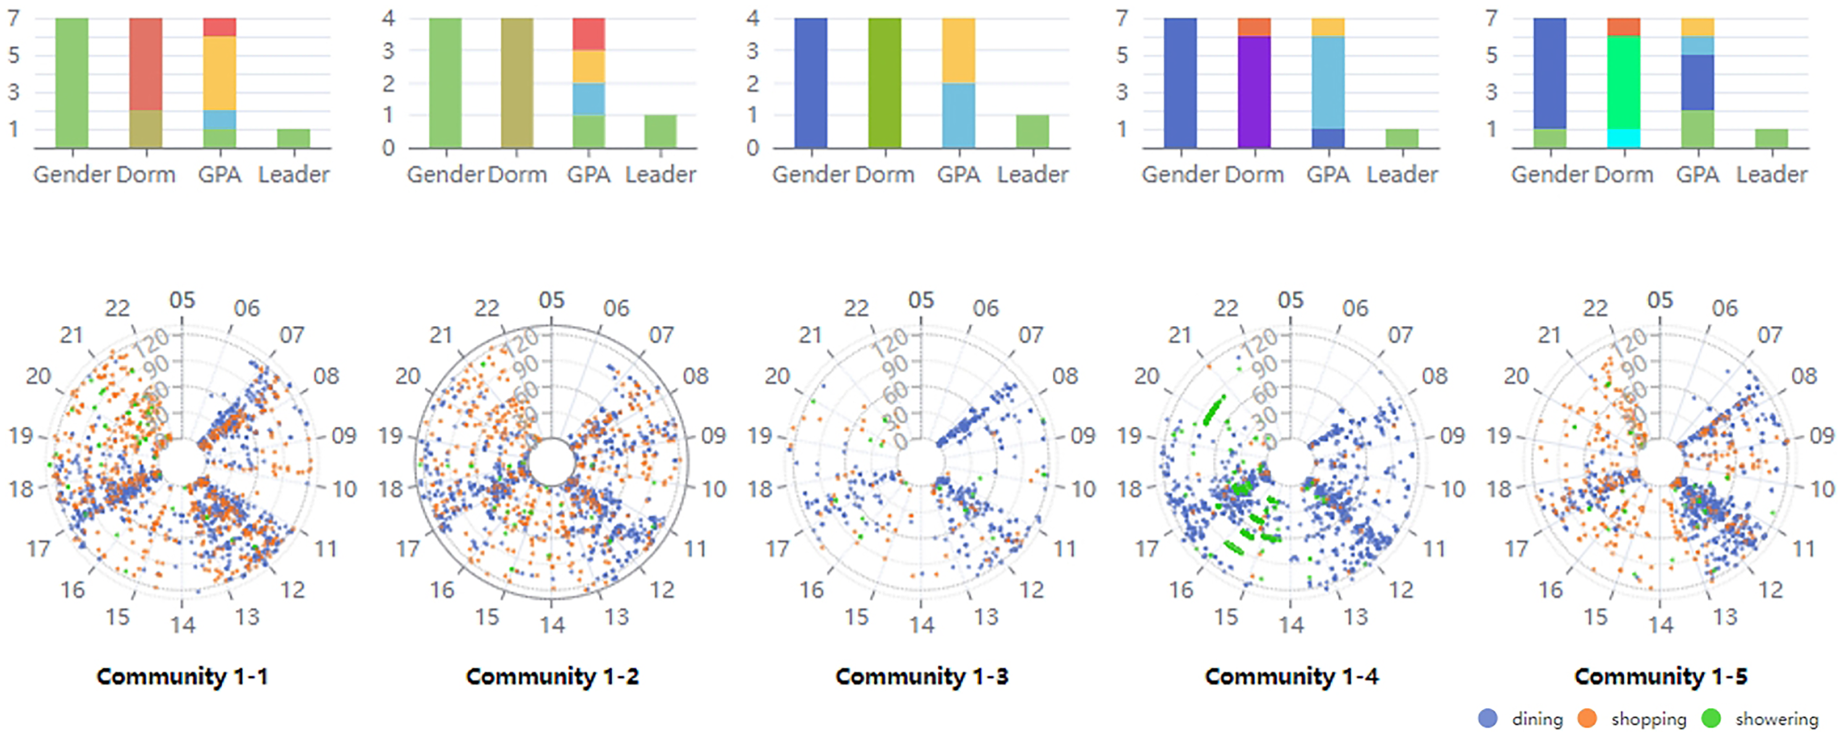
Multidimensional distribution and activity time distribution of the students of the five communities in the sample class.
The class instructor first selects the sample class and semester in the query module and then clicks the query button, the overall social network constructed for the class is displayed in the hierarchical hypergraph view as shown in Fig. 6(3), in which gender and dormitory information are included by default. Next, when the instructor clicks the “Community Detection” check box, the base social groups explored from the social network and their community icons are displayed, as shown in Fig. 7(2). By observing it, the instructor can clearly observe that the class contains five base groups and the members in each group.
When the instructor clicks on a community icon, the distribution of community members and that of their activity time are displayed in the community analysis view, as shown in Fig. 9. By observing it, the instructor can obtain the detailed statistic information on all the five groups. For example, community 1–1 is composed of 7 male students living in two dormitories, in which 6 students have medium or below grades, and the behavioral time distribution of its members is concentrated and regular. Community 1–2 is composed of four male students living in the same dormitory, their academic performance is at four different levels, and the dining time is irregular, breakfast time lasts from approximately 6:30 to 9:30. Community 1–5 consists of 7 students in which 5 students live in one dormitory while other two students live singly, the grades of five students are good or excellent apart from two students whose GPAs are unsatisfactory, and the behavioral time distribution of the members is in line with the school’s schedule, that is, most students have breakfast before 8:00, lunch at approximately 11:40, and dinner around 17:00. Meanwhile, very coincidentally, each group has a class leader.
Based on the above observations, the following conclusions can be drawn about the group formation of this class. First, the communities show a high degree of gender homogeneity. Apart from the 7 students in community 1–5, which includes 1 male student, all the other communities are composed of students of the same gender. Second, the five communities are mostly composed of members living in the same dormitory. Third, the grades of students in each community do not show obvious homogeneity, and there are even large differences in some communities, such as communities 1–1 and 1–2. This indicates that students in the class do not form communities based only on their academic performance. Through communication with education experts, they said that the results fit the social characteristics of freshemen.
Group integration
The layer-by-layer integration process of different groups is displayed in the hierarchical hypergraph view when the instructor selects the “Communities Integration” checkbox, as described in Section 7.2. By observing the detailed integration information of the sample class, we obtain the following conclusions: 1) Male students in the class are more willing to socialize across dormitories; In contrast, female students are less willing to socialize across dormitories. For example, community 2–1 has basically integrated all male students living in different dormitories, meanwhile community 1–4 consisting of 7 females is not integrated in the second layer, and community 1–5 including 6 females always remains independent until the integration is complete. 2) The communication between male and female students in the class gradually increased with the gradual integration of different groups, for examle, community 2–1 contains 11 male students and 4 female students, while community 3-2 contains 11 males and 11 females. 3) Students in the class do not form a basic social group based on their academic performance, but we also find an interesting phenomenon that community 1–5 is always independent in the group integration process, the vast majority of its members have good GPAs or above. This reminds the class instructor to strengthen the interaction between these students in community 1–5 and other students to take full advantage of the exemplary role of these excellent students. These conclusions demonstrate that the ViSSR system can effectively assist the nstructor to understand how the different groups integrate and what factors promote or influence the integration process.
Case 2 – Warning of socially withdrawn students
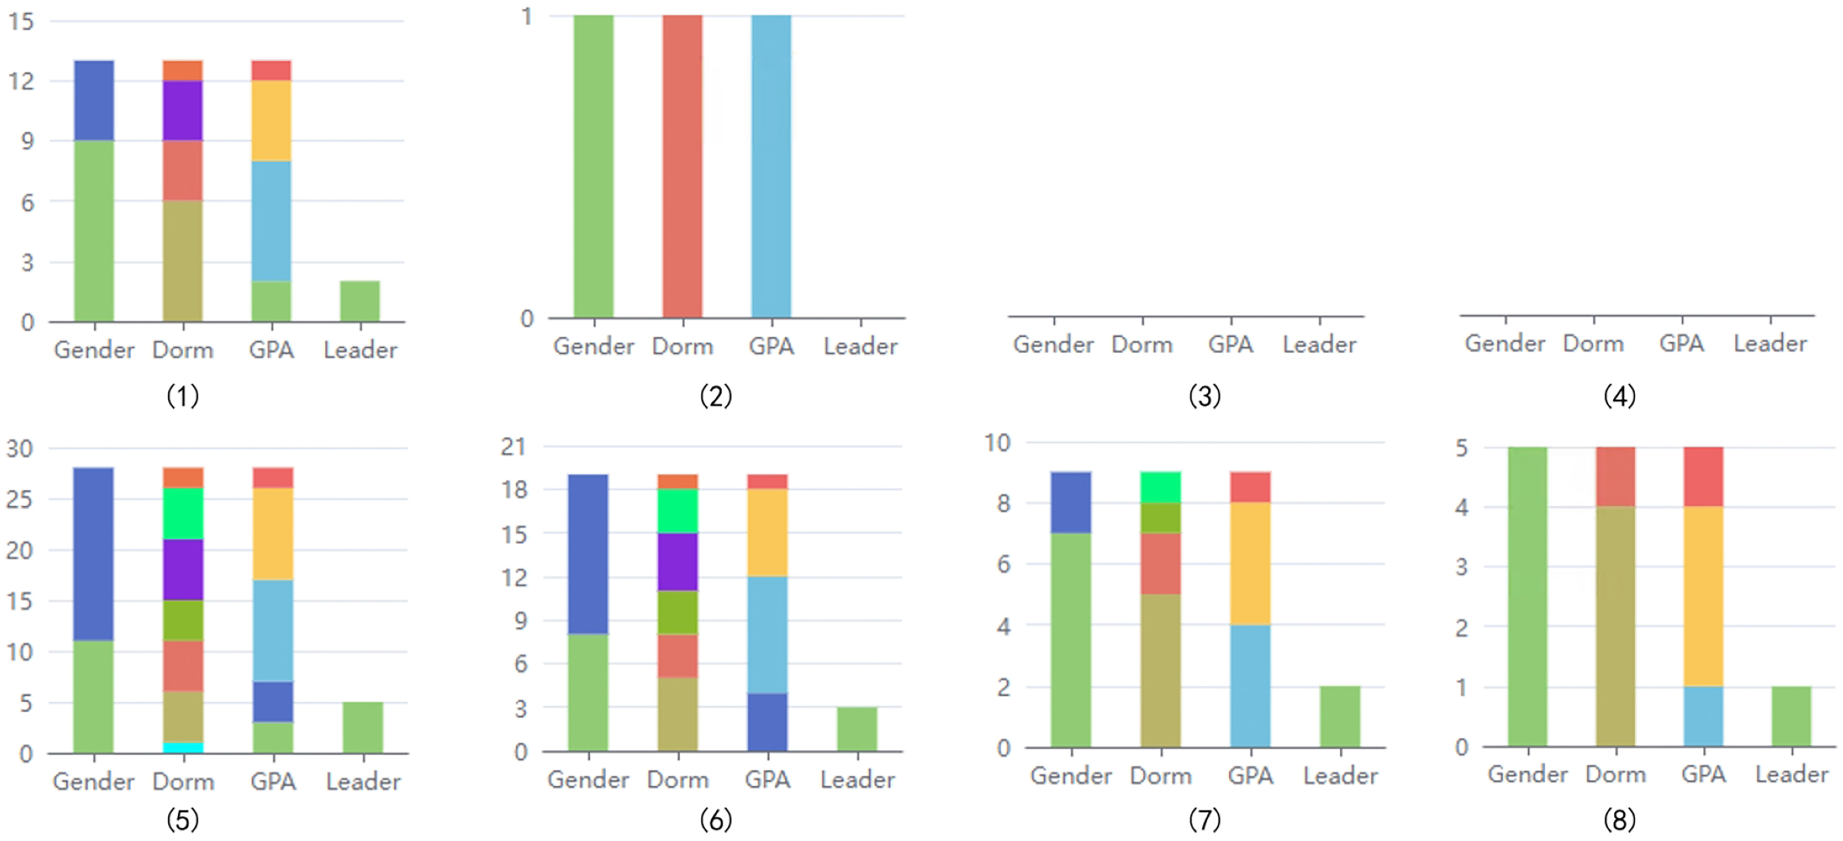
Distribution of social members of students 29 and 04. (1)–(4) shows the distribution of social members of student 29 under the social intensity thresholds of 0.00, 0.05, 0.10, and 0.15, respectively; (5)–(8) shows the distribution of social members of student 04 under the same social intensity thresholds as student 29.
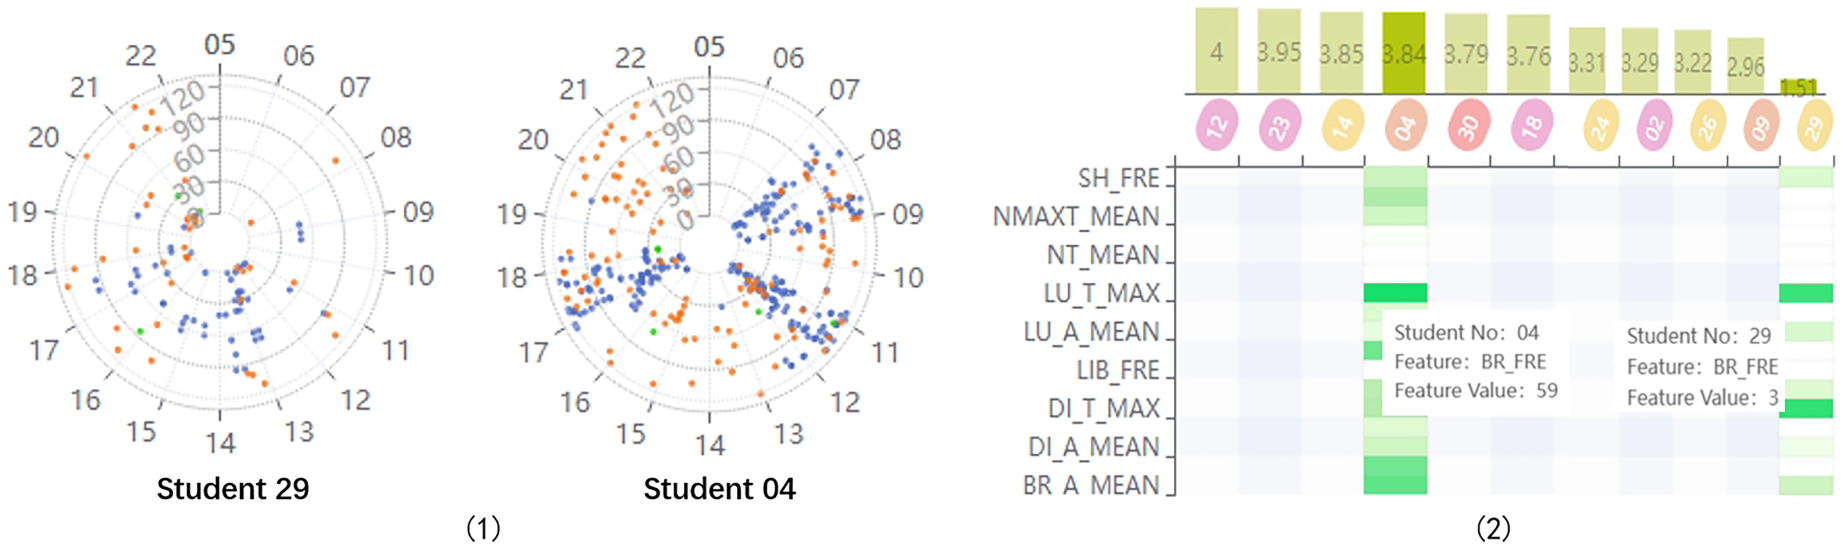
Comparison of the behavior of student 29 and 04. (1) activity time distribution; (2) behavioral features.
This case shows that how to quickly identify a socially withdrawn students (T4) and provide appropriate suggestions for improvement (T5).
To identify socially withdrawn students, the instructor can firstly observe the size of the nodes and the thickness of the edges in the hierarchical hypergraph view, and then observe the changing trend of social members in the individual analysis view by adjusting the social intensity threshold. The students that have fewer social members or very weak social intensity with others could be regarded as being socially withdrawn.
For example, it can be observed that the node of student 29 is very small and his social intensity with others is very weak, which could be considered a socially withdrawn student. When the instructor clicks on the node of student 29, the node and its edges are highlighted, and statistic information about his social membership distribution and activity time distribution are displayed in the individual analysis view. Meanwhile, the changes of social members can be observed by dragging the social intensity filter, as shown in Fig. 10(1)–(4), in which it can be found that student 29 has a total of 13 social members, however, the number rapidly decreases with an increase in the social intensity threshold. There is only one social member left when the threshold is 0.05, and there are no social members when the threshold is greater than or equal to 0.10. In contrast, we randomly selected the socially active student 04 for comparison. As shown in Fig. 10(5)–(8), student 04 socializes with every studenth in the class when the social intensity threshold is 0.00, and the student still has 5 social members even if the threshold is raised to 0.15. These observations confirm that student 29 has very weak social ties with the few friends he has, and runs the risk that he cannot obtain sufficient social support from his classmates, so the instructor needs to timely take measures to improve his social relationships.
Cause analysis
For socially withdrawn students, it is necessary to locate the causes and give targeted suggestions for improvement. Figure 11(1) shows the behavioral time distribution of student 29 and student 04. By observing the figure, it can be seen that the activity records of student 29 on campus are very sparse, and there are practically no activities of eating breakfast in the cafeteria. Considering that the possibility of ordering take-out in the morning is very small, it can be inferred that the student rarely eats breakfast. Furthermore, student 29 usually has lunch late, and his lunch and other mealtimes are mixed together. In contrast, student 04 has lots of activity records on campus with a regular lifestyle, for example, his breakfast time is around 8:00, lunch time is around 11:30, and dinner time is distributed between 17:00 and 18:00. In addition, more behavioral features of students 04 and 29 are highlighted in the behavioral features matrix view, as shown in Fig. 11(2), in which we can examine the behavioral feature values and compare the differences between them. For example, student 04 had 59 breakfasts in the semester, while student 29 only had three. All these observations demonstrate that student 29 may often be absent from school and has a very irregular campus life. To some extent, these observations also explain the poor academic performance of student 29. Hence, student 29 should be encouraged to actively participate in school activities together with classmates, including eating meals regularly and attending courses on time, which can enhance his ability to access more information to improve academic performance.
Expert evaluation
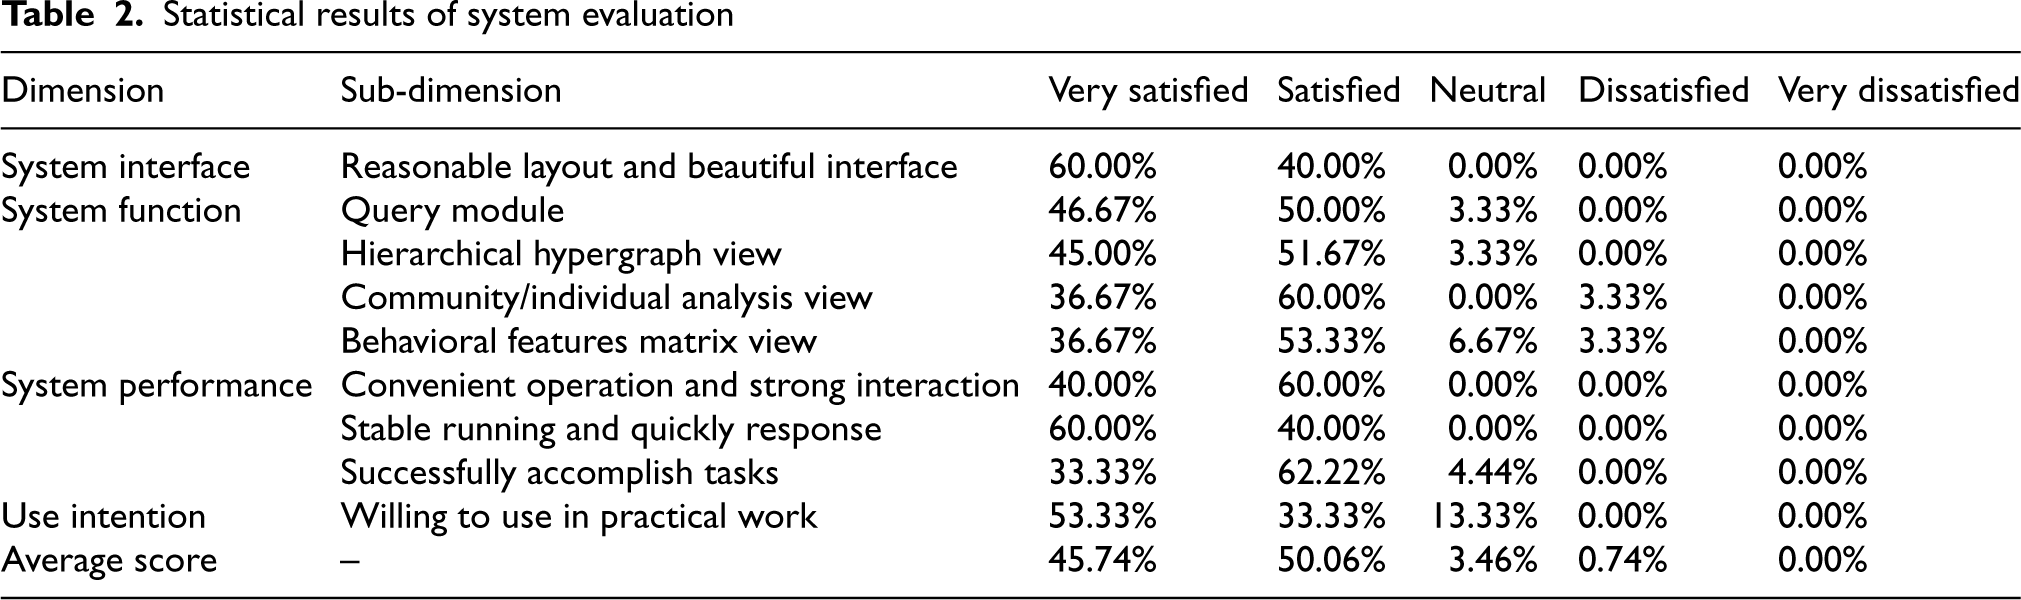
We invited the 15 educators mentioned in Section 4 to evaluate how the visual system works for exploring students’ social relationships, and then designed a questionnaire based on a Likert scale to collect evaluators’ feedback. The questionnaire has 20 questions for the nine sub-dimension of the four dimensions of: system interface, system function, system performance, and use intention, as shown in Table 2, and there are five options: “very satisfied”, “satisfied”, “neutral”, “dissatisfied” and “very dissatisfied” for each question. To facilitate evaluators to use the system better, we first explained the function of each module and the operation process with a live demonstration tutorial, and then the evaluators are asked to complete the following four analysis tasks with operation hints, the tasks are listed as follows.
Discover how many groups there are in the social network of the class studied in the paper, and elaborate the distribution of members in each group and their behavioral characteristics. A community indicates a group, the number of groups can be observed in the hierarchical hypergraph view by clicking the “Community Detection” checkbox. The distribution of members and behavioral time distribution of each group can be shown in community analysis view by clicking the community icon, and their behavioral characteristics and academic performance can be observed in behavioral features matrix view. Describe how these different groups integrate layer by layer, and draw a tree-like hierarchical integration diagram. This is the core task, the layer-by-layer integration process of different groups can be shown in the hierarchical hypergraph view by clicking the “Communities Integration” checkbox. Then the tree-like integration diagram can be drawn by observing all community icons. Identify those students who are socially isolated, understand their activity time distribution and behavioral features at campus, and give some specific measures to improve their social relations. The social relationship of individual student and his or her activity status can be highlighted by clicking on student node, and the students with few social partners or very weak social strength can be seen as socially isolated by adjusting the social intensity filter. Recommend 2 or 3 students who are suitable for class leader and explain the reasons. The leader should be in a key position in the social network and play an important role in integrating different groups, so a student with a wide range of friends should be recommended as leaders, for example, he or she belongs to a big community and his or her friends comes from different dorms, different genders, and different academic levels.
After approximately one hour, except for one evaluator who did not describe the behavioral characteristics of the socially withdrawn students, all others had successfully accomplished the tasks. We conducted in-depth interviews with these evaluators regarding system usability, visual designs, and interaction. Their comments and suggestions for the system are discussed below.
System usability. The vast majority of educators were very impressed by the usability of the system, especially the administrators and head teachers who have been deeply involved in student management. They commented, compared to the traditional survey-based method they often used, the system can help them to efficiently explore the social relationships among students, because the system not only objectively calculates the social intensity among students based on multi-source behavioral data, but also provides multiple visual analysis views which eliminates the need for users to master complex statistical techniques. Due to these advantages of the system, it can be widely used in student management, “This system has strong practical significance as well as guiding and predictive functions. The functions are relatively complete, I hope to promote its use as soon as possible”. “It provides data support and improvement suggestions for teachers to carry out class management, as well as psychological counseling, school enrollment, employment, teaching, and research work”. However, two evaluators commented that there are some difficulties in observing the composition of the student community, as it is still necessary to drag some loose nodes to form a complete community. As the number of nodes in the network increases, this dragging becomes more difficult with the network structure becomes more complex.
Visual Design and Interactions. These elevators generally commented that the layout of the system is reasonable, the interface is friendly, and the interactions is flexible. Compared with the traditional hierarchical tree, the hierarchical hypergraph view can express the social relations of nodes in the community. The gender and dormitory information contained in the social network further enhance the information of the network. It is very useful for users to understand students’ social relationships in different intensity ranges by setting the social intensity filter. Elevators can intuitively observe the distribution of community members in different dimensions through the community analysis view, which is convenient to understand the reasons for the formation of communities. Behavioral features matrix view shows students’ behavioral characteristics and academic performance, which is helpful to understand the correlation between academic performance and behavioral state. In addition, different views can be interlinked, for example, the information about the community in each view will be highlighted when clicking on the community icon. “It is great to visualize the social network among students in an friendly interactive way for student management and decision-making.” However, some elevators also gave some valuable suggestions for improvement: 1) A calendar component should be embeded into the query module to allow users to flexibly select the time range, rather than be limited to only one semester. 2) It is necessary to make the feature symbols in the behavior feature matrix view more understandable. Currently, the meaning of these symbols is not easy to understand. 3) It would be convenient to provide a more diverse visual representation of the hierarchical community structure, such as tree structure diagrams, so that users can switch among different diagrams according to their preferences. These evaluators stated that if these details can be improved in the future, the system will be better overall.
In addition to interviews, each evaluator was asked to fill out the questionnaire. The statistical results of the questionnaire are shown in Table 2. It can be seen that 96.67% of evaluators are very satisfied or satisfied with the hierarchical hypergraph view, the proportion of educators who were either very willing or willing to use the system in their work was 53.33% and 33.33% respectively, and the average rate of “very satisfied” and “satisfied” was 45.74% and 50.06% respectively. Meanwhile, 4.20% of the evaluators also rated the system as “neutral” or “dissatisfied” due to some shortcomings in visual design and interactions. In summary, the interface of the system is aesthetically pleasing, the functionality is useful, and the operation is stable, which can well support the in-depth analysis of social relationships to meet the needs of student management.
Statistical results of system evaluation
ViSSR is designed to explore and understand the social relationships among students at campus. Four coordinated views, namely hierarchical hypergraph view, community analysis view, individual analysis view, and behavioral features matrix view, are designed to analyze the hierarchical community structure and social relationship of individual student. The system is highly rated by the educators, however, it also has some limitations that affect the usability of the system to some extent.
Lack of Learning Behavior. In this paper, a variety of daily life behavioral data produced at campus are collected to calculate the social intensity among students. However, this type of social relationships merely expresses the social status in life scenarios, it fails to take into account the collaborative learning relationships of students in learning scenarios. It is very important for students to find optimal learning partners to improve their academic performance. Therefore, it is necessary to integrate the learning behavior of students into the calculation of social relations.
Limited Hierarchical Hypergraph View Layout. The hierarchical hypergraph view is the core part of the system, which is used to display the social network of students and the hierarchical community structure. In the case study of 29 sample students, the network layout is neatly arranged, which enables users to clearly observe the overall social structure and the hierarchy of the communities. In the university where we conducted the experiment, the number of students in a class are usually below 50, so the layout and space of this view are sufficient to support the analysis of class social relationships. However, the network layout would become more and more chaotic with the increase of the number of students, because there will be more and more crossings on the edge of nodes. To solve the problem, there are two potential ways, one is to find a better network structure to clearly express the network in a limited space by reducing the edges crossing, and the other is to program a web page that can manually resize different parts to expand the hierarchical hypergraph view space.
Lack of Overall Behavioral Features of the Community. Through the visual system users can observe the community structure, the composition of community members, activity time distribution of community members, and the behavioral features of each community members. But the general behavioral features of each community are not expressed. So we should design several community behavioral features and express them in the form of radar charts, which enables users to intuitively observe the features of each community and compare the differences between different communities. Based on the information, users can better judge the quality of each community and know that how to make improvements.
Generalization of the Application. Although this paper focuses on the visual analysis of students’ social relationships at campus, the calculation method and visualization way of social relationships can be extended to various industrial parks. Managers can analyze employees’ social relationships for mental health monitoring and safety risk management.
Conclusion and future work
An interactive visual analysis system called ViSSR is proposed in this paper to help educators intuitively explore high-order community social relationships among students, understand their social characteristics, and give targeted suggestions for improvement. To carry out in-depth analysis, the Louvain algorithm was applied to discover the hierarchical community structure of the social network constructed based on the multisource life behavior data of students on campus, and then four linkage views were designed with various interaction techniques such as searching, filtering, clicking, checking, sorting and highlighting, to visualize the discovering results. Case studies and expert evaluation demonstrated that ViSSR can greatly improve the efficiency of students’ social relationship analysis, and provide valuable information for student management.
To further improve the system in future work, we plan to collect more types of behavioral data and analyze more types of social relationships such as learning relationship, entertainment relationship, consumption relationship, and introduce more visual interaction components.
Footnotes
Acknowledgments
This study was funded by National Key R&D Program of China (No. 2022ZD0117100), Beijing Municipal Education Commission (No. BDEC2023619085, No. BDEC2023619007), China Association of Higher Education (No. 2020XXHYB16), and Natural Science Foundation of Jiangsu Higher Education Institutions of China (No. 20KJB110026). We would like to thank the 15 volunteer teachers including Zhefeng An, Linqin Su, and so on, for their careful feedbacks regarding the usability of ViSSR, and the 29 students of the sample class for agreeing to participate in the study.