
Abstract
This research focused on Real-time MRI lung images that were revealed using three grade processes by manipulating nanophotonics components, mapping by deep learning, machine learning, and pattern recognition. This research is Solving Magnetic resonance imaging of interstitial lung diseases with Hybrid feedforward Deep Neural Network (ffDNN) and Convolutional Neural Network (CNN) architecture. The feedforward deep neural network (ffDNN) and Convolutional Neural Network (CNN) techniques are used to Solving Magnetic resonance imaging of interstitial lung diseases on the nanophotonics components, deep learning, and machine learning Platform. The Proposed semiconductor monolithic integration approach employed for bio-Magnetic resonance imaging characterization using photonic crystal “Symptomatic Image Revealing” details of the resonant monolithic. The proposed machine-learning-based approach revealed characterizing multi-parameter design space of nanophotonic components using Nano-optic imagers. The Pattern Recognition for MRI was performed for lower dimensionality. Finally, the Hybrid feedforward Deep Neural Network (ffDNN) and Convolutional Neural Network (CNN) architecture for calculating the height and size of scatterers using the inverse design of the meta-optical structure. The temporal resolution assessment of image data pixel size 280x360 hyperspectral imaging temporal resolution is 25, and magnetic resonance imaging temporal resolution is 50. The Image distribution shows that phase shift and transmission are 2.78 degrees and at 95%. The result for the inverse design using CNN returns the efficient inverse design of test data that can be designed according to the required pressure distribution. Wavelength 1000 nanometer to 1600 machine learning method absorbance 40% and ffDNN absorbance 33%.
Keywords
Introduction
Recently many diseases have increased among people. Among these diseases, lung cancer has increased nowadays. Here lung cancer has been detected using the images. The magnetic resonance imaging image has been used to analyse the convolutional neural network for managing lung cancer diseases. Analyzing the connection between the images of the lungs and the artificial nodes is the factor for evaluating the formation of lung cancer manages the formation. Also, the hybrid neural network for the fusion of the heterogeneous and the classification of the lung images has been proposed. Here the process of mapping the neural network and the diseases for maintaining the capturing the lung diseases is processed. Here machine learning is used in managing the decision recommendation and the input data. Here is the regression model for predicting accuracy using magnetic resonance imaging images. Here the tomography or MRI images have been analyzed to find the lung cancer, which helps find the affected region in the images, and the doctor makes this diagnosis. Also, the images are recognized by the pattern, and then the formation of the images is recognized using the images. These images have been analyzed, and then the process of recognition of the images is done using the analysis of the pattern recognition and the potential application for data classification of image data. Here the feature of managing the qualification of the object that generates the clustering and the representation of the computed references has been evaluated. The monolithic integration approach analyzes the device layer and the three dimensions of monolithic integration to find lung cancer. A crucial path to lowering costs in high-performance photonics is the monolithic integration of various photonic components. Because an application can be developed quickly using just one code base. The benefits of a monolithic design are as Simple deployment only requires one executable file or directory. Here this elaborates the strain driven for managing the elements to produce the feasibility of compound to integrate the mirror and the lenses for transmission of the detection. Here the monolithic integration and the frequency of variation related to the processing of the images are done using the process available to the innovation of the images given as the input. The signal processing from the variations in the images and the thickness is analyzed using the variation of the images to find the lung cancer. Also, the images used to find lung cancer using the broad spectrum by analyzing the colors from each pixel are identified. Then this process is used to monitor the images taken from CT or MRI images. Here the approach of monitoring the lungs’ images using light behavior is proposed. Here the process of managing rays from the images decides the monitoring of cancer in the lungs. The minute portion, which involves the detection of the cancerous pixel, is done using the emission of the light in the affected region.
Also, based on the wavelength, he re-emits light and the polarization of the accuracy in the patterns. He manages the system’s application to produce the accuracy for finding lung cancer. The light rays on the lung cancer images help find cancerous par in the sub-wavelength. The hybrid feedforward deep neural network manages the multilayer approximation of the deep learning model to manage the images of the lungs to analyze the multilayer analysis to get the recommended output. The study’s main objective is as follows: The analysis of lung cancer has been analyzed using the MRI images by the technique of pater recognition in machine learning.
Diagnosis of lung diseases using the component of Nanophotonic machine learning and deep learning. Also, the MRI images are used the analyze the technique of CNN and FFDNN. The paper’s section is divided as follows: The paper’s introduction is detailed in Section 1. The linked study, which consists of an examination of the previous paper, is written in Section 2. The techniques and findings were presented in part 3, and the conclusion and recommendations for further research were presented in Section 4.
Related review
Zhang et al. study about the high performance of the topological second-order makes the difference between the phC slabs, making the theoretical application for the multiple quantum values. This makes the nanoscale and the potential topology for managing the Nanophotonic devices [1]. This factor for applying the lasing behavior and the formation of the conventional demonstration carries on to the application of the current topology. Also, the factors affecting the topological nontrivial are proposed by enabling this in the currently proposed system. In this paper, simulation for FDTD and the reconfiguration behavior manages the natural geometry, which reduces the length and the computation resources and this manages the length reduction and the radius has been proposed and also making this method to implement in the currently proposed system the reconfiguration has been used for reconstructing the plasm fluidic lens.
Zhao et al. discussed that information processing, based on molecular devices, has been done using the single method of DNA origami platforms. Here propagation of the single molecular level for operating the possible illustration of the imaging has been proposed [2]. Also, the vertices manage the signal molecule’s formation and the system’s levels to proceed. This maintains the functional level of the molecule proposed. The automatic progression of origami has been maintained in this proposed system. The model dispersion of light model is used in the deep subwavelength, which manages the control of the local environment for the spectral detection here, the process of managing the resonant mode for providing the nanoscale for the proceeding of the subwavelength. MRIs are regarded as a non-invasive procedure because they don’t involve ionizing radiation. Instead, MRIs use radio waves as well as a strong magnetic field to take pictures of the structure of the brain. The MRI scanner is a metal cylinder surrounded by a strong magnetic environment. This maintains the formation of the optical technique to find the deep subwavelength, which manages the light dispersion. Also, in this currently proposed system, the process of managing the environmental factors for analyzing the Bloch modes.
Chao et al. discussed the detection of the virus using semiconductor Nanophotonics, and the detection of this virus in real-time is done [3]. Here the process of managing the innovative application for integrating the application of the Plasmon resonance for the semiconductor monolithic and the integration of the system is proposed. Here is the finding of the Nanophotonic system or the materials.
Sapienza et al. find the nanoparticle components, and the particle pattern is used for the recognition [4]. Here the process of managing the global and the factor for affecting the design for the operation of using the components and the behavior of the devices in the structural information for making the problem of the design and then the high dimensional particles manage the formation of the system to produce the structure limitations. By implementing this in the currently proposed system, the high dimension particles and the Nanoparticles among the structure have been proposed.
Lepage et al. discussed that the thin nanoparticle is found using the application of ranging medicines and the robots manage the image quality to produce the magnitude reconstruction of the met surface and the achieving for the most significant demonstration [5]. This application proposes the process of managing the operation simultaneously and combining the operation to produce the performance. This makes the finding of the small particles in the lens seem bigger.
Melati et al. discussed that the inverse design is based on the machine learning algorithm structured in the meta optical structure [6]. Here the process of managing the prediction of modeling is proposed. Here the process of desire the evaluation of the repetition and the scatters for managing the deep neural network and the convolutional network for the conventional intensive optimization and the approach of the prediction model has been proposed.
Singh et al. discussed the production of the meta-structure making with the application of the system which is used for deep learning and the Nanophotonic structure for the optimization and the process of machine learning and the efficient factors for focusing and the manipulation of the system to produce the high dimension atoms for the neural networking of the model prediction is elaborated [7]. Also, the nanoparticles are produced to form the system’s innovation for correlating the high coefficient of the data.
Wolff et al. discussed the optical coupling that is the vdW and 2D makes the process of physical for the scattering for polarization Plasmon for managing the parameters of the moderate temperature for the continuous stroke signal for the physical process for combining the managing factor for the two-dimensional data flow for the continuous achievements. Using this in the currently proposed system, the formation of the nanoparticles and the analysis are proposed using the fermi level [8].
Semiconductor monolithic integration
Interstitial Lung Disease (ILD) is a type of lung disease that states a large group of disorders that produce a high risk of progressive fibrosis in tissues of the lungs and affects the breathing ability and insufficient oxygen supply to bloodstreams. Interstitial lung disease has no known treatment. The goal of ILD treatment is often to treat the underlying condition while also reducing your symptoms. Finding out how much lung damage interstitial lung disease has caused can be done with the aid of a high-resolution CT scan. It can provide fibrosis specifics, which can aid in determining the diagnosis and determining the best course of treatment. This disease can be managed by evaluating the disease and improving patient care [15]. After evaluating the MRI, this can be manually made by health professionals, but it might not be accurately detected due to the visibility of fibrosis; thus, it increases the risk hence to revealing the disease found in the lung in a system with deep learning and machine learning approach has been designed. A deep learning approach that can be used to identify diseases. It can produce a more precise forecast result. However, employing ML-enabled technologies to analyze medical data and images, machine learning in healthcare can be used for better diagnosis. MRI Magnetic resonance imaging lung provides a clear image of abnormal tissues and is better for viewing soft tissues like tendons and ligaments. In the first-grade image analysis method based on the disease symptoms, only a particular portion of the lung is taken to detect changes. The segmentation system has several stages that it goes through before achieving its goal, which is to segment the lung tumor. Patients with lung cancer most frequently have PET and CT scans. To extract useful information from an image, image analysis entails breaking it down into its basic elements. The tasks that can be incorporated in image analysis include identifying shapes, recognising edges, removing noise, identifying items, generating data for texture analysis, and determining the image’s quality. A photonic crystal is a device that might be used for sensing MRI of humans to characterize variations found in the tissues, cells, neurons, or organs of humans by sensing the regions with (RI) Refractive Index. The interaction of light with MRI of the lung is analyzed based on the distance from the interface at the time of evanescent wave reflection for sensing the affected region. Devices are wirelessly powered using evanescent wave coupling. Light sources near a surface are excited by total internal reflection’s evanescent wave in total internal reflection fluorescence microscopes. When studying the surface characteristics of biological samples, this is helpful. Evanescent waves are electromagnetic energy-based objects that are unable to spread or maintain a resonance. These waves are formed when sinusoidal waves are reflected internally to the interface at an angle more significant than the critical angle; thus, total internal reflection is formed. The image color at the right determines the instantaneous electric field magnitude of incident light [24].
With the microfluidic channel using PDMS material, In order to create devices with specific microstructures, the silicone elastomer polydimethylsiloxane (PDMS) is most frequently utilized in micro fluidic or lab-on-a-chip applications. As an elastomer with little shrinkage during cure (about 1%) and outstanding elastic characteristics, PDMS is renowned for its mold-release capabilities and capacity to copy features down to the nanoscale. The characteristic of MRI is analyzed to sense the particular region. Photonic equipment used for testing is a tunable laser source A laser that has fine control over its operating wavelength is said to be tunable. Despite the fact that all laser gain medium enables small changes in output wavelength, only few types of lasers can be continuously tuned over a significant wavelength range. and OSA Optical Spectrum Analyzer for measuring photonic crystal-based biosensors for monitoring and characterizing the changes found from analysis. At the sensing region with a photonic crystal, if any changes of RI are detected, the sensing region shifts to the OSA. In the bio-sensing system, fundamental components should be arranged together for optical sensing [16]. In order to interact with the target analyte and produce a signal, biological sensing components are used. Using optical biosensors, a wide range of analytes such as viruses, toxins, medicines, antibodies, cancer biomarkers, and tumor cells, may be sensitively and precisely detected. Thus, it is a combination of electronic and photonic components to form a complete system. Resistors, transistors, and other circuitry are all included in an integrated circuit (IC). They work together as a single, compact unit to carry out the desired electronic function. The photonic component contains the light source, photodetector, and optical biosensor, whereas electronics components are TIA TransImpedance Amplifier, ADC, and DSP units. Photonic devices have been used with quantum imaging and sensing methods to process quantum information. Monolithic integration is the higher-level method for implementing quantum information processing based on a photonic crystal. A circuit or collection of circuits constructed from a single silicon piece. Whereas, quantum computing has the potential to transform computation by solving some classically unsolvable problems. In the monolithic integrated semiconductor system, all the components for processing are combined in semiconductor chips. The different element communication occurs through on-chip optical channels and intra-chip optical links when possible [23].
Integrating the photonic crystal bio-sensor monolithically with the photonic detector when the detector finds the changes in refractive index surrounding the electrical signal shifts to the peak is obtained using a single chip design. As a Photonic crystal has the collection of components to simulate the monolithic integration of 1D photonic crystal to silicon photodetector, a schematic is drawn on numerical interconnection, which has the compact model of the photodetector. To test the integrated symptomatic image, the wave laser is continuously used as a light source, It is continually pumped and emits light, according to continuous-wave functioning. While the average power of pulsed lasers is very low, their peak power can be very great. The processes in this method include stimulation by pumping light, fluorescence, the start of stimulated pollutants development of stimulated emission towards along the center of the substrate, ongoing intensification by stimulation pollutants then outputting from laser and the electrical power meter is fixed after the photodetector component for monitoring the electrical signal’s peak. Sensors called photodetectors are capable of converting light’s photon energy into an electrical signal. where the utility will send out a meter reader to record your usage and the electrical power meter checks your daily use of gas or electricity. Thus to evaluate the MRI with symptomatic image extracted N-parameters from the numerical FDTD, which is the standard for modeling the Nano-photonic device, process and materials were simulated to increase the performance of the system by uploading the MRI of a healthy lung into 1D component of photonic crystal then responsive values and current dark values are set to the components of the photodetector. Photons travel via optical elements like polarizers, phase, and waveguides, which are analogous to transistors, resistors, and electrical wires. Now the laser source is set as reference power as 0 DBM and swept through wavelength. The silicon photonic method is designed and begins with the device level and moves to the photonic crystal level simulation [32]. Due to its high index of refraction and low infrared loss, silicon is a significant optical material that is frequently employed in integrated photonics applications. PICs may use less energy and produce less heat than traditional electronic circuits, which holds up the possibility of bandwidth scalability that is less power-intensive. The simulation in RI indicates the changes during region sensing of 1D photonic crystal biosensor by analyzing input MRI data and healthy lung MRI which is provided to the 1D component for identifying the changes by comparing those MRI data [13]. The output generated using this method represents helpful and effective in solving the problematic bio-sensing processing through MRI.
Hyperspectral-imaging (HSI) technology
Hyperspectral imaging collects information from the electromagnetic spectrum; this technology aims to get the spectrum for pixels in an image to find the disease pattern or detect the changes in the given MRI data. This method is primarily used in medical diagnosis by collecting the information from real-time images and spectral information of tissues [5]. The increased resolution of hyperspectral images is helpful in a detailed analysis of the whole lung for ILD diseases and other lung diseases with the Hyperspectral imaging scanner method. HIS is a method for sensing spectral in which a lung from MRI is photographed using different optical bands in the higher spectral range. The term “optical bands” refers to a section of the optical spectrum set aside for optical fiber communications. Moreover, the optical spectrum is separated into three bands: infrared (IR), visible (visible), and ultraviolet (UV), which range in wavelength from longer (lower frequency) to shorter (higher frequency). The MRI images are differentiated based on the spectral and spatial resolution [22]. Before analyzing the image, the lung segmentation is based on the split ring resonator in different shapes like circles, hexagons, pyramids and so on because of the lung size for the verification process. It is produced artificially at the time of analysis. The lung structure in MRI is covered based on the shape of the resonator for the analysis process that provides an effective diagnosis result. The image analysis is used to extract the information from a hyperspectral dataset containing many medical data about tissues. These cellular and molecular levels are essential for diagnosing the disease.
Potentially more diagnostic information is gathered using hypercube with higher spectral and spatial resolutions. Finding the changes and classifying the affected part is difficult; thus, with the information of spatial and spectral data, an advanced image classification method is used in hyperspectral datasets is necessary to extract and classify the changes observed using spatial information [9]. Because of the great latitude and uniqueness of the hyperspectral images, feature extraction from hyperspectral data is very challenging in HyperSpectral-imaging technology. The spatial resolution analyses the geometric relationship of image pixels to each other. The numerous types of images include image nature, image size, image direction, and image position. Based on the construction of imaging sensors, spatial characteristics of an image are involved. The spectral resolution states the difference within image pixels as a function of wavelength. There are two spatial dimensions for Hyperspectral images, namely
To know about hyperspectral-imaging technology, initially, we must know about color digital imaging technology. Light wavelength is represented in the colors red, green, and blue. Red has a wavelength of 650 nm, green has a wavelength of 520 nm, and blue has a wavelength of 475 [18]. Each color image has these three types of colors concerning wavelength. Generally, human eyes are more sensitive and contain three cones sensitive to the light spectrum. The cones have related colors based on the solid and weak light-emitting wavelengths. Combining the three cones’ information, we make the color image of the lungs. Whenever light of a certain wavelength penetrates the eye and contacts the cones of the retina, an enzyme reaction that results in an electrical impulse being sent by fibers towards the brain is activated. In a digital picture that aims to mimic the sensibility of the cones, a pixel preserves the incorporated brightness of either the blue, green, or red portion of the light bandwidth, according to the kind of filter used in front of the image [25].
The hyperspectral-imaging technology is used to get the spectrum of pixels in an image to find the changes in the given MRI data. Initially, it passes the light beam throughout the image via the convex grating. Diffraction is the term for the light waves spread out around any obstruction. Colors are separated from light as it passes through the diffraction grating’s myriad tiny apertures. Then we produce the narrow wavelength from light, which is recorded on the light-sensitive chip, after assigning the colors to each pixel of images. The lower value of the resolution limit caused by the narrower light wavelength results in a clearer image the narrower the distance between two specimens or objects. An electrical chip known as a CMOS sensor transforms photons into electrons for digital processing. Red, green, and blue light each penetrate silicon at a different depth, therefore layers of pixels are placed in silicon to benefit from this feature. The image acquisition process is performed. Then we can improve the quality of the image. A finite patch of lung image is captured using a Nanophotonic device [20]. When the size of the patch or background is smaller, the details interpreted from the observed part of the MRI are higher. A piece of important information about changes in the lung can be extracted when a spectrum of a single pixel in a hyperspectral image is determined. The two main problems are price and complexity. Hyperspectral data analysis requires quick processors, sensitive detectors, and vast data storage capacity. And, due to their ability to acquire narrowband information, they can provide comprehensive information about any object. Fine spectral resolution provided by hyperspectral sensors enhances accuracy. After the image analysis, when the change is detected, the particular part is extracted as abnormalities; otherwise, the observation is continued [12]. A vector space that is totally contained within another vector space is known as a subspace. A subspace is ineligible to be located in a subspace of a lower dimension. This sub-space may be mapped orders of magnitude more quickly than the original design space because computing effort increases exponentially with dimensionality, making it possible to efficiently evaluate and visualize any number of performance criteria. The association between an initial sparse collection of optimised designs is discovered using pattern recognition by drastically reducing the number of characterising factors. This defines a lower dimensional design sub-space that can be mapped orders of magnitude quicker than the original design space. Visualizing the behaviour for various performance criteria reveals how the design factors interact, draws attention to structural and performance constraints, and stimulates fresh design concepts [26]. Synthetically construct short axis CINE MRI using a generative adversarial model to add more cases with reduced ejection fraction to the existing data sets, which are mainly composed of healthy participants. For assessing heart function, cardiovascular magnetic resonance imaging (MRI) is regarded as the gold standard. In order to assess cardiovascular disorders, it is necessary to estimate the ventricular end-systolic and end-diastolic volumes, stroke volume (SV), and ejection fraction (EF) using cardiac MRI. This process normally calls for thorough and accurate contouring of the ventricles [19].
MRI is a technique to give images of the human body using a magnetic field with computer-generated radio waves. To create multi-parameter photonic devices, we employ machine learning for identification of patterns. Here we are mapping the design space of nanophotonic components, and the first step is to sample the N-dimensional space for the photonic device, which has various parameters as
Machine-learning-based for characterizing multi-parameter
A magnetic field and radio waves produced by a computer are used in the medical imaging technology known as magnetic resonance imaging (MRI) to provide precise pictures of the body’s organs as well as tissues. It does not capture a single organ. It collects the entire body organ, but the systematic process takes the particular part or organ to detect the changes that produce high risk. The tool of systematic risk management aids in risk control for construction projects. Its goal is to present an easy-to-use technique for knowing how to detect, evaluate, monitor, and manage risk in an organized manner. A full-body MRI scan can assist identify internal bone and joint disorders, spinal issues, aneurysms (blood artery blockages), and potential cancer tumours. Because teeth and bones contain so little water, they are not visible on an MRI. Here, a machine learning method is used to detect multiple parameters, i.e., multiple organs, by identifying the feature of the input MRI data. For the searching and analysis process, a split ring resonator is used to evaluate each part of input data based on the various shapes, which is applied in multi-parameters for finding the features of multiple organs using ML techniques [14]. Contrarily, the geometric characteristics of an organ’s constituent pieces, excluding its size, are referred to as its shape. The relative position of homologous characteristics, often known as milestones, scattered across the organ is frequently used to define organ morphology. These shapes are used for finding the change in the pattern by comparing the healthy dataset for the changes in lungs and other organs found in the input MRI data. CNN does the ML-based image recognition method, the most popular model for image classification and identification. Classification problems can be solved using a variety of methods, including classification trees, support vector machines, discriminant analysis, logistic regression, neural networks, random forests, deep learning techniques, boosted trees, closest neighbors, and more. The capability of machine learning to detect, quantify, and evaluate tumors using data from medical images can aid with the early detection of cancer. This helps to understand the image and helps to improve the time taken to learn the required amount of data for training the model process. CNN uses weights at small patches of images instead of a fully connected network of each pixel. The feature extraction transforms the raw data for the classification process. A vector is extracted using the feature extraction and then mapped to extract the confidence of the score using the classifier [11].
Machine-learning-based for characterizing multi-parameter processing flow.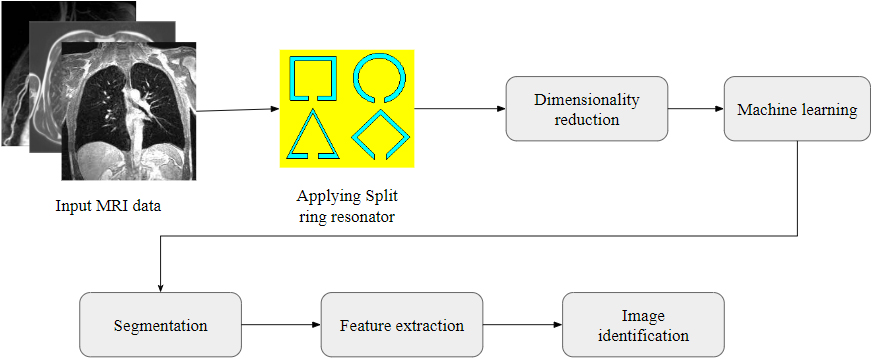
Figure 1 discusses that Magnetic resonance imaging is a non-invasive technology that creates a detailed 3D anatomical image [10]. Outliers must be removed because they indicate measurement errors, problems with the data entry or processing, or insufficient sample. In contrast, eliminating the outlier results in a stronger correlation. The whole lung is examined by real-time MRI lung images revealed using hybrid feedforward deep neural network and convolutional neural network and half Fourier acquisition single-shot turbo spin-echo and Volumetric Interpolated Breath-Hold (VIBE) examination. The real-time MRI lung images revealed using hybrid feedforward deep neural network and convolutional neural network are applied before the injection of the contrast agent, and the VIBE is applied after the injection of the contrast agent at a rate of 3 mL/sec in the MRI. A relatively new gradient-echo MR sequence called volumetric interpolated breath-hold examination (VIBE) has been claimed to be helpful for imaging the brain and the abdomen since it can cut down on acquisition durations. It offers image quality on par with that of traditional two-dimensional gradient-echo images that are rich in fat. For each image, when the lesion is detected, we process and diagnose the stages of the lesion based on the below consideration. Otherwise, if the lesion is not detected, we can have the input image as a healthy lung image [31].
When we find the lesion in the neck or abdomen or extrapulmonary area, we might know abnormality in the extrapulmonary. When the pleural thickening is founded in the MRI image, we may know lung abnormality’s clinical significance. The below-stated considerations are more suspicious of the lung nodules [27]. When the lung nodules are measured as lesser than 0.5 cm, and the well-defined border is visible only by volumetric interpolated breath-hold and not by half Fourier acquisition single-shot turbo spin-echo, then we might know the lesion becomes probable of benignancy. When the lung nodules are measured are lesser than equal to the 0.5 cm and have a mild irregular border, the lesion is visible only by volumetric interpolated breath-hold and not by half Fourier acquisition single-shot turbo spin-echo, then we might know the lesion becomes the malignancy. Similarly, when the lung nodules are measuring less than equal to the 0.5 cm or the lesion is visible only by volumetric interpolated breath-hold and not by half Fourier acquisition single-shot turbo spin-echo, then we might know the lesion becomes the possible malignancy [30].
Machine learning is an effective method for pattern recognition for predicting lung disease after an analysis process, and it produces the result prediction very close to the accurate result. The prediction accuracy is based on training datasets provided to learn about the lung pattern and find the changes in the pattern for diagnosis. Pattern recognition is a method of data analysis that uses a machine learning approach to recognize patterns automatically after the analysis process. To lower the variance of predictions and lower generalization error, ensemble learning integrates the predictions from various neural network models. Averaging numerous models is the most popular way to combine models, and using a weighted average increases accuracy. Concatenation, boosting, and bagging are further techniques for combining deep learning models. The process of categorising data according to the model built from training data, which then recognises patterns and features from the patterns [28], is known as pattern recognition. Divide the data into data sets for training and testing before analysis. In this method, a set of training data is used to train an algorithm labeled to train the system for pattern recognition; these labels are attached to the particular input used to generate pattern-based output. The training algorithms match the given image input data for decision making. This uses the information collected from the data for the result generation process. The testing data set is used to validate the system’s accuracy; this dataset is used to check whether there are changes in lung patterns. Before pattern recognition, segmentation and classification is a critical process to identify which part of the lung to be recognized. Here, the output of the three-grade process is provided as input to the system to increase the prediction rate [29]. SVM Support Vector Machine is effectively used in pattern recognition with its capacity to classify unsimilar patterns from the input. SVM is a method mainly designed for binary classification for pattern recognition to reduce the risk of Interstitial Lung Disease. Long-term exposure to dangerous substances like asbestos can lead to interstitial lung disease. Interstitial lung disease can also be brought on by some autoimmune conditions, such as rheumatoid arthritis. But occasionally, the root causes are still a mystery. Scarring of the lungs is typically permanent once it has started. Management of underlying diseases and avoiding breathing in dangerous substances can lower your risk of ILD. Prevent exposure to dangerous substances like asbestos, metal dusts, or chemicals, or use a respirator (a mask that filters airborne particles). The information from the training dataset makes the classification process faster than the empirical risk minimization method. SVM is the set of supervised learning methods which makes the classification and regression analysis based on pattern recognition [15]. The linear classifier is used to predict each member of the input class between two possible classifications that build a set of hyperplanes for input classification in a high-dimensional space. We perform the SVM classification to classify the image query with the training dataset, where a hyperplane is used to separate various classes. The testing MRI data is projected into the same space and is classified based on the test object of the hyperplane. The RBF kernel states the high dimensional input projection with distance function D
where Cr
otherwise, the parameters
The Hybrid Convolutional neural network (HCNN) is a type of neural network that produces higher prediction results than CNN. The CNN is used for image recognition processes with a larger dataset of images. It can learn basic filters automatically and is combined hierarchically to learn latent concepts for pattern recognition. HCNN contains N number of layers in convolution, downsampling layers, a layer of non-linearity, and a fully connected layer. It passes through the convolution layer, consisting of several filters to classify the input image. The recognized patterns are inputted to HCNN to find the height and size of any defect, which is identified through a machine learning method [25].
A global optimum is the minimum or maximum of the objective function for the entire input search space. Global optimization, where the algorithm searches for the global optimum by employing mechanisms to search more significant parts of the search space. An objective function may have one or more global optima; if there is more than one, it is referred to as a multimodal optimization problem. Each optimum will have a different input and the same objective function evaluation. Global Optimization: Locate the optima for an objective function that may contain local optima. An objective function always has a global optimum, although it may also have local optima that have an objective function evaluation that is not as good as the global optima [32]. Global optimization or global search refers to searching for the global optima.
The presence of the local optima is a significant component of what defines the difficulty of a global optimization problem, as it may be relatively easy to locate a local optimum and relatively complex to locate the global optima. The global optima may be the same as the local optima, so it would be more appropriate to refer to the optimization problem as local optimization instead of global optimization. A global optimization algorithm, also called a global search algorithm, is intended to locate a global optimum. It is suited to traversing the entire input search space and getting close to the extrema of the function. Global optimization is used for problems with a small number of variables, where computing time is not critical, and the value of finding the truly global solution is very high. Global search algorithms may involve managing a single or a population of candidate solutions from which new candidate solutions are iteratively generated and evaluated to see if they result in an improvement and are taken as the new working state [30].
Result and discussion
Multilayer perceptrons are the quintessential deep learning models. The feedforward deep neural network is used to learn independent variables and the relationship between serving as inputs to the network and dependent variables designated as outputs of the network. The goal of a feedforward network is to measure approximate some function f*. A convolutional neural network (CNN) is used in image processing and recognition, specifically designed to process pixel data, and is a type of artificial neural network. The proposed set is used to focus on Real-time MRI lungs images revealing using three grade process by manipulations of nanophotonic components mapping by deep learning and machine learning pattern recognition to Solving Magnetic resonance imaging of interstitial lung diseases with Hybrid feedforward deep neural network (ffDNN) and convolutional neural network (CNN) architecture. This system research result is Solving Magnetic resonance imaging of interstitial lung diseases.
The test error estimating individual design parameters obtained from the best performing CNN
The test error estimating individual design parameters obtained from the best performing CNN
Table 1 gives the analysis of the test error estimating individual design parameters obtained from the best performing convolutional neural network; the design parameter is
Figure 2 discusses the test error of the design parameter
Analysis of nanophotonic size obtained using CNN based on the design parameter
Temporal resolution assessment Analysis of measured data based on image pixel
Analysis of test error of design parameter with CNN.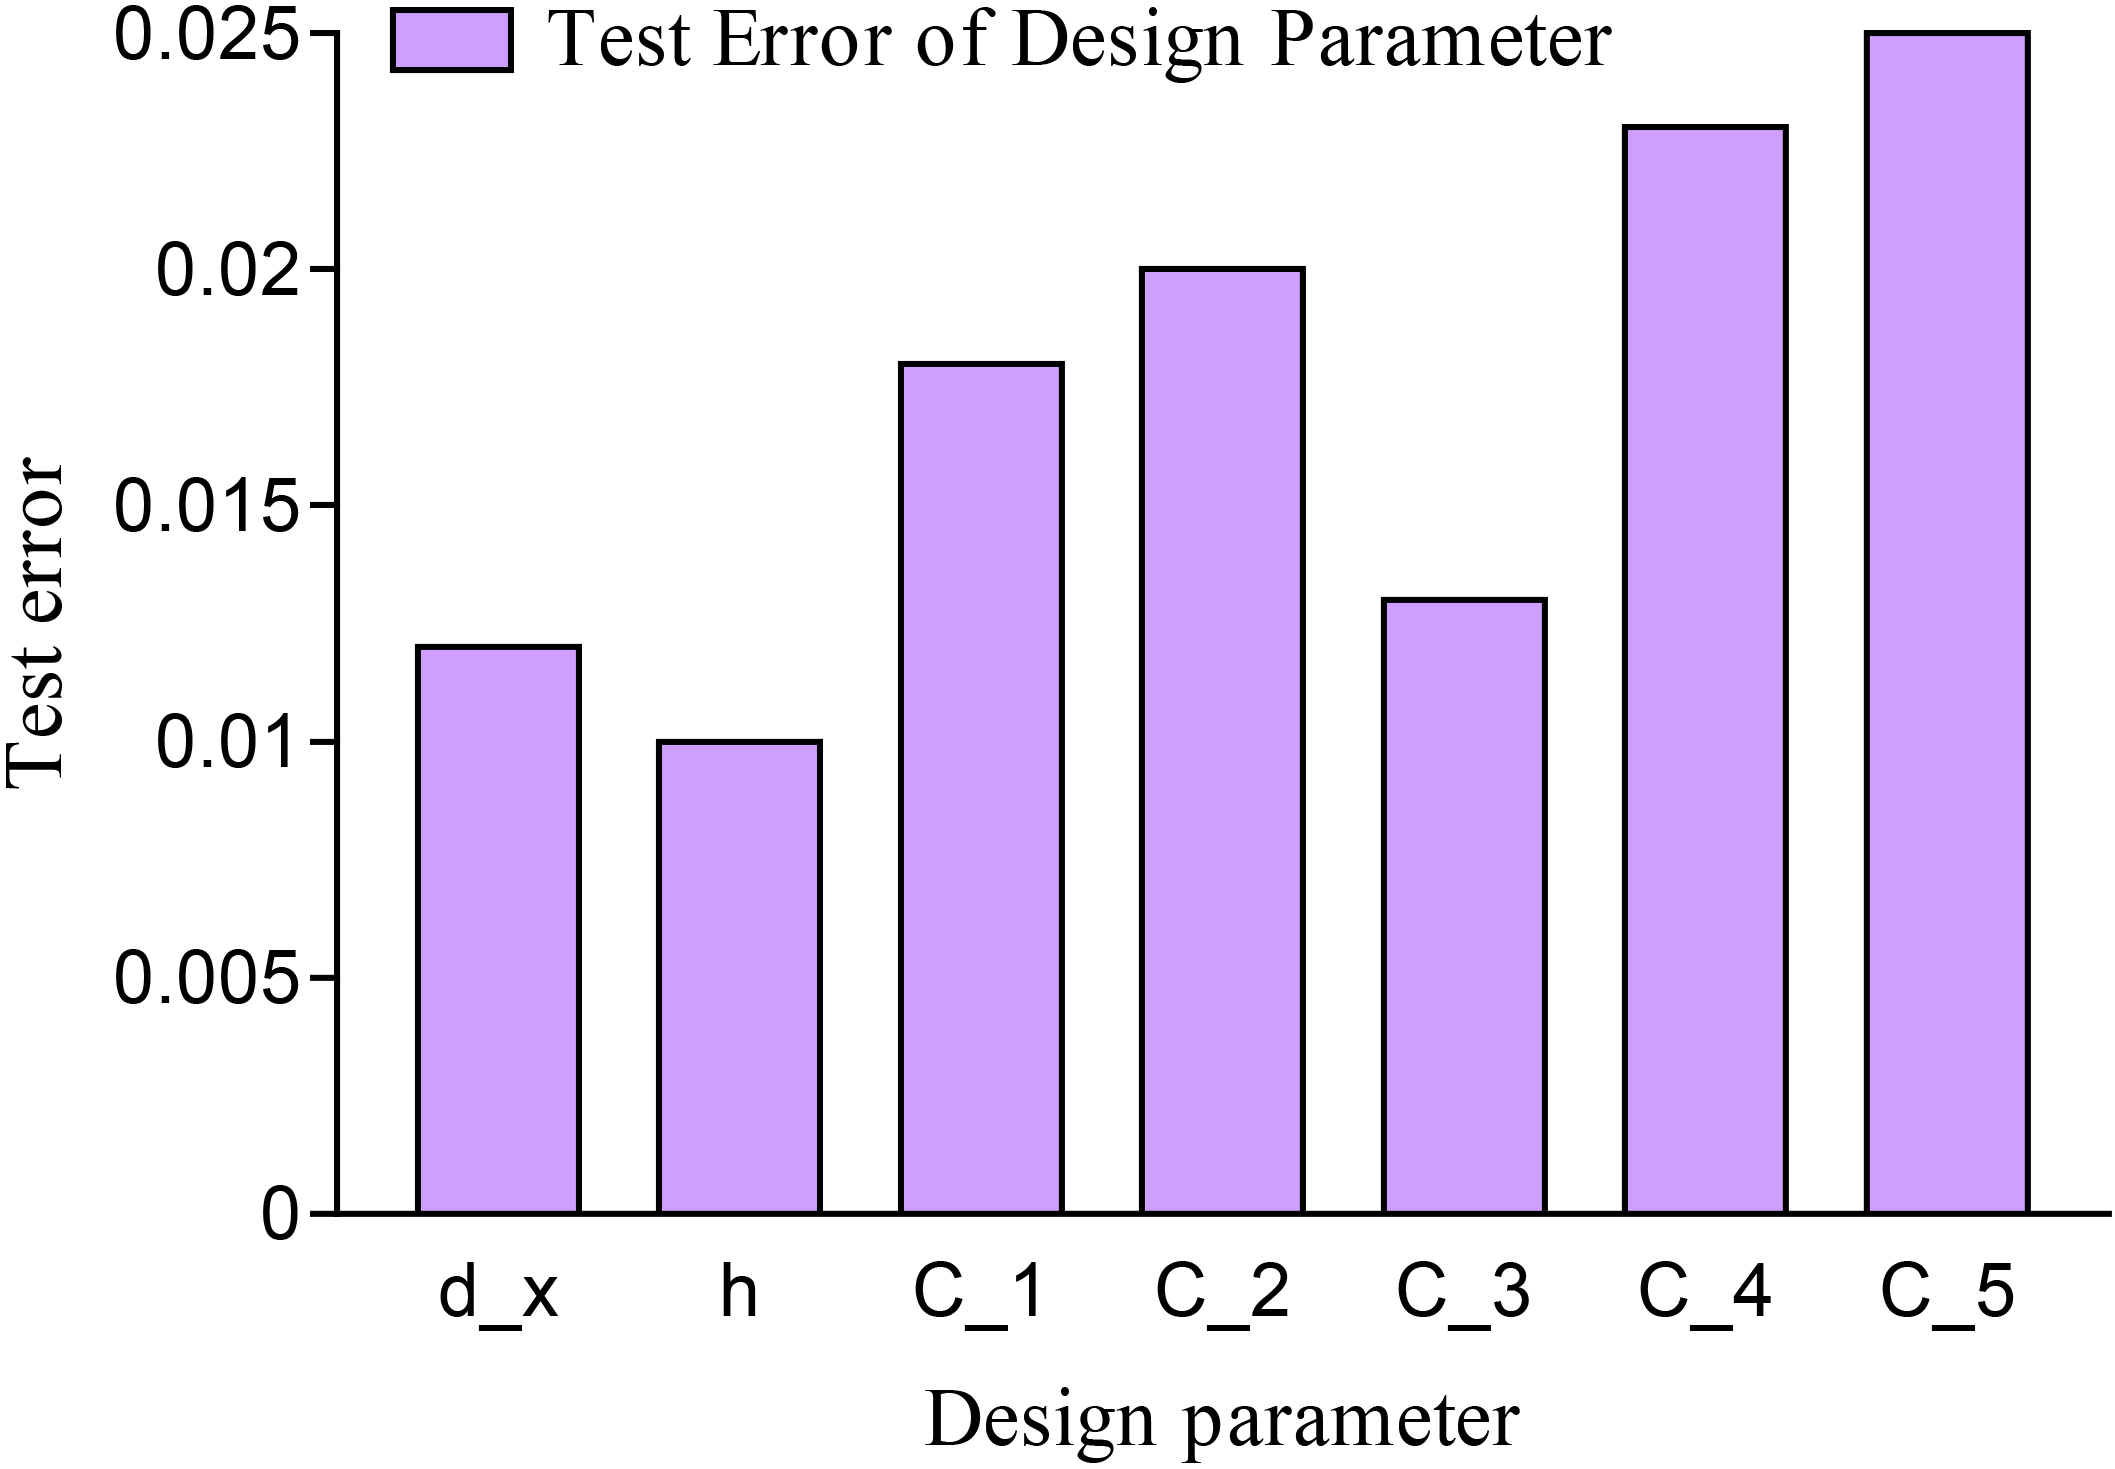
Analysis of nanophotonic size obtained using CNN.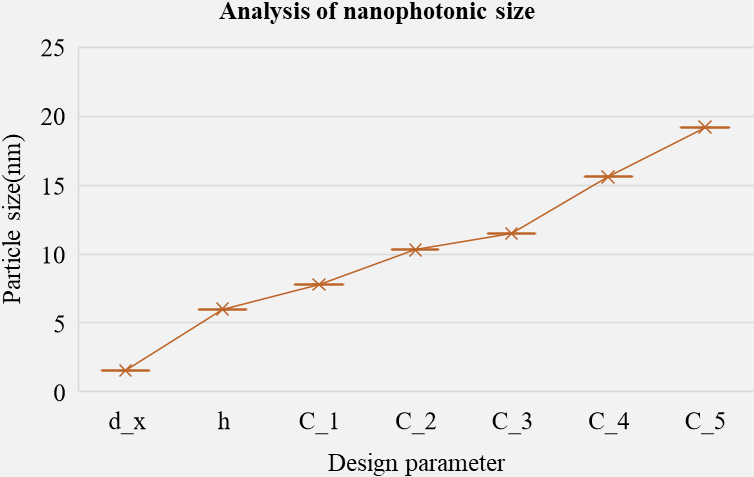
Temporal resolution assessment analysis of measured data.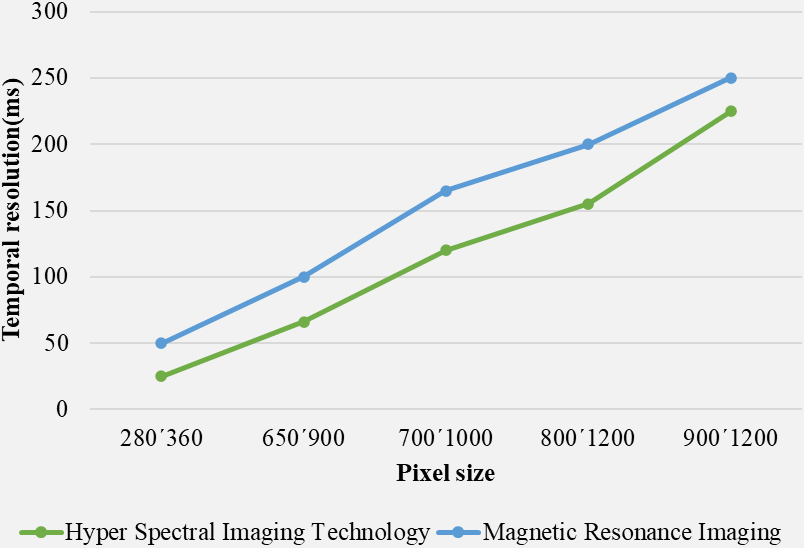
Table 2 gives the analysis of the nanophotonic size obtained using a convolutional neural network based on the design parameter
Figure 3 discusses the analysis of nanophotonic size design parameter
Table 3 gives the analysis of the Temporal resolution assessment of measured data based on image pixel time integration, monitoring the photodynamic imaging process. As medical applications are numerous and technical solutions are easily accessible, the most time-consuming part is dataset building (data collection and curation of structured or unstructured data), followed by model fine tuning through hyperparameters optimization. Temporal resolution is higher, and the time of distance shorter between the acquisitions images. Within the area, the time of distance between the acquisition of two images information.
Figure 4 discusses the temporal resolution assessment of image data pixel size 280
The image distribution analysis of phase shift and transmission
Table 4 gives the analysis of the image distribution and shows phase shift and transmission, The distribution of a digital image is a distribution of its discrete intensity levels in the range. A phase-shifting transformer is a specialized type typically used to control active power flow on phase electric transmission networks. It regulates the voltage phase angle difference between two system nodes.
Figure 5 discussed about the image distribution transmission is 87%, and the phase shift is 1.23 degrees, transmission is 89%, the phase shift is 1.45 degrees, transmission is 90%, and the phase shift is 1.67 degrees, transmission is 92%, and the phase shift is 1.89 degree, transmission 93%, and the phase shift is 2.3 degree, transmission 94%, and the phase shift is 2.78 degrees. Transmission is 95%, and the phase shift is 3 degrees.
The test result from the analysis of inverse design by using CNN based on wavelength and absorbance
Image distribution showing phase shift and transmission.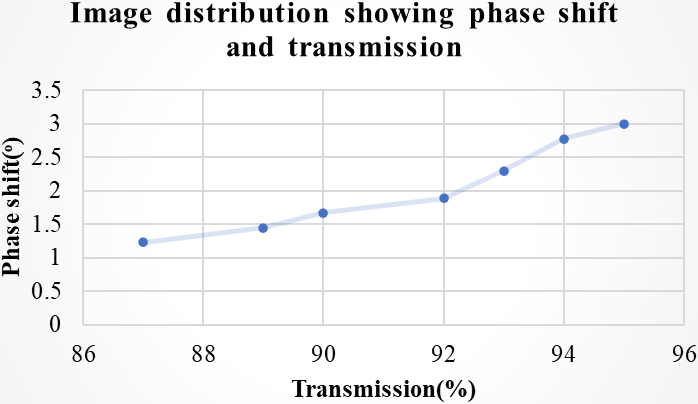
Table 5 The test result analysis for the inverse design uses CNN based on wavelength and absorbance; wavelength is the distance between identical points adjacent crests in the adjacent cycles of a waveform signal propagated in space or along a wire. In wireless systems, this length is usually specified in nanometres. Absorbance is the quantity of light absorbed by a solution. Transmittance is the quantity of light that passes through an explanation.
Figure 6 discusses the Wavelength 400 nanometers to 1000 machine learning method absorbance of 28% and ffDNN absorbance of 19%. Wavelength 1000 nanometer to 1600 machine learning method absorbance 40% and ffDNN absorbance 33%. Test result for the inverse design using a convolutional neural network, the efficient inverse design of test data that can be designed according to the required pressure distribution.
The inverse design analysis of meta-optical structure via CNN
Analysis of test result for the inverse design by using CNN.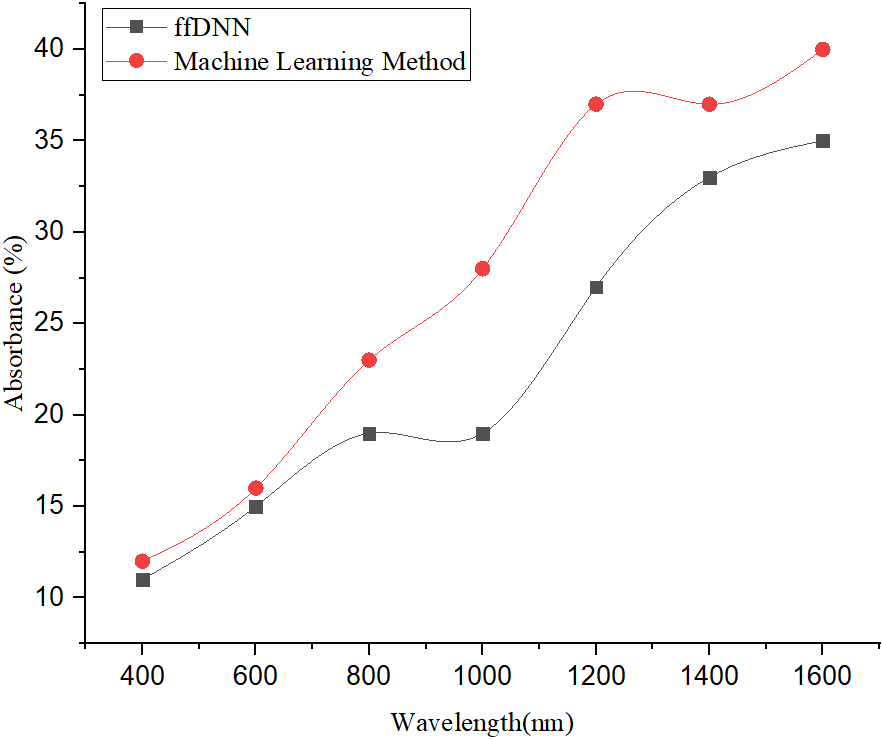
Analysis of Inverse design of the meta-optical structure.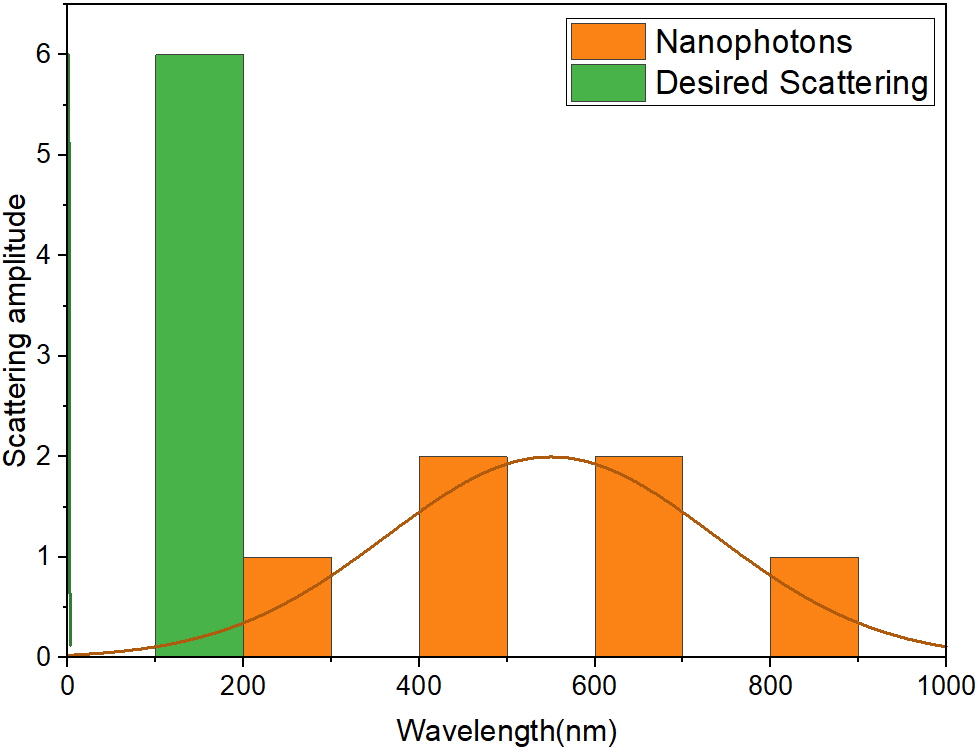
Table 6 gives the analysis of the inverse design of the meta-optical structure via CNN; meta-optics is a revolutionary new flat lens technology that uses meta optics for sensing and imaging in consumer requirements. Wavelength 300 nm scattering amplitude is 0.12, Wavelength 400 nm scattering amplitude is 0.18, Wavelength 500 nm scattering amplitude is 0.34, Wavelength 600 nm scattering amplitude is 1.38, Wavelength 700 nm scattering amplitude is 1.42, and Wavelength 800 nm scattering amplitude is 1.5.
Figure 7 discusses the Inverse design of the meta-optical structure, wavelength 0 nanometer to 200 nanometers, desired scattering amplitude is 6, and nano photon scattering amplitude is 0. wavelength 200 nanometer to 400 nanometers, nano photon scattering amplitude is 1. wavelength 400 nanometer to 600 nanometers, nano photon scattering amplitude is 2.2. wavelength 600 nanometers to 800 nanometers, nano photon scattering amplitude is 2.7. wavelength 800 nanometers to 1000 nanometer, nano photon scattering amplitude is 1.2.
In the above proposed real-time MRI lungs images revealed using three grade process by manipulations of nanophotonics components mapping by deep learning and machine learning and pattern recognition used the five algorithms to solve magnetic resonance imaging of interstitial lung diseases with Hybrid Feedforward Deep Neural Network (ffDNN) and convolutional neural network (CNN) architecture. The bio- Magnetic resonance imaging characterization Algorithm is used for characterization purposes. The hyperspectral-imaging technology Algorithm was used for the characterization study. The characterize multi-parameter design space of nanophotonic components Algorithm for characterizing nanophotonic components. Pattern recognition Algorithm was used to compare the three-level using the Hybrid feedforward deep neural network (ffDNN) and convolutional neural network (CNN) algorithm, and Machine Learning (ML)-based method for the inverse design of the meta-optical structure. The final result should return the temporal resolution assessment of image data pixel size 280x360 hyperspectral imaging temporal resolution is 25%, and magnetic resonance imaging temporal resolution is 50%. The image distribution shows that phase shift and transmission are 2.78 degrees and at 95%. The result for the inverse design using CNN returns the efficient inverse design of test data that can be designed according to the required pressure distribution. Wavelength 1000 nm to 1600 nm on the machine learning method absorbance 40% and ffDNN absorbance 33%.
Funding
No funds, grants were received by any of the authors.
Data availability
All data generated or analysed during this study are included in the manuscript.
Code availability
Not applicable.
Author’s contributions
All authors contributed to the design and methodology of this study, the assessment of the outcomes, and the writing of the manuscript.
Footnotes
Conflict of interest
There is no conflict of interest among the authors.