
Abstract
Breast cancer poses a significant threat to women’s health, emphasizing the crucial role of timely detection. Traditional pathology reports, though widely used, face challenges prompting the development of automated Deep Learning (DL) tools. DL models, gaining traction in radiology, offer precise diagnoses; however, issues with generalization on varying dataset sizes persist. This paper introduces a computationally efficient DL framework, addressing dataset imbalance through a hybrid model design, ensuring both accuracy and speed in breast cancer image classification. Proposed model novel design excels in accuracy and generalization across medical imaging datasets, providing a robust tool for precise diagnostics. The proposed model integrates features from two classifiers, Inception ResNet V2 and Vision Transformers (ViT), to enhance the classification of breast cancer. This synergistic blend enhances adaptability, ensuring consistent performance across diverse dataset scales. A key contribution is the introduction of an Efficient Attention Mechanism within one of the classifiers, optimizing focus on critical features for improved accuracy and computational efficiency. Further, a Resource-Efficient Optimization model through feature selection is proposed, streamlining computational usage without compromising accuracy. Addressing the inherent heterogeneity within classifiers, our framework integrates high dimensional features comprehensively, leading to more accurate tumor class predictions. This consideration of heterogeneity marks a significant leap forward in precision for breast cancer diagnosis. An extensive analysis on datasets, BreakHis and BACH, that are imbalanced in nature is conducted by evaluating complexity, performance, and resource usage. Comprehensive evaluation using the datasets and standard performance metrics accuracy, precision, Recall, F1-score, MCC reveals the model’s high efficacy, achieving a testing accuracy of 0.9936 and 0.994, with precision, recall, F1-score and MCC scores of 0.9919, 0.987, 0.9898, 0.9852 and 0.989, 1.0, 0.993, 0.988 on the BreakHis and BACH datasets, respectively. Our proposed model outperforms state-of-the-art techniques, demonstrating superior accuracy across different datasets, with improvements ranging from 0.25% to 15% on the BACH dataset and from 0.36% to 15.02% on the BreakHis dataset. Our results position the framework as a promising solution for advancing breast cancer prediction in both clinical and research applications. The collective contributions, from framework and hybrid model design to feature selection and classifier heterogeneity consideration, establish a holistic and state-of-the-art approach, significantly improving accuracy and establishing optimization in breast cancer classification from MRI images. Future research for the DL framework in breast cancer image classification includes enhancing interpretability, integrating multi-modal data, and developing personalized treatments.
Keywords
Introduction
When it comes to global causes of death, cancer ranks higher than diseases like malaria or tuberculosis. In 2020, the American Cancer Society (ACS) stated that 6,09,300 patients were reported deceased out of roughly 19,18,030 cases that were diagnosed [18]. It is predicted that this figure may exceed 28 million by the end of year 2030 [50]. Among many types of cancers diagnosed, breast cancer in women and lung cancer in men are the two leading cancers contributing relatively more to the mortality rate worldwide. The International Agency for Research on Cancer (IARC) statistics show that breast cancer accounts for 25% of all cancers diagnosed in women so far starting from the year 2020 [15]. Breast cancer occurs due to the abnormal growth and multiplication of cells within the breast tissue, leading to the formation of different types of lesions. It can be observed from asymmetric shapes of left and right breast distortions from the normal architecture of the tissues to various sizes and shapes [51]. Studies have explored how changes in hormones, lifestyle, and environment can also raise the risk of breast cancer [49, 19].
Breast cancer can be classified into four primary tumour categories such as benign, normal, in situ carcinoma and invasive ductal carcinoma (IDC) [3]. Breast cancers due to the benign and normal types of tumours are not harmful and do not meet the criteria of dangerous cancer [21]. Breast cancers due to in situ carcinoma tumours affects only the lobules present in the mammary glands and do not metastasize to other body parts [28]. This type of tumor is not highly dangerous as it can be effectively treated by diagnosing it at an early stage. The IDC tumors produce the most severe breast cancers having the potential to spread to all other surrounding body organs very fast. Breast cancer due to IDC tumour is particularly very dangerous as it involves the entire breast tissue. Furthermore, IDC can be blatant in various cells making its diagnosis a very challenging task. In situ carcinoma comprises approximately 20–30% of all newly diagnosed breast cancer cases, while IDC accounts for nearly 80 70% of cases showing its predominance [48]. Active surveillance is one of the relatively best treatment options to treat breast cancer caused by in situ carcinoma tumours. This technique is one of the best options for doctors rather than going for a surgical treatment. However, this approach is not suitable for IDC. Hence, radiologists must distinguish between in situ carcinoma and IDC cancer types at an early stage to go for a better treatment strategy.
Based on their invading ability any tumor cells can be further classified into two primary types: malignant and benign [49]. Malignant tumours can invade and affect the surrounding tissue cells, posing challenges to the development of healthy tissue cells. On the other hand, benign tumours are non-cancerous tissue cells that do not disrupt neighbouring tissues [7]. Early diagnosis improves the chances of successful therapy and survival. Hence, the timely prediction of breast cancer has emerged as a critical factor in its management, contributing to enhanced cure rates and substantial reductions in mortality [36, 55]. Diagnostic imaging for breast cancer is an important contributor in reducing the high death rate. In contrast to cases found at later stages, screening programmes have been designed to diagnose breast cancer at an early stage, permitting more manageable treatment options and increased odds of survival [46]. MRIs, PET scans, mammograms, and magnetic resonance imaging (MRI) are among the imaging modalities that can be used to diagnose breast cancer [42].
Digital mammography (DM) serves as the leading imaging modality utilized for breast cancer screening in asymptomatic women [21], DM uses low-energy X-rays to detect the abnormalities of the breast [2]. The task of evaluating images becomes increasingly difficult as breast density increases primarily because of dense, normal and abnormal tissues that exhibit similar appearances. As per the ACS, the sensitivity of mammography is diminished by approximately 30% mainly due to variations in breast densities, which subsequently lead to an elevated risk of breast cancer [15, 30].
In general, a benign mass typically exhibits a round shape, smooth texture, and clearly defined boundary. On the other hand, a suspicious mass tends to have an irregular shape, rough texture, and indistinct or blurred boundaries [44]. The analysis of these images poses challenges due to the subtle distinctions between lesions and the surrounding fibro glandular tissue [50]. This results in significant inner-observer and intro-observer variability [5]. Lehman et al. [32] found that radiologists achieved an average of 86.9% sensitivity and 88.9% specificity for screening mammography.
In the diagnostic process, the affected area is identified through a comprehensive examination of tissue scans captured on a whole-slide level [24]. Furthermore, pathologists examine microscopic images of biopsy tissue samples at varying magnification levels. To make accurate diagnoses, pathologists now take into account various characteristics of the images, such as patterns, textures and distinct morphological properties [37]. Panning, zooming, focussing, and scanning each image in its entirety are time-consuming and tedious processes that must be completed in order to analyse images at different magnification levels. This manual process can be exhausting and often leads to inaccuracies in the identification of breast cancer.
Utilising computer-aided detection (CAD) technology can help radiologists reduce their workload. CAD offers an efficient and automated system for tumor classification, and tumor segmentation by providing improved diagnosis. This technology has the potential to reduce the workload of radiologists while enhancing diagnostic accuracy [63]. Large retrospective investigations, however, have demonstrated that traditional CAD systems do not increase the accuracy of diagnoses [31]. Distinguishing between benign and malignant breast abnormalities presents a substantial challenge, often resulting in a considerable number of false positive (FP) and restricting the practicality of CAD systems in clinical settings.
As CAD technology advances, machine learning (ML) is being effectively applied to the diagnosis of breast cancer. At the moment, ML shows encouraging progress in object recognition, image recognition, and text classification [8]. When it comes to histopathological image classification using traditional ML techniques and artificial feature extraction, there is a requirement for manual feature modelling. However, this method does not necessitate a highly efficient mechanism and offers advantages in terms of computational time [13]. Nevertheless, the latest advancements in DL have demonstrated immense potential by achieving state-of-the-art performance in various recognition tasks within computer vision, image processing, speech recognition and natural language understanding domains [6]. These methods have been implemented across various medical imaging modalities, including pathological imaging, showcasing exceptional performance in tasks such as classification, segmentation and detection. In certain instances, DL-based systems have been integrated into the clinical workflow alongside pathologists and physicians.
CNN models have limitations in capturing global context, fixed input sizes, and strong inductive biases, hindering performance. To overcome the issues caused by traditional CNN models, researchers began deploying Vision Transformers (ViTs) to address these issues by leveraging self-attention for global context understanding, flexibility with input sizes, and reduced biases. ViTs’ scalability and hierarchical feature representation enhance their adaptability and performance. However, Vision Transformers include a self-attention layer that is inefficient and faces scalability issues for long sequences due to its quadratic time complexity, thus limiting the scalability of the models.
To enhance the ViT model, a novel heterogenetic attention mechanism has been proposed, boosting both accuracy and computational efficiency. This innovative mechanism is integrated into one of the classifiers within the multi model fusion framework, optimizing the model’s focus on critical features of input data. By dynamically adjusting attention to the most informative image regions, it enhances classification outcomes and reduces noise. This targeted approach streamlines computations, maintaining efficiency and enabling real-time and large-scale applications. Consequently, this mechanism allows for effective deployment in resource-constrained environments, making advanced ViTs more versatile and practical for diverse image processing tasks. This represents a significant advancement in attention mechanisms within deep learning classifiers.
From previous studies, it has been observed that individual classifiers often struggle to perform effectively due to class imbalances within datasets. Class imbalance refers to situations where some classes are underrepresented compared to others, which can lead to biased model predictions and poor performance for the minority classes. To combat this issue, hybrid architectures combining multiple classifiers were proposed. These hybrid models leverage the strengths of different classifiers to improve overall accuracy. However, they present a significant drawback in terms of generalizability. Hybrid models tend to perform well on specific datasets for which they were designed but often fail to maintain the same level of performance across diverse datasets and platforms. Additionally, these models can be resource-intensive, making them inefficient for scenarios where simpler models might suffice.
To address these limitations, we propose a multi-model fusion framework for accurate tumor classification. This approach begins by assessing the performance of individual classifiers to determine if a hybrid model is necessary. When a hybrid model is warranted, it integrates high-dimensional features from both classifiers, thus accounting for the heterogeneity of the data and enhancing classification performance. This selective use of hybrid architecture ensures efficient resource utilization. Our literature review highlights critical gaps in current research, such as inadequate scalability analysis, which hampers the application of these models on a large scale. Furthermore, the lack of detailed hyperparameter tuning discussions impedes model reproducibility and optimization, limiting their practical utility in diverse real-world applications. By addressing these gaps, our proposed framework aims to offer a more flexible, efficient, and generalizable solution for tumor classification. After conducting extensive experiments across diverse datasets, our proposed framework has achieved an impressive accuracy of 99.36%. Notably, it demonstrates enhanced computational efficiency, boasting a time complexity of only 3.19 seconds per image. This efficiency not only ensures rapid processing but also establishes a solid foundation for scalability and generalizability, marking a significant advancement in the field.
Motivation
Nevertheless, when it comes to histopathological image classification, especially with DL techniques like convolutional neural networks (CNN), there is often a requirement for a substantial amount of labelled training data, which can be challenging to obtain [40]. Despite the remarkable achievements of these methods in medical imaging, they face a significant challenge while working on small datasets requiring extensive amounts of labelled data, which is currently unavailable for various reasons within this domain of application.
ML/DL techniques are extensively employed in the detection of invasive breast cancer. However, many researchers heavily rely on a single DL model, such as CNN, LSTM or RNN for their studies etc. [7, 36, 46, 21, 44, 32, 24] Consequently, the performance of these models was deemed inadequate because research shows that a as most of the data is real world data there is huge imbalance between the classes, thus resulting in inadequate performance of a single model. Also from research it is evident that employing a hybrid DL models is always beneficial to enhance classification performance while handling real world imbalance datasets [29]. Another issue is that by employing a hybrid model the computational efficiency of the model is reduced. Hence, it is crucial to optimize the performance of Hybrid DL-based breast cancer screening and diagnosis to provide better support for radiologists in their work.
Key contributions
Innovative DL framework for Breast Cancer Image classification: We introduce a pioneering and highly efficient DL framework tailored for image classification. This framework stands out for its novel design, providing a powerful tool for accurate and generalized classification in medical imaging datasets. Hybrid Approach for Improved Generalization Across Varying Dataset Sizes: Addressing the challenge of generalization across varying dataset sizes, we present a hybrid approach that merges the features extracted from two classifiers. This synergistic combination enhances the model’s ability to adapt to diverse dataset scales, ensuring robust performance across a spectrum of data complexities. Efficient Attention mechanism for improved performance and computation effiency: A novel attention mechanism is proposed in one of the classifier employed in the framework, contributing to both enhanced accuracy and computational efficiency. This mechanism optimizes the model’s focus on critical features, leading to improved classification outcomes while maintaining computational efficiency. This approach represents a significant advancement in attention mechanism within DL classifiers. Resource-Efficient Optimization through feature selection: To address the critical issue of computation resource efficiency, a sophisticated feature selection algorithm is proposed for optimal hybridization the classifiers. This algorithm ensures that only the most pertinent high-dimensional features that contribute to the classification process are selected, streamlining computational usage without compromising accuracy. Proposed approach stands as a pioneering effort in achieving a judicious balance between computational efficiency and model performance. Consideration of Heterogeneity for Accurate Tumor class prediction: In contrast to conventional approaches, proposed framework takes into account the inherent heterogeneity within each classifier. By fully integrating high-dimensional features from both classifiers we achieve a more comprehensive understanding of the intricate variations present in the data. This consideration of heterogeneity is essential in enhancing the accuracy of tumor class predictions, marking a substantial leap forward in the precision of breast cancer diagnosis. Extensive Analysis for High Accuracy, Efficiency Resource usage and scalability: Our study presents a comprehensive quantitative analysis using BreakHis and BACH datasets, evaluating the performance of our proposed model. The results indicate our framework’s potential for enhancing breast cancer prediction in clinical and research domains. Methodological innovations encompassing framework and hybrid model design, sophisticated feature selection, and addressing classifier heterogeneity, collectively propel breast cancer classification to the forefront, optimizing accuracy and methodology.
As radiologists consume more time to analyse pathology reports physically and to diagnose breast cancer, researchers working in the field of ML are continuously striving to develop CAD systems useful to enhance diagnostic accuracy in a relatively short time. The main focus is on the development of automated AI models capable of diagnosing a CAD report supporting the radiologist’s suggestion [33]. A CAD framework is proposed comprising 91 ultrasound breast images [38]. The main use of this CAD system is to identify the region of interest (ROI) which is often critical. The proposed approach incorporated marker controlled watershed transformation along with textual feature descriptors such as homogeneity, contrast, energy, correlation and entropy. Furthermore, ML techniques including K-nearest neighbour (KNN), support vector machine (SVM) and classification regression trees (CART) are utilized for the development of this strategy.
Later researchers said that using an ANN, a large portion of bengin can be accurately distinguished from malignancies about textural changes in the breast tissue [16, 58]. To analyse the data, ML techniques such as support vector machine (SVM), DCA and RF were employed. Methods such as threshold adjacency statistics (TAS), parameter-free TAS (PFTAS), grey-level co-accuracy matrix (GLOM), and scale-invariant feature extraction (LPQ) were used to extract the data’s features. In 2016, a highly renowned database for breast cancer classification was introduced, and the authors achieved a classification accuracy of 85.1% using a support vector machine (SVM) approach [10]. An “ML” model using NN and SVM for breast cancer recognition has reported 94% accuracy [20]. In [23] using SVM, Decision trees, and nearest neighbour classifiers, an efficient framework with colour texture characteristics and multiple classifiers using a vote strategy has been suggested. The voting technique reported around 87.53%.
In [43] researchers focused on developing a model for breast cancer by combining DL technology along with CAD. Numerous research studies have been published that explored breast cancer diagnosis using DL techniques, specifically applying different variants of CNNs for classification purposes. In [14] authors proposed a CNN model with different kernel sizes that can work irrespective of magnification factors and achieved 83.25% accuracy. A pre-trained CNN was used in a study [53] to extract the feature vectors, which were subsequently used as classifier inputs. DeCAF, the technique used, produced recognition accuracies of 86.3% and 84.2%.
In [47, 9] the authors performed two experiments, in the first experiment they employed multi-task transfer learning techniques using deep neural networks (DNN) and in the second experiment they created a model using single task transfer learning with deep convolutional neural networks (DCNN). In the evaluation of the test set, the multi-task transfer learning DCNN exhibited significantly superior performance (
The authors of [52] classified breast cancer at the patient and picture levels using AlexNet and several fusion approaches. This work reports an average recognition accuracy of 90% and 85.6%, respectively, when combining pictures and patient-level data using the max fusion method. In [56] CNN-based approach achieved 77.8% accuracy on multi-classification and 83.3% accuracy for binary class. In [25] authors employed structures DL model (SDCNN) for multi-class classification from histological images and achieved 93.2% of average accuracy. [journal of digital imaging]. T. Sochtzidis et al.’s study [35] examined and evaluated the mammography image’s diagnostic accuracy for breast cancer. For research deployment, they employed the DDSM-400 and CBIS-DDSM datasets, and their accuracy rates were 70% and 73%, respectively. Abdelhafiz [1] in his research revealed that data augmentation deployed in DL model accurately classified Breast cancer. In a study context-aware stacked CNNs were proposed by Hossain et al. [26] to detect IDS and DCIS using whole slide images (WSIS) and attained an AUC value of 0.72 and an accuracy of 76.2% in diagnosis of three classes. Table 1. Shows the literature on different hybrid architectures proposed in the literature in terms of the presence of imbalance between the data, how effectively the proposed model handled imbalance condition, its computational efficiency and model accuracy.
A literature review on different hybrid architectures proposed.
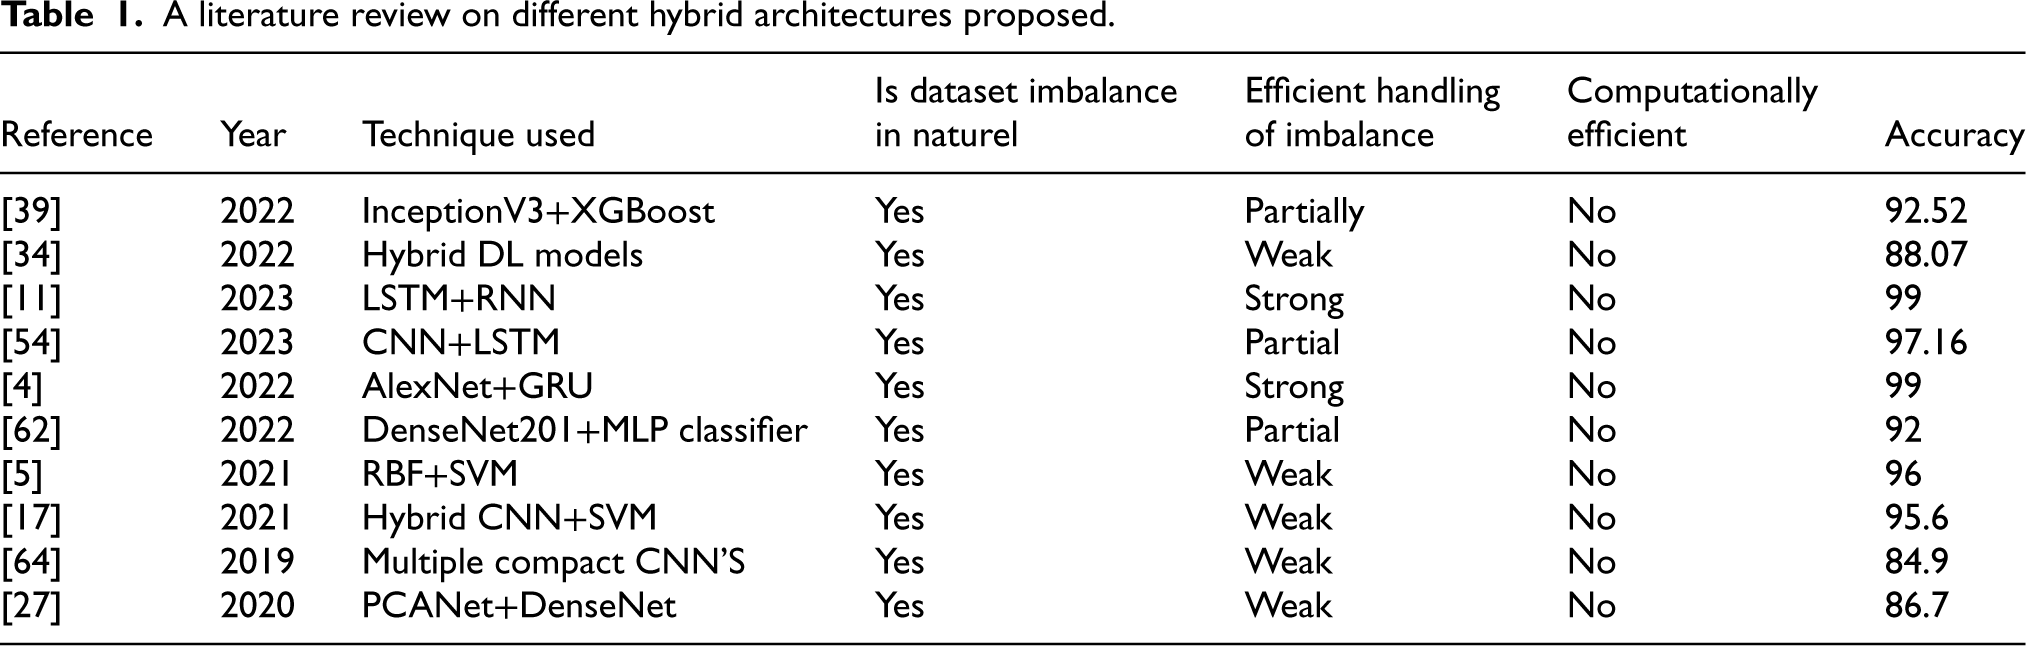
A literature review on different hybrid architectures proposed.
From previous studies, it is observed that most of the individual classifiers did not perform well due to an imbalance between classes in the dataset. Later to overcome this problem hybrid architecture was proposed. However, hybrid architectures are not generalized when applied to different datasets and platforms. Another problem with hybrid architectures is that a lot of time and resources are wasted when applied to a dataset where there is no necessity for the hybrid model because individual models themselves can produce good results. To overcome these problems, we propose a framework based on multi-model fusion to accurately classify the tumour type. The method initially utilizes the individual classifier to evaluate their performance and when the performance is up to the mark then hybrid architecture is used otherwise the hybrid architecture is not implemented. The hybrid architecture integrates the high dimensional features obtained by both the classifiers by fully considering the heterogeneity of each model data achieving better performance. In a more detailed way, the following are the major research gaps found and analysed from the literature.
Insufficient Scalability Analysis: Unfortunately, a lot of studies haven’t assessed how scalable their proposed models are, which is a crucial consideration when thinking about practical implementation. Consequently, the current methods may lack the necessary scalability to effectively handle the demands of large-scale real-world medical images. Lack of Discourse on Hyper Parameter Tuning: Numerous researchers have omitted discussions on the tuning of hyper parameters for their ML and DLS algorithms. This crucial stage in the ML and DL pipeline significantly influences model performance. Failing to disclose how the best combination of hyper parameters was established hampers reproducibility and hinders the optimization of models. Limited Comparison with State-of-the-Art Approaches: Most studies have neglected to compare their proposed models against previously proposed state-of-the-art ML and DL methods for breast cancer diagnosis. This lack of comparison hampers the ability to determine the effectiveness of existing models in relation to alternative approaches, thus impeding progress in the field. Restricted Evaluation Metrics: The majority of researchers rely on a limited set of evaluation criteria to guage how well their models work. Employing comprehensive assessment measures, such as precision, recall, F1-score, and MCC, commonly found in the literature, would offer a more holistic evaluation of the existing models and facilitate better comparisons.
Dataset
BreakHis Dataset BreakHis dataset contains Histopathological images of 9,109 microscope images of breast tumour tissue collected from 82 patients using different magnifying factors (40X, 100X, 200X, 400X). BreakHis dataset is divided into two main groups: benign tumors and malignant tumours. It has 5,429 malignant and 2,480 benign 700*460 pixel PNG samples within 3-RGB channels with depth of 8-bit 8-bit in each channel in PNG format. Figure 3a shows the distribution of images among two classes malignant and benign. It is evident from Figure 1a that the dataset is imbalanced. Figures 2 and 3 shows the sample malignant and benign images utilized.
The BACH 2013 dataset, compiled by Teresa et al. is composed of histological images related to breast cancer, sourced from the Breast cancer 2019 grand challenge. These images originate from biopsy slides of breast tissue, stained with hematoxylin and eosin. Uniformly acquired using a Leica DM 20000 LED microscope and a Leica ICC50 high-definition camera. Each image measures 2048*1536 pixels with a pixel scale of 0.42
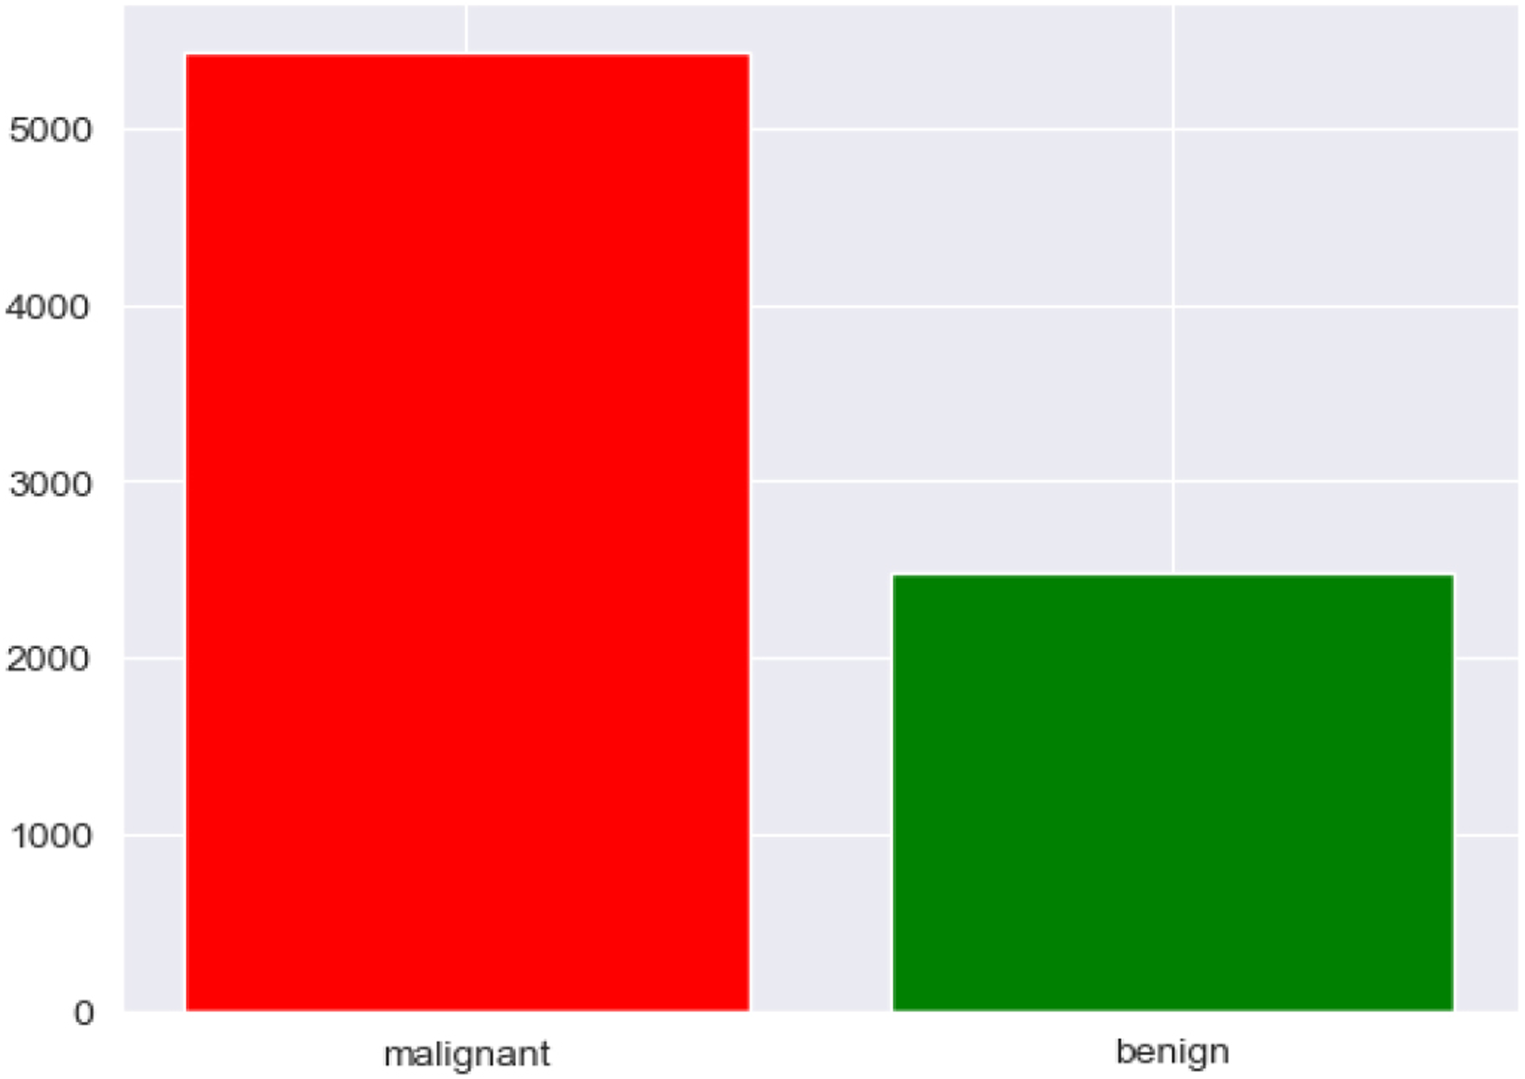
Distribution of images among the classes.
DL models should be generalised to improve the model’s efficiency. Enhancing the model’s capacity for generalization is a highly challenging task. Generalizability pertains to the disparity in performance between a model when assessed on familiar data versus unseen data. Models exhibit poor generalizability because they tend to have excessively adapted to the training data, resulting in overfitting. To construct effective DL models, it is crucial for the validation error to consistently decrease alongside the training error. Data augmentation serves as a highly effective technique to accomplish this goal. Compared to the model trained with the original dataset, the models trained with the pre-processed dataset mostly perform better. Compared to many pre-processing methods Cropping, Rotation, and Flipping are more effective. Initially, images obtained from the BreakHis dataset are taken and are divided into training, validation and testing sets. In the initial step the following data augmentation techniques are employed to enhance the dataset.
In flipping the images are rotated horizontally and vertically. By rotating the image in multiples of 90 degrees, new images are generated [55]. The process of randomly selecting a specific portion of the original image is known as cropping. While preserving the spatial dimensions of the image, cropping
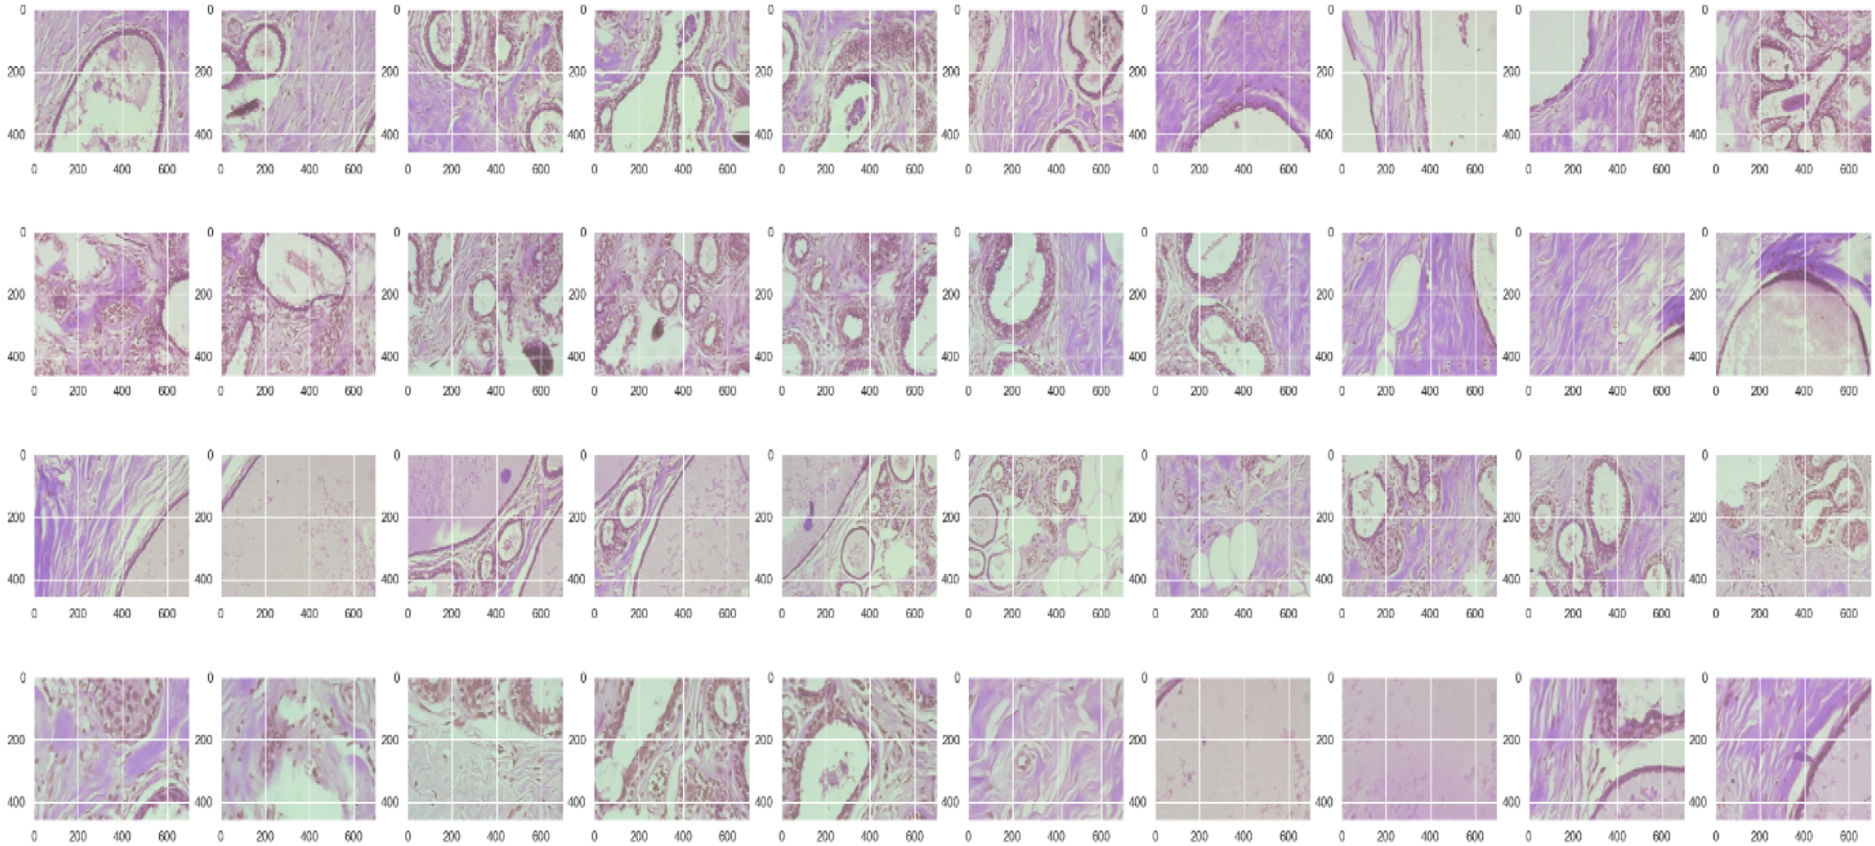
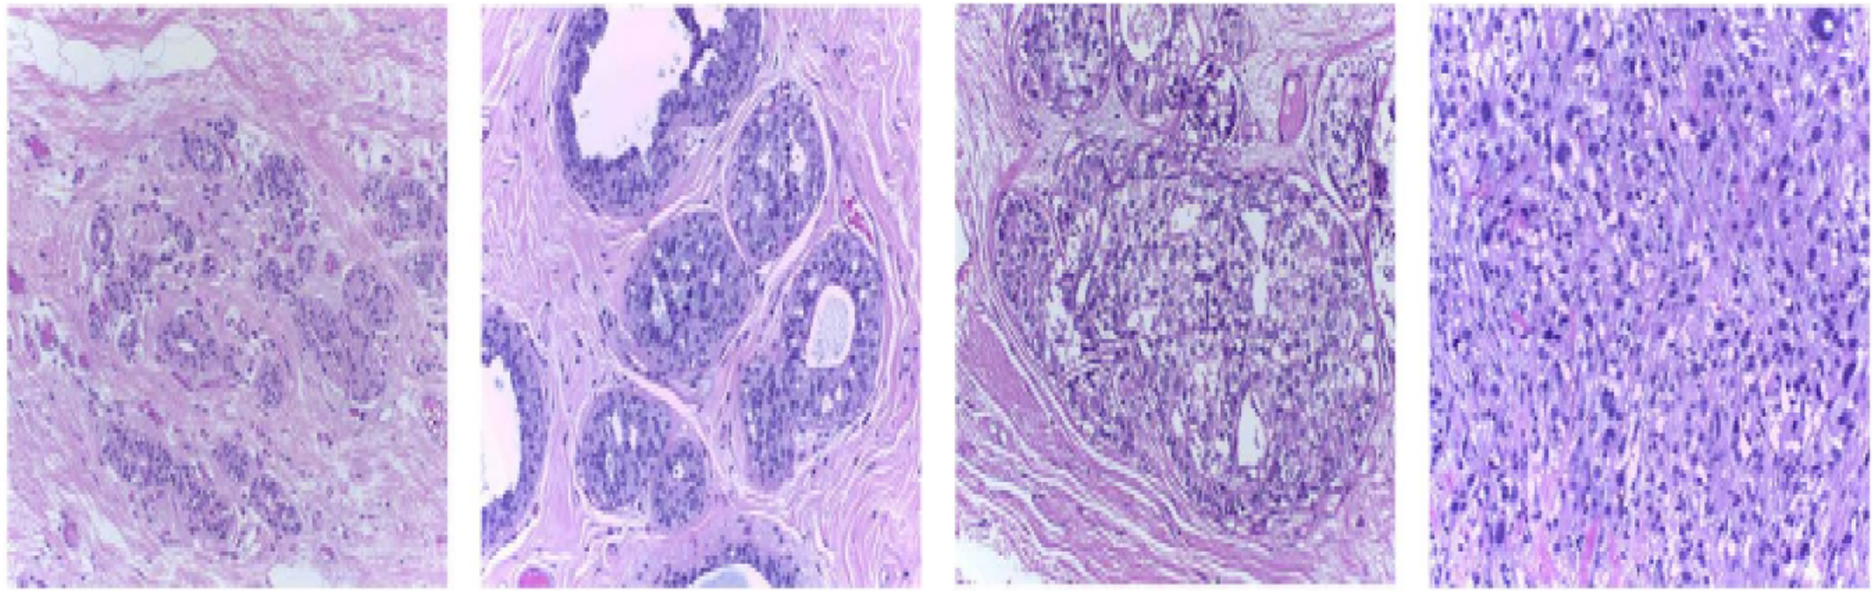
Sample benign images from the BreakHis dataset.
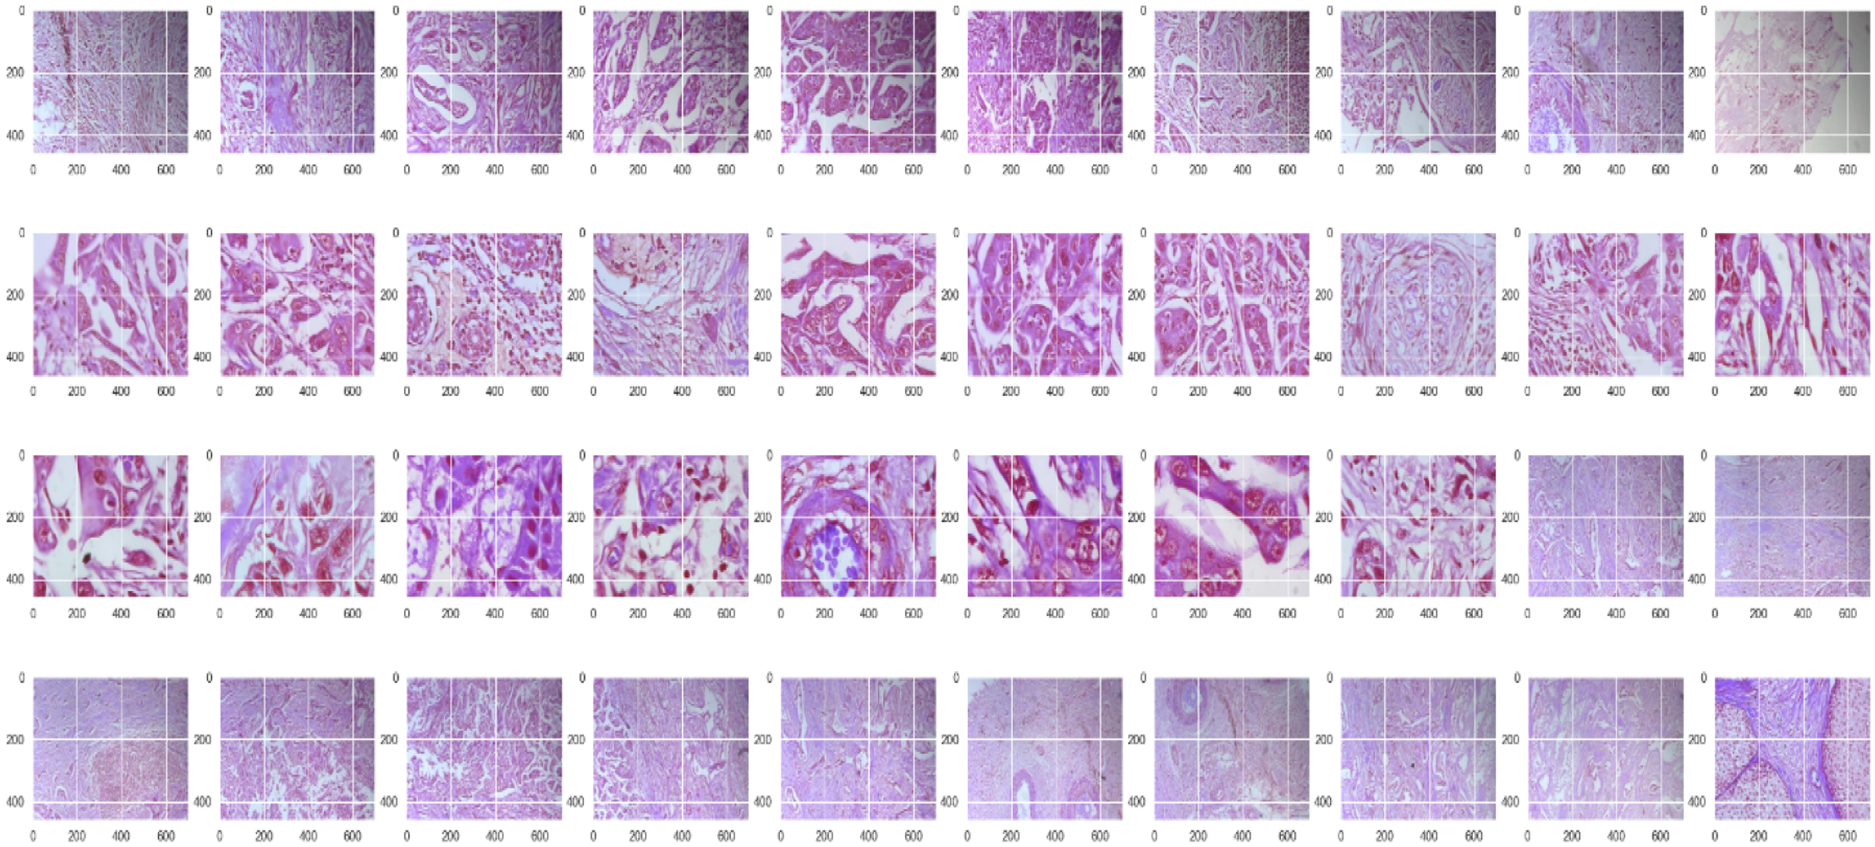
Sample malignant images from the BreakHis dataset.
Sample images from the dataset BACH.
reduces the size of the image as it involves extracting a part of the original image and resizing it as required [55, 44]. Based on the requirement, the image can be rotated either at 90-degree angles or at smaller, more precise angles. When the image is rotated by 90 degrees, no additional background noise is introduced. Since the background of the image contains various colours, it does not interfere with the network’s understanding and instead becomes a feature learned by the network [15]. Figure 5 visualizes how images are divided among training, validation and testing sets and their imbalance ratios. Figure 6 visualizes how the dataset sizes are modified by utilizing the pre-processing techniques.
Figure 7 visualizes the flowchart representing the proposed methodology. Initially, the dataset (BreakHis/BACH) is provided as input to the model. In the subsequent phase, pre-processing is performed on the input data because both the datasets are imbalanced and irregular, which can lead to overfitting or underfitting. To address this issue, the dataset is pre-processed using various techniques such as flipping, rotating, and cropping. This enhances the model’s efficiency and its ability to generalize to unseen data.
In the next step, the pre-processed data, which includes both original and newly generated images, is fed into the framework. Following this, the dataset is input into classifier-1, and the accuracy obtained by classifier-1 is calculated. The accuracy is then compared with a threshold value. If the achieved accuracy is greater than the threshold, the model outputs the performance efficiency and the classification process ends. If the obtained accuracy is less than the threshold, the features extracted by classifier-1 are stored in a vector, and the initial input images are then provided to classifier-2. The procedure of comparing the accuracy obtained by classif ier-2 with the threshold is repeated. If the achieved accuracy exceeds the threshold, breast cancer classification is performed. If the accuracy is still below the threshold, the features obtained by classifier-2 are also stored in the vector. If both classifiers fail to achieve accuracy greater than the threshold, the features obtained by classifier-1 and classifier-2 are fused using the proposed feature fusion technique and stored in a vector. These fused features are then given as input to the hybrid model for the final classification of breast cancer.
Proposed methodology
Due to the imbalance condition of the dataset models often show bias towards any of the class labels. This occurs due to the model’s disability to learn important features from the database by concentrating
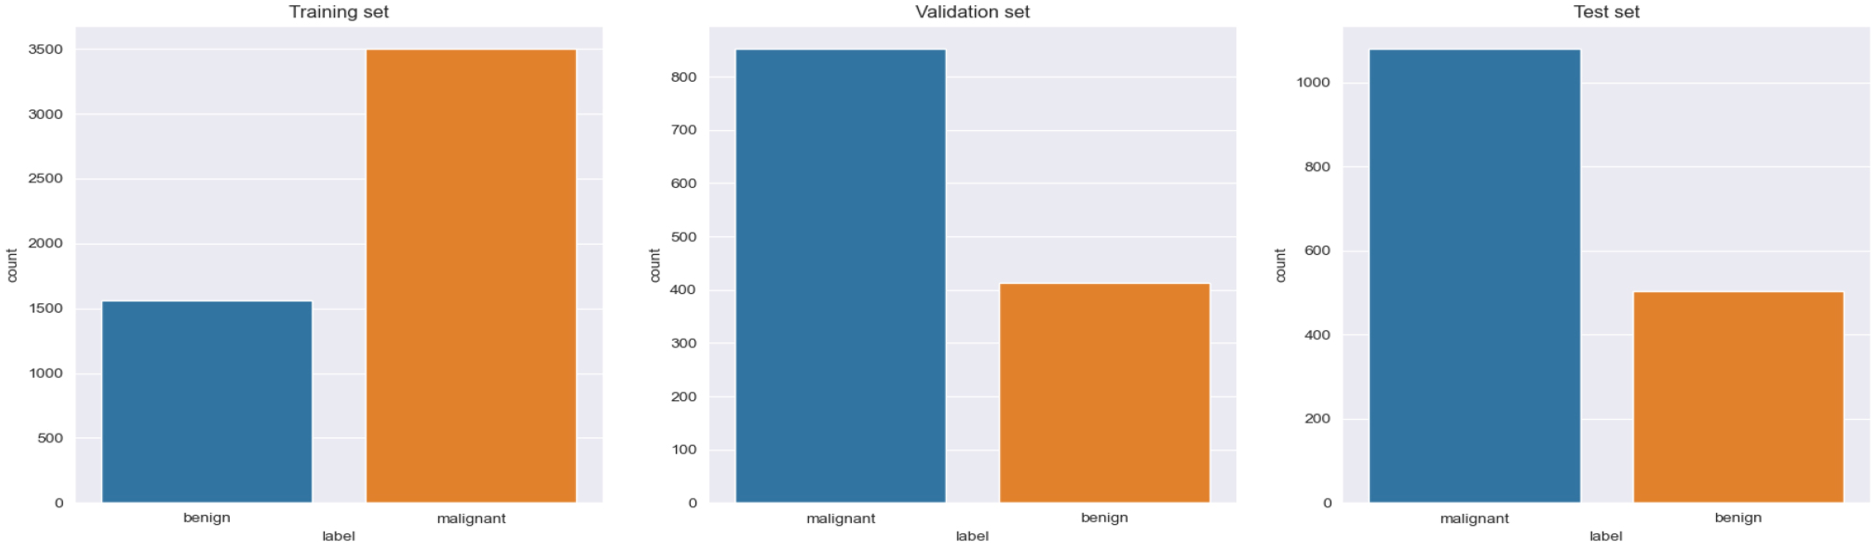
Image distribution among the classes in training, validation and testing set.
only on one class. In such conditions to improve the classification efficiency building a hybrid model by taking the benefit of features obtained from both the classifiers is always appereciatable. At the same time, hybrid models often are time, space-consuming making them computationally inefficient and are often problem-specific leading to a lack of generalizability.
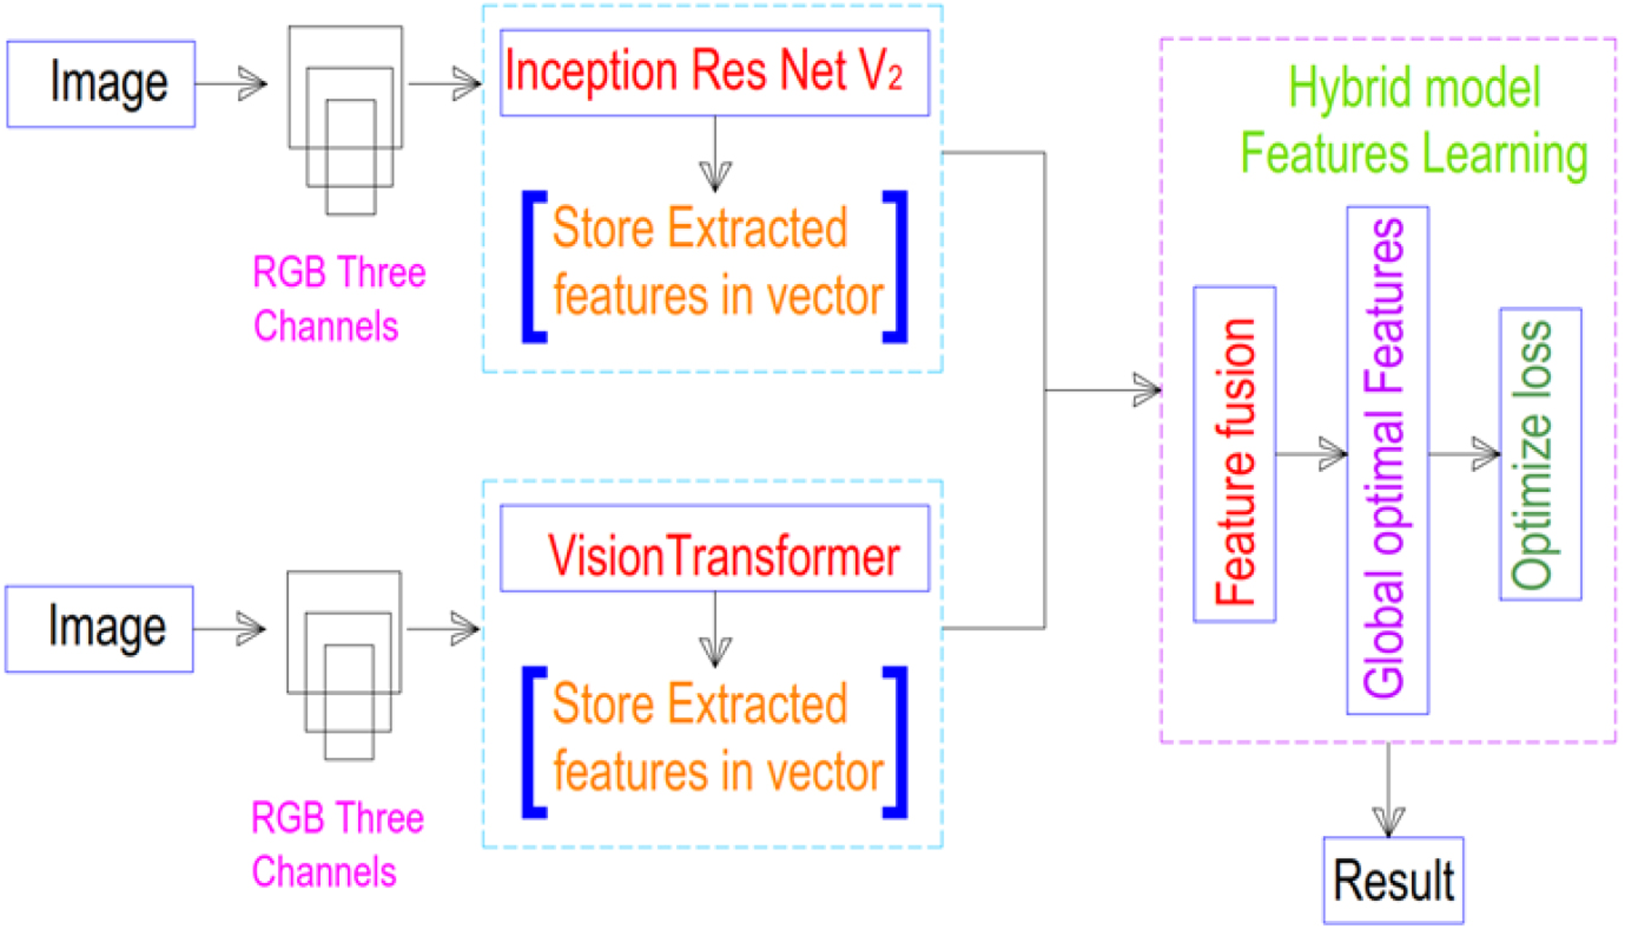
To overcome this problem in the following work a framework is proposed that is computationally more efficient by improving the performance and generalization. Figure 8 visualizes the diagrammatic representation of the framework proposed.

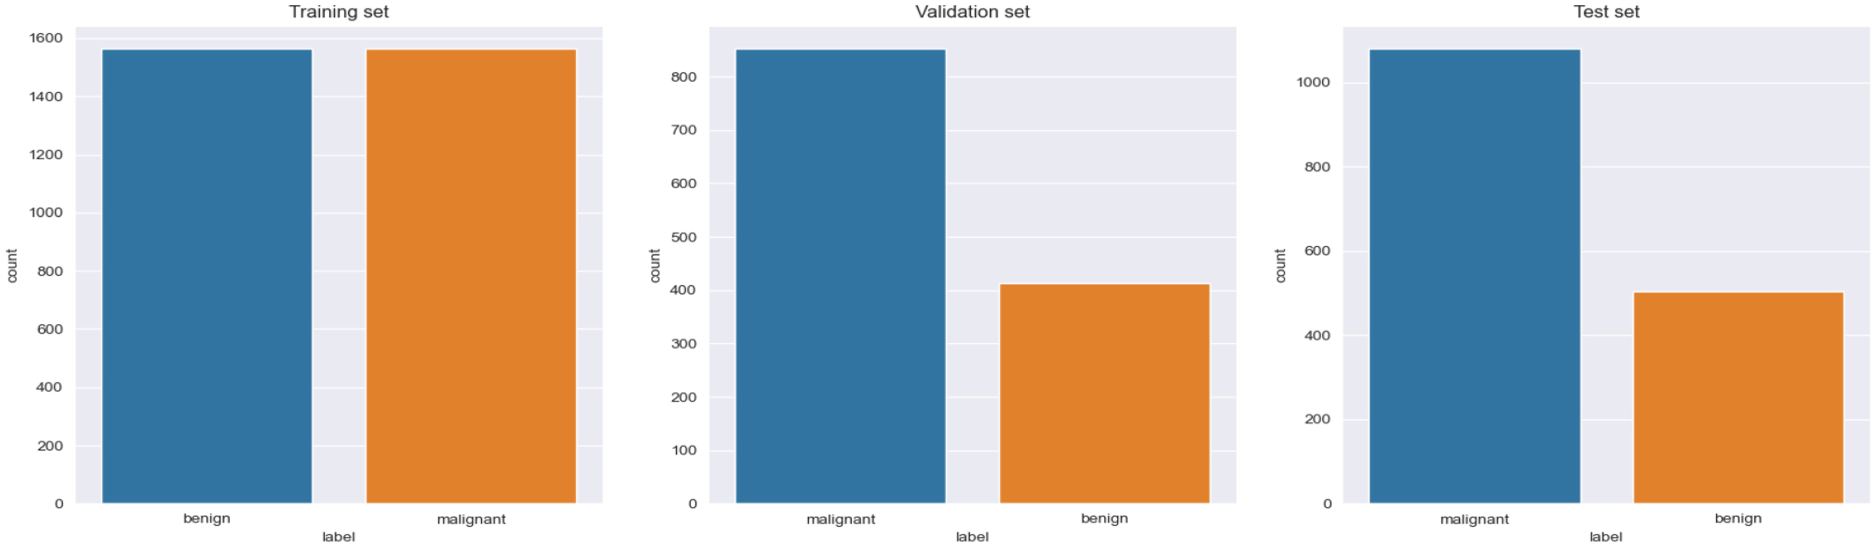
Image distribution among classes after pre-processing the dataset.
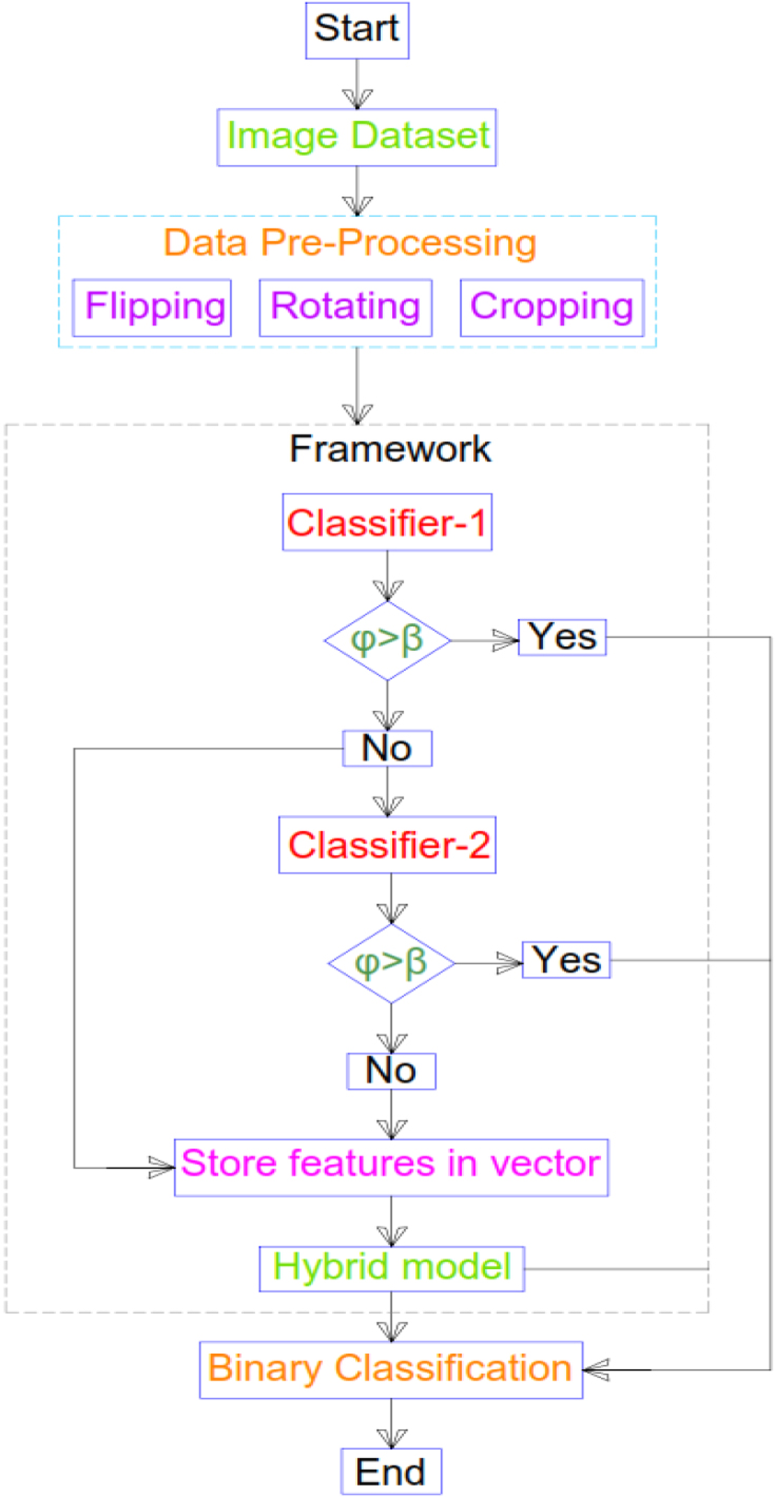
Flowchart of the proposed methodology.

Proposed framework.
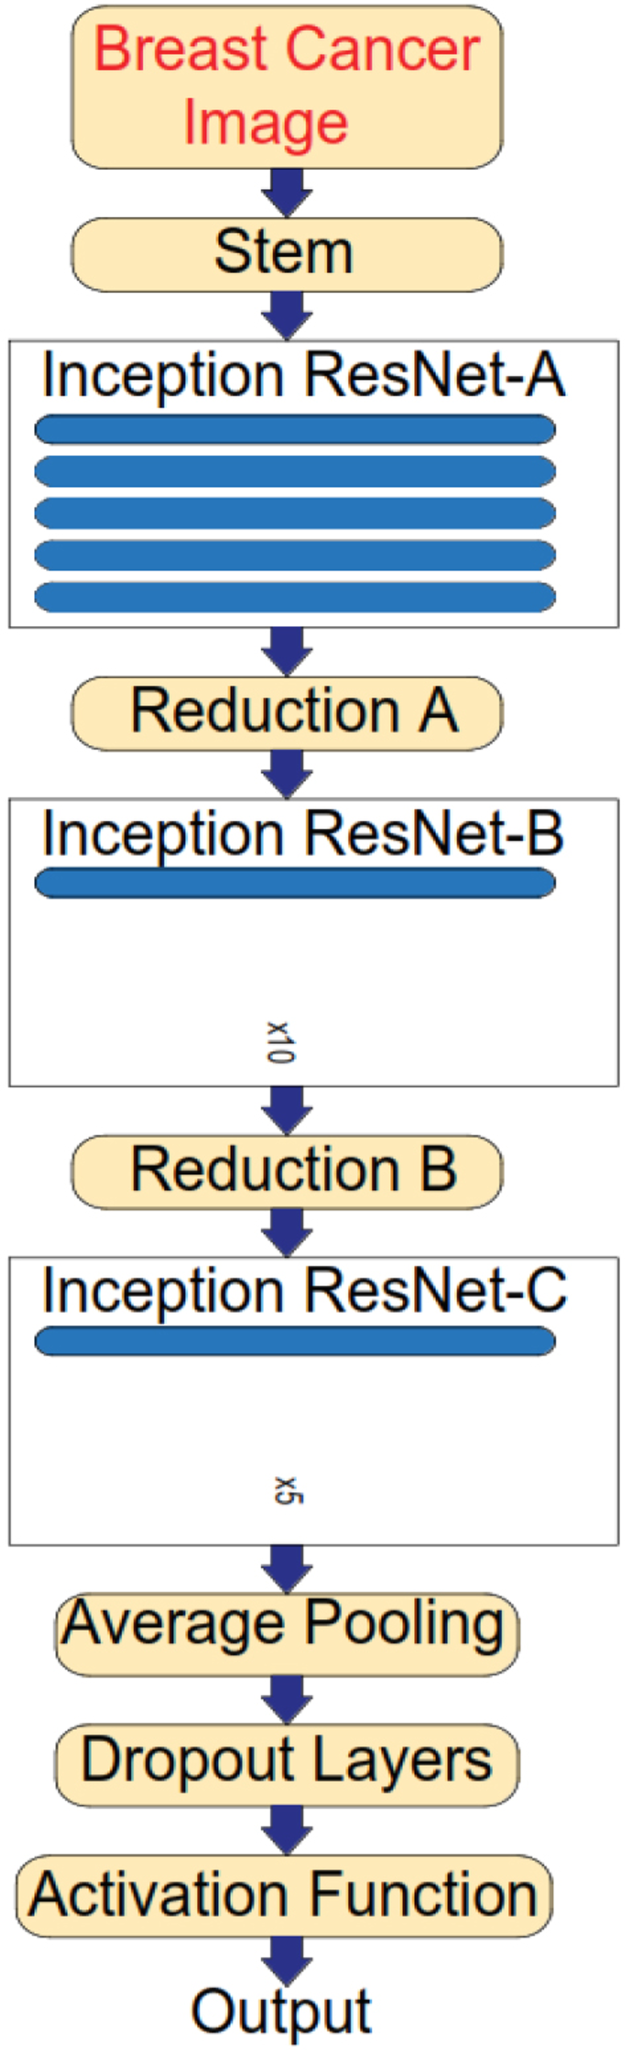
InceptionResNetV2 architecture.
This achieved output tensor is then passed through an average pooling 2D layer. Here, the spatial dimensions are further reduced by calculating average values for a window of values. These values help in capturing global information from the features. The output obtained from the average pooling 2D layer is flattened, using the flattened layer. In convolutional layers, the input data is typically represented as a 3D or 4D tensor, where each dimension corresponds to the spatial dimension and the number of channels. However, a fully connected layer only can work on the input of a 1D vector. For this reason, flattened layers are used to convert multidimensional input data into a 1D vector when input is transiting from convolutional layers to fully connected layers. These layers flatten the input tensor, preserving the total number of elements while removing the spatial dimensions. By using this layer our model learned relationships between different features regardless of their spatial arrangement. As the dataset is imbalanced to create a balance Dropout layer is added. A Dropout layer is applied with a rate of 0.5, which means that each element of the flattened vector has a probability of 0.5 of being zeroed out which means on average, half of the connections are set to zero.
This dropout layer disabled their contribution to the subsequent computations by making them not affect the forward pass or backward pass during training. This made the proposed model more regularized and generalised. Now the remaining active connections from the flattened output are passed through a fully connected Dense layer. Here the fully connected Dense layers map these high-dimension features to the desired output enabling the network to learn complex patterns and the relationships in the data. The obtained output (i.e.) features extracted are passed on to the convolutional layers which classify the given images based on which class it belongs to. Once the accuracy in classifying an image is calculated the obtained accuracy calculated is compared with the threshold value. If the obtained accuracy is lesser than the threshold value, then the features obtained by the first classifier 1 are stored in the form of a vector and classifier 2 is activated for execution.
Equation (1) is the basic linear transformation step often found in convolutional neural networks. The equation describes the process of applying a convolutional operation to the input 
Where
Inception-ResNet employs residual connections within the Inception modules. The residual connections help with the flow of information through direct addition of the input to the output modules. Equation (2) provides the formula for a residual connection.

Further, Eq. (3) is utilized to combine the information from two sources into 
Equation (4) gives the final output of the residual module obtained by applying the activation function to the combined tensor 
Equation (5) is the activation function used in the proposed architecture (i.e) ReLU activation function, which is widely used in the neural networks.

Equation (6) is used to represent a relationship between the input and outputs of different residual units, taking into account the residual function and scaling factor 
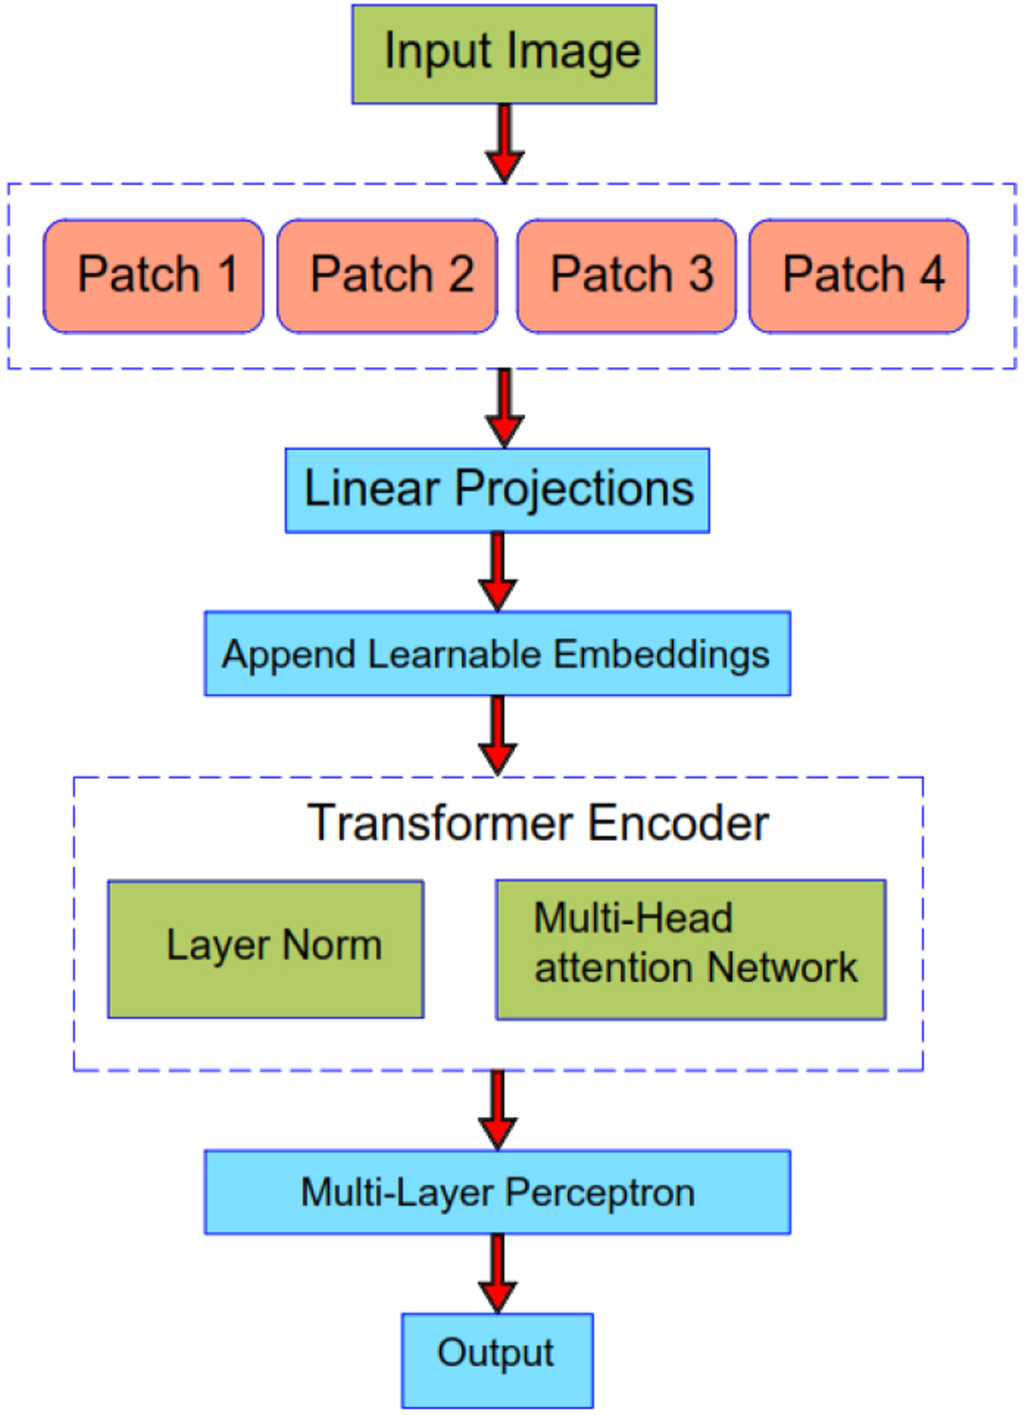
Vision transformer architecture.
Further, the input images are divided into smaller patches of equal size where each patch belongs to a spatially localized region of the input. (1, 16) is the patch size taken where patch size is a tuple of (height, width). After specifying the patch size, we initialized the
Then we initialized an MLP dimension
Equation (7) explains the representation of the original image. This representation indicates that the image is a 3-dimensional tensor with height H, width W, and 
Equation (8) explains the converted patches and Eq. (9) gives the final number of patches images are divided into.

Equation (9) is used to calculate number of patches. 
Equation (10) is the equation that describes the initial input sequence for the transformer.

The Eq. (11) specifies the dimensions of the embedding’s:

Equations (12) and (13) show the series of multi-head linear time Nystrom attention and multi-head perceptron blocks present in the transformer encoder block.


Equations (14) and (15) display the positional encodings containing the absolute and relative positions of the tokens that are added to the input sequence embedded at the bottom of the encoder and decoder stacks.


Now the obtained accuracy from the ViT model is compared with the threshold value, if the obtained classifier 2 accuracy is greater than that of the threshold value then the execution terminates at that point and the probability of the image belonging to a particular class is returned if not then the features extracted are stored in a vector for future use.
ViT usually has an inbuilt self-attention mechanism which helps in identifying the region of interest while training the model. However, the self-attention mechanism present in the transformer often utilizes more computational resources, which results in the quadratic computational efficiency of the model. To overcome this problem, we modified the self-attention module in the transformer module and replaced it with multi-scale linear time Nystrom attention mechanism that takes linear or sublinear time to complete the task.
Our proposed technique employing the Multi-Scale linear time Nystrom approximation method can help address the memory and computational limitations associated with self-attention in transformer models. It aims to provide an efficient approximation of the attention mechanism, particularly for large-scale input sequences. It leverages a subset of randomly sampled tokens or patches from the input sequence to construct a low-rank approximation of the full attention matrix. This reduces the computational complexity and memory requirements from quadratic to linear or sublinear, making it more scalable for large inputs. But by employing this technique there is a chance that the model may miss out on some valuable features. So to overcome this situation a multi-scale weight adaptive nature is added to Nystrom’s attention. It means an individual subset of landmarks namely local, global, spatial and channel-wise features are selected to attend to rather than attending all tokens in the sequence.
Here’s a high-level overview of how the proposed attention mechanism works:
1. Selecting local landmarks Channel-wise and spatially: In this step using Eq. (16) local landmarks are selected channel-wise and spatially using the Nystrom attention technique. For each channel 
Where
2. Selecting global landmarks channel-wise and spatially: In this step by employing Eq. (17) global landmarks are selected channel-wise and spatially. For each channel 
3. Compute Affinity Matrix channel-wise and spatially: computing the Affinity matrix is a very crucial and novel step in the proposed architecture because after extracting the local and features both channel-wise and spatially these extracted points should be analysed to find the pairwise relationships or similarities between elements in the input sequence, determining the attention weights assigned to each element when computing the weighted sum in the attention mechanism. For each channel 
In Eq. (23)
4. Normalize Affinity matrix: normalizing the affinity matrix ensures that the attention weights assigned to each element are interpretable and comparable. It transforms the raw similarities into a distribution, where each element’s attention weight is proportional to its relative importance in the context of the entire sequence. For each channel 
5. The attention scores 
In the next step, all the obtained features channel-wise-local, global and spatial- local, global all are concatenated together and are given as input to the next layer. The main characteristic of the proposed multi-scale adaptive Nystrom attention mechanism is to automatically adjust the parameters namely the number of local landmarks
Hybrid Model: Now when both classifier 1 and classifier 2 showed declined performance, then the feature vectors extracted from classifier 1 and classifier 2 are taken and are given as input to the neural network. Before giving them as input to the neural network the features extracted from both the classifiers should be concatenated. In our framework, a multi-fusion model is utilized for concatenating the features extracted from classifier 1 and classifier 2. This multi-fusion model’s primary objective is to combine the features of multiple models in order to identify the unique inherent features, preventing the hybrid model from overfitting due to unbalanced data. The features extracted by classifier 1 are represented as model1 and the features extracted by classifier 2 are represented as model2. Figure 11 visualizes the step-by-step procedure followed while creating a hybrid model.
Visualizes the steps involved in multi-model fusion architecture.
To concatenate the features obtained from both models we used the following technique specified in Eqs (21) and (22):


In Eqs (21), (22) and (24)
In the next step, the best combination of alpha and beta values is found on the validation set. In simpler words from the extracted features, only those features whose alpha and beta values result in less minimum loss when calculated using cross-entropy loss are taken. This step is almost as crucial as extracting valuable features from the dataset. The mathematical formulation of this step is shown in Eqs (23) and (24). To find out the valuable features from the concatenated features the following distance-based optimal search algorithm is utilized:


The reason for using a distance based optimal search algorithm is because of its ability to solve combinational optimization problems. As the main aim of our research is to optimize the model’s performance the distance-based optimal search algorithms worked well in achieving this. Many distance metrics can be employed for calculating the optimal features among which the Euclidean distance vector is most famously employed. But Euclidean distance works in a specific space and it cannot handle random real values properly. As our problem is associated with working on features extracted from the real world instead of frequently used Euclidean distance we employed chebyshev distance-based optimal search approach.
The efficacy of the proposed CDBA method relies on the definition of the optimal value of the objective function that identifies the ideal values of the features involved. These optimal values related to the respective feature set are defined over a vector 
Here, DIF describes an alternative value in n-dimensional space and
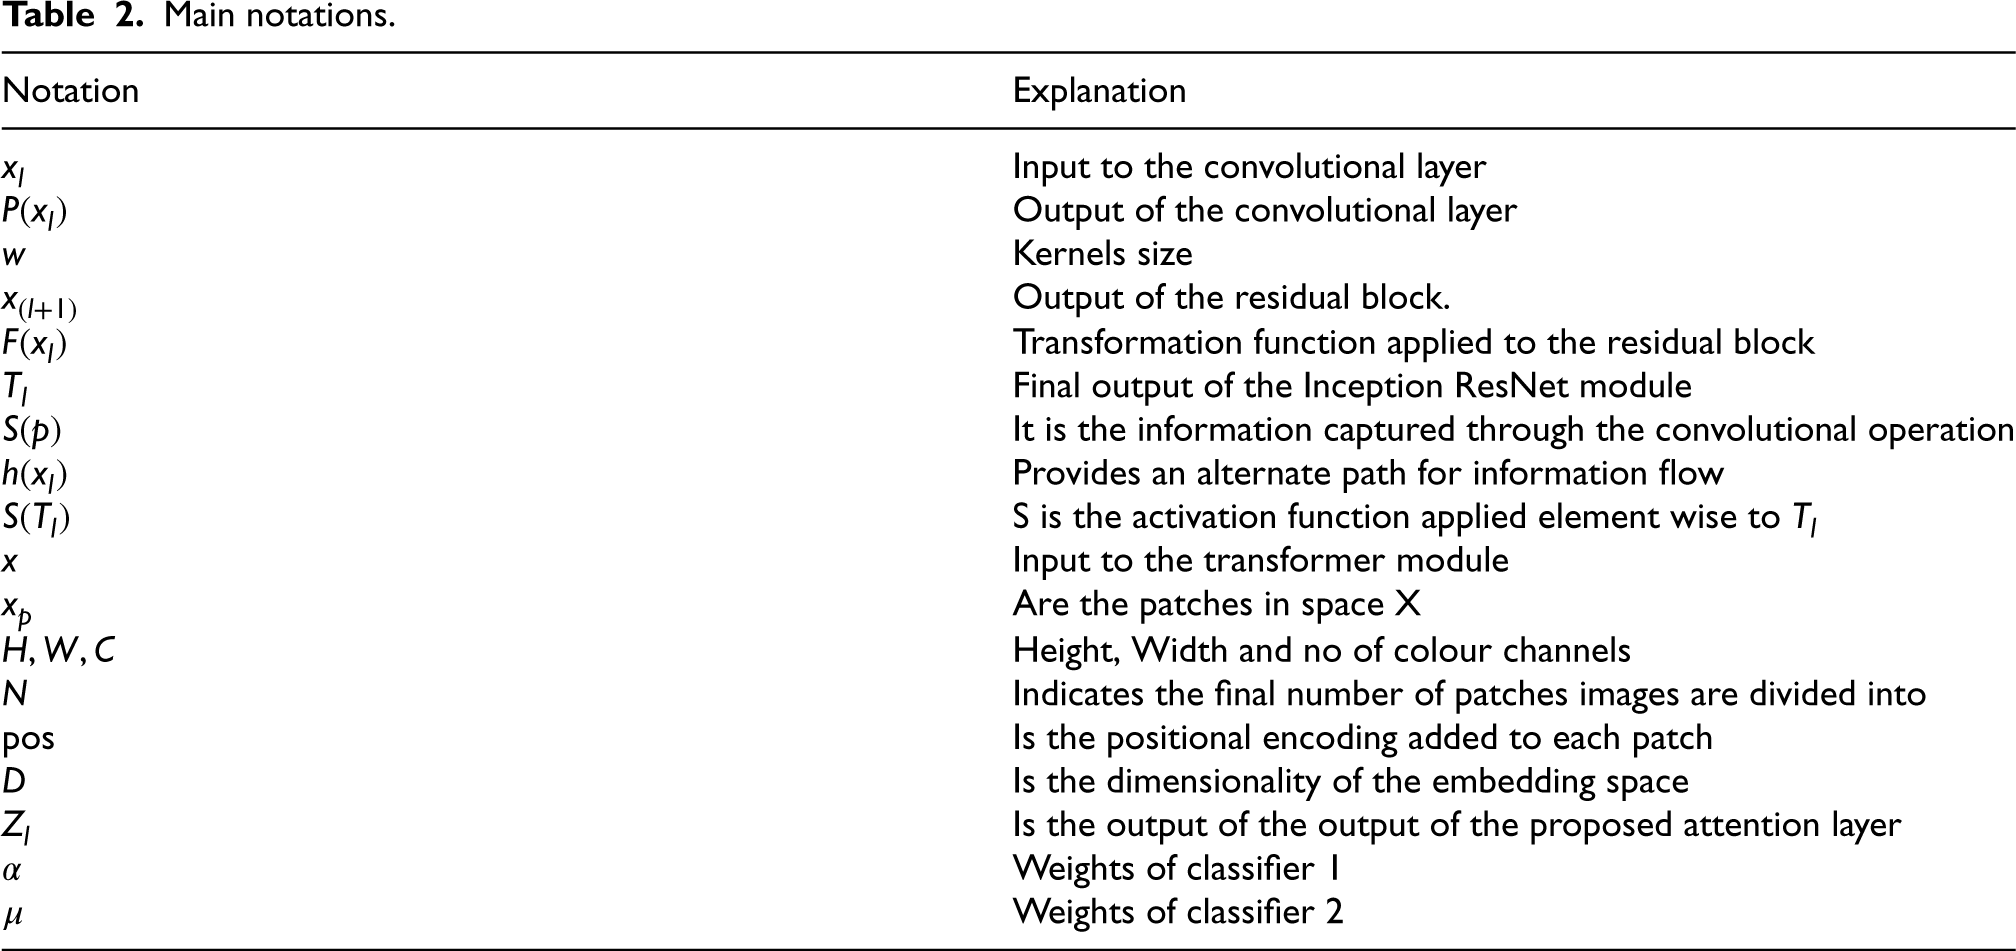
Main notations.
Experimental setup
Every experimental test is conducted concurrently on two NVIDIA GPUs, specifically A5000s with 24 GB of RAM each. RAM for the system is 128 GB. Numerous data analysis frameworks, such as Pandas, Numpy, Seaborn, 496 Matplotlib, and Scikit-learn, were employed in the study. The entire framework is executed for ten epochs. 20% of the data were used for testing, while the remaining 80% were used for training. The proposed model was trained on the training data. The suggested model was fine-tuned utilising a variety of parameters, including hyper parameters, to improve classification accuracy and prevent overfitting. Different learning rates were applied, and it was found 506 that the default learning rate of 0.001 gave better results.
Performance evaluation metrics
We examined the outcome of the proposed model for different tumour types in the dataset. The effectiveness of the proposed model is assessed here using five performance indicators of accuracy, recall, precision, F1 score, and MCC which are defined as shown in Table 3.
Notations used:
True positive (TP) image is successfully detected as a tumour. False positive (FP) image is wrongly detected as a tumour. True Negative (TN) image is successfully detected as non-tumorous. False Negative (FN) image is wrongly detected as non-tumorous.
Performance evaluation metrics.

Performance evaluation metrics.
Quantitate analysis
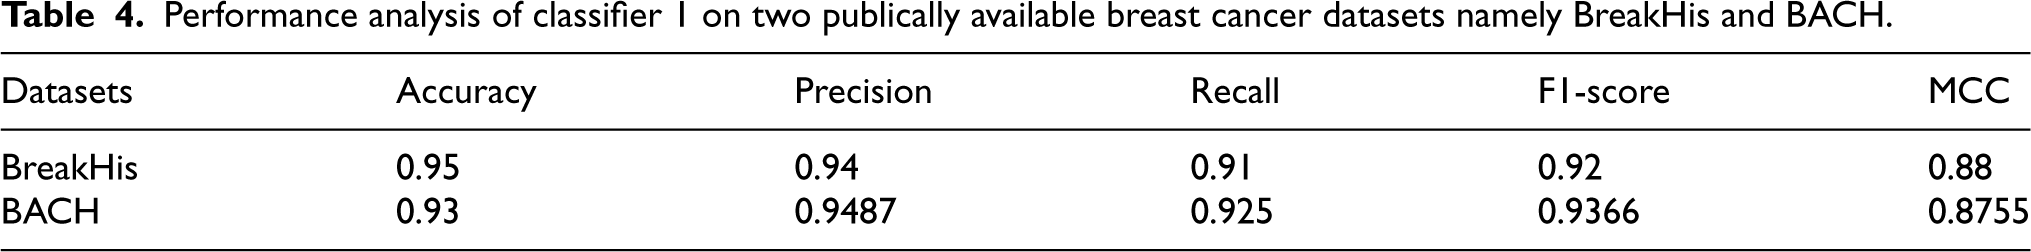
DL algorithms have come a long way in the last several years, and some of their versions have been effectively used to address breast cancer classification issues. In this section performance of the models used in the proposed framework is evaluated and analysed. We take into account a broad range of research instances with different measurement indicators, such as F1 score, area under the ROC curve (AUC), accuracy, precision, recall, and receiver operating characteristics (ROC). Firstly, we evaluated the performance of the classifier 1 model using the quantitative evaluation metrics. Table 4 shows the quantitative summary of the classifier 1 model on two publically available datasets namely, BreakHis and BACH. The proposed classifier 1 achieved a testing accuracy and precision of 0.95 and 0.94, whereas, the recall, F1 score and MCC value are 0.91, 0.92 and 0.88 respectively on BreakHis dataset. The proposed classifier 1 obtained accuracy, precision, recall, F1-score, and MCC values of 0.93, 0.9487, 0.925, 0.9366, and 0.8755 on the BACH the data set respectively, according to the same table. Since the achieved accuracy value is low relative to the threshold value of 0.96, we examined the causes of the declining performance. After specific analysis on declined performance of classifier 1 it is understood that due to its very deep nature and dataset’s limited size model failed to explore various patterns or characteristic’s in the images this reason consistently lead to misclassification resulting in overfitting that lead to poor generalization.
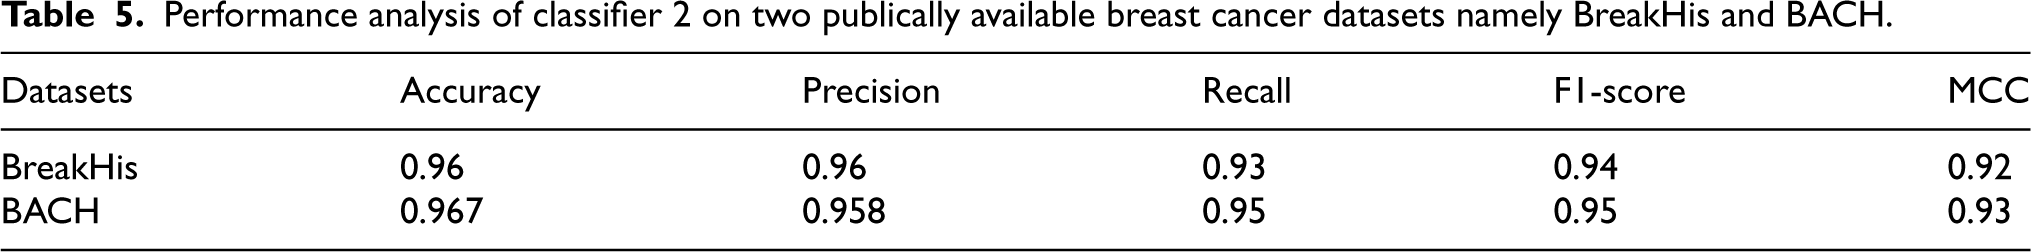
Further second classifier is activated and analysis is performed by evaluating the performance of the classifier 2 model using the quantitative evaluation metrics. Table 5 shows the quantitate summary of the classifier 2 models on two publically available datasets namely BreakHis and BACH. The proposed models achieved a testing accuracy and precision of 0.96 and 0.96, whereas, recall, F1 score and MCC value of 0.93, 0.94 and 0.92 respectively on the BreakHis dataset. The BACH dataset findings are also summarised from the same table, with the following scores: 0.967, 0.958, 0.95, 0.95, and 0.93 for accuracy, precision, recall, F1 score, and MCC. From Tables 2 and 3, it is evident that compared to the performance of classifier 1 and classifier 2 ViT showed the best result. In comparison to the standard attention mechanism in ViT, we chose to use the multi-scale linear time Nystrom Attention mechanism since it performs well with limited computational resources. This mechanism approximates the full attention matrix with a low-rank approximation, which leads to more efficient computations and faster training. After specific analysis on declined performance of classifier 2 it is understood that due to limited dataset size model suffered from overfitting which lead to poor generalization on unseen data. From Tables 4 and 5 it can be inferred that MCC scores are relatively less providing insights that model suffered overfitting due to ineffective handling of imbalance in the dataset.
Performance analysis of classifier 1 on two publically available breast cancer datasets namely BreakHis and BACH.
Performance analysis of classifier 1 on two publically available breast cancer datasets namely BreakHis and BACH.
Performance analysis of classifier 2 on two publically available breast cancer datasets namely BreakHis and BACH.
As the achieved accuracy values of both classifier 1 and classifier 2 are less than the threshold value, features extracted from both the classifiers are fused using the novel feature fusion algorithm “CDBA” resulting in a hybrid model. A hybrid model is then trained on selected features obtained from concatenating selected features from classifier 1 and classifier 2 models. Later the test set images are given to the hybrid model, and model is evaluated. From Table 6 it can be inferred that the accuracy of the model is improved when compared to the threshold value indicating the superior performance of the hybrid model effectively captured all the local and global features irrespective of the imbalance issue in the dataset. Furthermore, Table 4 illustrates that when additional evaluation metrics are examined, it can be observed that there is an increase in the hybrid model’s evaluation metric scores when compared to the results obtained by classifiers 1 and 2.
Performance analysis of hybrid model on two publically available breast cancer datasets namely BreakHis and BACH.

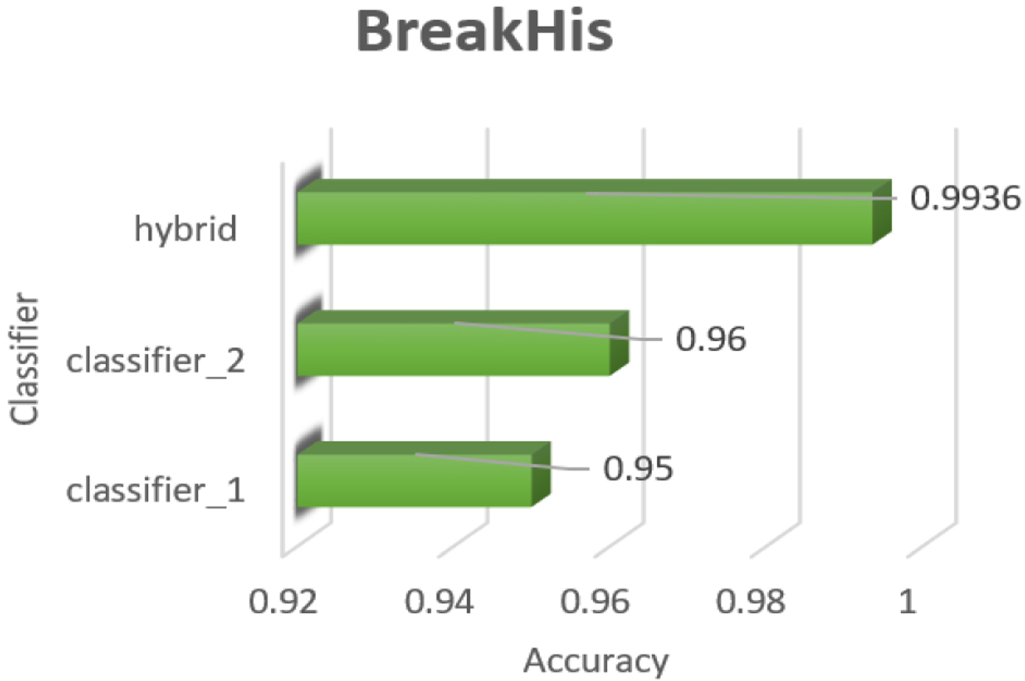
Comparison of hybrid model accuracy VS classifier 1 and classifier 2 on BreakHis dataset.
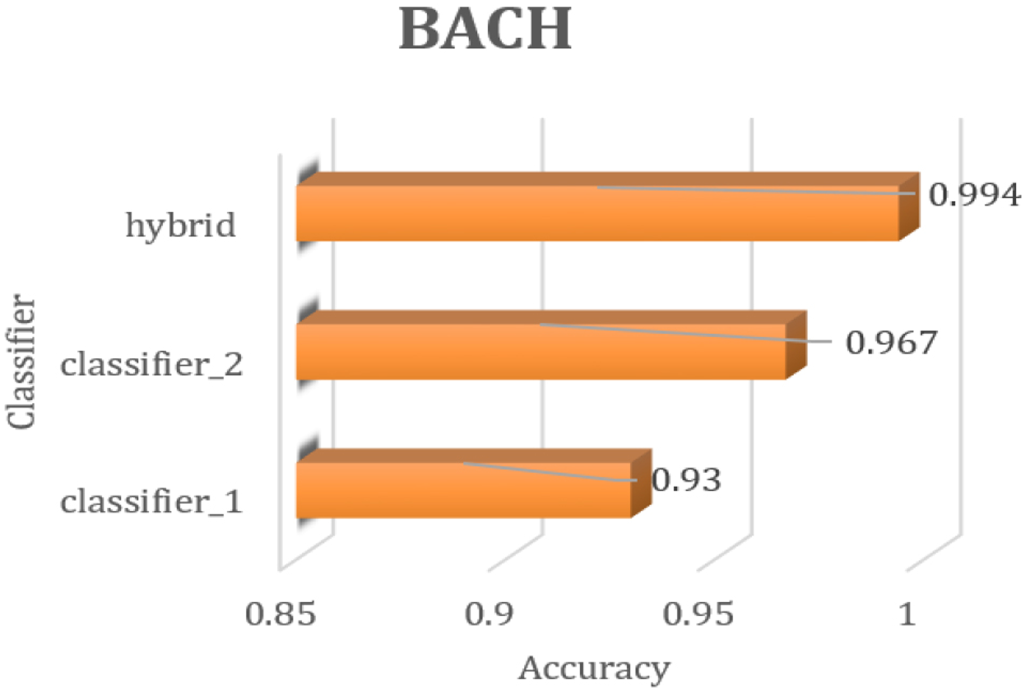
Comparison of hybrid model accuracy VS classifier 1 and classifier 2 on BACH dataset.
From Table 6, Figures 12 and 13, it is evident that the precision of the proposed hybrid model are 0.9936, 0.9919 for BreakHis and 0.994, 0.987 on the BACH dataset respectively which indicates that the model has a high level of precision for both classes. This means that when the model predicts instances as a specific type of tumour, it is highly likely to be correct. This indicates that the model can make accurate predictions for each tumour class. As can be seen from Figures 12 and 13, the proposed hybrid model performed exceptionally well in categorising various tumour subtypes when compared to classifiers 1 and 2. It demonstrated exceptional recall, precision, and F1 scores in both tumour classes, striking a notable balance between precision and the capacity to recognise pertinent cases. Further insights into the model’s performance were made accessible by evaluating the model performance using other metrics which further assisted with optimisation efforts.
Similarly, from Table 6 it can be observed that model achieved, recall values of 0.9879 and 1 on BreakHis and BACH respectively, which imply that the model exhibits a substantial level of recall across all tumour classes. This indicates the model’s proficiency in accurately identifying and capturing a significant majority of instances belonging to each specific tumour class. Hence, it can be inferred that the model demonstrates a remarkable ability to effectively detect instances of binary tumour classes. Furthermore, from the same table, it can be inferred that on both the datasets F1 score approaching 1 denotes that the model attained a commendable equilibrium between precision and recall for both tumor classes. This shows that the model achieves a heightened level of accuracy while adeptly capturing instances from each tumour class. This implies that the model effectively strikes a balance between precision, represents the correctness of predictions and recall, denoting the ability to identify relevant instances of attacks. Further, MCC score is calculated to compare how effectively models handles class imbalance situation. Compared to classifier 1 and classifier 2 MCC score’s, hybrid model MCC score is reported as 0.9852 and 0.988 on BreakHis and BACH dataset’s respectively providing a strong evidence about how well the hybrid model handled class imbalance situation.
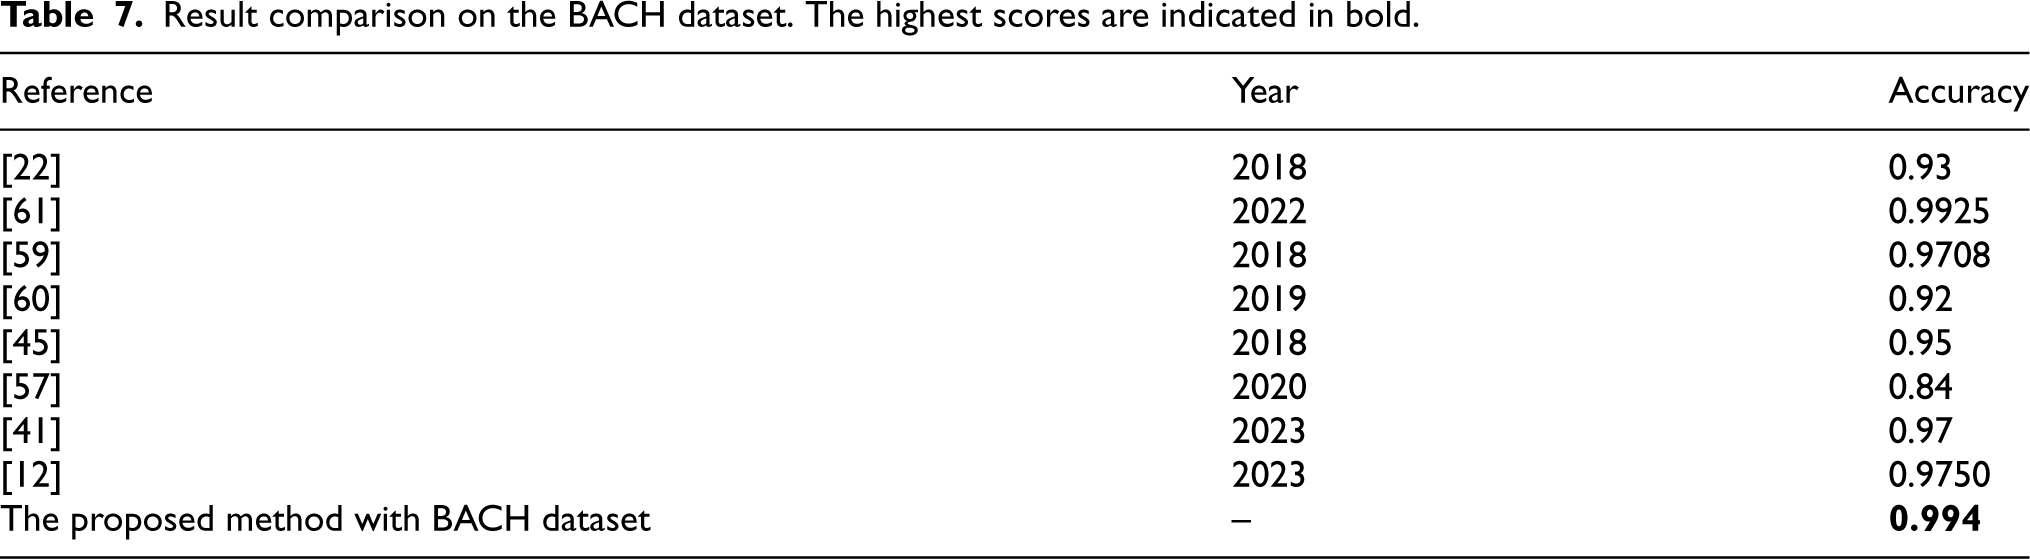
Result comparison on the BACH dataset. The highest scores are indicated in bold.
Result comparison on the BreakHis dataset. The highest scores are indicated in bold.

In this section, the suggested hybrid model’s performance for classifying breast cancer is evaluated against the most recent state-of-the-arts. Table 7 presents a comparison of the proposed hybrid model against several recent state-of-the-arts breast cancer classifications on the BACH dataset. With the best accuracy scores, the proposed hybrid model outperforms the most advanced techniques. Table 8 compares the performance of the proposed hybrid model with the state-of-the-art methods using the BreakHis dataset. Table 6 shows the superiority of the proposed hybrid model on the BreakHis dataset. It performs far better than any of the most recent SOTA approaches to classifying breast cancer. Figures 14 and 15. Visualizes the graphical representation of SOTA techniques performance VS proposed model performance on BreakHis and BACH datasets.
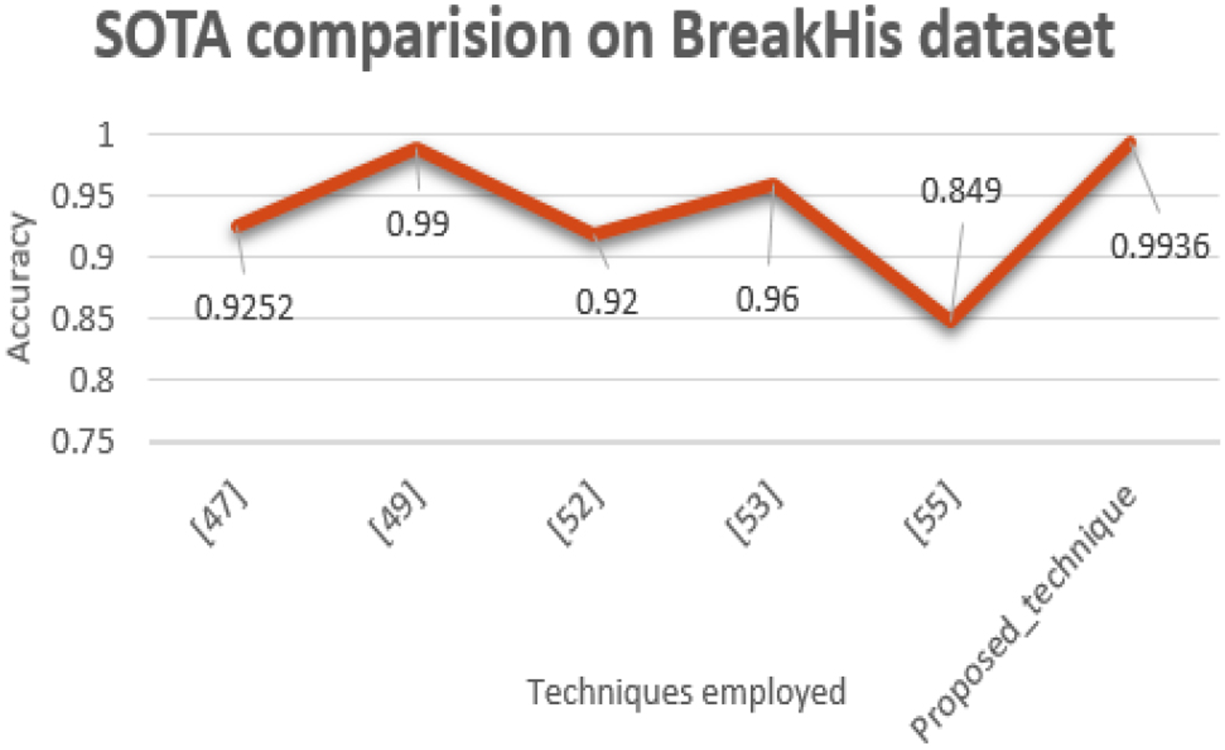
Graphical representation of SOTA techniques performance VS proposed model performance on BreakHis datasets.
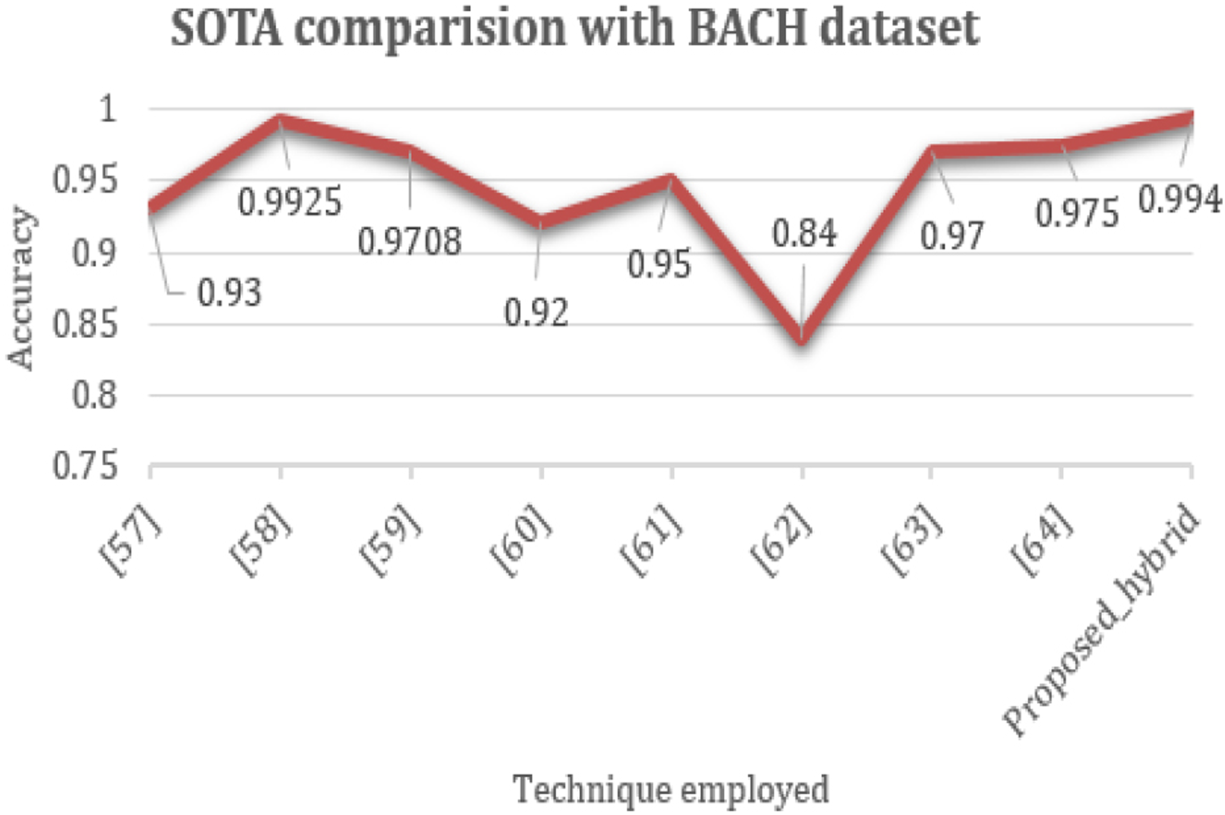
Graphical representation of SOTA techniques performance VS proposed model performance on BACH datasets.
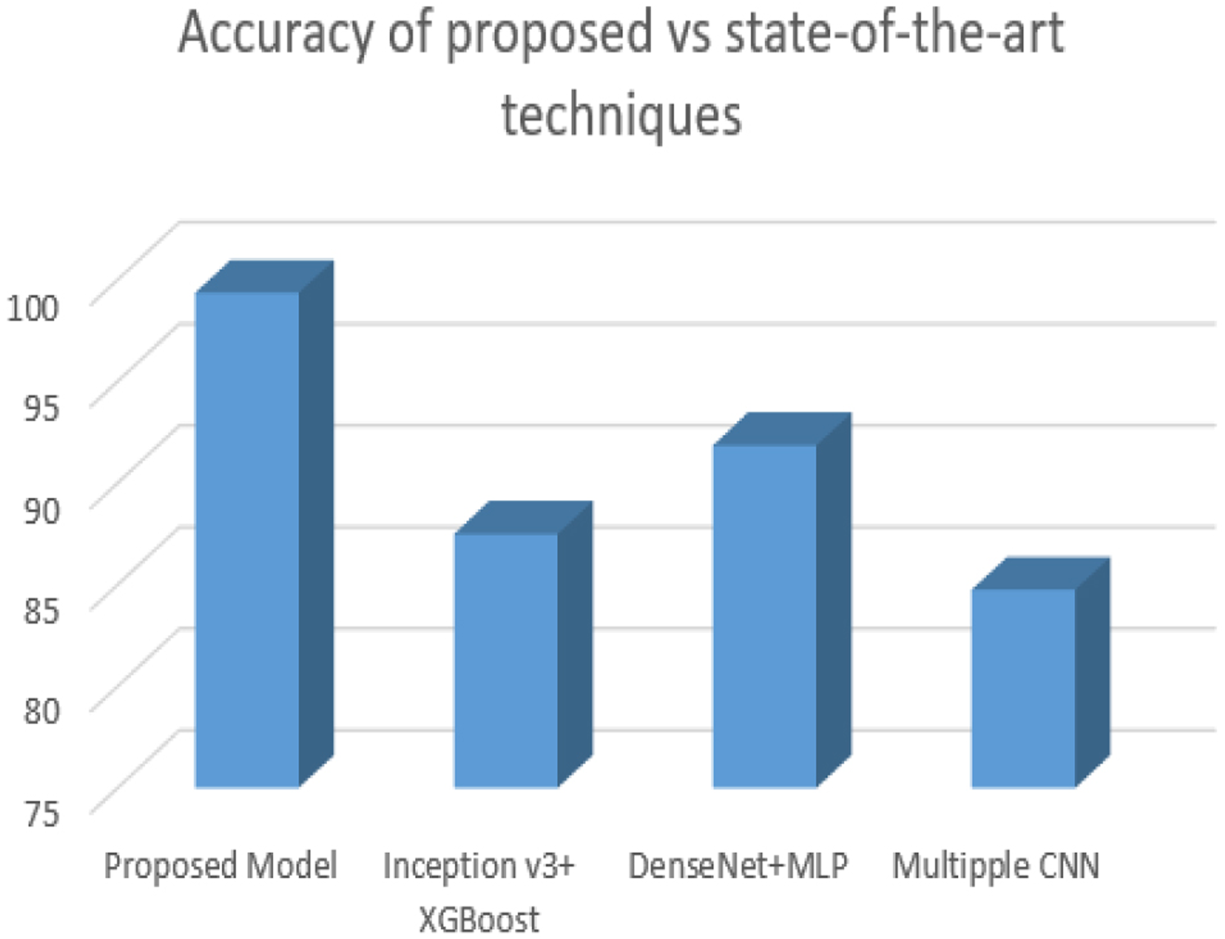
Proposed hybrid model accuracy VS state-of-the-art methods in the current environment.
Figure 16 visualizes the accuracies achieved by state-of-art hybrid techniques employed in the simulation environment same as the environment used for the proposed framework. Showcasing the efficacy of the proposed hybrid model over the recent SOTA techniques when implemented in the current environment.From the graph, it is evident that the proposed hybrid model bragged better performance compared to that achieved by the state-of-the-art techniques. The proposed hybrid model achieved an accuracy of 0.9936 on BreakHis dataset.
Overall, the time and space complexity of the model can be quite high, especially for large input data and a large number of trainable parameters. However, these problems can be minimised with the aid of effective algorithms and hardware accelerators like GPUs. Furthermore, methods like early stopping and weight regularisation can assist in reducing the amount of trainable parameters as well as decreasing overfitting, both of these can lower the model’s time and space complexity. For fair complexity analysis, the BreakHis dataset is used as it is large compared to the BACH dataset.
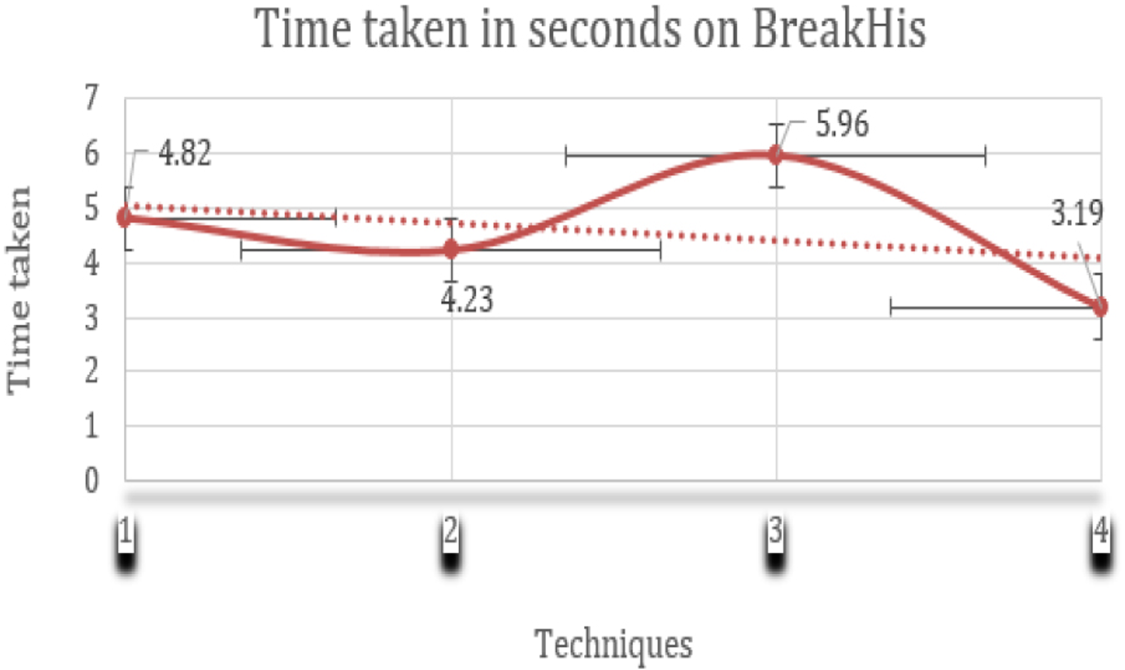
Time Complexity: The primary objective of our framework is not only to integrate the efficiency of the proposed model but also to enhance the computational efficiency of the model. The computational efficiency in terms of time complexity of state-of-the-art methods is compared with the proposed framework in Table 9. The table provides insights into the efficiency of our proposed hybrid model, which took 3.19 seconds of time per image time, making it the most computationally efficient option when compared with state-of-the-art hybrid techniques. Meanwhile, the state-of-the-art techniques took 4.82,4.23 and 5.96 seconds per image making them computationally inefficient. Figure 17. Visualizes the comparison between different state-of-the-art models and the proposed hybrid model in terms of time taken per image. On the x-axis, we have the time taken in seconds and on the y-axis we have the classifiers on the techniques used. It can be analysed from the figure that the proposed hybrid model took less time when compared with the state-of-the-art models when executed on the same platform.
Presents the computational efficiency of state-of-the-art techniques compared with the proposed framework on the BreakHis dataset.

Presents the computational efficiency of state-of-the-art techniques compared with the proposed framework on the BreakHis dataset.
Presents the computational efficiency of state-of-the-art techniques compared with the proposed framework on the BACH dataset.

The Area chart shows the time taken per image in seconds for the hybrid model on BreakHis dataset.
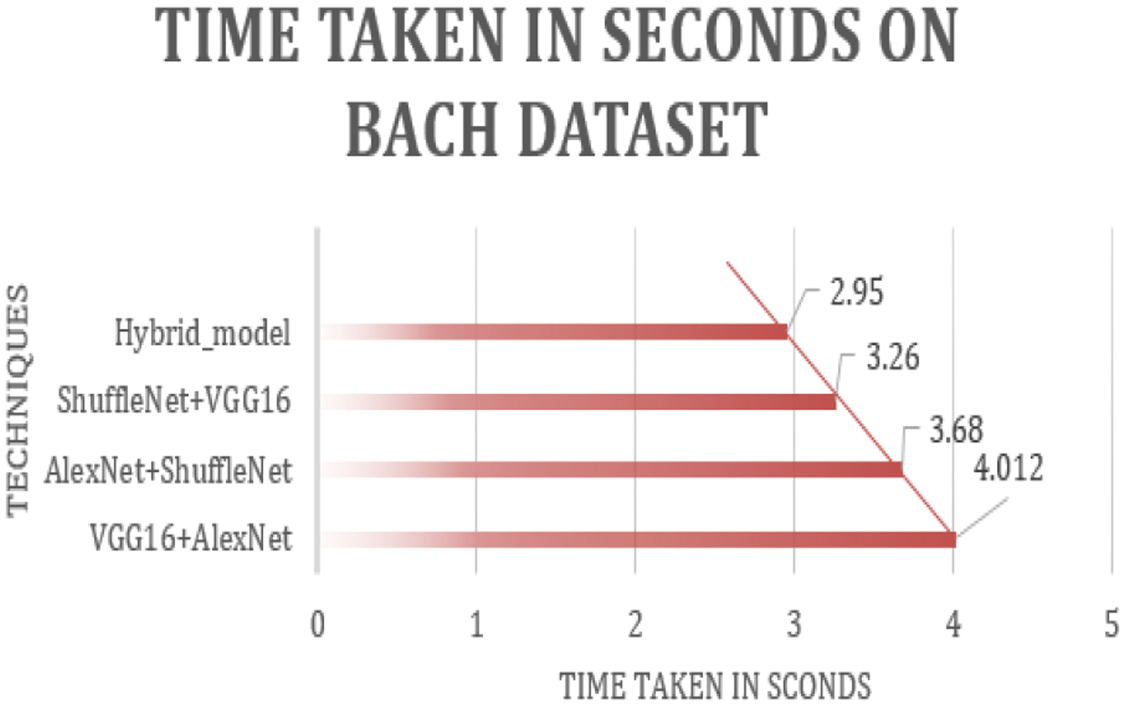
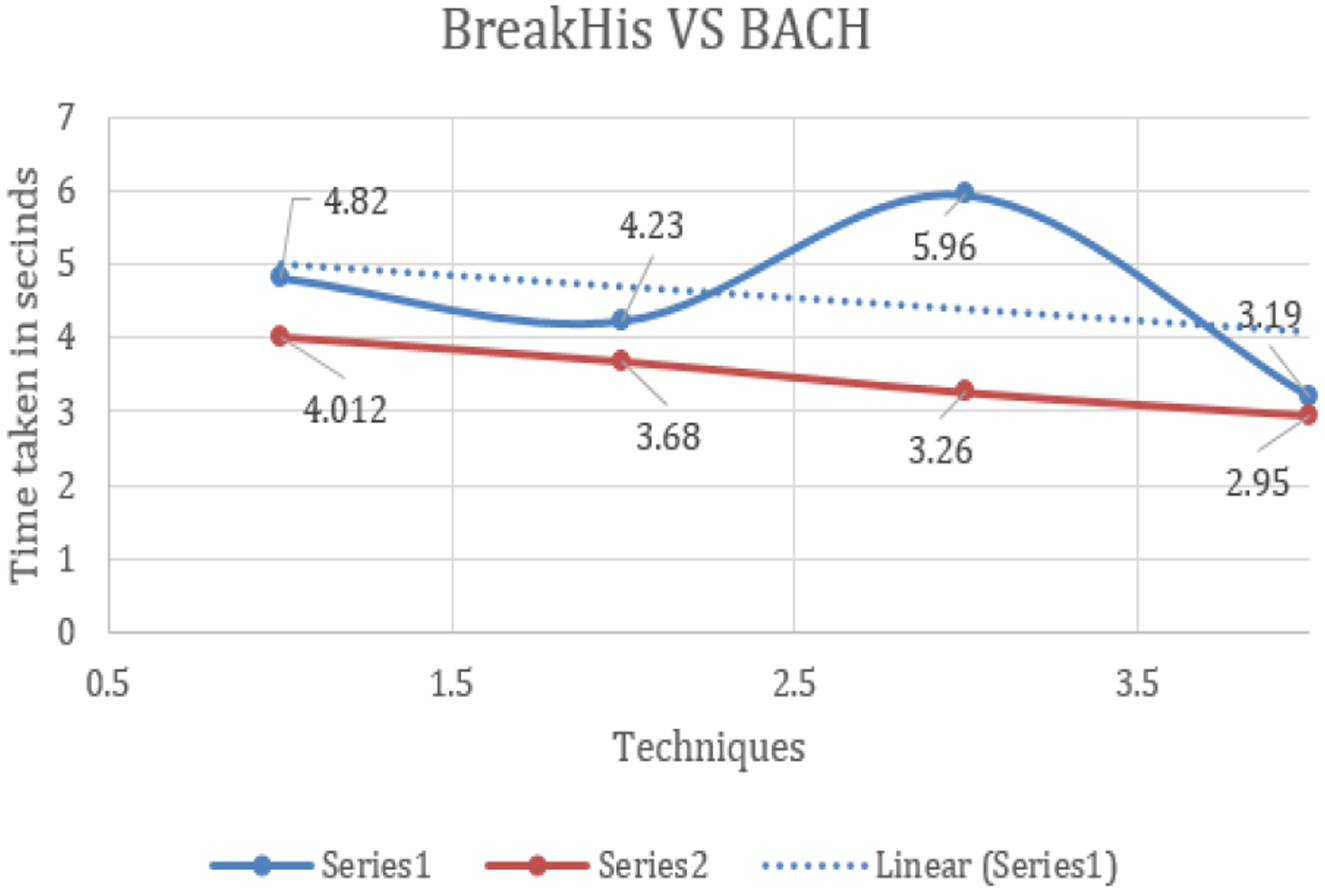
Table 10 presents the computational efficiency of state-of-the-art techniques compared employing the proposed framework on the BACH dataset. The table provides insights into the efficiency of our proposed hybrid model, which required 2.95 seconds per image time, making it the most computationally efficient option when compared with state-of-the-art hybrid techniques. Whereas, the state-of-the-art techniques took 4.012, 3.68 and 3.26 seconds per image making them computationally inefficient. Figure 18. Visualizes the comparison between the different state-of-the-art models and the proposed hybrid model in terms of time taken per image when applied to the BACH dataset. On the x-axis we have the classifiers or the techniques used and the time taken per image in seconds on y-axis. It can be analysed from the figure that the proposed hybrid model took less time when compared with the state-of-the-art models when executed on the same platform. Figure 19. The area chart shows a comparison of time taken per image in seconds for the hybrid model between BreakHis and BACH. It can be visualized from the graph that the same hybrid model when applied to the BACH dataset took less time per image when compared to the time taken on the BreakHis dataset, this is because compared to the BreakHis dataset BACH dataset has less number of images due to which the overall time is reduced.
The Area chart shows the time taken per image in seconds for the hybrid model on BACH dataset.
The Area chart shows a comparison between the time taken per image in seconds for the hybrid model between BreakHis and BACH.
Space Complexity: The space complexity of the proposed model is proportional to the quantity of trainable parameters within the proposed model. This is because each trainable parameter requires a certain amount of memory to store its value, and the total memory required to store all the trainable parameters is proportional to their number. In addition to the trainable parameters, the model also requires memory to store the input data, intermediate activations, and gradients during training. The memory required for these operations is proportional to the size of the input data, the number of units in the model, and the number of training steps required to train the model. Any DL model takes millions of trainable parameters due to which space complexity is increased for large-scale models and datasets. The main objective of the proposed model is to improve the computational efficiency of the model which is achieved by employing two techniques in the model that are:
Usage of Multi scale Nystrom attention mechanism in the Transformer: By employing the multi-scale Nystrom attention mechanism instead of the default self-attention module the overall computational efficiency of the model is improved. Employment of CDBA for multi-model fusion: Instead of taking all the features extracted by both the classifiers and fusing them, the novel CDBA technique fuses only those features that are contributing to the model efficiency.
Scalability Performance
Finally, we have observed enhanced scalability characteristics in our proposed model. Remarkably, as we increased the epoch number from 10 to 50 and it is represented on x-axis in the range 1–5, the accuracy of our proposed model remained nearly unchanged, indicating its scalability. Figure 15 visualizes the the scalability performance of our suggested model. Figure 20 it can be observed that even by changing the epochs also 0.99 is the constant accuracy of the model showing its efficiency.

Scalability analysis of our proposed model.

Comparison of accuracies of Ablation study cases on BreakHis dataset.
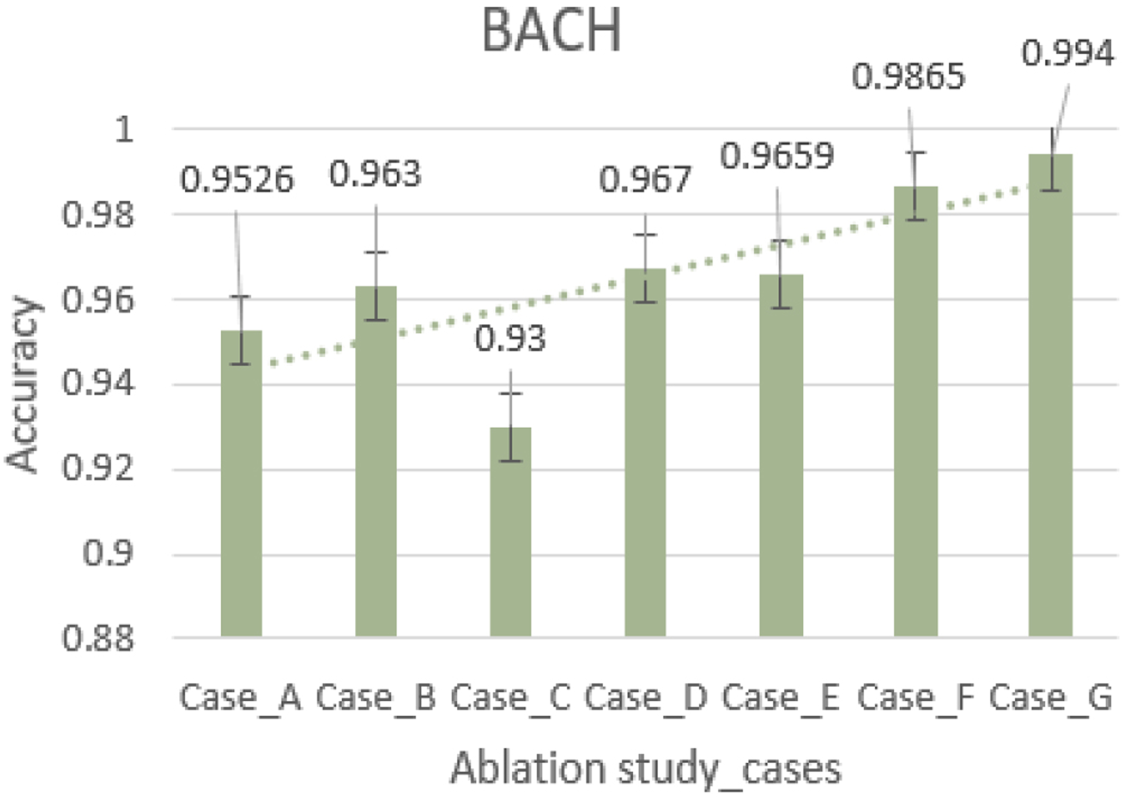
This section includes an ablation investigation to validate the efficiency of the proposed framework. Specifically, the framework is trained on the BreakHis and BACH datasets. The following cases are evaluated:
Case A: The model is trained exclusively on the InceptioResNetV2 baseline architecture. Case B: The model is trained only on the baseline architecture of ViT. Case C: The model is trained with the proposed architectures of InceptioResNetV2. Case D: The model is trained only proposed architecture of ViT. Case E: The model is trained without framework by training it on the hybrid model. Case F: The model is trained with the framework without utilizing the CDBA technique for fusing the features. Case G: (proposed model): The model is trained with a proposed framework by integrating proposed architectures of classifier, classifier 2, multi-head linear time attention layer, and CDBA for feature fusion to the framework.
Figures 21 and 22 visualize the performance analysis of different Ablation study cases on BreakHis and BACH datasets from the figures it can be observed that the performance of the models improved with the novelty added to the framework. Table 11. Shows the time taken by classifier 1, classifier 2 and hybrid classifier (Case C, D, G). It is apparent from the table that classifier 1 completed its task in 1.65 seconds, while classifier 2 took 1.52 seconds. In contrast to the default attention mechanism, the modified attention mechanism in the proposed classifier 2 required 1.35 seconds per image, showcasing its improved computational efficiency.
Presents the computational efficiency of techniques employed in the framework.

Comparison of accuracies of Ablation study cases on BACH dataset.
In conclusion, our research presents a pioneering and efficient DL (DL) framework for Breast Cancer Image classification, introducing novel design elements that elevate its capabilities in medical imaging datasets. The Hybrid Approach proposed addresses the challenge of generalization across varying dataset sizes, employing a synergistic combination of features from two classifiers to enhance adaptability and ensure robust performance across diverse data complexities. The introduction of an Efficient Attention Mechanism in one of the classifiers represents a significant advancement, optimizing focus on critical features and contributing to both enhanced accuracy and computational efficiency. Our Resource-Efficient Optimization through feature selection further establishes a judicious balance between computational efficiency and model performance, streamlining high-dimensional features for optimal hybridization. The consideration of heterogeneity within each classifier in our framework marks a substantial leap forward in accurate tumor class predictions, providing a more comprehensive understanding of intricate data variations. Extensive analysis on datasets such as BreakHis and BACH demonstrates the high accuracy, efficiency, and scalability of our proposed model, positioning it as a promising solution for advancing breast cancer prediction in clinical and research applications. Our methodological advancements, ranging from framework and hybrid model design to intricate feature selection algorithms and nuanced consideration of classifier heterogeneity, collectively contribute to the state-of-the-art in breast cancer classification research. In summary. this holistic framework not only significantly improves classification accuracy but also establishes optimization, showcasing its potential for impactful contributions to the field. In the future, with the recent development of more computer vision models, it would be able to experiment with newer model’s as the framework’s core architectural models to further enhance classification performance. Another strong research possibility is the generalization of the proposed architecture to other Bio medical computer vision problems to make sure that minimal resources and time are utilized to complete a given task.
Key conclusions
Model Proficiency: The fine-tuned framework performed well across all criteria, demonstrating the value of task-specific fine-tuning. Framework demonstrated robustness in maintaining semantic coherence, whereas individual models failed in, emphasizing the model for handling class imbalance. Metrics Reveal: Multiple metrics presented a comprehensive perspective of model performance, emphasizing the shift in classifiers performance from syntactic replication to deeper semantic understanding. Model Selection Guidance: Our comparative analysis can help experts choose the best model for their specific summarizing goals, such as coherence, knowledge retention, or overall quality.
Limitations
Despite its proficiency in handling class imbalance, proposed framework faces certain limitations. The frameworks reliance on labeled data may hinder its adaptability to diverse scenarios. Its effectiveness may fluctuate as new real world data is generated, necessitating continuous adjustments. Moreover, the scalability and real-world applicability of the proposed framework require further scrutiny for a holistic solution to address the complexities of imbalanced dataset’s challenges.
Future work
Most of the research in Breast cancer using AI methods has been solely in classifying whether the particular image contains cancer or not. However, much work remains in detecting cancer stages, progression rates, and age group impacts. Understanding the stage of cancer is crucial for determining the most effective treatment options and prognosis. Accurate assessment of progression rates can help in monitoring the disease’s advancement and adjusting treatment plans accordingly. Additionally, examining how different age groups are affected by breast cancer can provide insights into risk factors, early detection strategies, and tailored prevention programs. By addressing these aspects, we can develop a more comprehensive approach to breast cancer management, ultimately improving patient outcomes and quality of life.
Potential applications
Integrating the framework into clinical practice can provide real-time recommendations and second opinions to clinicians, aiding in early detection and informed decision-making. Advanced image processing techniques employed within the framework accurately identify unique patterns and correlations for extraction of relevant features resulting in classification of tissue types. This capability helps in identifying potential biomarkers and understanding the underlying mechanisms of breast cancer. This aid radiologist in development of appropriate personalized treatment plans based on the unique tumor characteristics leading to more effective therapy.
Footnotes
Consent to participate
There is no human involvement in this implementation procedure.
Credit authorship contribution statement
Each of the authors made an equal contribution to the drafting of the first draft, methodology, data curation, and visualisation.
Funding information
No funding received.
Declaration of competing interest
The authors state that no known competing financial interest or personal relationship have had any influence on any of the work disclosed in this study.
Human and animal rights
There is no violation of the rights of humans or animals.
Research data policy and data availability statements
Dataset is publicly available on the repository.