
Abstract
Vascular access stenosis and venous needle dislodgement (VND) are frequent and serious life-threatening complications during hemodialysis (HD). According to dialysis survey reports, these complications are key issues for nephrology nurses, medical staff, and patients. Existing detection techniques and early warning tools provide promising solutions in these issues. However, these methods cannot screen for stenosis and VND complications during HD. Clinical examinations show that increases in transverse vibration pressure (TVP) are highly correlated with stenosis screening in arterial anastomosis sites (inflow needle); conversely, TVP drops in the event of a blood leak or VND in venous anastomosis sites (outflow needle). As an early-warning implementation, this study proposes a combination of fractional order integrator (FOI) and info-gap (IG) decision-making to detect these complications. FOI is used to calculate the TVPs’ area under curve (AUC), while AUC ratio (AUCR) quantifies the differences in TVPs between the normal condition and pressure sensor reading. An estimated function of the two-point form shows that AUCRs have a high correlation with TVP variations. Therefore, AUCR is employed to identify changes in TVPs and arrange specific allocations. The IG decision-making scheme produces inference profiles with specific allocations to separate the normal cases from vascular access stenosis or VND/blood leakage. The test results obtained from practical experiments were validated and compared with the results obtained using existing methods such as acoustic techniques, warning products, and homodynamic analysis. The findings also show that the proposed framework employing pressure sensors can be implemented in an early warning monitor for clinical and telemedicine applications.
Keywords
Introduction
Hemodialysis (HD) is a routine treatment prescribed three days a week for end-stage renal disease (ESRD) patients. Some life-threatening complications frequen- tly occur during HD, such as vascular access stenosis, venous needle dislodgment (VND), and serious blood loss. These complications cause morbidity and mortality, while early clots and progression of thrombosis result in reduced blood flow through an arteriovenous fistula (AVF) or an arteriovenous graft (AVG) [1, 2]. Blood circuit disconnection and dislodgement of the venous needle from vascular access result in rapid blood loss [3, 4]. Significant stenosis, defined as a decrease of
Other life-threatening complications, such as HD machine stop and VND, result in blood circuit disconnection, blood leak, and blood loss. In HD treatment, a blood flow rate of 400–500 ml/min can loss more than 40% of the adult blood volume in a few minutes [5]. When a VND occurs in the patient, a flow rate of 200–500 ml/min is usually discovered after about 20 s. The loss of
The proposed fractional order info-gap (IG) decision-making model.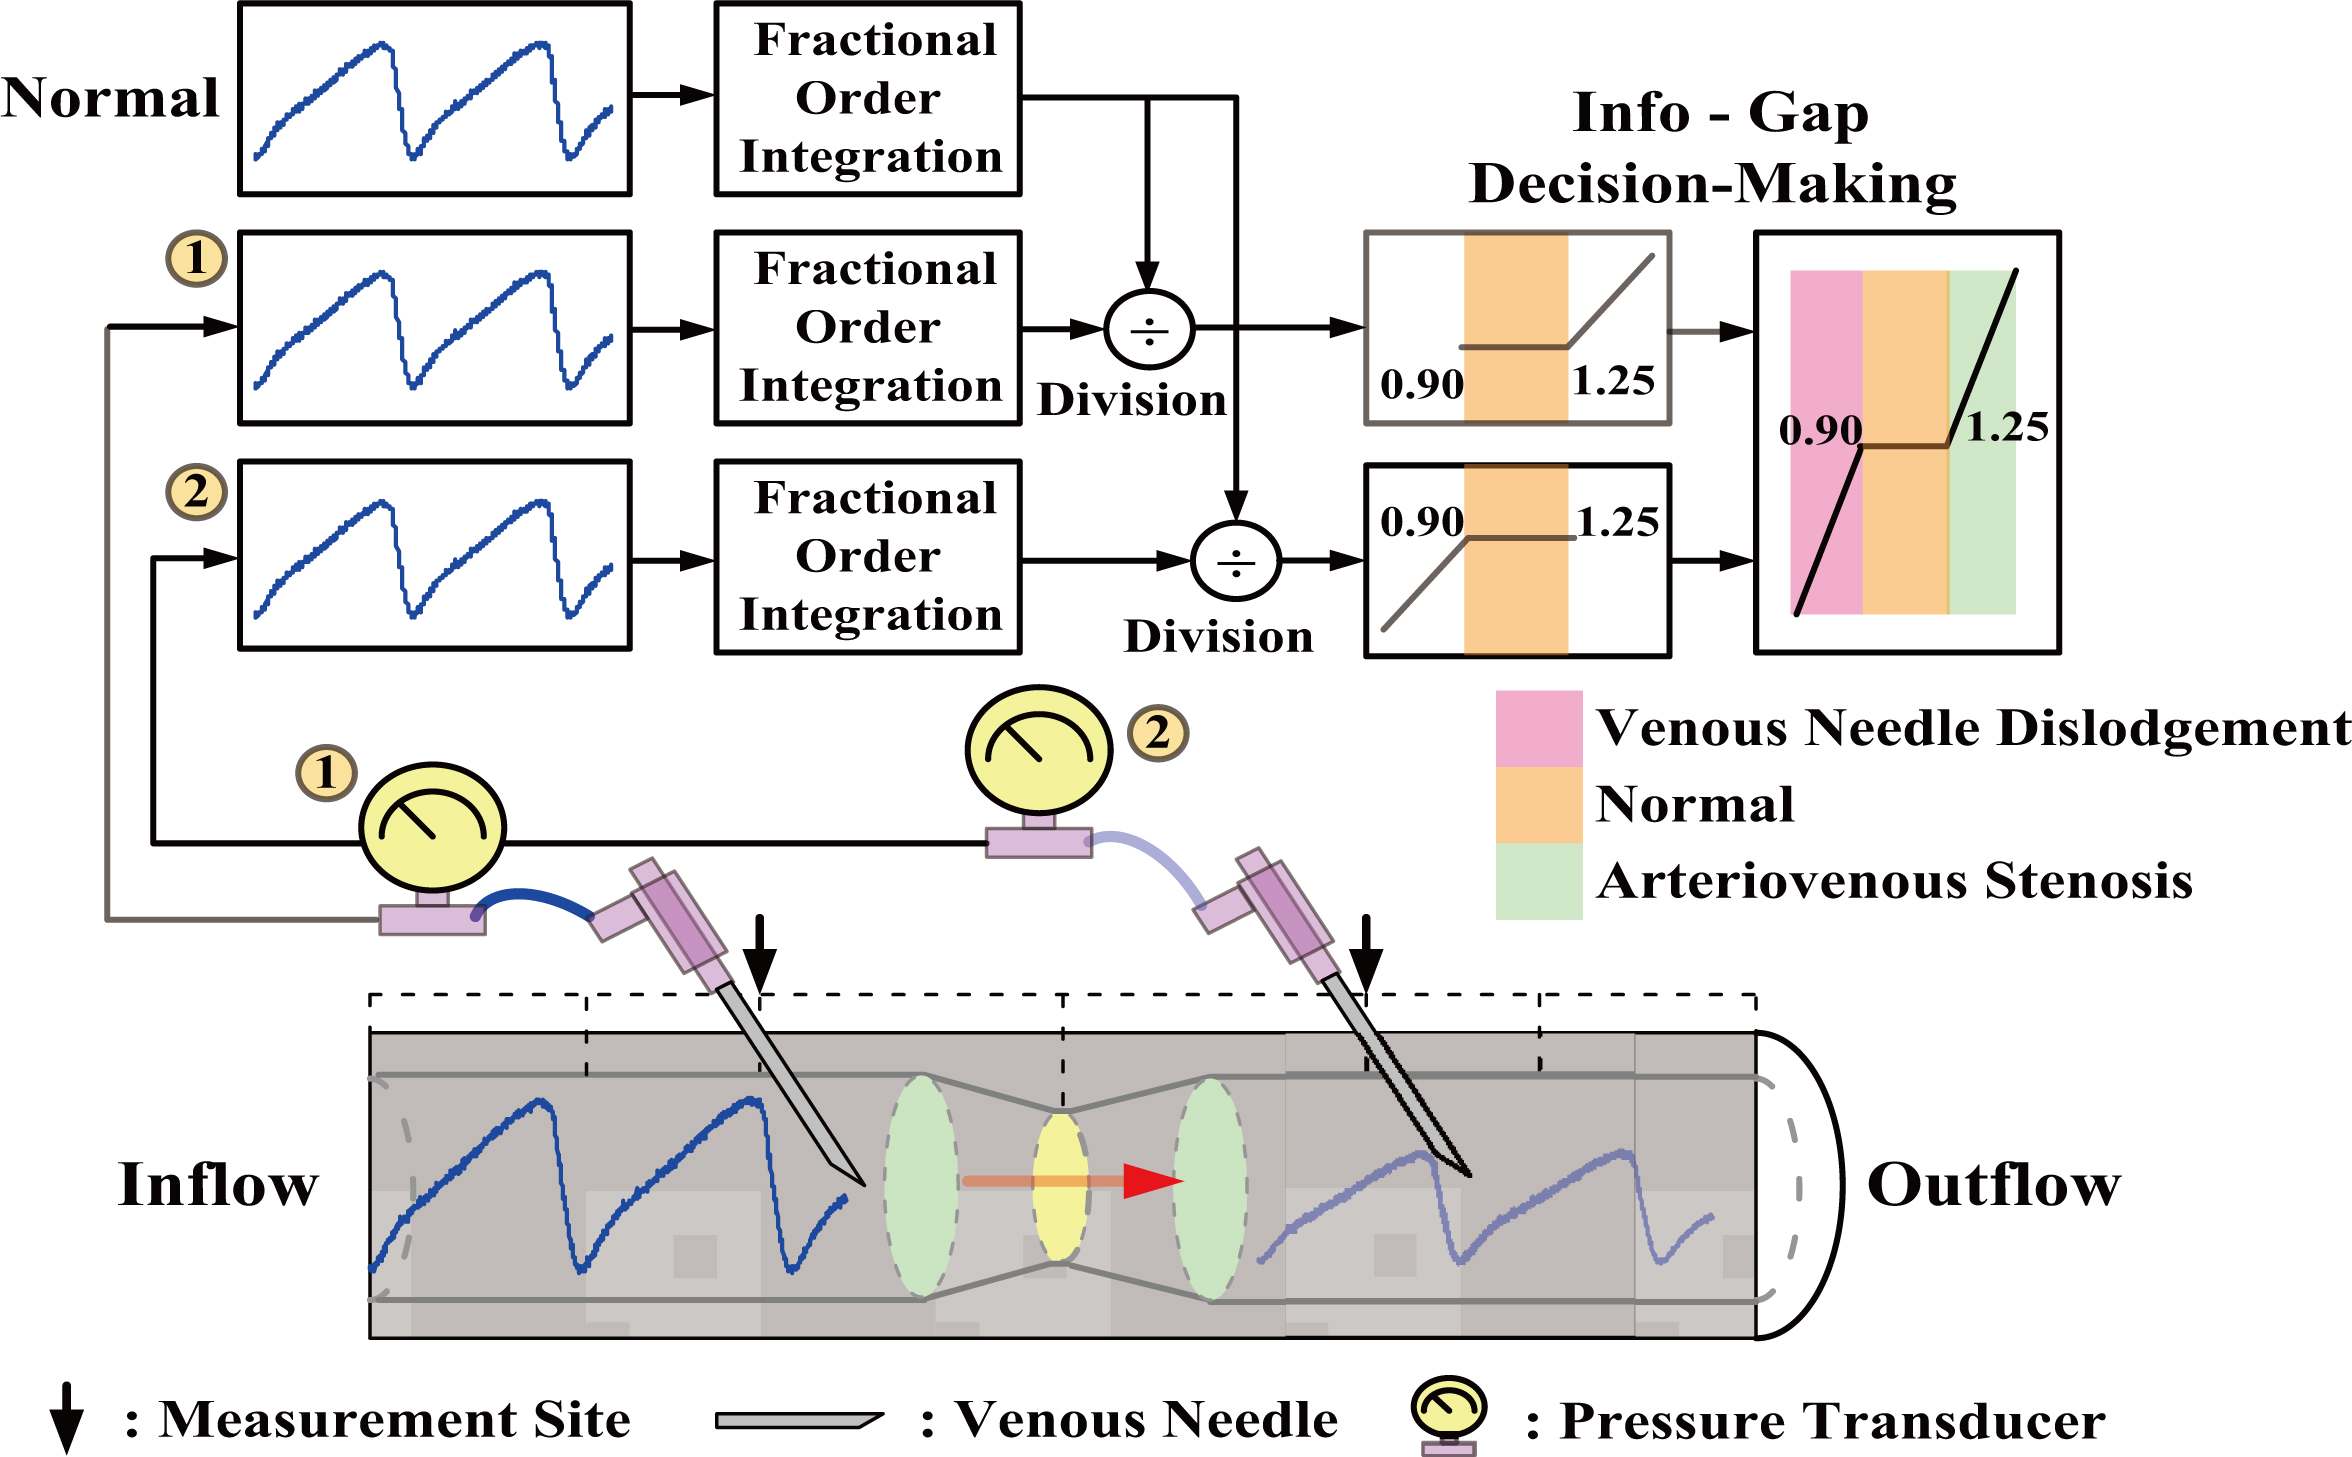
Equivalent human cardiovascular system. (a) In-vitro AVG biophysical experimental model, (b) Venous needles, (c) Stenotic accesses, DOS 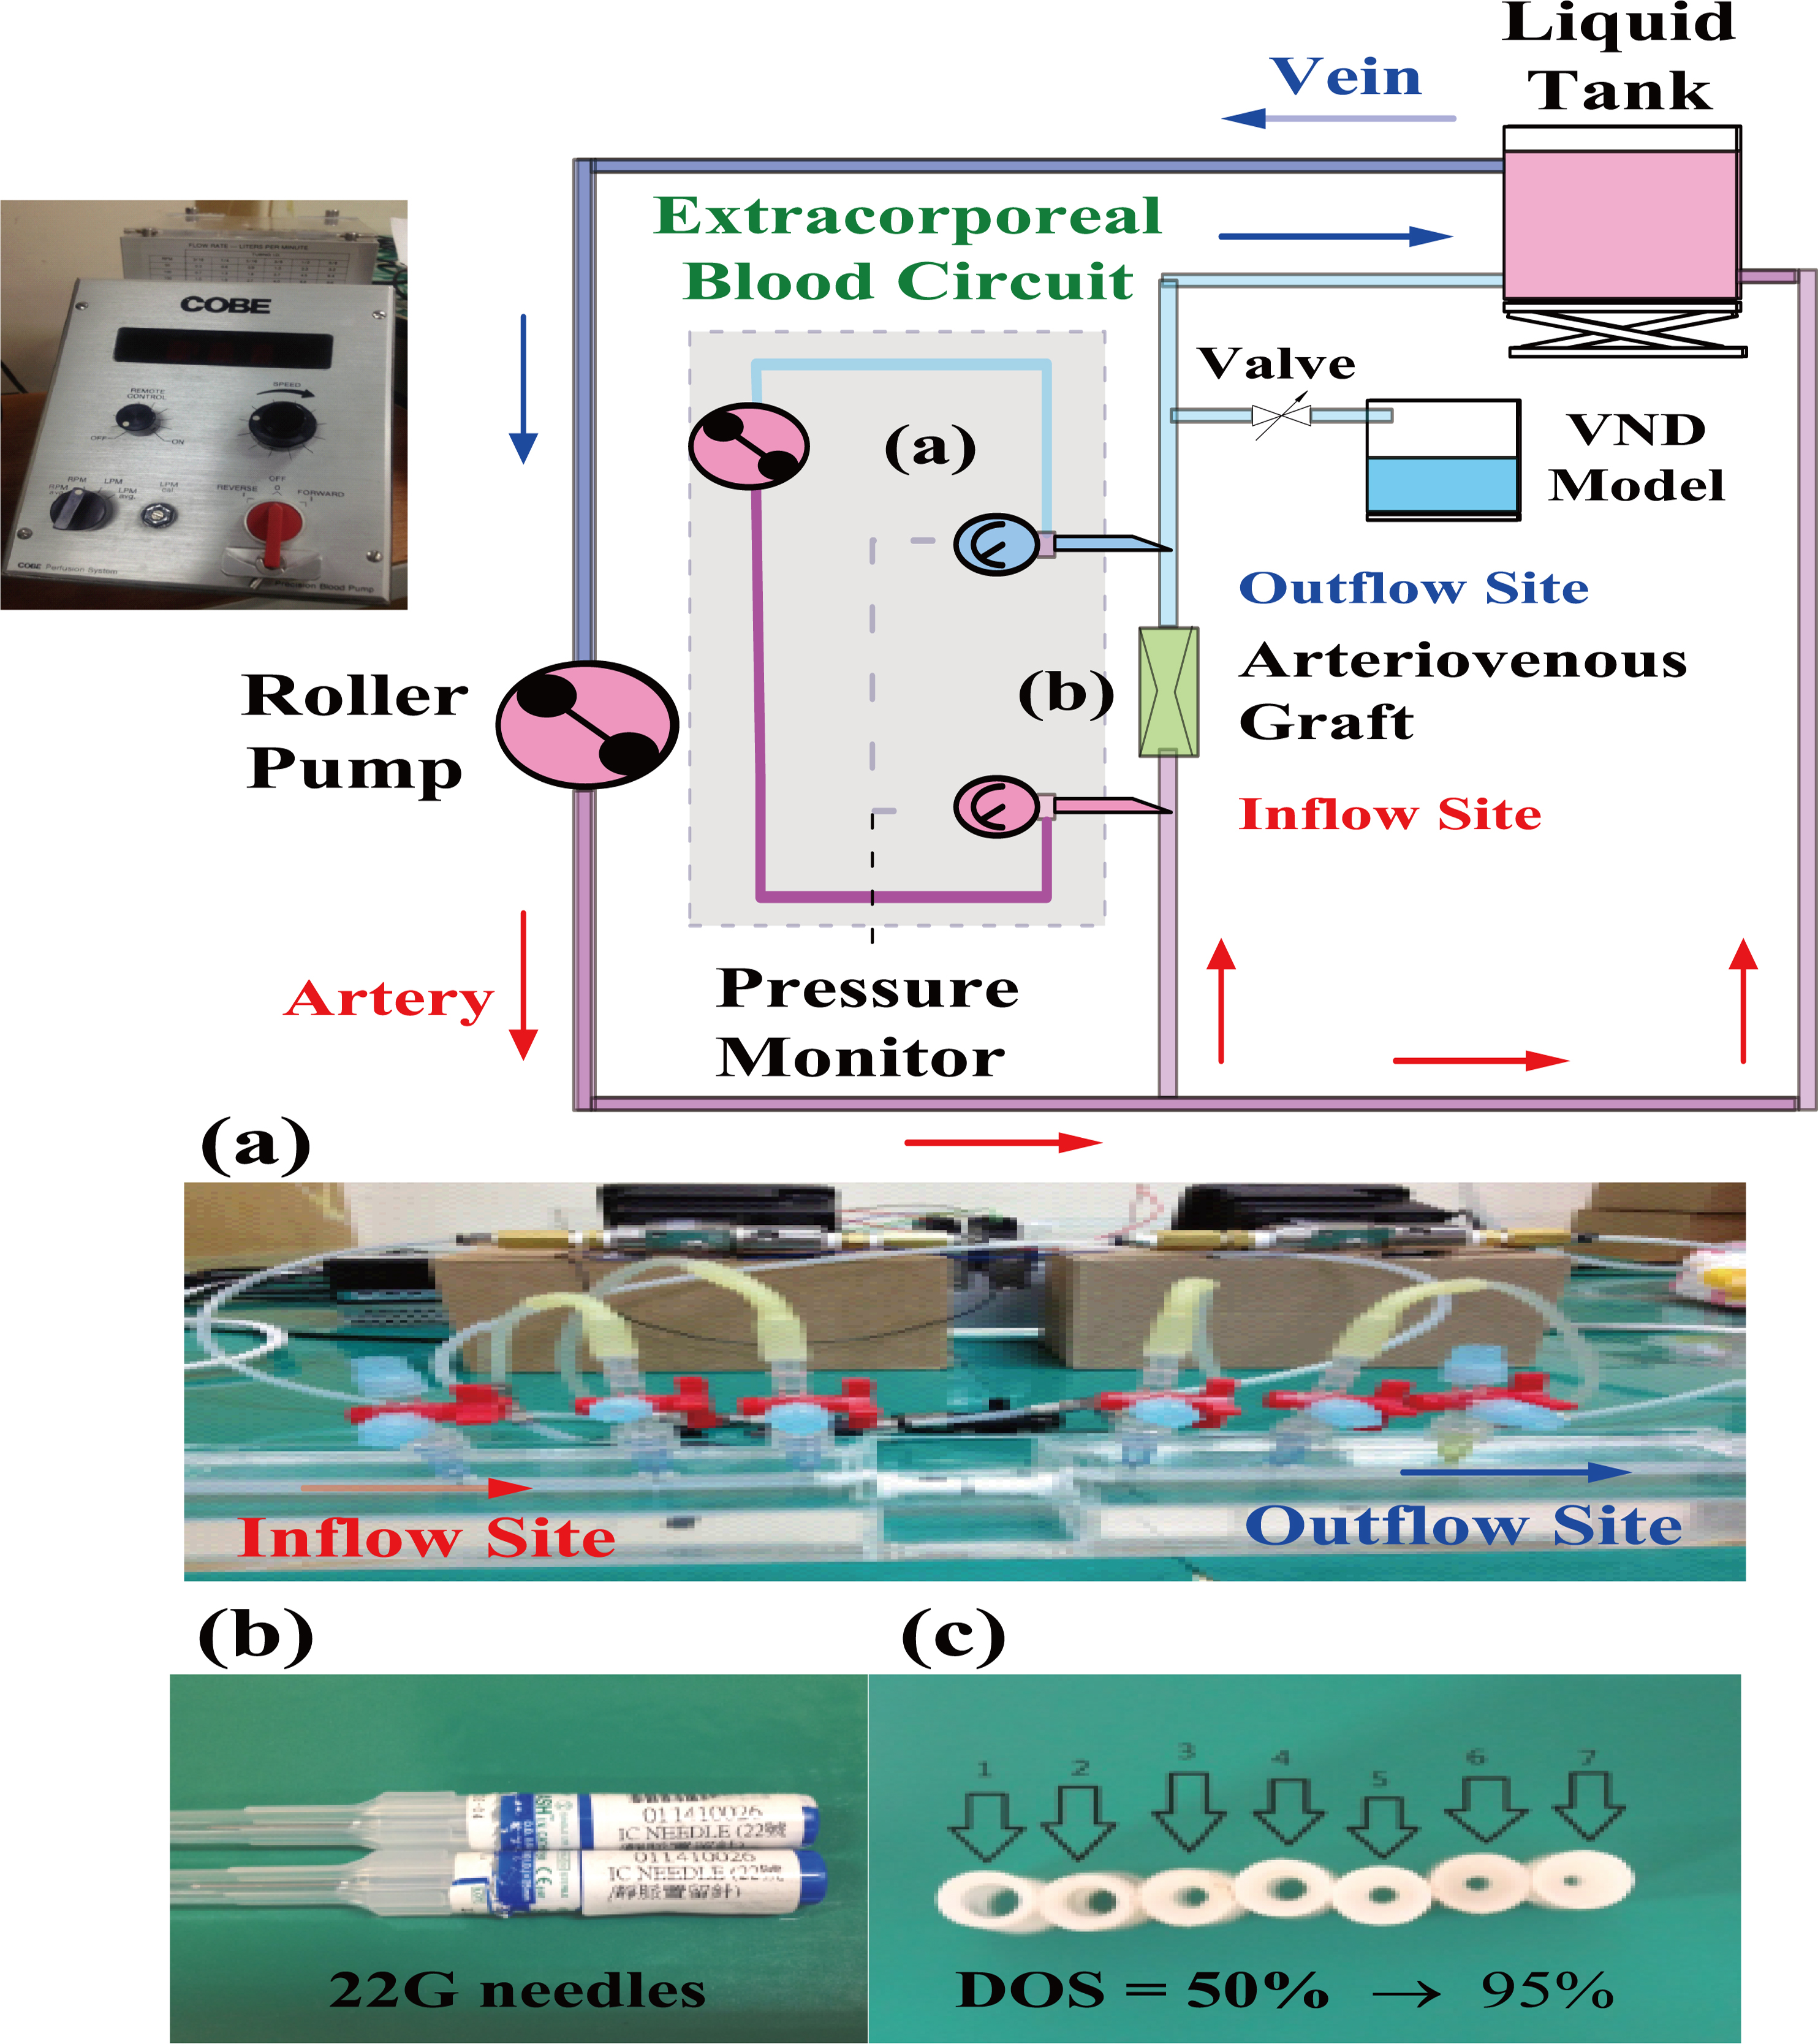
For clinical examinations of arterial and vascular stenosis, acoustic methods such as phonoangiography (PAG), Doppler ultrasound, and Doppler flowmeter [11, 14, 15] are well-known non-invasive techniques. Previous studies have indicated that PAG can be employed to estimate the DOS at venous anastomosis sites. However, changes in frequency and amplitude are dependent on the numbers of stenosis and monitoring sites, and the degree of severity of stenosis. Ultrasound waves of frequencies 7.5–10 MHz can be used to measure the peak systolic velocity (PSV), peak diastolic velocity (PDV), and heart rate for vessels with a diameter of 5–12 mm [16]. The Reynolds numbers and resistance indexes can be used to identify both cardiovascular diseases and vascular access stenosis by using the PSV and the PDV. However, these techniques cannot be used to detect VND events during HD. For severe blood loss, a pad device can be used as an early warning mechanism, for example, the use of a wetness sensor or an optical sensor (CE Mark, Redsense
A blood pressure wave (BPW) generated by a heartbeat propagates through the arterial vascular system and enters the extracorporeal blood circuit. BPWs can be measured by pressure sensors connected to the arterial and the venous blood circuits. According to previous studies [10, 11], vascular access stenosis leads to an increase in flow resistance and unstable flow. Vascular compliance also varies according to the pressure–blood volume relationship. Elastic vascular walls are subjected to stress under the biomechanical forces acting on them, and vibrations are induced in a stenotic access due to TVP. As the TVP amplitude increases, variations in TVP can be used to evaluate the DOS at the inflow site [18]. In addition, blood leakage or a severe blood loss will cause the TVP amplitude to decrease and has a low correlation with heart pulses at the outflow site. Therefore, TVP variations are used to identify vascular access stenosis and VND events both at the inflow and outflow sites, respectively.
BPWs can be ascribed to roller pump pressures and arterial access (fistula)/venous access (fistula) pressures through the extracorporeal blood circuit, as shown in Fig. 2. These indicate fluctuations and specific ranges of pressure variations in the BPWs. TVP waves move perpendicular to the direction of propagation of BPWs, and they can be extracted from BPWs. Using the detrending process [19, 20], the arterial/venous pressures, roller pump pressures, and mean vascular access pressures are determined [3] for further analysis. Its process emphasizes the prices fluctuations to separate the trends and variations. For real-time analysis, discrete fractional order integrator (FOI) [21, 22, 23, 24] with finite computations, short-memory requirement, and a finite power series are employed to calculate the TVPs’ area under curve (AUC) [25]. Then, the ratio of the AUC of the measured TVP to that of the normal TVP is determined to identify vascular access stenosis and VND events. The IG decision-making [26, 27, 28] scheme uses a screening model to automatically separate the levels of stenosis: DOS%
(a) Normalized TVPs versus time interval, (b) Average pressure versus average blood flow for arteriovenous stenosis and venous needle dislodgement.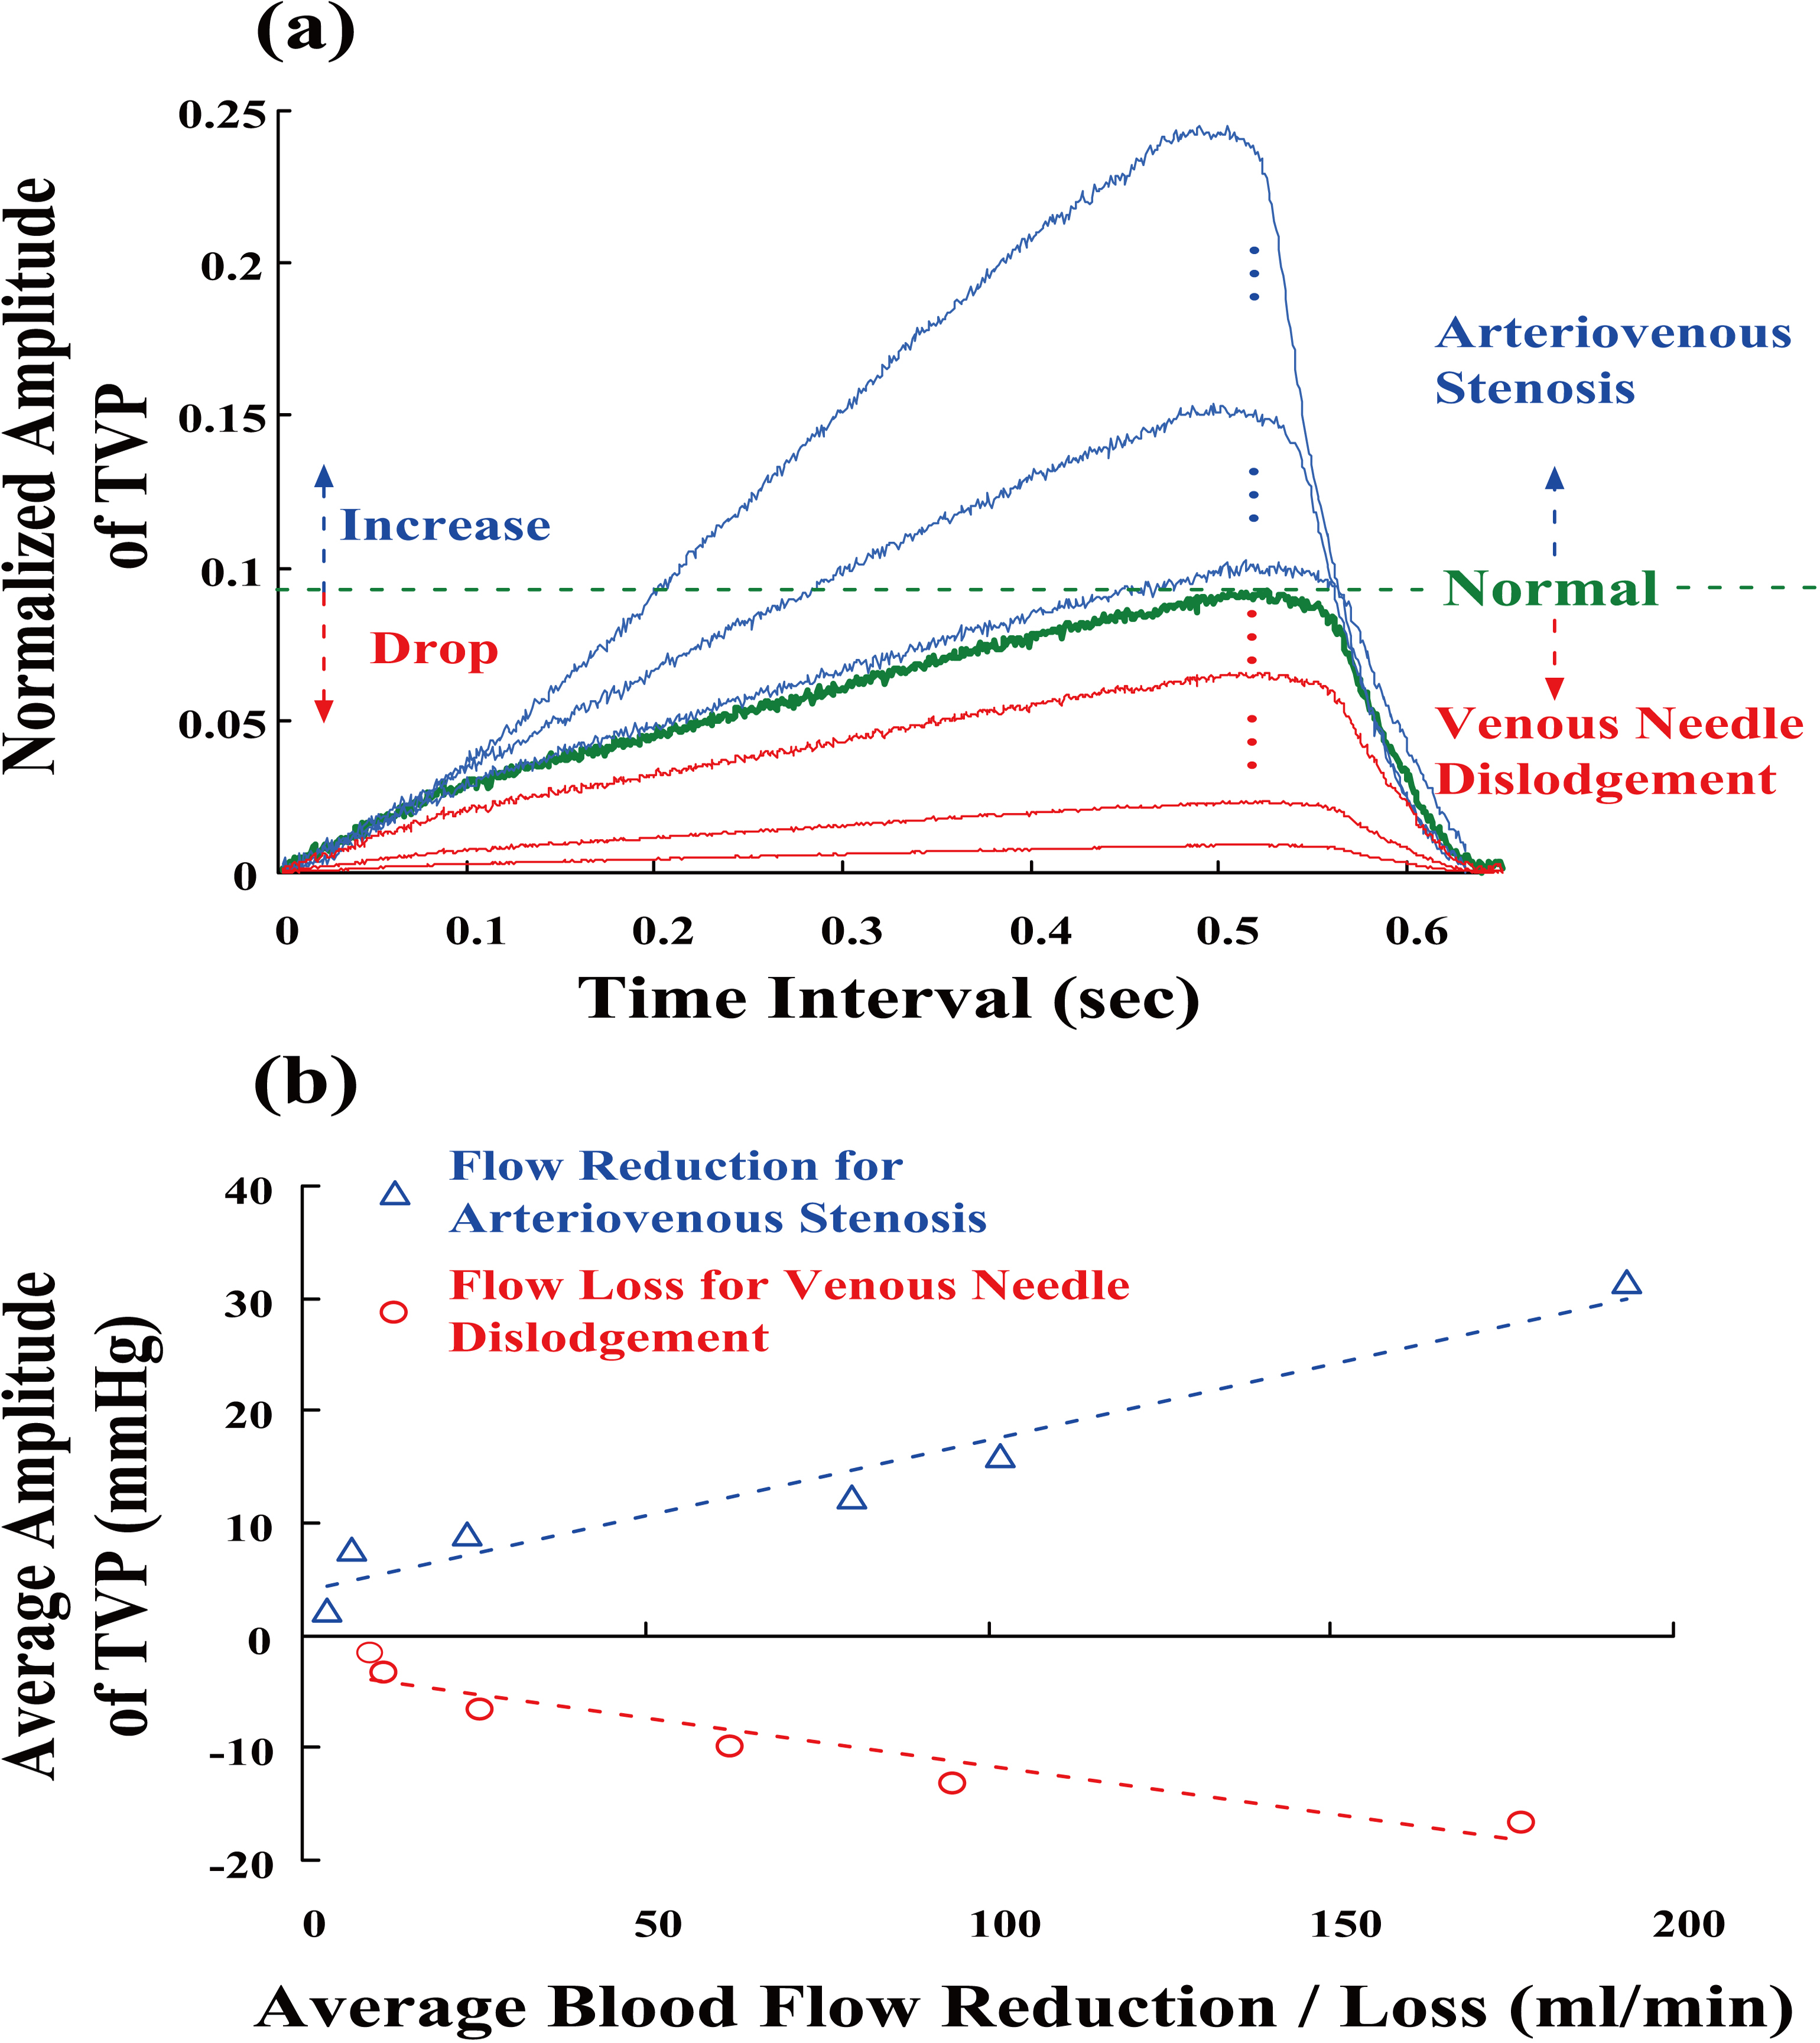
Figure 2 shows the equivalent human cardiovascular system and the extracorporeal blood circuit for an HD patient, which represent the mock blood circulation in an experimental study. This experimental circulation system uses a roller pump as a pressure source regulator (Precision blood pump, COBE, LAKEWOOD, CO80215, USA), a liquid tank, silicone tubes as arteries and veins, and a stenotic graft. The roller pump simulates (40–80 rpm) various parameters of an adult’s blood circulation, such as heart beat, blood pressure, and pulsatile flow. It is used to control the flow rates, blood pressures, and heart rates during HD with a flow rate of approximately 600–1000 ml/min. A heart rate of 80–120 beats/min was used to drive the blood-mimicking fluid (BMF) through different stenotic grafts, as shown in Fig. 2c. The DOS is defined as follows [14, 15]:
where
The blood flow rates (ml/min) and blood pressures (mmHg) were measured at the inflow and outflow sites using a pressure monitor equipped with 22G-venous needles (Terumo Surflash), pressure sensors, and flowmeters, while are continually monitored on the BPWs screen, as shown in Fig. 2a and b. The measurement data was transferred to a tablet PC for further analysis using a data acquisition card (National Instruments™ Compact DAQ-9178 card, analog-to-digital converter, 8 channels, and 1 MHz sampling rate). Thus, the BPWs were obtained and distinguished from the roller pump pressures and mean vascular access pressures using the detrending process [19, 20]. As can be seen in Fig. 3a, the normalized TVPs were extracted from BPWs at inflow and outflow sites as follows:
where detrend (
Based on 36 measurements, when a graft’s inflow stenosis is exacerbated, the inflow pressure and flow resistance increase. TVPs induce vibrations of the elastic vascular wall. In contrast to normal TVP, the amplitude of a TVP increases gradually (symbol “
Changes in amplitudes and pulse shapes, andAUC [25] were employed to separate a normal TVP from TVP variations. In this study, the index of AUC ratio (AUCR) is used to evaluate the similarity and is defined as
where TVP
Discrete fractional order integrator (FOI)
Fractional calculus is a generalization formula involving integration and differentiation operations, and its continuous non-integer order operator,
The Riemann-Liouville (R-L), Grünwald-Letnikov (G-L), and Caputo definitions are three well-known methods for derivative and integral numerical approximations.
Traditional integer integration and differentiation operations use integer-order differential operators with Tustin and Laplace transform methods, and trapezoidal integration methods for geometrical interpretations [21]. According to the G-L definition [24], a generalization formula for
where
Thus, the FOI can apply all non-integer and irrational numbers to deal with the signal,
For dealing with the time-varying signals such as fluid flows and bio-signals, the G-L definition is used as the basic concept for discrete processing during computations. The fractional-order integral suggests the use of non-integers to deal with bio-signals, and the corresponding binomial coefficients are computed using the ratios of the Euler’s Gamma function,
In this study, the fractional-order derivative of the order parameters,
where
time step:
where
where time steps,
An IG distribution model can be used to represent the uncertainty in a relationship between two parameters or a few key parameters [26, 27, 28]. Its model is a family of nested sets, which represents an infinity of possible realizations of an uncertain entity. A common model can be defined as follows:
where
Allocation parameters for info-gap distribution model
(a) TVP amplitude variations versus AUCRs, (b) The revenue (pressures) profiles versus the allocation (AUCRs) for screening arteriovenous stenosis and VND.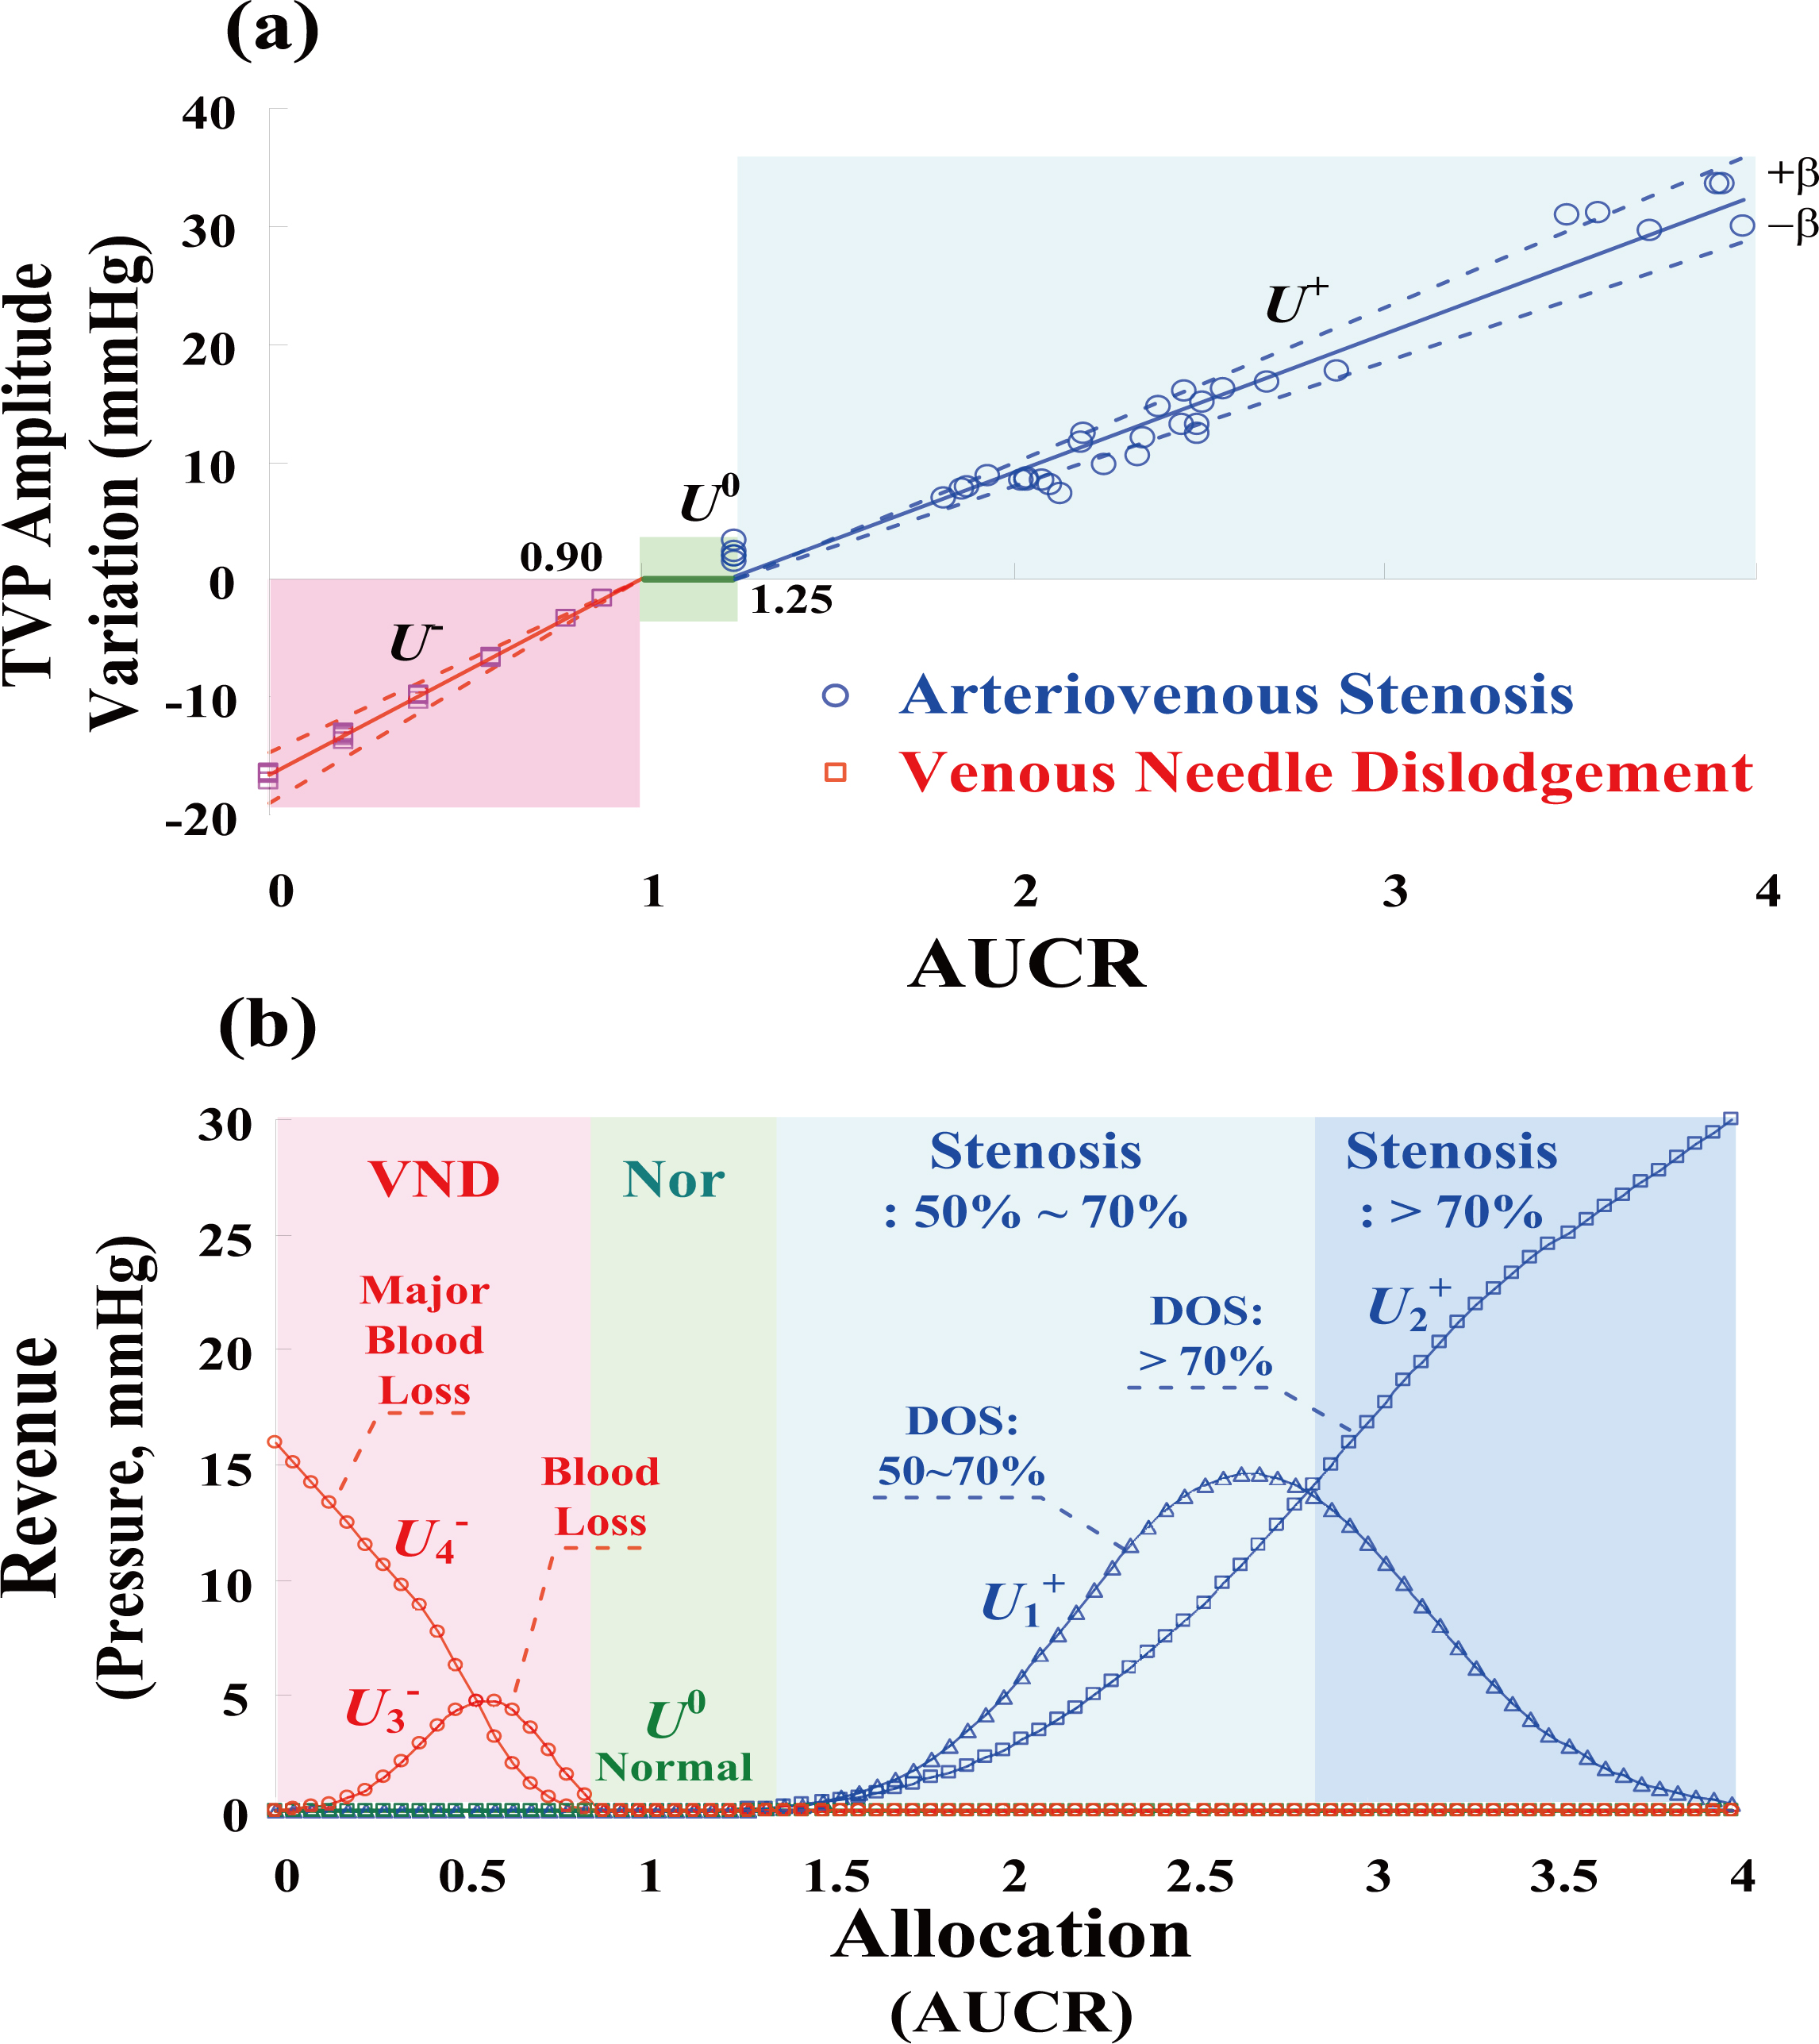
As seen in Fig. 3b, average TVP amplitude variations gradually increased with blood flow reduction and blood loss. The critical threshold of blood flow reduction was
where
where
The boundaries of TVP variations for screening stenosis, DOS%
where Mean
where Mean
Figure 4b shows the revenue profiles obtained by for screening vascular stenosis and VND. Therefore, the revenue profiles are relevant combinations of IG distributions and CFs for separating the normal from the arteriovenous stenosis and VND and can be represented as
For decision-making applications, revenue profiles with specific allocations are used to present each decision as a function. Then, the “maximum (max)–maximum (max)” composite operations are used to generate logic inferences as follows:
where Index,
Index,
The overall procedure of life-threatening complication detection is shown in Fig. 5.
The flowchart of life-threatening complication detection.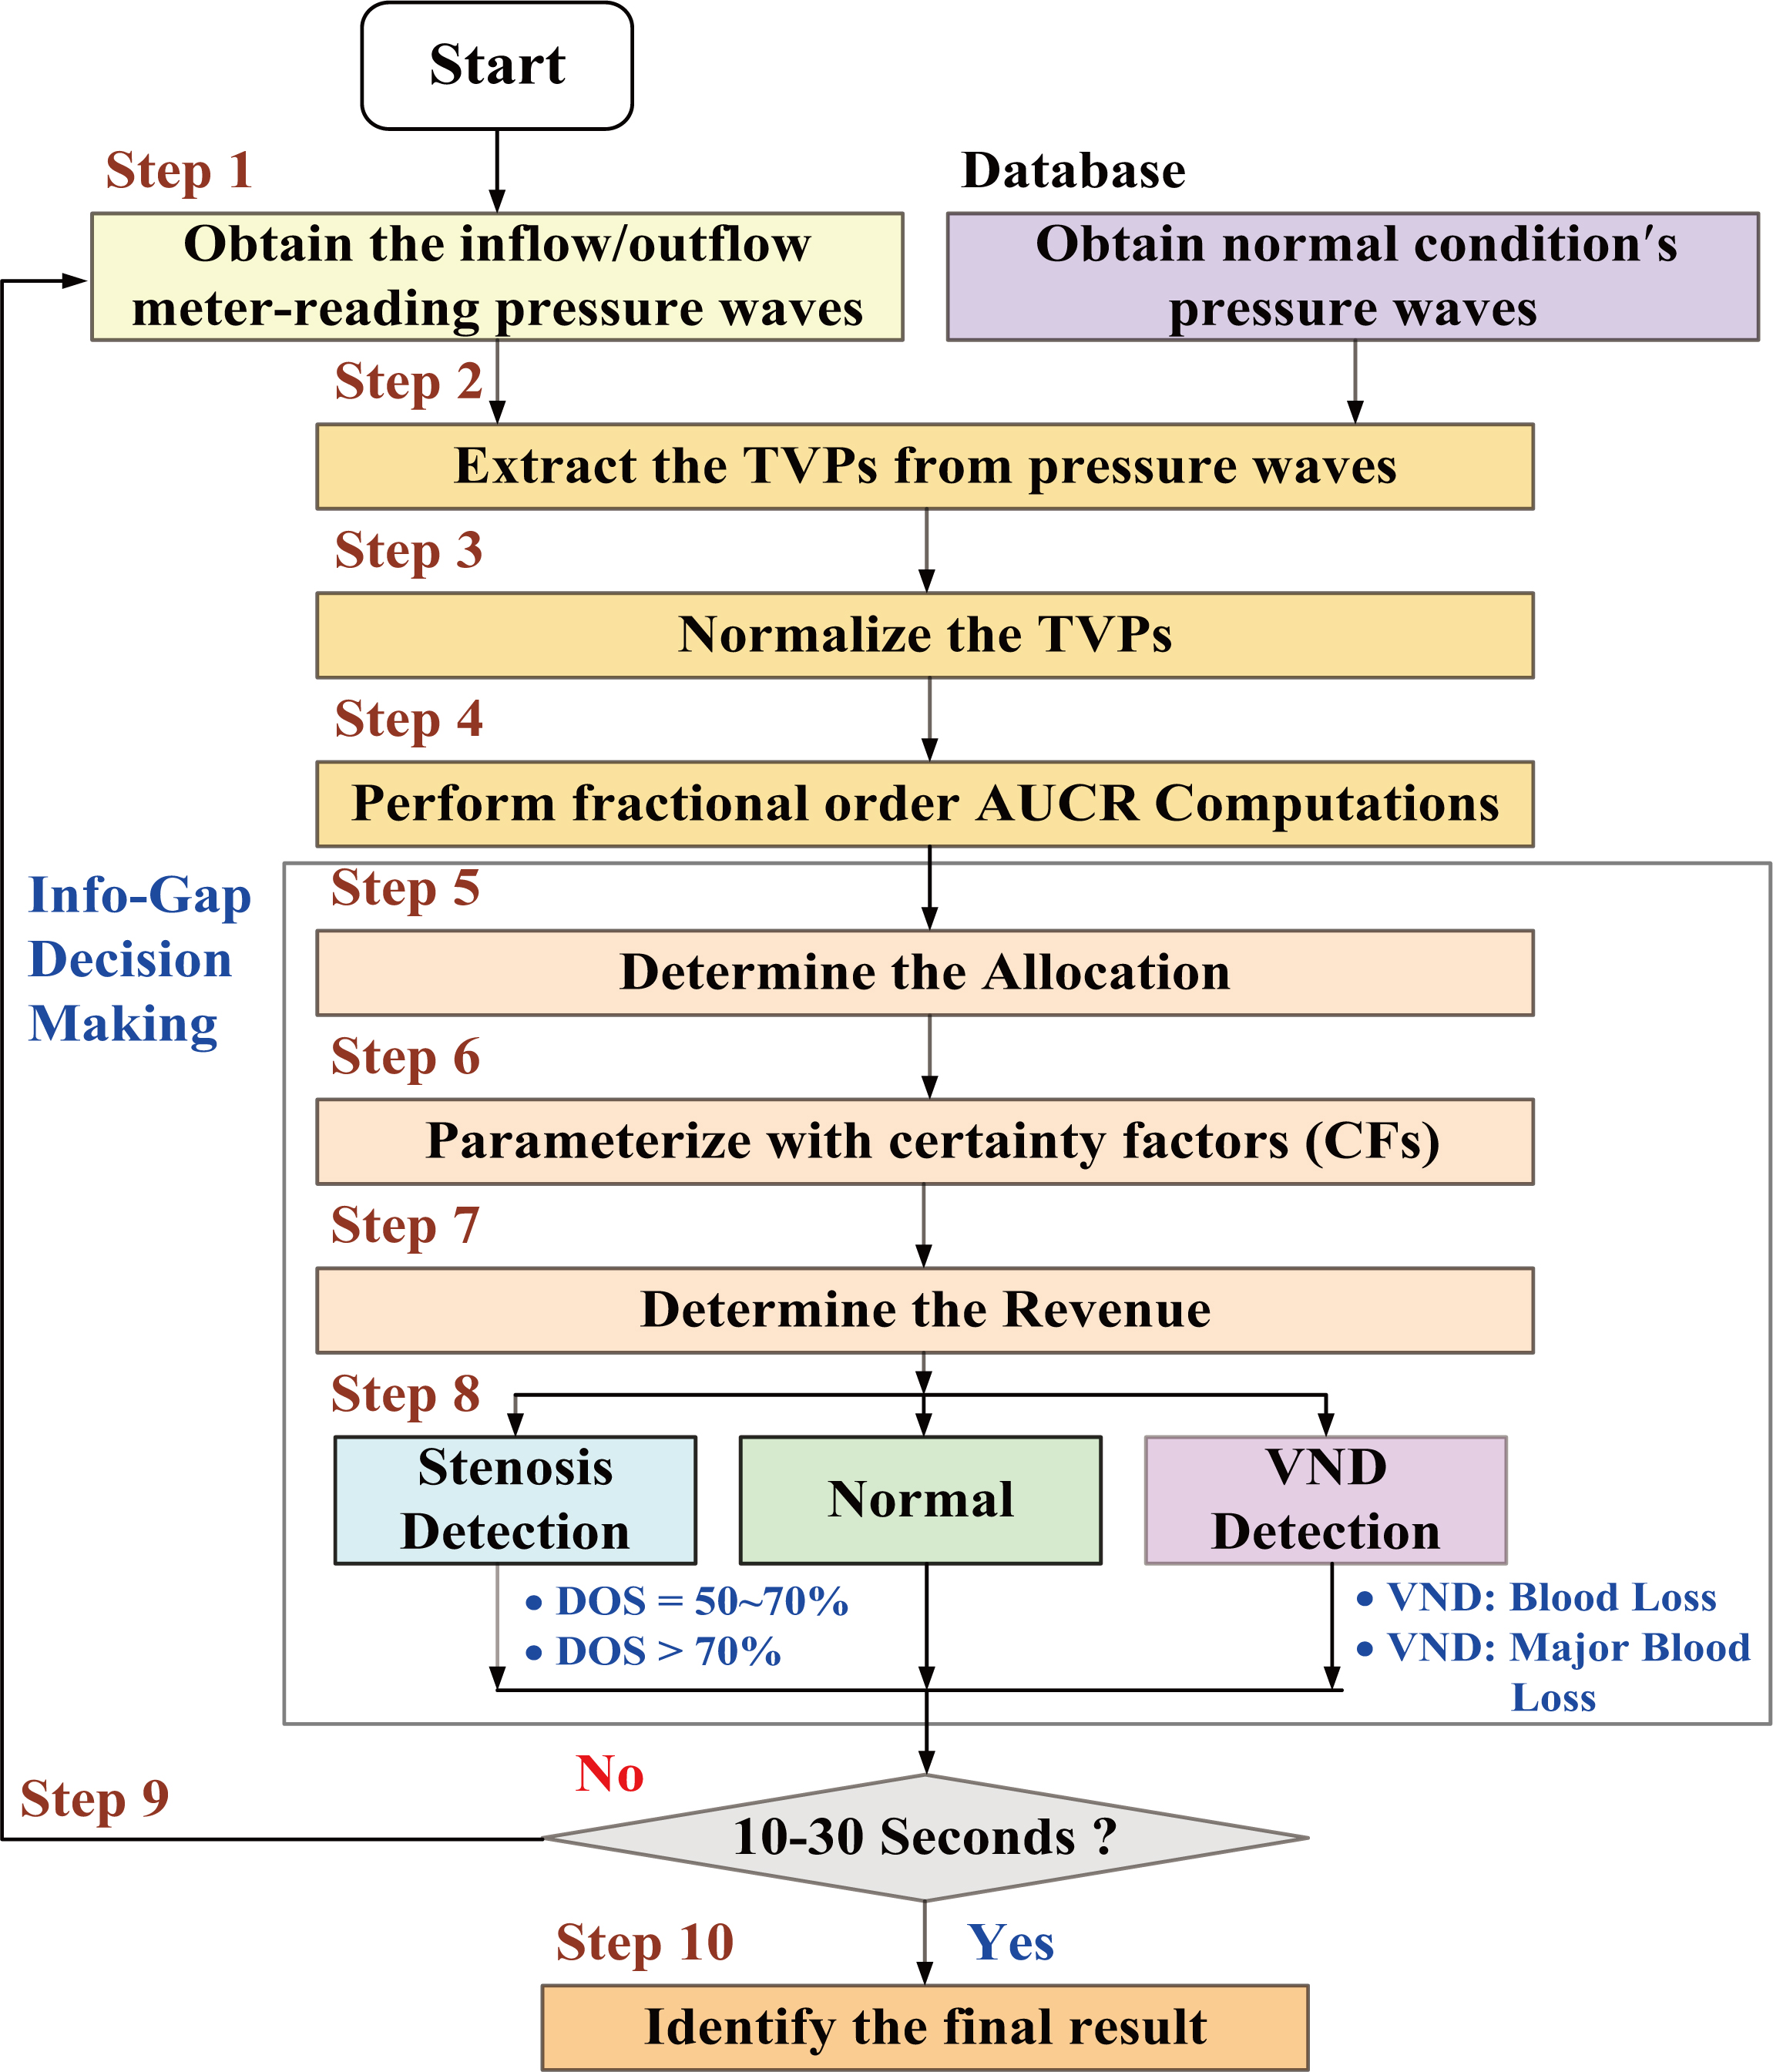
Fractional-order integrations with the fractional orders, 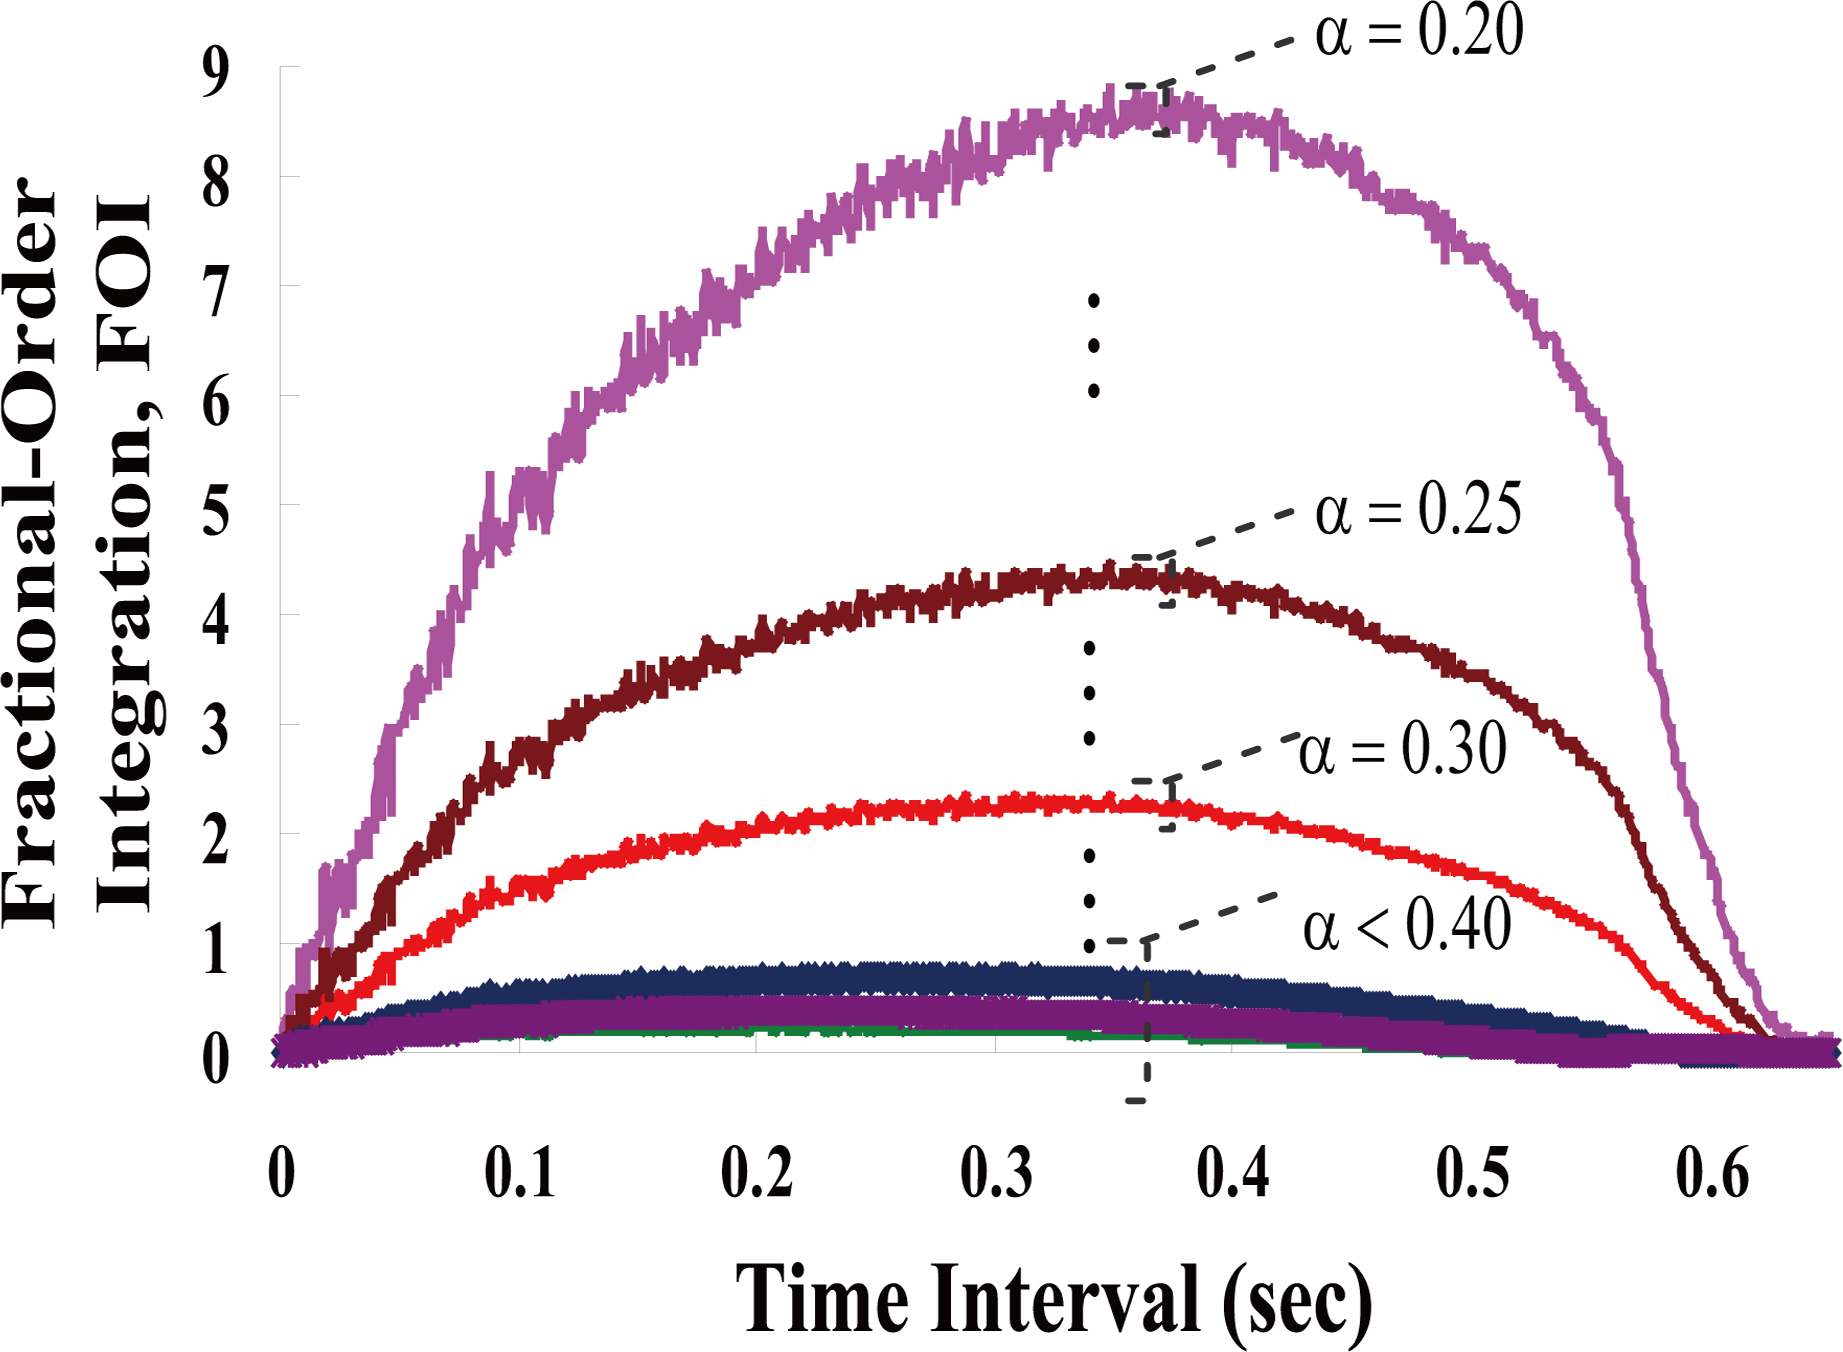
Experimental results for vascular access stenosis, DOS%
The experimental system used herein mimics the human cardio-vascular system and extracorporeal blood circuit in the laboratory, as shown in Fig. 2. The inflow and outflow pressures were measured using two 22G-venous needles and two pressure sensors (NOSHOK, Inc.) at the inflow site and outflow site (about 12 cm, two sides of AVG access), respectively. Flow rates of 600–1000 ml/min were used to drive the BMF through the blood circuits and an AVG access by a roller pump (40–80 rpm). BPWs with a sampling rate of 1.0 kHz were obtained from the analog-to-digital(A-D) converter with a compatible PC via a DAQ card. Then, the detrending process was employed to remove the roller pump pressures, and mean vascular access pressures and normalized TVPs (average
To identify TVP changes in amplitudes and shapes, fractional-order AUCs were calculated using Eqs (3.1) and (12) with the fractional orders
Case study 1#: Vascular access stenosis
Numerical experiments with DOS
Compute the AUCR, and the allocations can be determined in each detection cycle using Eq. (3.1), as shown in Fig. 7c, Estimate the TVP amplitude variations using the Eqs (3.2) and (16), as [U Compute the certainty factors (CFs) using Eqs (3.2) to (20), CF Compute the average revenue values of IG distributions as [U Find the maximum revenue value using Eq. (3.2),
For at least 15 detection cycles, the experimental results of Case Study 1# confirmed the presence of vascular access stenosis. In addition, 21 measurements were made at each inflow site at locations
Experimental results for VND event. (a) Outflow BPWs in the time domain; (b) Normalized TVPs between the normal and VND event; (c) AUCR profile within 15 detection cycles; (d) Revenue profiles within 15 detection cycles.
Consider a blood loss rate of
Compute the AUCR, and the average allocations can be determined for normal and VND events, as shown in Fig. 8c, Estimate the TVP amplitude variations, as Compute the CFs, CF Compute the average revenue values of IG distributions as [U Find the maximum revenue,
Twenty-one measurements were recorded at each outflow site at locations
Experimental results for stenosis and VND detections using the proposed screening model
Note: (1)
Compare the detection tasks with the proposed method and existing techniques
HD is one of the treatment choices for ESRD patients and has become routine therapy in Taiwan. Vascular access stenosis occurs more frequently complications and has higher patency and thrombosis rates [10, 18] in patients with AVGs. VND occurs less frequently, but it is a severe complication in chronic HD (
Acoustic methods [9, 10, 11, 12] such as the Doppler sonography, ultrasound imaging, and ultrasound flowmeter, and auscultation method [14, 15], were reliable ways of detecting the presence of stenosis inside vascular accesses in clinical examinations. Ultrasound imaging examinations with B-mode operation have also been applied to visualize the structure of vascular structures, and aneurismal and thrombotic tissues. A-mode operation provides acoustic signals for monitoring various blood flow velocities such as peak-systolic velocity, peak-diastolic velocity, and mean velocity. These techniques can serve as a reference for therapeutic decisions before surgical treatments and are used for assessing access creation before HD cares and for locating stenotic sites. However, they have limitations, including being unsuitable for usage during HD and for early warning of blood leak and acute care, as seen in Table 3. Auscultation techniques with phonoangiography and frequency analysis [14, 15, 31] have been used to estimate frequency domain features. Artificial intelligent methods are designed as a decision-making manner for stenosis evaluation. However, phonography techniques are affected by the measurement site, size of the sampling window, and time-frequency parametric model choices. Photoplethysmography (PPG) is an optical measurement technique that can be used to non-invasively detect blood volume changes [24]. PPG signals carry information about the cardiovascular risk factors, atherosclerosis, arterial stiffness, and peripheral vascular diseases. This technique allows continuous measurement and temporal analysis using the intelligent decision-making methods during HD treatment. However, auscultation and PPG techniques can not detect the blood leakage and blood loss.
For puncture venous needles and pressure sensors at the inflow site and outflow sites, both inflow and outflow pressures can be recorded continuously to a Tablet PC or a monitor device. Using the measurement data, the proposed detection model separated the normal cases from vascular access stenosis with DOS%
Conclusion
In Taiwan, there are more than 77,000 patients with ESRD and chronic kidney failure, and life-threatening complications during HD treatment have attracted the attention of dialysis organizations and medical staff. In this study, we proposed an assistant tool based on discretization FOI and IG decision-making that can screen for frequent or severe complications. The FOI formulation can be designed by power series expansion and Gamma function, and it can be applied to real-time signal processing. It was employed to identify the categories using the AUCR index during allocation: AUCR
Footnotes
Acknowledgments
This work was supported by the research grant of National Cheng Kung University, under contract number: NCKUH-103-05001, duration: January 1, 2014