
Abstract
Study of fluctuation in genetic algorithm has been a sub-objective in genetic algorithm implementations. The reliability of genetic algorithm may vary based on implementation case, hence it is necessary to investigate its performance pattern for each implementation case. The purpose of this study is to observe the reliability of genetic algorithm in our previously simulated network optimization in a data centre. Our findings agree with the nature of genetic algorithm and other previous researchers, where it is found that the fluctuation of fitness values in our case happened randomly in general, but it had higher probability with small population sizes. However, regardless of fluctuations that in average occurred during early stage of population generation, the optimal solutions with near-maximum fitness values were able to be generated. This fact has proven the robustness of genetic algorithm itself. Alongside the fluctuation studies, this paper also presents the results of standard deviation and 95% confidence interval calculations towards the true mean of best solutions’ fitness values. The computed standard deviations reflect the consistency of the adjusted GA properties in finding the best optimal solutions when run repeatedly. Afterward, it is also concluded from the confidence intervals analysis that 95% of the time, the fitness values of the discovered solutions, which represent multiple network cards’ optimal configurations will be between near-maximum fitness value of 100 Mbps. Thus, our methodology to improve data centre’s network, through simultaneous multiple network cards optimization can be expected to be highly achieving.
Introduction
In this paper, we present the genetic algorithm (GA) fluctuation analysis of our previous work [23] in network optimization of a data centre in a simulated environment. Fluctuation in this context means the tendency of the individuals to move away from the near optimal solution, which is indicated by the degradation of fitness value. Paper [3] infers this incorrect convergence as ‘drift’. However, different researchers have different perspectives of drift. For example, authors in [2] view genetic drift as a convergence to single solution regardless of its direction of fitness quality (higher or lower). Furthermore, paper [12] concludes that GA convergence initially happens through selection, then later through genetic drift. This emphasizes that genetic drift can be beneficial. The above mentioned perceptions could bring a notion that GA fluctuation and genetic drift are actually the same thing, but in this case we clearly use ‘fluctuation’ term because of its single meaning, compared to the ambiguous ‘drift’.
The importance of GA fluctuation study is to observe the behavior of GA in specific function. This is justified by [5] who observed genetic drift to forecast its own occurrence. The forecasting study of genetic drift, which in our case is called fluctuation was also done by [26], who proposed the finding of number of generations before genetic drift occurred in their water resources optimization.
Besides fluctuations, the 95% confidence intervals are also investigated to verify our confidence that the best solutions will be in the acceptable values. As part of the process to generate confidence intervals, means of best solutions and the standard deviations will be included as well.
The next section will inform the simulated data centre’s network optimization case that we use as a subject in this GA fluctuation study.
The implemented optimization case
The optimization subject that is observed in this paper is taken from [23] (the authors’ previous work). It is a GA based network optimization on a data centre network, which consists of 47 servers, with every of them receiving different transmission characteristics with different combination of transmission size and packet size. The fitness value is each server’s network card’s processing speed (throughput) towards their particular received transmission. The maximum network card speed is 100 Mbps, which is also the maximum fitness value.
In order for the network card to achieve near-maximum receiving speed, it must be set optimally according to the transmission characteristics that it receives, which include the transmission size and the packet size. The network card setting consists of 3 options, which are active wait, passive wait, and watermark mode as detailed in our paper [25] about the proposed mathematical models to represent the throughput generation of these 3 modes. The active wait triggers kernel interrupt to call the CPU to sequentially process every single packet that arrives. Furthermore, the passive wait utilizes polling based on timer option ranging from 10 ms up to 200 ms, with increment option every 10 ms. Meanwhile, the watermark mode uses polling based on amount of packets captured (in Bytes unit), with its value ranging from 1 Byte up to 2048 Bytes. The increment option for watermark value is every 1 Byte unit.
The above mentioned 3 options of network card mode create a combinatorial problem that we chose to solve in [23] using GA. It is considered combinatorial problem because every distinct transmission has its unique optimal setting that will generate near-maximum throughput. The optimal setting itself will be taken from one of the 3 network card modes, which specially for passive wait and watermark mode have their own optimization of value with the ranges that have been previously mentioned. Another example of combinatorial problem in a different case is by [1], who sought for the best public transportation mode for a traveler, subjective to network functioning conditions.
There were 47 simulated network cards in [23] that represented 47 nodes/servers, which had gone through simultaneous multiple network cards optimization, according to their characteristics of received transmissions. Each of these network cards were optimized using GA.
The 36 implemented GA trials for every single network card consisted of 36 different settings. Every trial had different combination of population size and number of generations. The population sizes varied from 50 until 100 with 10 unit increment. And every single population size had varieties of number of generations starting from 50 up to 100 with also 10 unit increment. Additionally, all GA trials applied same mutation pro- bability of 0.2, crossover probability of 0.9, tournament selection method, and single point crossover technique. These chosen GA properties are inspired by the previous GA tunings by [3, 4, 5, 6, 7, 8, 9, 10, 13, 16], [21, 22, 26], and [29]. Six GA trials in [5] experimented with population size ranging from 30 to 60, mutation probability from 0.2 up to 0.4, crossover probability from 0.50–0.75, and both single and multi-point crossover. Afterwards, it was concluded by [5] that high mutation rate and high population affected negatively on GA convergence, which means they will cause high fluctuations. Additionally, authors in [5] also discovered the similar convergence pattern between single-point and multi-point crossover, which implies they would give similar fluctuation behaviours. Different GA selection methods were compared by [6], which resulted in tournament selection as the most efficient and robust. Paper [13] discovered that mutation is suitable small population size, while big population sizes are more optimized with high crossover rate. The author of [16] conducted GA trials with 5 different functions and found population size between 50 and 100 (inclusive) to be optimal. The authors in [22] noticed in the case of non-interacting decision variables that better solutions would be found if the generation size is increased, a fact that was also stated by [13]. On the other side, for interacting decision variables, paper [22] suggests to use lower population size for large problems and the otherwise for the small problems. Subsequently, paper [22] also concludes that for simulation based GA fitness function, it is better to apply small population size. Further findings about optimal population size were disclosed by paper [26], which states that when there are 1–3 genes affecting the solution, it is suitable to use 100 of population size instead of 50 or 200. Another finding by [26] is when mutation probability near to 0, GA will become unstable, hence it must be increased by a factor of 2 or 3. In the matter of selection probability, authors in [28] mention that it is best to be set above 0.5. They also boldly reinstate the importance of recording the average fitness value of the population for the GA performance analysis, which is exactly a part of our methodology in this paper to calculate the GA fluctuation points.
Fluctuations in P 
Fluctuations in P 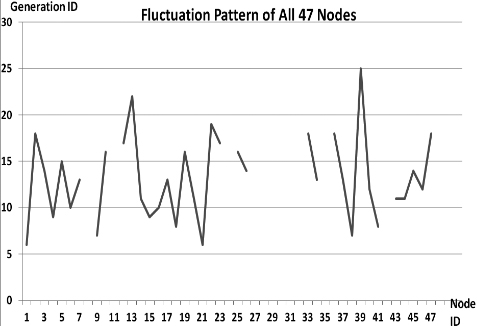
Fluctuations in P 
Fluctuations in P 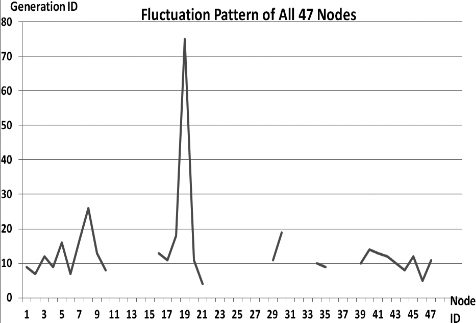
Fluctuations in P 
Fluctuations in P 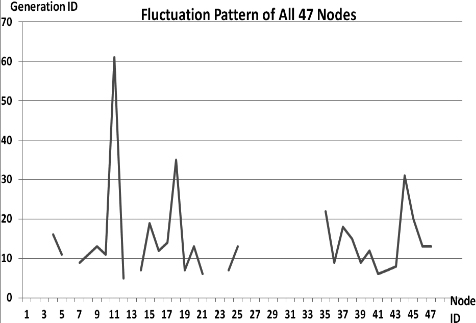
Fluctuations in P 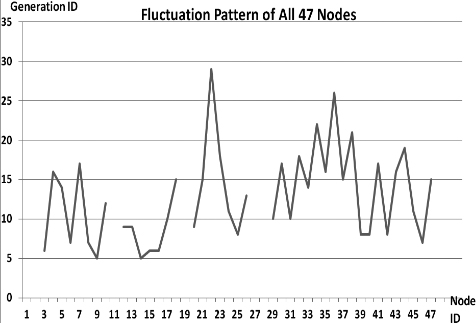
Fluctuations in P 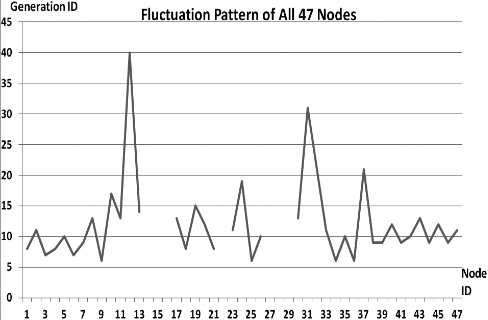
Fluctuations in P 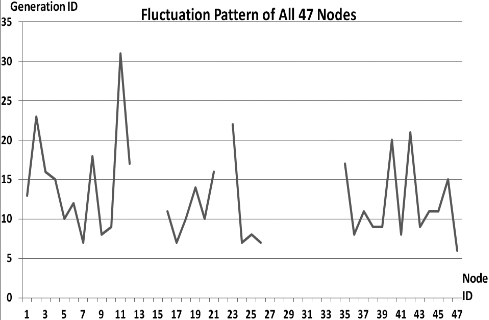
Fluctuations in P 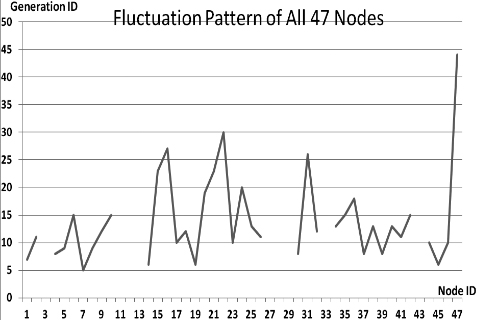
Fluctuations in P 
Fluctuations in P 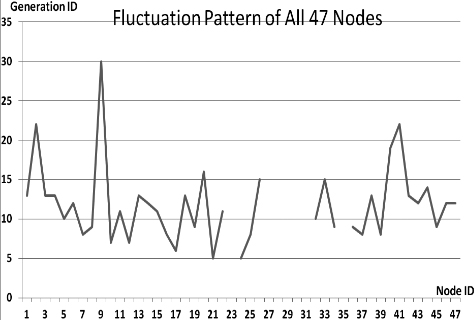
Fluctuations in P 
Fluctuations in P 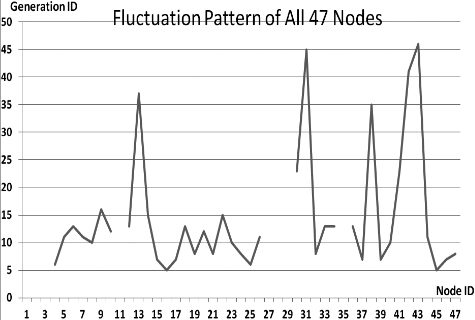
Fluctuations in P 
Fluctuations in P 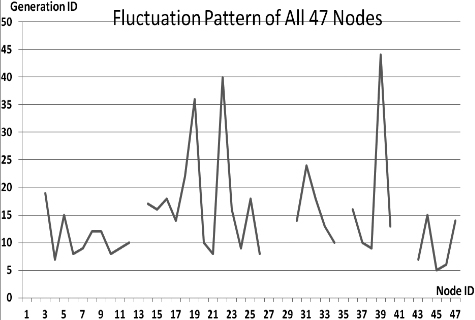
Fluctuations in P 
Fluctuations in P 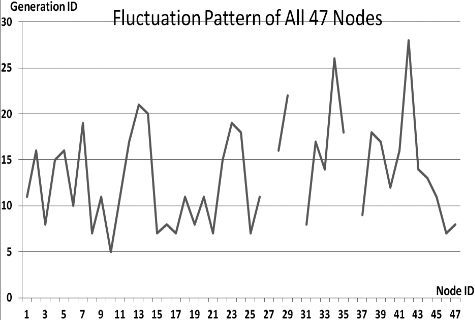
Fluctuations in P 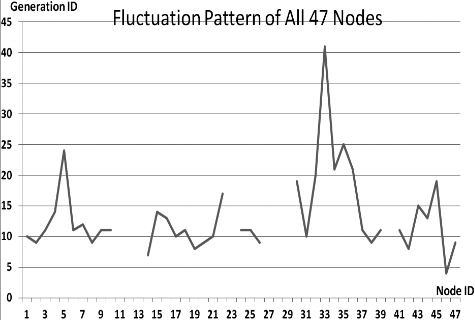
Fluctuations in P 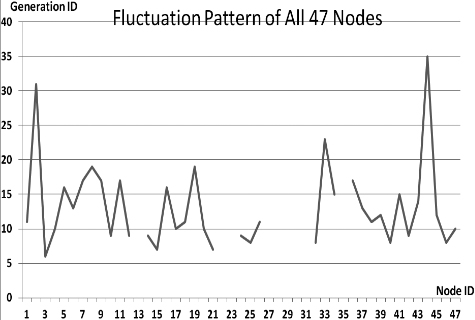
Fluctuations in P 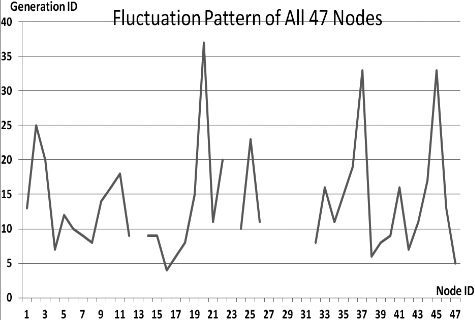
Fluctuations in P 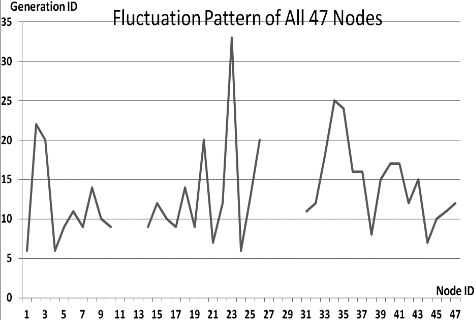
Fluctuations in P 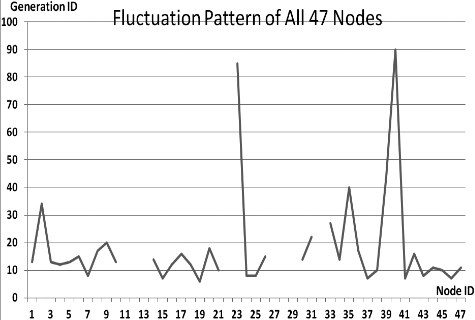
Fluctuations in P 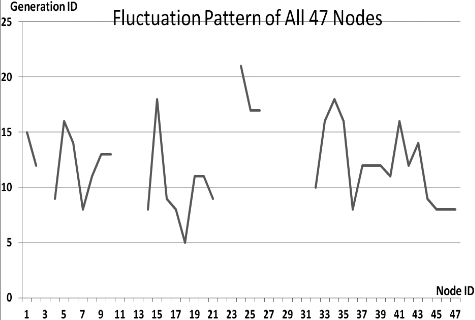
Fluctuations in P 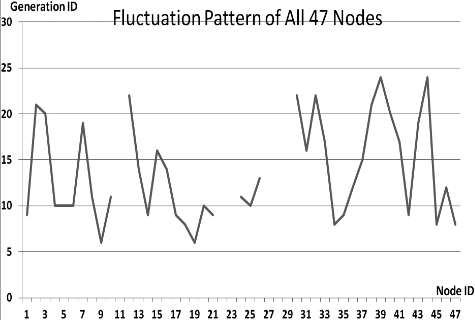
Fluctuations in P 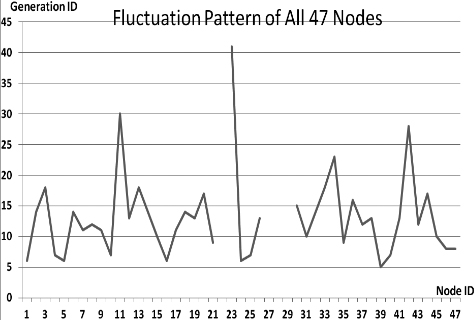
Fluctuations in P 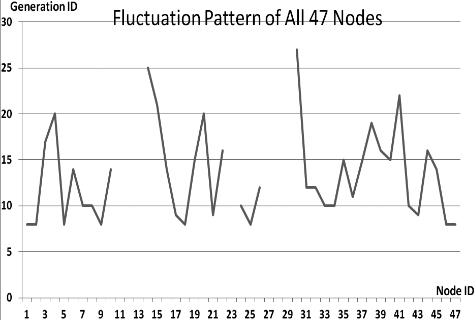
Fluctuations in P 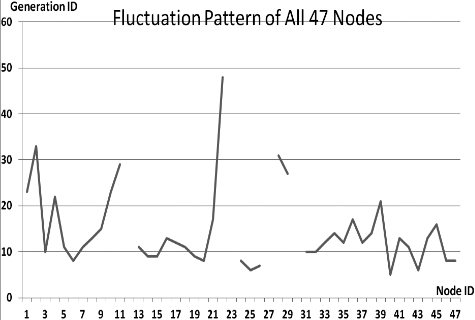
Fluctuations in P 
Fluctuations in P 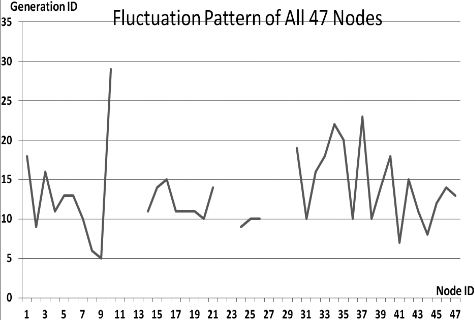
Fluctuations in P 
Fluctuations in P 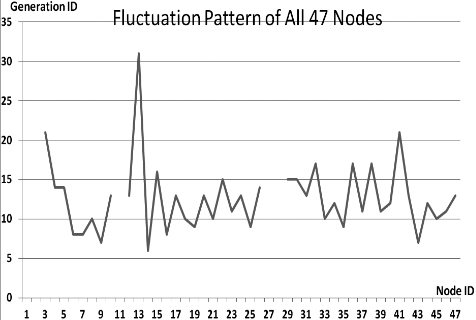
Fluctuations in P 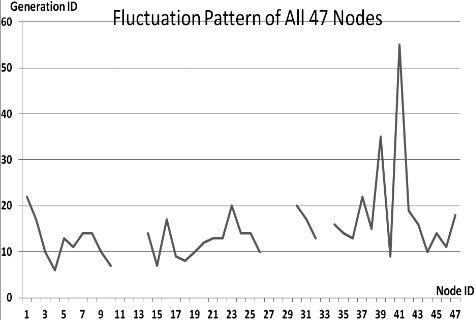
Fluctuations in P 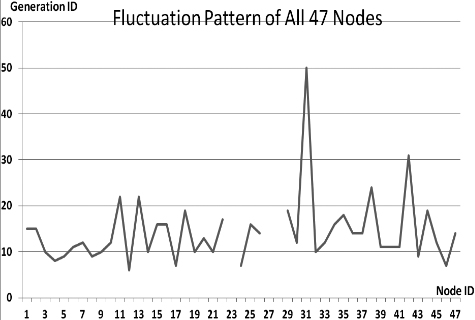
Fluctuations in P 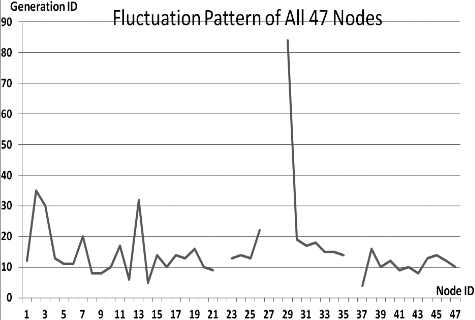
Fluctuations in P 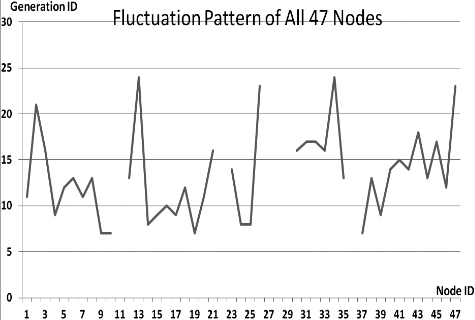
The GA fluctuation studies in this paper would consider and record the fluctuation condition had occurred when the number of individuals that achieved fitness value of 90 Mbps and above was less than 90% of the population size. The fluctuations in each of the 36 GA trials will be analyzed, while the 95% confidence interval analysis will be done only for the one GA trial with the best convergence analysis result, which is the one with the highest average fitness value of all produced solutions (all members of population). The GA trial that fulfills this condition as observed in our previous paper [23] is the 6
GA fluctuations analysis summary
Standard deviations and 95% confidence level intervals analysis in optimal network card configurations for 47 nodes
This section presents the fluctuation analysis of all the 36 GA trials for each of 47 network cards. The analysis consists of the lowest, highest, and the average fluctuation point. The ‘P’ symbol in the figure names (Figs 1–36) represents population size, while the ‘G’ symbol represents generation size.
As we observe in Fig. 1 until Fig. 36, fluctuation did not always occur, which is identified by empty lines. However, in most cases it happened randomly without specific pattern. This could be due to mutation. These random fluctuations were also discovered by [28] in their convergence study. In our case, despite the frequent fluctuations, GA could generate best individuals for every node in all trials with near optimal fitness values starting from 99.9992 Mbps up to 100 Mbps as presented in [23].
Further analysis from Table 1 shows that the earliest fluctuations occurred at GA trials with small population, in this case 50, where 4 out of 6 cases have fluctuation points at 4th generation. This finding conforms to the nature of genetic algorithm itself, where small population tends to have less diversity that leads to smaller possibility of reaching near optimal solution.
Moreover, Table 1 also infers that there is no specific pattern of the high or late fluctuation points from all GA trials. Additionally, the average fluctuation points range from 12th up to 18th generation. It concludes that in general, fluctuation took place at the early stage of the genetic algorithm process.
Importantly in implementation wise, the implemented sequential procedure in the GA trials in this paper to try different combination of population and generation size could be replicated by other researchers, who work on other combinatorial optimization cases using GA. One of the most challenging parts of GA implementation is to determine the values of GA properties (population size, generation size, crossover probability, and mutation probability). In this paper, the presented varieties of statistical performances of GA, when different combinations of population and generation size were attempted in sequential manner, show that such sequential GA trials are significant enough to give meaningful results. The GA sequential trials of this paper complement the previous GA population and generation combination trials by [5, 16, 22], and [26]. The complementary part rests on the 10 unit increment applied to the range of population and generation size. Authors in [5] tried 6 different GA trials with population size ranging from 30 to 60. GA trials by [16] found optimal range of population size between 50 and 100. Paper [22] tried different population sizes in their GA tunings with irregular increments consisting of 6, 10, 25, 50, 75, 100, 150, 200, 400, and 800 population size. A vast GA trials were done by [26], which attempted different population sizes ranging from 46 up to 745. However such wide range could utilize too much time to deploy as a regular practice.
Discussion on experiment results, standard deviations, and 95% confidence intervals analysis
The confidence interval of each node was calculated according to the standard procedure [30], which orderly consists of calculating the mean of best fitness values out of the 7 experiments, calculating the standard deviation, choosing confidence level of 95%, calculating margin of error, and compose the confidence interval at last.
Standard deviation calculation is part of the procedures to compute the confidence interval. Confidence interval measures the range of values of the fitness values of best individuals or solutions, which we can be optimist about, while the standard deviation detects how concentrated the generated best solutions are around the mean of best fitness values generated from the 7 rounds of experiment. The nearer the standard deviation to the mean of best fitness values, the more concentrated and consistent the generated best solutions are, and vice versa.
Table 2 presents the computed standard deviations of all the best solutions for the 47 nodes. It displays the computed standard deviations are within the inclusive values of 0 Mbps (no deviation) and 0.000427618 Mbps as the maximum standard deviation. The nodes along with their transmission sizes with the minimum standard deviation of 0 consist of 10 nodes, which are Node 11 (62 GB), 12 (80 GB), 14 (62 GB), 17 (65 GB), 18 (16 GB), 25 (400 GB), 26 (368.64 GB), 28 (2 GB), 29 (3 GB), and 36 (2.5 GB). On the otherwise, the highest standard deviation of 0.000427618 Mbps belongs to 14 nodes, which include Node 2 (6.9 GB), 20 (7.9 GB), 23 (7.4 GB), 27 (1 GB), 31 (5 GB), 33 (7 GB), 35 (1.5 GB), 37 (3.5 GB), 39 (5.5 GB), 41 (7.6 GB), 43 (10 GB), 44 (10.5 GB), 45 (11 GB), and 47 (12 GB). From the previously mentioned data, it can be inferred that there is no relation between level of transmission size and standard deviation, because there are varieties of small, medium, and big transmissions in both groups. At the end of standard deviation analysis, it is found in all 47 nodes that the standard deviations are exactly or near to 0 Mbps. These high concentrations of best fitness values towards the mean indicates that the solution findings are repeatedly consistent.
More analysis from Table 2 is about the best fitness value intervals of 95% confidence level from our solution findings of the 47 nodes. The maximum fitness value is 100 that represents the simulated 100 Mbps network card speed [23]. The calculation of best fitness value intervals are based on the 7 chosen best fitness values from 7 repetitions of experiment, which we mention in Section 2. Table 2 itself contains the means, the calculated standard deviations, and the 95% confidence level intervals of best fitness values for all 47 nodes.
According to Table 2, we are 95% confident that the average fitness values of the discovered network card configurations of all the 47 nodes, will be between high enough values near to 100 Mbps, as exhibited in the table. Or in other definition, 95% of the time, the true mean of fitness values for the optimal network card configurations of 47 nodes, will be between values high enough to approach 100 Mbps of maximum fitness value. Thus, it is concluded that our methodology to optimize multiple network cards in a data centre is convincing enough to be implemented.
Conclusions and future work
The findings of the behavior of GA in this paper have delivered the similarities between its implementation and inspiring nature, where small population is related to lesser diversity, which can be improved by increasing the number of generation. By developing the varieties of population, it is expected that the best solutions have higher chance to be discovered.
Furthermore, the above mentioned similar traits of theory and implementation could motivate researchers to seek more into nature and observe the potential reflection of it in the form of novel evolutionary algorithms, in order to solve optimization problems. Some examples for nature inspired system are shown in [15], where Darwin’s theory of natural selection is applied in a multi-agent ecosystem in evolving networks. Authors in [14] were inspired by neurobiology to learn vessel behaviours in maritime area and also to learn vehicle and dismount behaviours in land based environment. Behaviours of artificial mind are simulated by [19] to generate social actions, in their objective to build artificial cognitive agents capable to include different mental states of human in reasoning process. Paper [17] improves human reasoning model based on the combination of causal and probabilistic method, by integrating 2 logic programming models, which are ACORDA and P-log. As an addition to previous examples is the hybrid development of learning algorithm by [18], who combined Q-Learning and Evolutionary Algorithm altogether. The adjustment of GA and its performance can also be compared with the performances of other search methods as accomplished by [20], who compared GA with Hill-Climbing, Beam-Search, Random-Bit-Climber, and Las Vegas search method, in order to identify a suitable feature subset for Machine Learning (ML) algorithm.
Moreover regarding GA’s behaviours in this paper, it can be concluded that the GA’s capability to find near-optimal solutions, in spite of random fluctuations displays its robustness and reliability in our case. This fact is expected to encourage other researchers to consider GA as their combinatorial optimization tool.
In mathematical perspective, statistical analysisthrough fitness values averaging, standard deviation calculations, and confidence interval assessments are implied in this paper so that they can be useful to recognize the evolution pattern of GA, in order to observe the direction of solutions convergence. This will provide guidance for other evolutionary algorithm implementations for how to measure the degree of success when guided random probabilities of generating solutions are executed.
Subsequently, the low values of the computed standard deviations in this paper signify the consistency of fitness values of the generated best solutions from the multiple repeated experiments. They suggest that the applied GA properties in [23] with 50 population size, 100 generation size, single point crossover, tournament selection method, mutation probability of 0.2, and crossover probability of 0.9 would give consistent optimal solutions if run multiple times. These findings support the statistical method of [4] in analyzing the GA performance. Hence, future users of GA may have a credible basis to adjust and evaluate GA performance in their respective case.
Finally, the confidence interval calculations for all the cases of 47 different transmissions conclude that 95% of the time, the true mean of best fitness values of the optimal network card configurations, will be between near-maximum fitness value of 100. It refers that we can expect desirable results from our simultaneous multiple network card optimizations methodology.
The related future work will be to study the fluctuation of GA in our another paper, which is about simulated packet clustering optimization in a data centre [24]. The study will compare the behavior of GA when an additional gene is added.
Footnotes
Acknowledgments
This paper is the extended version of the paper that has been presented at COMPSE 2016 Golden Sands Resort, on 11–12 November 2016.