
Abstract
Bubble detection is a challenging problem in automatic process control in the power and energy industry, medical and pharmaceutical industry and many other fields. Computer vision methods applications for bubble detection and measurement is the principal step of robust bubbles monitoring systems development. In various applications the input image may include a diverse and image background, especially in different environments. This paper presents a new and effective bubble detection approach. The main steps of this proposed approach are as follows: image preprocessing, background subtraction, and contour detection. The graph cut algorithm is used for image segmentation. The Haar wavelet transform is applied to collect bubble component points. The developed approach is evaluated based on the real data set.
Background
Bubble detection is important and not an easy task. It depends largely on various surrounding factors, such as light conditions, environment, and image registration equipment. Bubbles always exist in a variety of states: alone, overlapping, obscured in liquid. The effectiveness of a bubble detection procedure improvement using image analysis methods and algorithms has been actively studied and developed by many authors. Various algorithms have been successfully fulfilled and implemented. Bubble detection is applied in many critical technological and energy processes that involve, for example, oil, chemicals, and nuclear reactors. The purpose of this study is to explore the advantages of image analysis algorithms in attacking the problem of bubble detection. Specifically, many methods for image filtering, image segmentation, adaptive thresholds, and morphological algorithms exist. Such advanced image processing methods can be combined, verified, and employed for bubbles detection and monitoring.
Bubble image analysis includes two main processes: object detection and object attributes measurement. Image segmentation is the principal part of the first process to detect bubbles (or group of bubbles) location and identifies their shape (single, overlapping, partially obliterated). The second process focuses on the measurement of bubbles’ attributes such as eccentricuty, radius, area and other.
Let us briefly outline the state of the art methods proposed in this research field. The bubbles identification method based on convolutional neural networks [1] was proposed in [2]. Neural networks, as outlined in [15], are able to determine overlapping, blurred, and non-spherical bubbles. Realistic bubble images are simulated from experimental data for the creation of synthetic images for the training of the neural network. They increased the accuracy of the bubble image recognition, reduced the number of outliers, and the running time was reduced. Authors of [3] formulated the bubbles detection problem as the detection of concentric circular arrangements. The hypothesis generation is based on sampling from connected components of the non-maximum suppressed responses of oriented ridge filters and parameter estimation of concentric circular arrangements. The proposed method for bubble detection showed satisfactory performance in an industrial application requiring the estimation of gas volume in the pulp suspension, achieving the mean relative error.
The local gradients based features were designed in [4] to safely detect the boundary of the oil drops. It was designed to enable the automated recognition of oil drops from other circular objects found in images. This feature was used within a supervised recognition framework based on the Bayesian classifier. The Hough transform for circles was used as a pre-selector of objects with circular shapes. The bubbles measurement system was designed in [5] based on the template-based detection method to detect and measure bubbles. This approach was proposed due to the poor performance of conventional methods for detecting bubbles and particles in dense dispersions. It employes the templates to increase the robustness and an image scale-scape to detect bubbles regardless of their size.
In [6] authors provided a method for the gas/liquid two-phase flow high-speed video segmentation based on Canny operator [7] and conventional Gaussian filter for noise elimination. The effectiveness of the method is demonstrated on the real video sequences. The semi-automatic methodology for the online assessment of diameters of oil drops and air bubbles is proposed in [8]. Images were pre-processed to find segments of edges belonging to the regions of interest. The Hough transform algorithm was used to reconstruct the contours of air bubbles and oil drops. The method enjoyes the low computational complexity.
The problem of images acquisition and segmentation, including heterogeneous transparency of moving objects of interest, background, blurring, overlapping and artifacts based on the Hough transform method was also discussed in [9], it was implemented and tested. The evaluation analysis of size distributions of air bubbles and oil drops in a mechanically stirred bioreactor was performed in a more efficient and less time-consuming way than others semiautomatic or manual methods as stated in [9]. An overlapping bubbles detection method of water splitting is proposed in [10]. This method employs the following features. Firstly, the convex hull of the overlapping object is obtained. Secondly, the candidate concavities are founded on the contour of the object in each concave residuum after iterated searching and then departing point pairs of the overlapping bubbles are obtained by matching. Finally, an optimal splitting console can be gained by a minimum mean square error ellipse fitting with constraints of concavities, it ensures the accuracy of the overlapping area calculation. Image analysis techniques increasingly proved to be important in the development of various data analysis systems [22, 25].
Image noise is a principal factor which spoils the visual quality of images and can, therefore, lead to misdiagnosis. To address this issue authors of [23] first utilized an algorithm based on type-II fuzzy sets to enhance the contrast of the image. The ultrasound tomography system for heterogeneous phase detection in the pipeline was proposed in [24]. The statistical features such as standard deviation, energy, entropy, mean, skewness, and kurtosis are extracted and classified using k-NN classifier to safely distinguish and differentiate the composition of the water and gas.
Advances in medical image analysis have provided a means to generate and extract valuable information. Automatic classification techniques provide tools developed in [25] to analyze this information and observe inherent disease-related patterns in the data.
This article is organized as follows. In the next section the bubble detection system is described. Namely, in Section 2.1 the image preprocessing is discussed. In Section 2.2 segmentation of ROIs and detection of bubbles is described and ROC analysis is given. Finally, Section 3 concludes the article with the final remarks and future work plans.
Gas bubble detection system
Our purpose is to develop an automatic features extraction and detection of bubbles in images. This system employs the image processing methods and computer vision algorithms. The proposed system has three main parts, there are image pre-processing, feature extraction, detecting process. Flowchart of the proposed system is described in Fig. 1.
Flowchart of gas bubble detection system.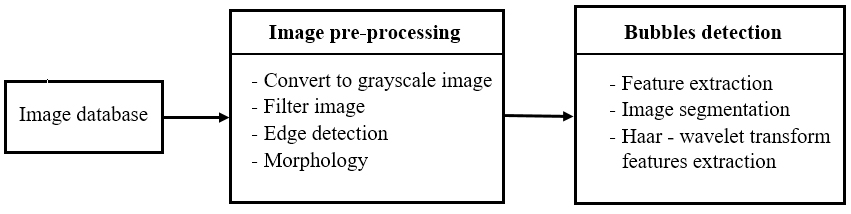
As it was outlined in Section 1, images acquisition is challenging problem in the two-phase environments. The resulting video sequence can be corrupted by various noises. Before segmentation process was performed, the images need to be pre-processed to remove noise to make the result of this process as accurate as possible. Factors such as light, environment, instrument resolution, bubbles and fluid movement etc. may cause inaccuracies during and after segmentation. One of the possible option here is to use the bilateral filtering. Since bilateral filtering applies in the range (intensity grid) and domain (spatial grid) of an image what a traditional filter does just in the image’s domain, it tends to be computationally more expensive than traditional smoothing filters [16].
The Wiener filtering executes an optimal tradeoff between inverse filtering and noise smoothing. It removes the additive noise and inverts the blurring simultaneously. The Wiener filtering is optimal in terms of the mean square error. In other words, it minimizes the overall mean square error in the process of inverse filtering and noise smoothing. Wiener filter is based on a stochastic framework. The orthogonality principle implies that the Wiener filter in the Fourier domain can be expressed as follows:
where
It is to be noted that the influence of various types of noises and distortions may significantly reduce the performance of the bubbles detection algorithms. In that case, the image preprocessing stage must include the distortion parameters estimation and appropriate filtering, see e.g. [17, 18, 19]. The next pre-processing step is a contrast adjustment by histogram equalization.
Bubbles often exist in overlapping, obscure forms, which results in incorrect contour object segmentation. These problems can be solved using the adaptive threshold method. The purpose of this is to improve image quality. The Canny method [11] was used to detect the contour of the object. The contour of the object becomes more smooth and continuous after application of the opening operator of the mathematical morphology method. Morphological filtering (MF) is widely used technique useful in images analysis. Previous porosity and cell detection studies [28] have relied heavily on basic MF operators such as erosion, dilation, opening, and closing to manipulate the geometrical properties of the image. Mathematical morphology can separate clumped objects, estimate the background, fill imperfectly stained regions (in the case of cells) and/or rectify intensity gradients. For this research, the higher magnification images were dilated with a disk structuring element. In addition, any objects containing zero intensity pixels surrounded by one intensity pixels (holes) were filled and any objects touching the image border were removed using 5-pixel connectivity to prevent including partial pores in the characterization statistics. So, the contour of the object is clearer and fuller when applied to the open operator of morphology method.
Segmentation of bubbles images
To apply this method for image segmentation problem, we consider the image as Markov random field and model the image using the graph theory. The novel graph cut [12] image segmentation method is used to segment the images [20, 21]. To apply this method to segment an image, we consider the image as Markov random field and constructed a graph from the image. Each pixel on the image corresponds to a point on the graph. Constructed graph
Our segmentation method creates a function have three different features to control the weighting of the points on the graph. Three following features were used: brightness, texture and shape. The brightness feature will act to segment the image according to the brightness of the pixels. It will find a segmentation that splits the light pixels from the dark pixels. Acting alone, this feature will produce results similar to the threshold technique used in the initial step. This helps to detect the parts of bubbles with the low signal to noise ratio. Once the energy Eq. (1) was constructed, the minimum cut of this function could be found very quickly using the min-cut/max-flow algorithm.
Here
Energy functions can be justified on Bayesian grounds using the well-known Markov Random Fields (MRF) [14]. The running time is nearly linear in practice.
As result of the input images segmentation, the regions of interest (ROIs) are derived. These ROIs are processed in the bubble detection process using the Haar Wavelet transform presented in next Section 2.3.
The main idea of this section is to decompose the input image into its waves components using wavelet transforms [13]. Each point in the Wavelet domain corresponds to a particular frequency contained in the spatial image domain. The original image is described by digital frequency filters. The result is that the number of frequencies corresponds to the number of pixels in the spatial domain.
It is to be noted that the Haar wavelet transform is separable and can be computed easily. Moreover, the wavelet transform provides the excellent spatial-frequency localization. The air bubbles is a key object to be detected in the spatial image domain. The wavelet coefficients could be a better signal representation and easy to detect comparing with initial spacial domain samples. Wavelets are defined by the wavelet function
Its scaling function is as follows
As a result, we obtain a set of wavelets (functions) orthogonal to parallel transfer and scaling.
The process of features extraction in images based on Haar wavelet transformations (Fig. 2), is performed as follows steps:
Step 1. Pre-processing (filter noise, morphology operation); Step 2. Resize image (128 Step 3. Haar wavelet transform based extraction with coefficients and create vector
Step 4. Calculation of the average of the coefficients found with the Haar wavelet transform
Step 5. Calculate the average image from each image:
Example of Haar wavelet transform signal: no bubble detected (top) and detected bubble (bottom).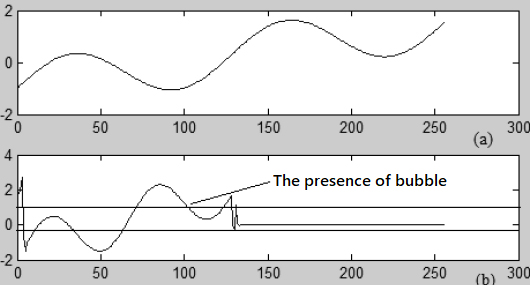
Experimental result of the detection of gas bubbles
Error analysis
The result of gas bubble detection.
ROC analysis results of gas bubble detection using GC-HWT, W-HWT and O-HWT.
Haar wavelet transform is applied and created a vector from the detail coefficient using an adaptive threshold
The experimental results on the bubbles datasets provided by MCV Tech Pte Ltd (S’pore) and ESI SB RAS (Russia) have shown that the system works with high efficiency (Table 1).
The comparison of the results derived using different image segmentation algorithms is fulfilled. Namely, Otsu’s [26] and Haar wavelet transform (O-HWT), watershed [27] and Haar wavelet transform (W-HWT), graph cut and Haar wavelet transform (GC-HWT) were implemented and tested. Table 2 demonstrates the effectiveness of the proposed GC-HWT approach. All experiments were carried out using a Win10 PC with Intel Core i3 CPU @ 3.00 GHz and 2.00 GB RAM.
In addition, the ROC curve was used to analyze the effectiveness and accuracy of the methods (O-HWT, W-HWT, GC-HWT) for gas bubble detection. Figure 4 demonstrates that GC-HWT outperforms the competing methods.
The combination of graph cuts and Haar-wavelet transform is proposed to detect gas bubbles. This approach has demonstrated both low computational cost and high accuracy of bubbles recognition. The result of the experiment showed the efficiency and reliability of the proposed approach. In our future work, the temporal information of the video sequences and advanced filtering methods will be employed to improve the bubbles recognition.
Footnotes
Acknowledgments
The authors are grateful to the referee for careful reading of the paper and valuable suggestions and comments. This research was performed at the Melentiev Energy Systems Institute SB RAS using the equipment of the High-Temperature Circuit Multi-Access Research Center and Machine vision MCV company from Singapore for bubbles registration. This work was supported by the program of fundamental research of the Siberian Branch of the Russian Academy of Sciences and carried out within the framework of the research project III.17.3.1, Reg. No AAAA-A17-117030310442-8.