
Abstract
Malaria is a protozoan disease that is affecting the 200 million lives of the people around the world and around 4 lakhs death per year due to this which raises our concern and we have tried to target the most affected part in the world i.e. Africa. In the paper approach is to maximize the recent developments in the area of malaria detection using cell images using Convolutional Neural Network (CNN). We have tried to automate the processes which are indulged in the detection of malaria. The method with no pre-processing and no high ended GPU dependency produces an accuracy of 97% proving it to be an efficient as well as low cost detection algorithm. The given implementation can easily detect malaria even from blurred images with no initial pre-processing needed. The algorithm is further compared with standard classification algorithms and stands out be highly efficient in terms of precision, recall, F1 score and computation time.
Introduction
Malaria possesses a great threat to the international community. It has greatly affected the countries which are in the region of Africa. Some factors include such as poverty level, access to medical facilities, intention of the government, war affected region, climate of the region where the malaria larva can propagate etc. [1]. All these factors greatly contributed in the region and thus it is the most affected part of the world. Certain Asian countries are showing in the green region, which shows that the death per 1,00,000 is about 0 to 3 but the Asian countries have the population and thus the overall death in the Asian countries contributes to about one-fourth of the total deaths in the world.
The followings are the reasons for any region to be prone to malaria:
Poverty level The risk of spreading the disease is faster in the poverty-stricken country and hence it plays an important role in the propagating of the malaria disease. Proper healthcare facilities Regions which do not have the basic infrastructure of the healthcare facilities are suffering from the disease as they do not have the early stage detection system for the malaria. Government or war affected areas The Government must ensure that the basic structures for the healthcare services are being given to the citizens. The war affected regions have seen a large number of cases in the malaria. So, United Nations and friendly countries should come forward and help the citizens living there. Disease transmitting fectors A lot of factors contribute to the transmitting of the disease such as needles/syringe exchange, larva spreading due to water clogging, blood transmissions etc. Malaria has been doing a great loss in the region of Africa and we have the cure of it but early detection of malaria is something that is significant in order to take care of it but that is not possible in the region of Africa as we have discussed above. There is a need of a low-cost infrastructure to start our project with an easy to use setup.
In the paper we have used CNN (Convolutional Neural Network). CNN is widely used on every image related problem nowadays [2]. The main advantage of Convolutional Neural Network compared to its earlier versions is that it learns to detect the important features automatically without any human support or supervision.
Convolutional Neural Network requires low computation and it is very efficient. It uses convolution and pooling operations and performs parameter sharing to the next level [3]. CNN models can run on any device and hence it outperforms others in the suitability and reachability.
All CNN model follows a similar architecture (Fig. 1). In any input image we perform a series of operations like convolution and pooling operations that is followed by a number of fully connected layers. The output of the Multiclass Classification is the SoftMax.
Architecture of CNN.
The building block of Convolutional Neural Network is the convolutional layer [4]. Convolution is a mathematical followed by window pooling operation to merge two sets of information. In the above example the convolution is applied on the input data using convolution filter to produce a feature map (Fig. 2). It is calculated by taking the two matrices, one is of input image second is of filter or kernel and taking the dot product of the matrices. The input is on the left side of the convolution layer. In the right of the image is the convolution filter or kernel. The filter is of 3
Input is converted to feature map.
Input is converted to feature map.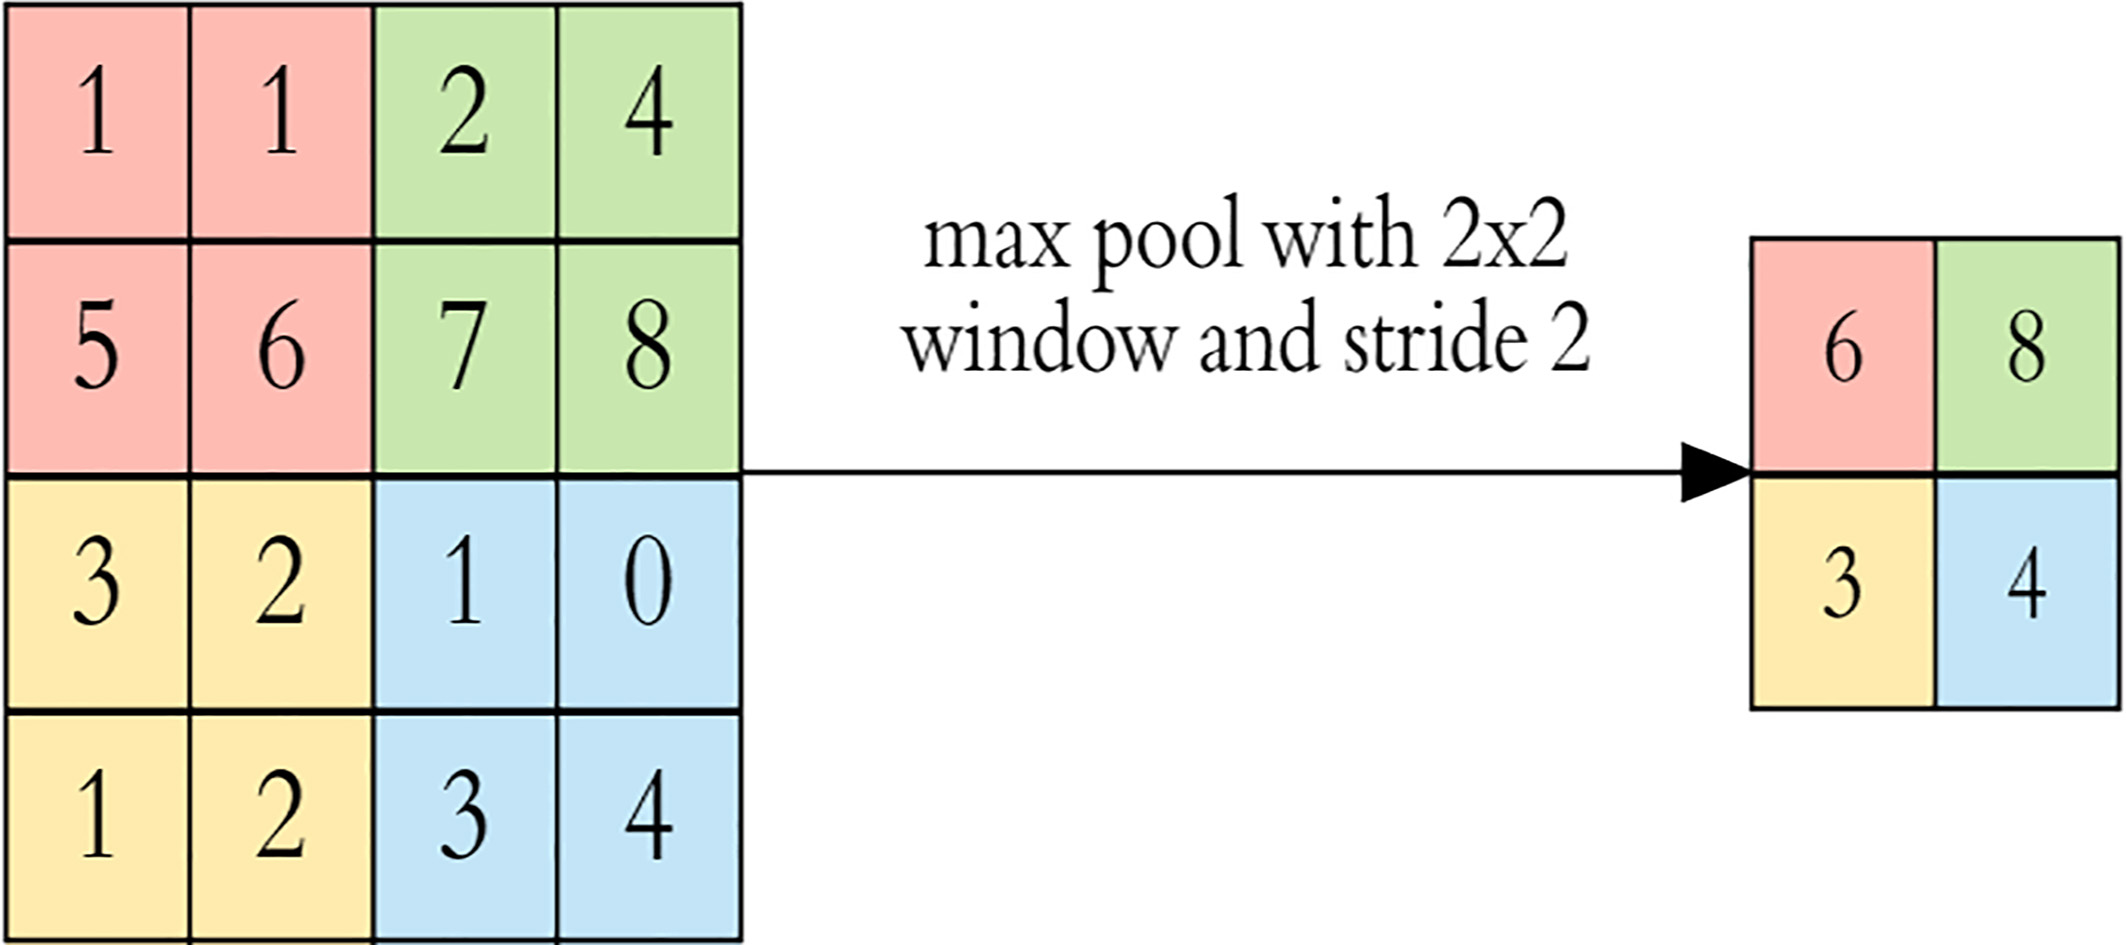
Matrix multiplication in feature map.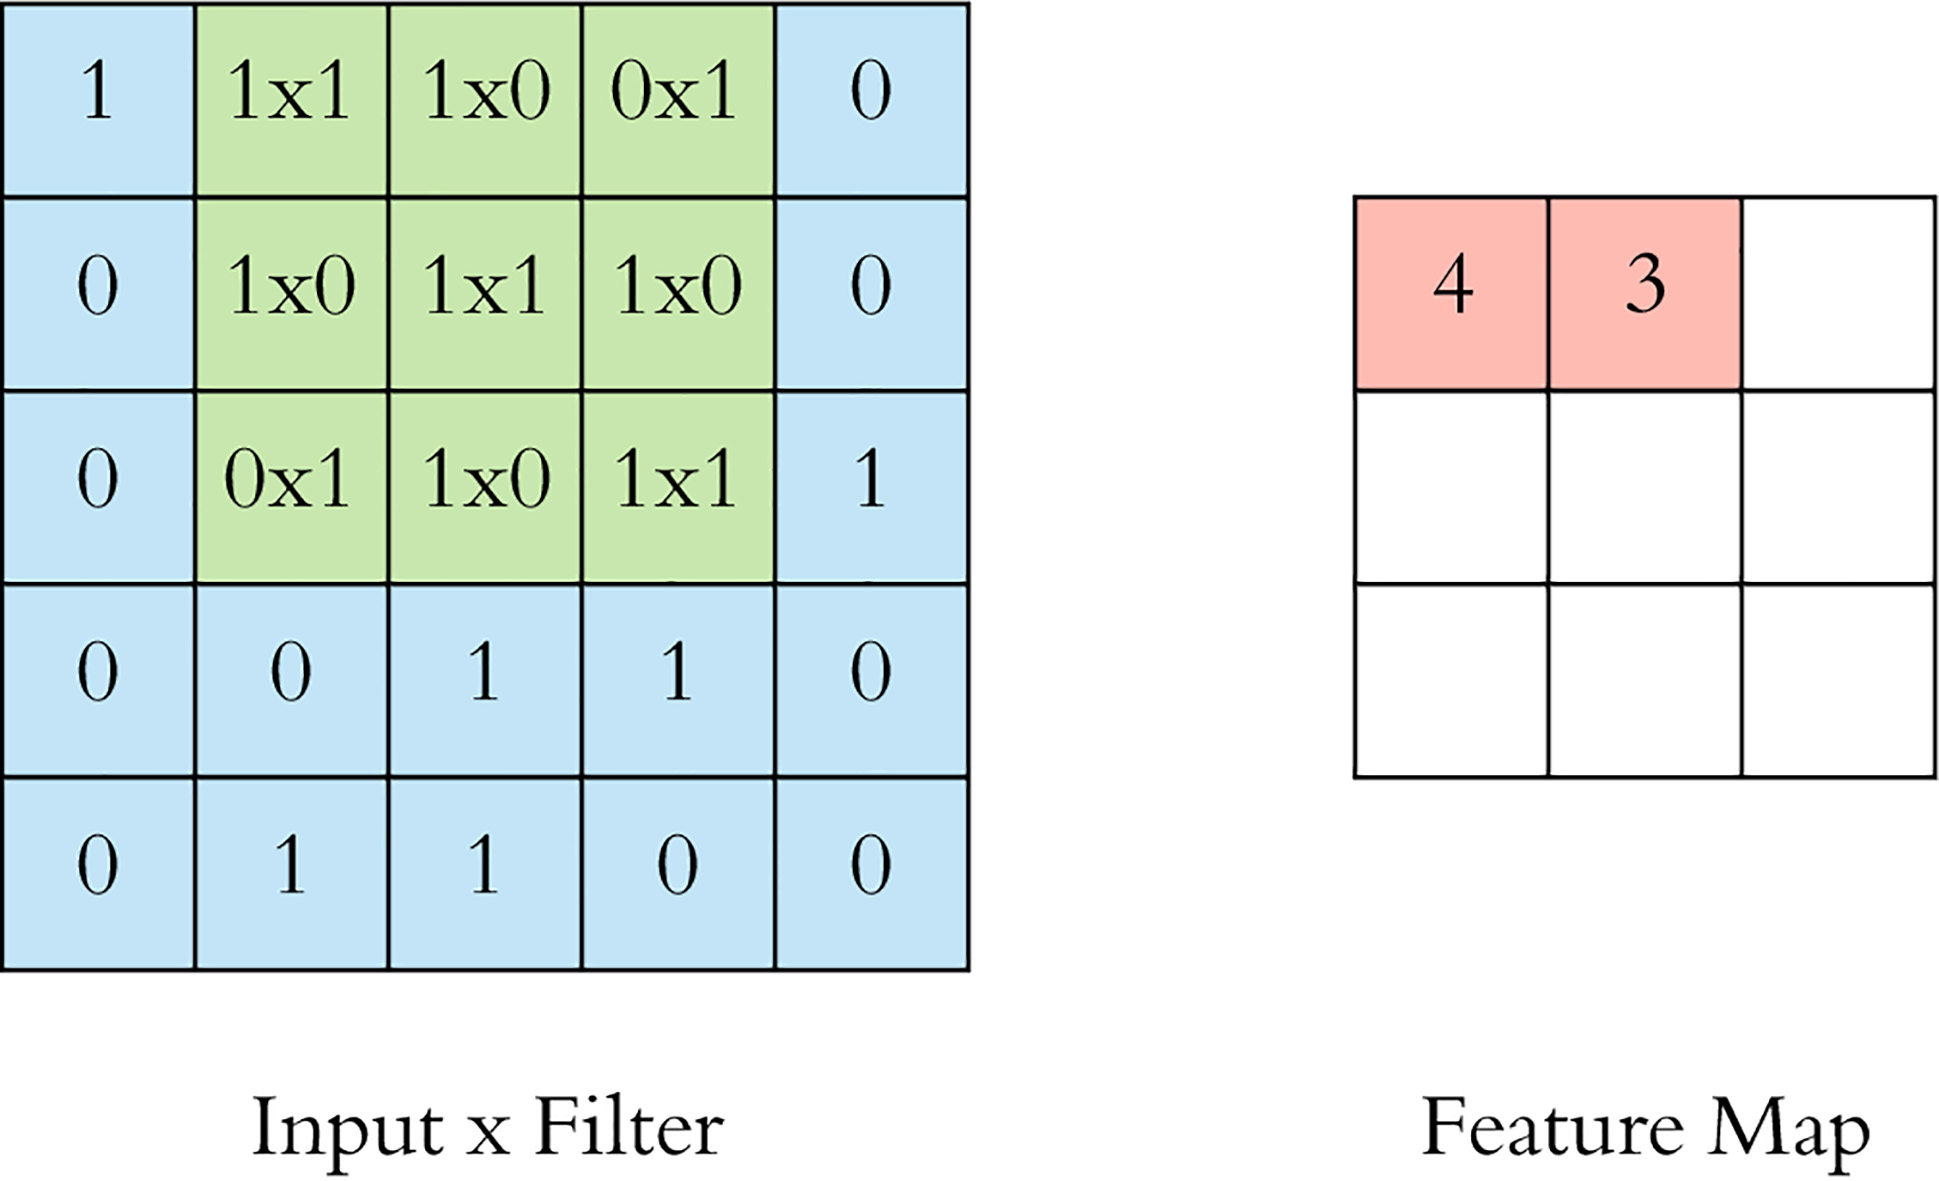
The filter or kernel is then slide over to the next matrix of the same size as of the kernel which is in the example 3
Pooling window.
After the convolution operation we perform pooling to reduce the dimensionality and complexity of the problem. This helps us to reduce the number of factors which ensures the training time is less and avoids over fitting. What Pooling layers does is that it down-sample each feature map independently and reduce the height and width and keeps the depth as it is. The easiest and the widely used pooling is the max pooling. Pooling is a process in which the maximum element is chosen out of the pooling matrix. Pooling has no parameters as in the case of the convolutional operation, it simply returns the maximum value out of the matrix. The pooling helps in reducing the complexity of the input image it takes the maximum input from height as well width but takes the depth in the original form to emphasize on the data points and what they meant thereby not deteriorating the quality of the image. For instance, if we take an image of height and depth of 32 and depth as 10 in the pooling we are not going to change the depth of the image but we have reduced the height and width of the image by two so as shown in Fig. 5, effectively it will reduce the computation by one-fourth and hence will make the pooling operation faster.
If the input image is blurry it is difficult to do the prediction on that image and chances are that it will show an incorrect prediction. Time for training the dataset is higher. We large dataset to be able to do the prediction. We cannot directly give the input to the model project as there is a manual intervention is required.
Disease prediction in probability. Dataset is verified as it was released by the US government medical department. This algorithm has been used previously for leaf disease prediction, we have converted it for malaria detection. The time taken by this algorithm to run on current dataset has been reduced from 24 to 20 hours. Processing is done without using GPU which is still attaining high accuracy.
Earlier to detect the malaria a clinician has to take the patient’s blood sample and put highlighting agents so that red blood cells can easily be viewed and the clinician has to count the infected RBCs so as to know whether the person has malaria or not. To detect the malaria the industries have developed the rapid diagnostic test (RDT) so as to achieve the speed in the process and with the high accuracy of the microscopes, the malaria can be detected better so there is a need to combine both the power of RDT and the accuracy of the microscopes.
Initially [6], highly sensitive optical technique for detection of blood cells infected by malaria by using third harmonic generation imaging of hemozoin pigment which gets successively deposited in the parasite during its life. The THG method enables to detect malaria robustly and with high degree of accuracy. The accuracy was found to be 95% for cells infected by THG. Though the process is fast and accurate but expensive hence cannot be used for normal malaria detection. Next paper [7] is used for study the concept of convolution neural network (CNN) for image analysis to diagnose malaria. This study proposes a novel machine learning model based on convolutional neural network (CNN) to classify images blood smear as affected with malaria or unaffected. Ten-fold cross-validation was used based on 27,577 single cell images, the accuracy of the 16-layer CNN model was found to be 95%. However here non-microscopic (blood) images were used.
Literature survey of techniques used in malaria detection
Literature survey of techniques used in malaria detection
To further improve the classification accuracy evaluations of Deep Convolutional Neural Networks for Automatic Identification of Malaria Infected Cells [8]. The dataset used here was analyzed by four pathologists, where two groups of slides labeled as malaria infected RBC’s and non-infected RBC’s. Were produced in form of slide images. Based on the simulation results 95% accuracy was achieved which was much higher than SVM (support vector machine) method.
However an improvement in classification was marked by using highly focused images. CNN based Malaria Diagnosis from Focus-stack of Blood Smear Images Acquired using Custom-built Slide Scanner was implemented [9]. A focused stack-based approach was introduced where the detection of plasmodium malaria was automated from blood smear samples. The main emphasis was made on deploying a highly efficient algorithm without any dependency on expensive instruments thus enabling pathologists to fasten the diagnosis. Here, although the slide scanner is of low cost but the process is costlier than other processes for detection of malaria infected cells.
Various techniques for malaria detection in current state-of-art for image dataset have been shown in Table 1.
Tomari et al. [19] study Artificial Neural Networks for Detection of Malaria and propose use of Artificial Neural Networks (ANN) for the diagnosis. The features/parameters needed for dataset were computed from the data obtained by the holographic images of the blood cells and is given as input to ANN which then classifies the image as affected or unaffected with malaria. Using this technique accuracy up to 90% was obtained.
Bbosa et al. [10] studied malaria diagnosis using rule based classification statistical prototype, In the study predictors of malaria were used and developed data mining, statistically enhanced rule-based classification to diagnose malaria and automated system was developed for diagnosis. The overall sensitivity and specificity obtained was 70% and 58% respectively. The values of specificity and sensitivity were found to vary with age of patient.
Rahmanti et al. [20] et al. proposed Plasmodium vivax protozoa classification from digitalization microscopic thick blood film by using second order statistical feature extraction and K-Nearest Neighbor Algorithm (K-NN). To extract feature GLCM (Gray Level Co-occurrence Matrix) was used. The accuracy obtained was 95%.
Savkare et al. [25] proposed automation of malaria parasite detection in microscopic images of blood, Multiple Image processing techniques were used in the proposed method. The proposal works in two levels where using multi-stage Support Vector Machine the accuracy obtained was 95%.
Fuzzy C-means clustering as another method was also applied [15] to extract infected erythrocytes for malaria detection. Here a segmentation process to find the erythrocytes infected malaria from images was used as a preprocessing stage. The experimental results showed that the proposed method can gain 98%, 93.3%, 98.65% and 90.33% of sensitivity, specificity, prediction value positive and prediction value negative, respectively. Another work [20] where feature extraction and classification for detection malaria parasites in thin blood smear, was developed based on the image processing technique to detect three stages of Plasmodium parasites while in human host, i.e. thropozoit, schizont, and gametocyte plasmodium falciparum. Multilayer perceptron back propagation algorithm is used to classify all features. The achieved accuracy was 87.8%.
SVM as a classification method has been widely used widely by authors in [14, 28, 21] for detecting malarial infected images. However, the accuracy achieved ranged between 85–90%. The choice of method was taken due to its low computation cost and ability to work on diverse feature dataset. In 2015, Chiroma et al. [17] used jordan-elman neural network to detect malaria from thick blood smear. The proposed classifier worked on feature extracted dataset where the effectiveness of the classifier was compared to a support vector machine and multiple regression models. The model achieved a reliability of 90%. The authors restated that medical practitioners can take the help of such efficient classifiers for a speedy detection of malaria as well as determining the severity of disease. This will eventually reduce the rate of morbidity, premature births, and maternal and infant mortality.
Overall scheme of method used.
Authors in [32] have given a glimpse of existing techniques for detecting malaria from image dataset. Various techniques discussed here are based on machine learning concepts for image processing to identify infected cells. They have clearly categorized the techniques based on preprocessing, segmentation, feature extraction as well as automatic classification. Parasite detection and cell segmentation, feature computation, and automatic cell classification. However here an Eigen value based decomposition preprocessing is used to improve local brightness of the images which is time consuming. A similar implementation with less time overhead can be obtained using a resnet based CNN model.
Sorgedrager [33] proposed a framework where CNN was used an object classifier to identify the infected erythrocytes in the given image. The object classification worked on pixel localization.
Algorithm successfully localized the erythrocytes with an average sensitivity of 97.31% and precision of 92.21%.
Deep Learning as the name suggest are algorithms that are inspired by human brain thinking. It includes a variety of other algorithms which are commonly termed as “neural networks”. As the input here in these algorithms pass through a “deep” series of layers before transforming non-linearly hence the name “deep learning”.
Convolution is the operation that is applied for various transformations an image goes through while using CNN in image analysis. Before, going through the overall methodology which is explained in Fig. 6, we discuss the building blocks of CNN in the following section.
Building components of CNN
Convolution operation
Convolution operations done on an image of size
Where,
For computing
The operation which does not consider flipping of matrix
Max-pooling is an aggregation operation that extracts the maximum value in a region of size
Dropout regularization
The term “dropout” refers to dropping out neurons (both hidden and visible) in a neural network randomly. This technique was introduced by Srivastava et al. [3] to mainly tackle the problem of over fitting in neural networks.
Non-linearity layers
After convoluting layers, some non-linear operations are applied with help of functions known as “activation” functions. In most of earlier works, sigmoid and tanh are the most commonly used functions that have been deployed and used. However, certain other helper functions i.e activation functions have been proposed due to existing function limitations by researchers such as rectified linear unit (ReLU) [4] and its variants (leaky ReLU, Noisy ReLU, ELU) which are now preferred in most of the deep learning tasks. Mathematically ReLU function and its variants are expressed as:
Here Eq. (3) is for Simple ReLU, Eq. (4) is for Leaky ReLU and Eq. (5) for Exponential LU (ELU).
Softmax which is similar to sigmoid function gives output value between 0 and 1, it is usually used for classes more than 2 and is defined as given in Eq. (6):
We divided the dataset into 3 equal parts. Two parts were used for training the Convolution neural network and the rest were used for validation and deriving result. Categorical cross-entropy is used which gives output with a probability between 0 and 1. If number of classes is two then binary cross-entropy is calculated as:
While if number of classes is more than 2, categorical cross-entropy loss is calculated as:
Where,
We used the malaria dataset from US National library of Medicine [5] which is the input to the system. A repository of segmented cell images has been hosted on the mentioned resource. The dataset consists of images that have been collected from an android smartphone. This reduces the scalability and feasibility issues with any high ended image dataset. Giemsa-stained thin blood smear slides from 150 P. Falciparum-infected and 50 healthy patients were collected and photographed at Chittagong Medical College Hospital, Bangladesh. An expert slide reader from Mahidol-Oxford Tropical Medicine Research Unit has manually annotated this image dataset in Bangkok, Thailand. The dataset contains a total of 27,558 cell images with equal instances of parasitized and uninfected cells. Along with the dataset there is CSV file with patient – ID to cell mapping to both infected and non-infected cells. There are 201 entries in uninfected CSV class file while 151 entries in infected class file.
Classification
From the given dataset, a classification is performed to identify infected and healthy cells. CNN based resnet model is used here with a 2 class soft maximum output. The annotated dataset is initially used as a training input where the classified output creates two sets: one health and one infected. The infected set so obtained including the un-identified instances can further be given for clinical examination. The false identified instances can be re-fed to the input dataset for further network improvement.
Algorithm implementation
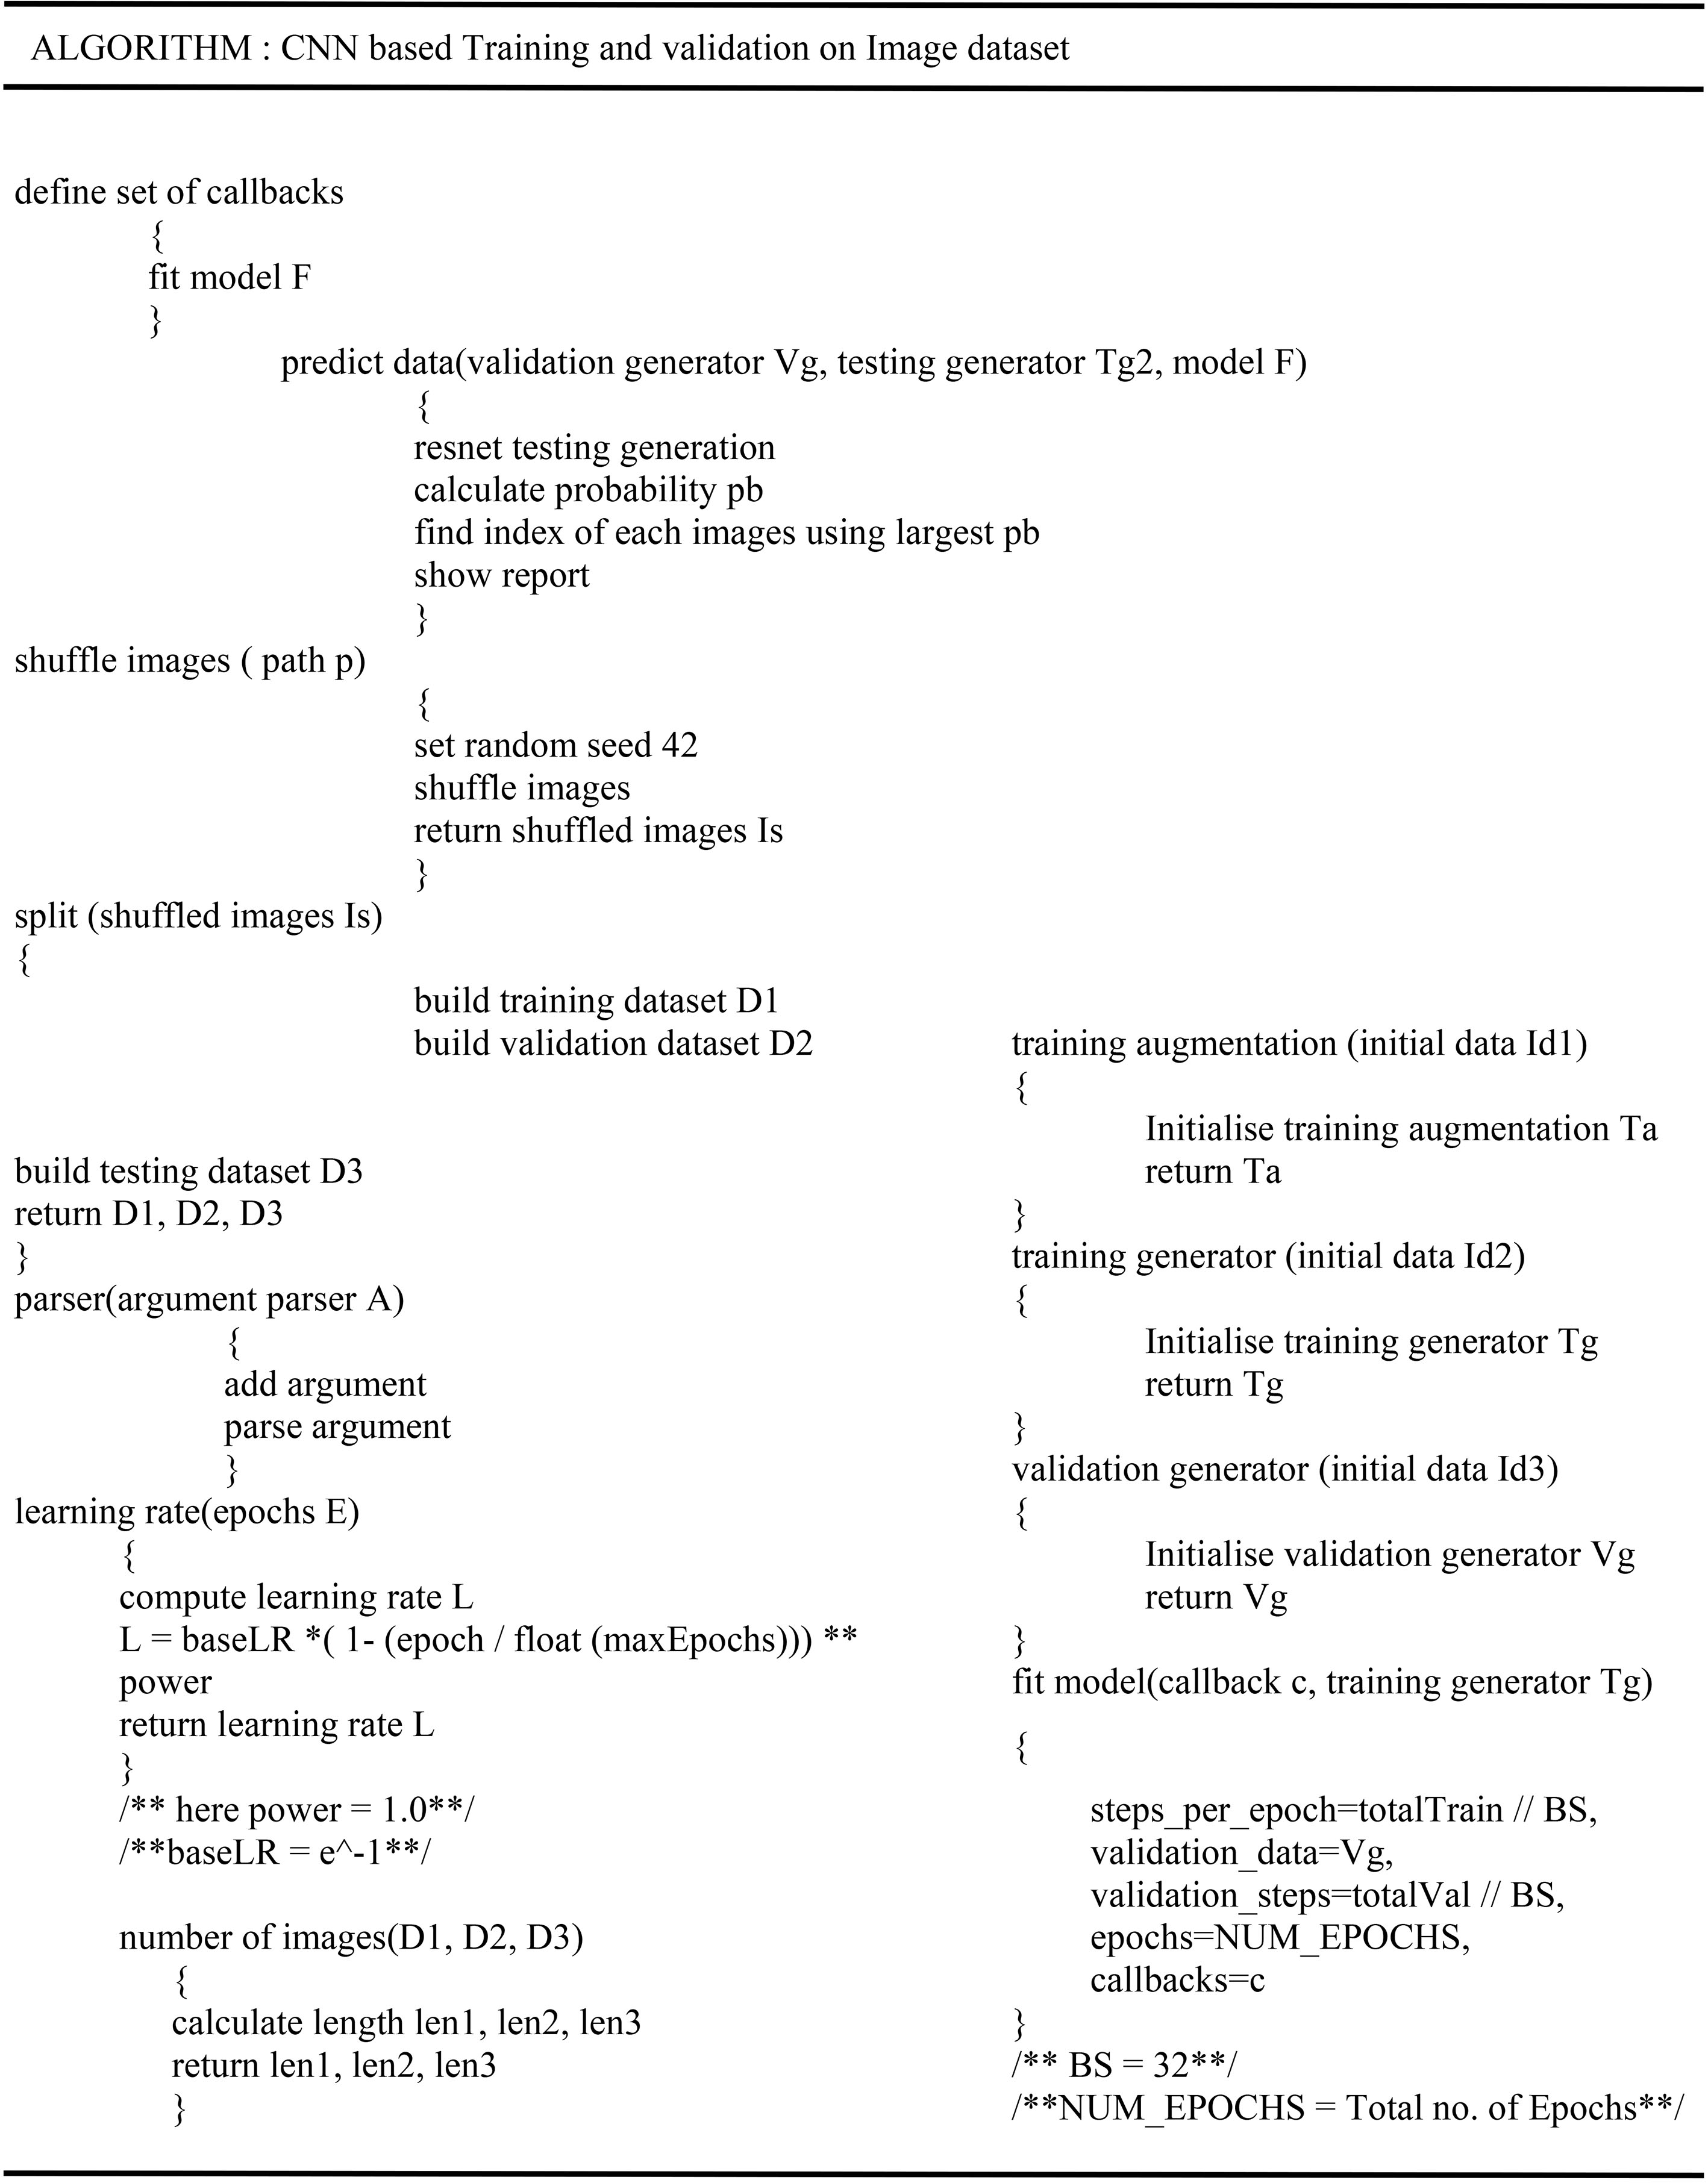
The ResNet [32] model implementation algorithm has been shown given above.
This section presents the resnet deep convolutional network algorithm used for classifying the infected malaria images. Initially a callback method is used where the training and validation data is separated using a random seed and a fixed batch size of 32. Following the above the resnet model is fitted on the segregated data based on the learning rate identified.
Finally the performance metrics of the fitted model is calculated along with training and validation accuracy as well as loss plots to quantitatively analyze the classified results as discussed in next section.
Confusion matrix
Confusion matrix
Graphical comparison of performance statistics.
Graphical comparison of performance statistics.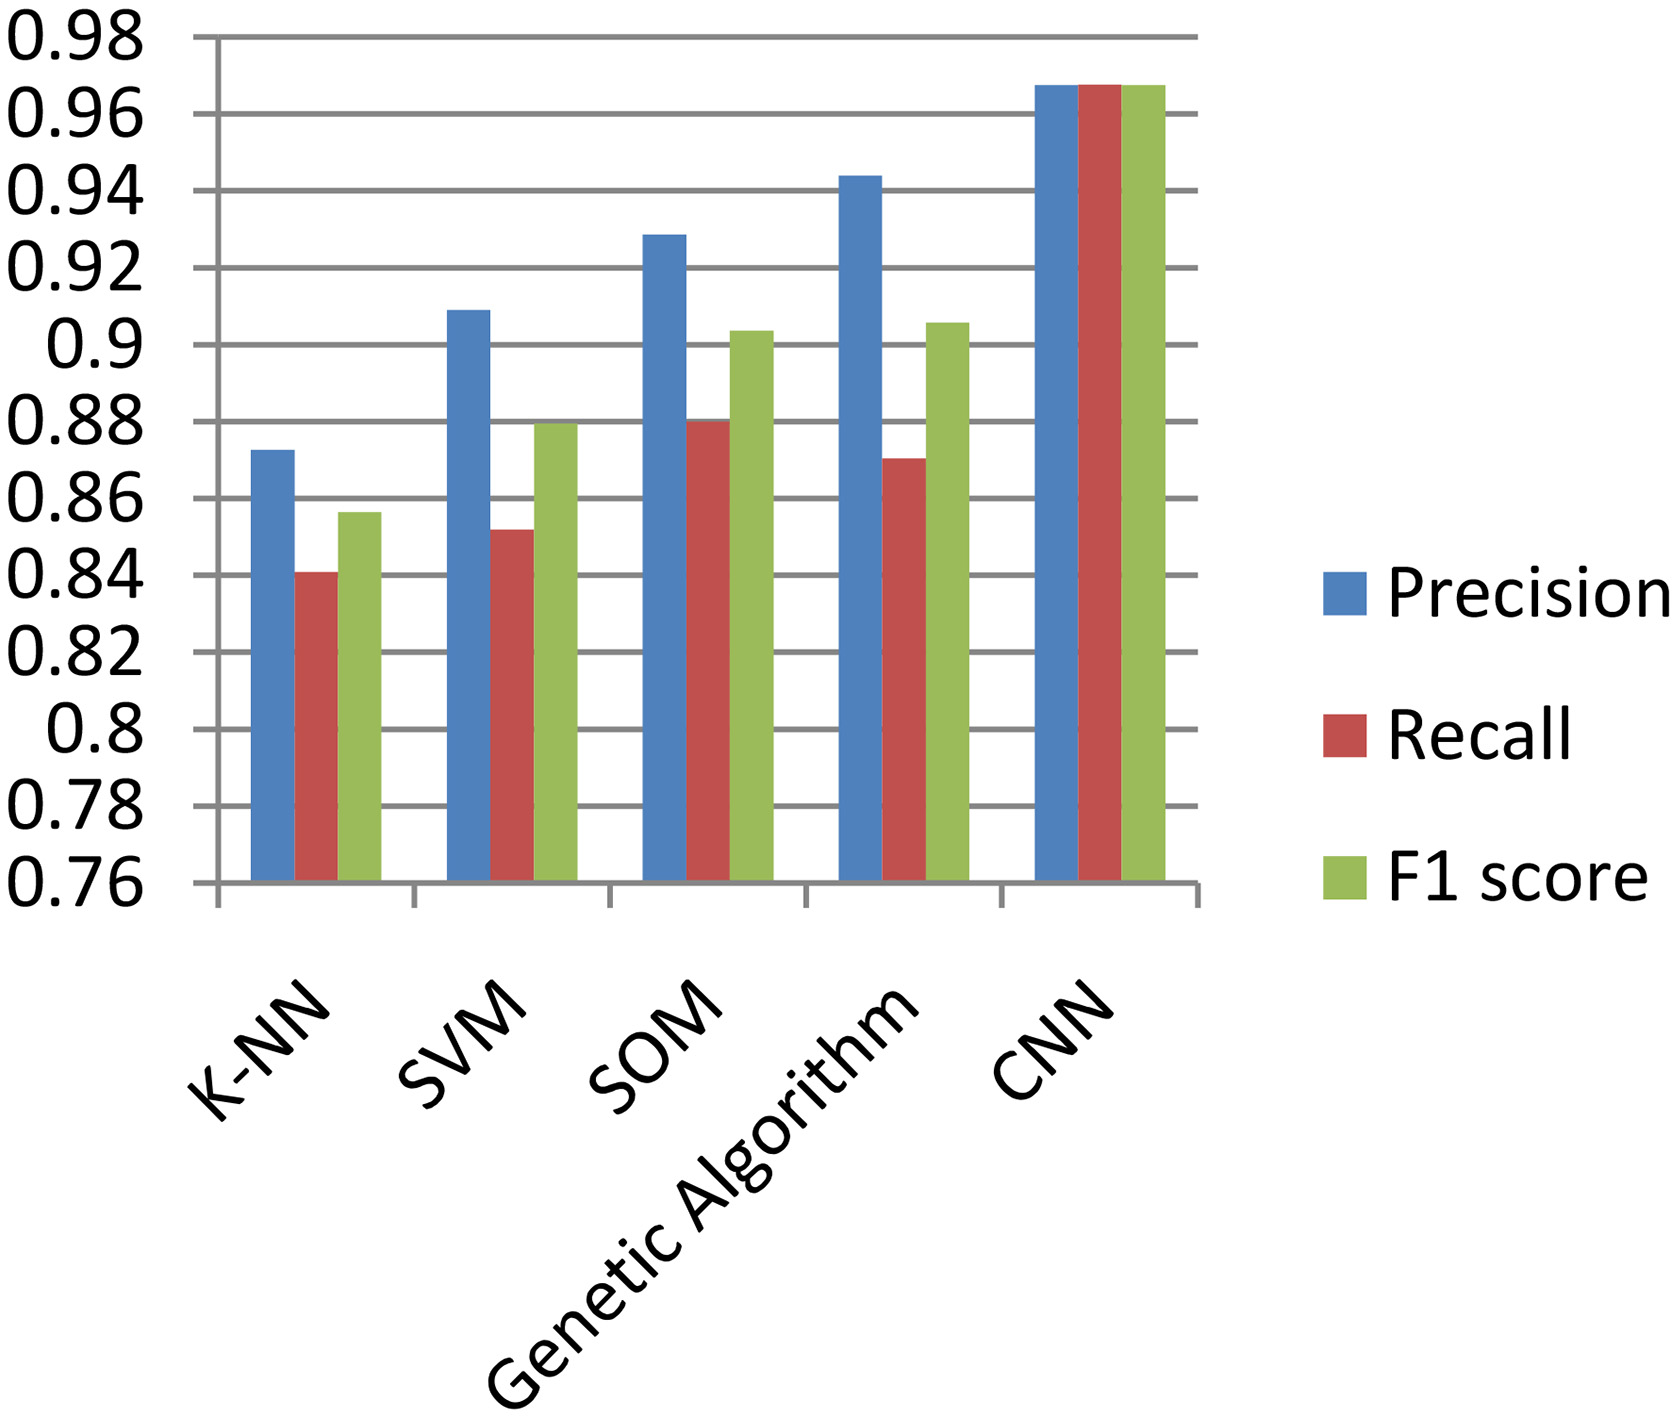
Graphical comparison of accuracy for different methods used on malaria detection.
Training and validation loss on dataset.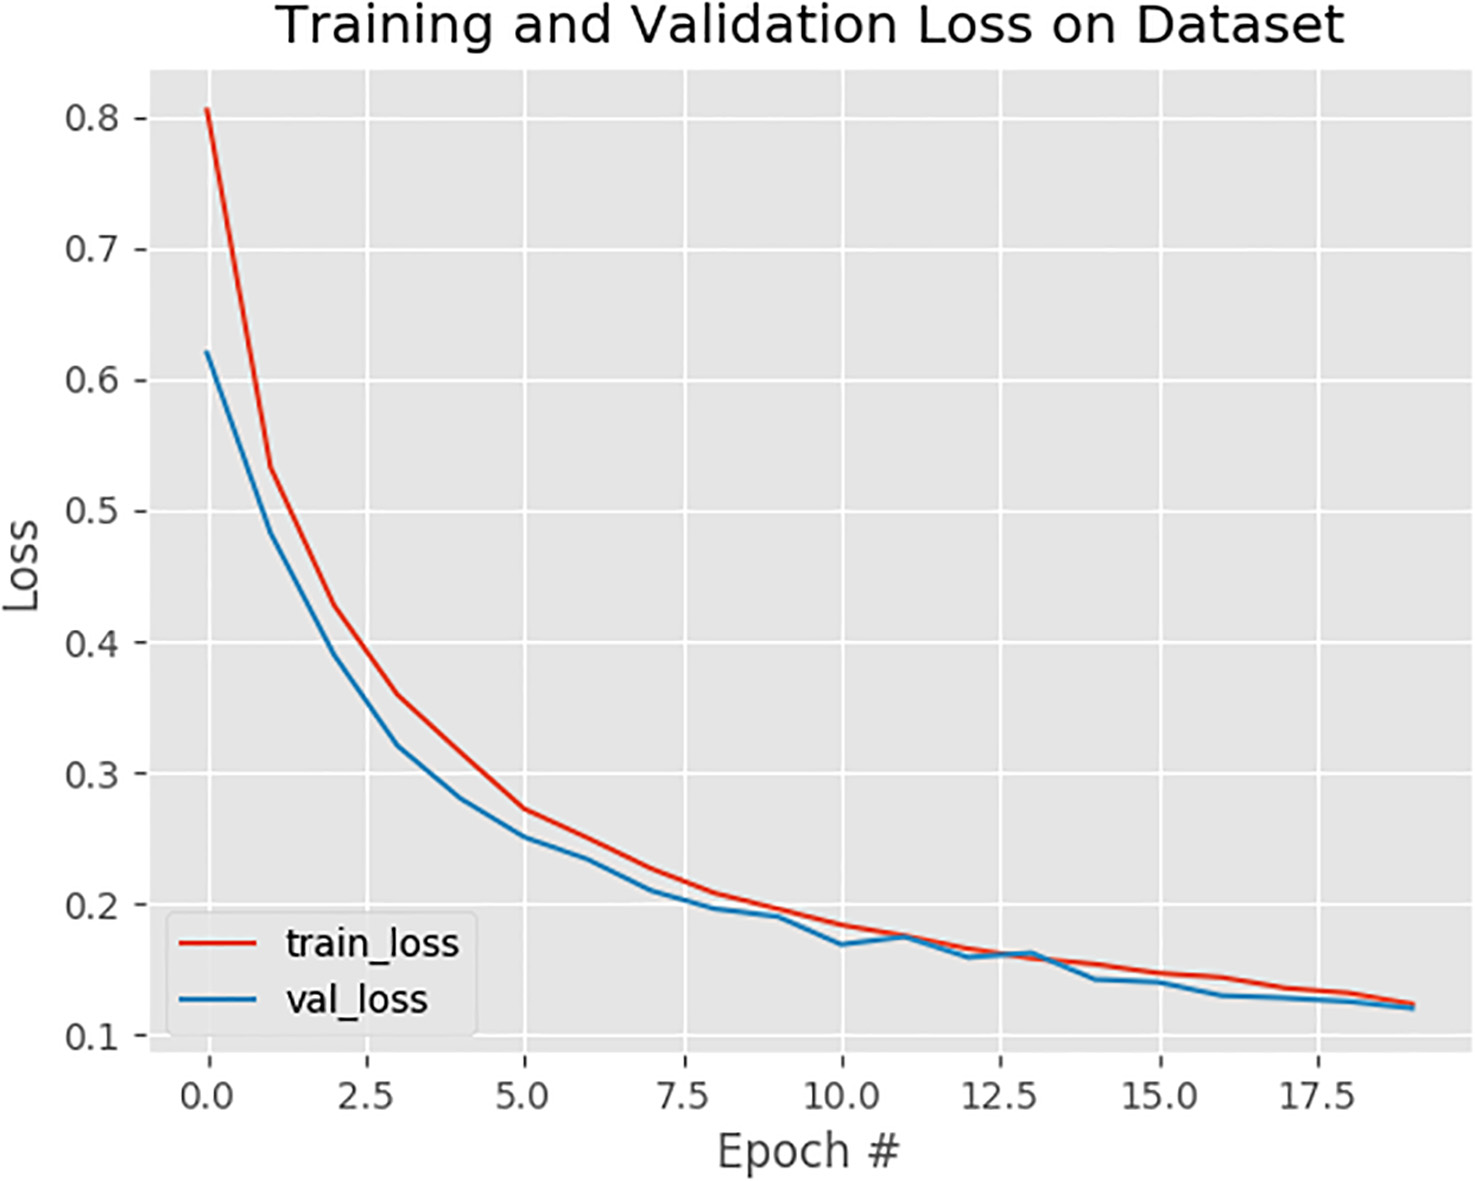
Comparison based on performance metrics
Accuracy and loss in training and validation
Training and validation accuracy on dataset.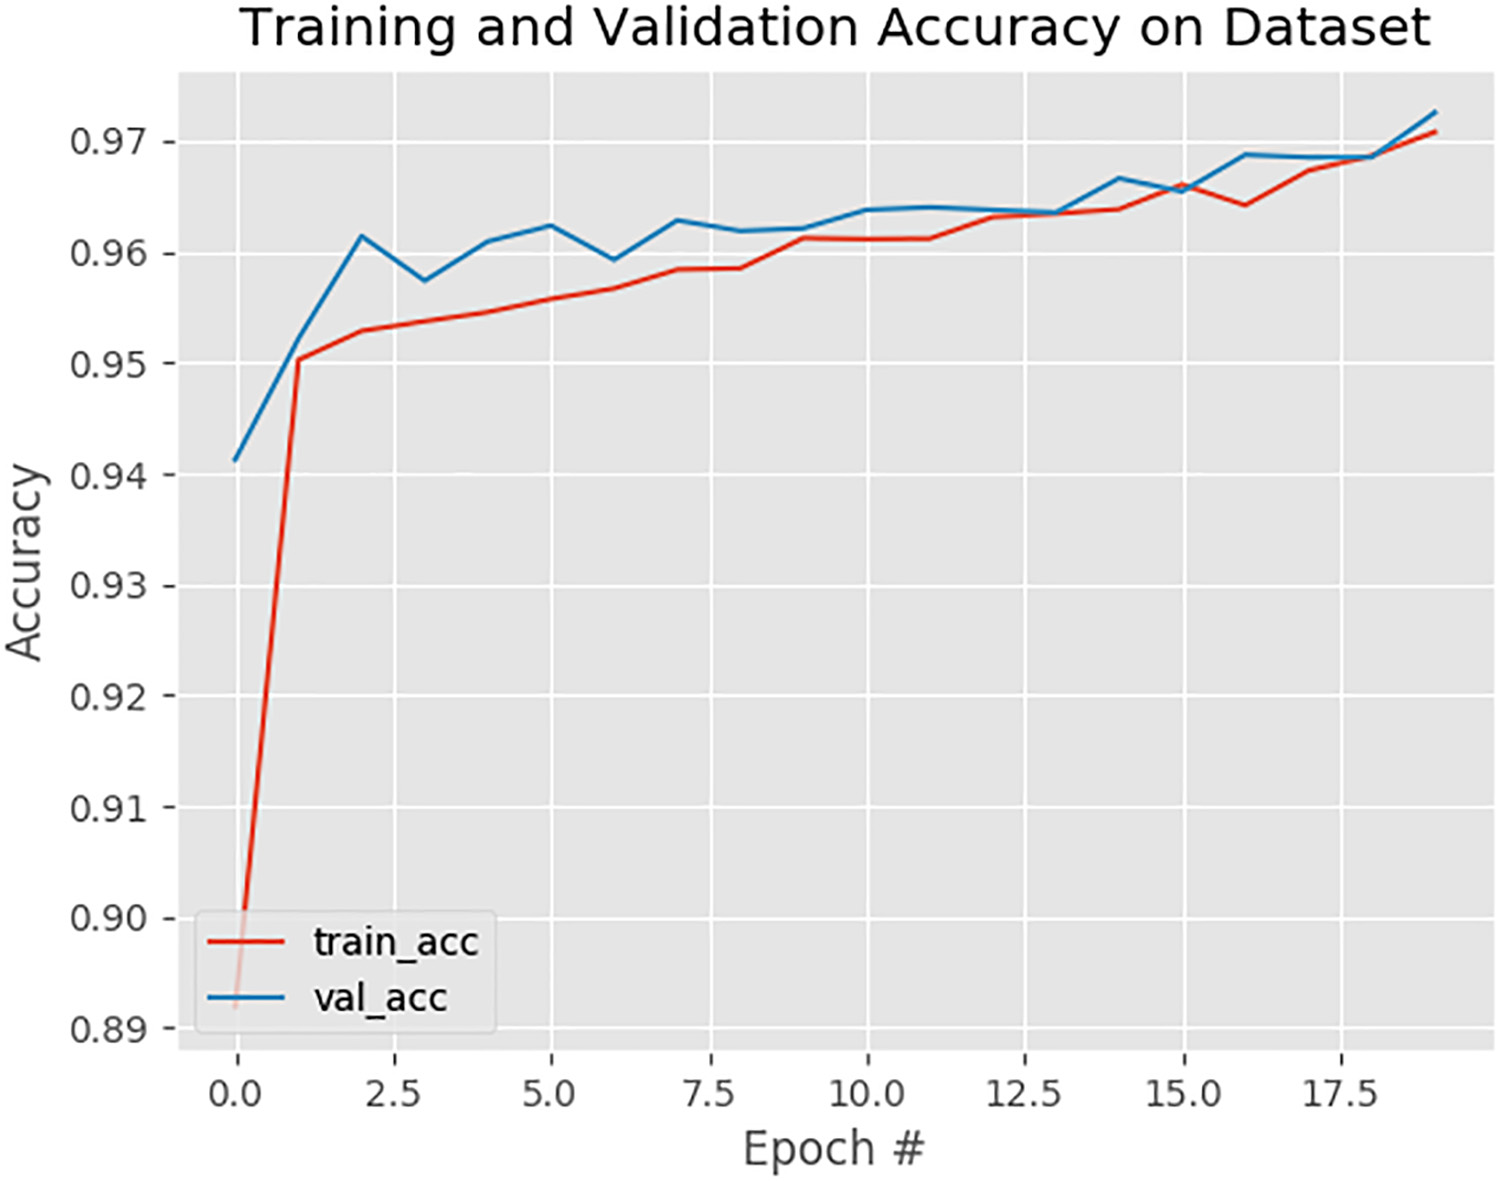
Training loss and accuracy on dataset.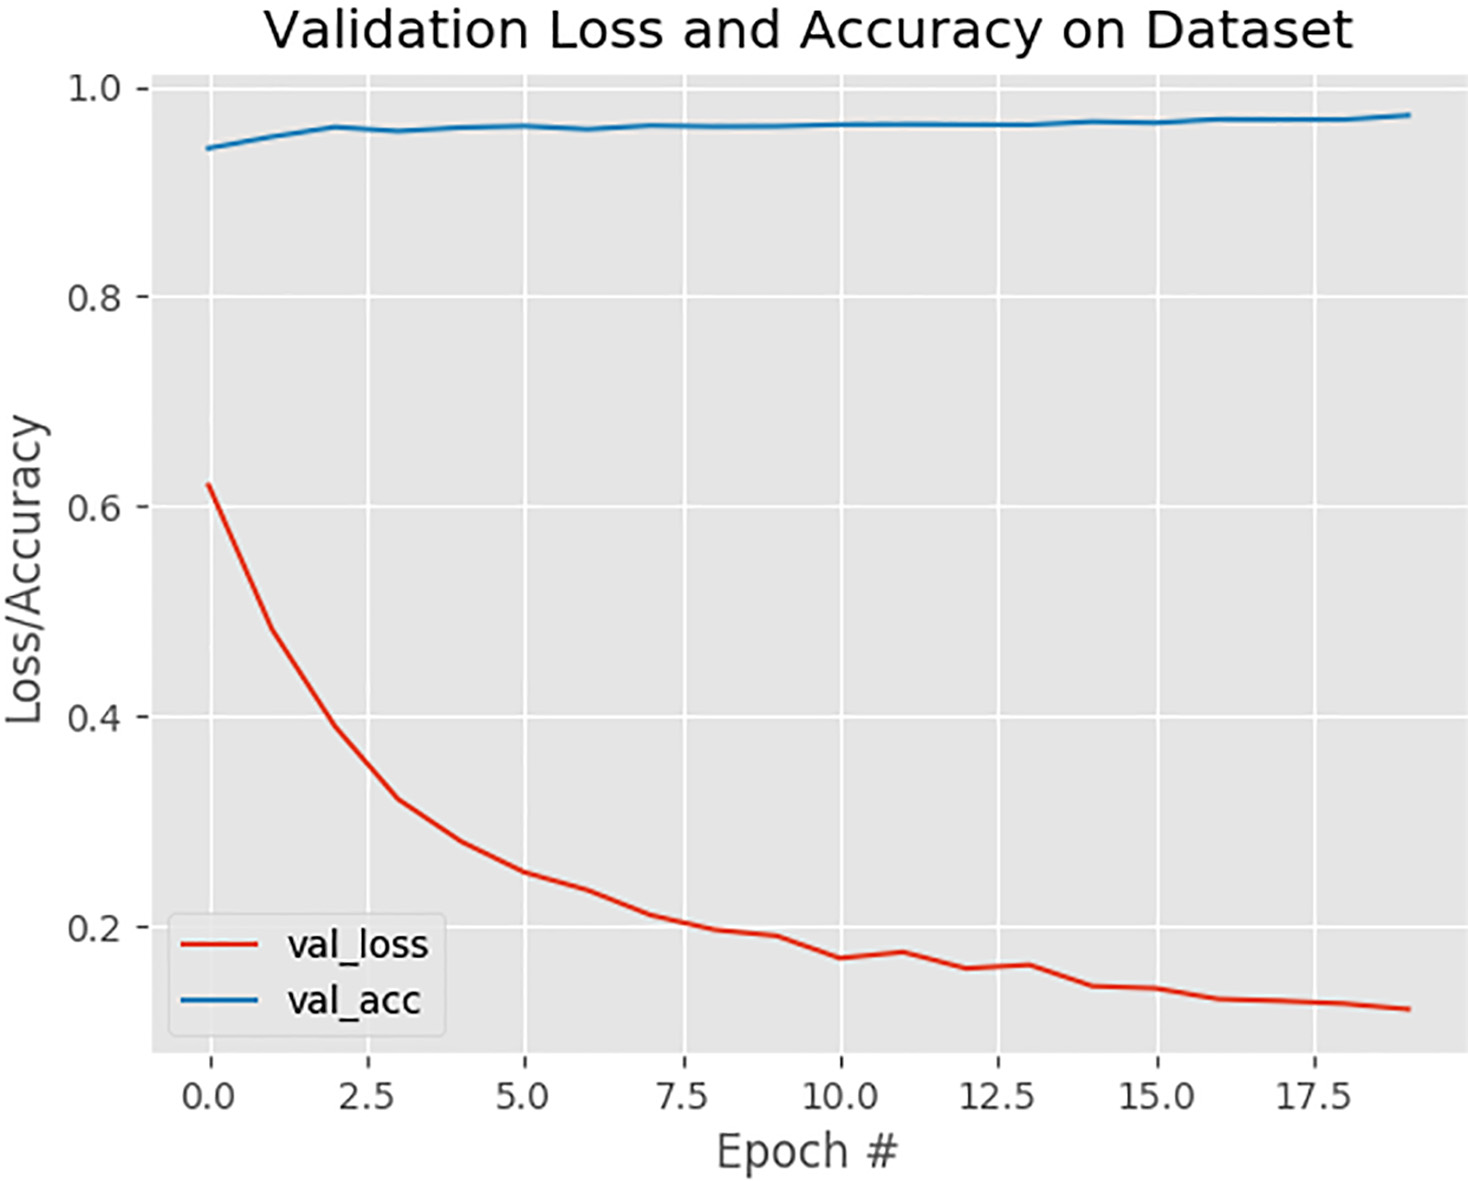
Validation loss and accuracy on dataset.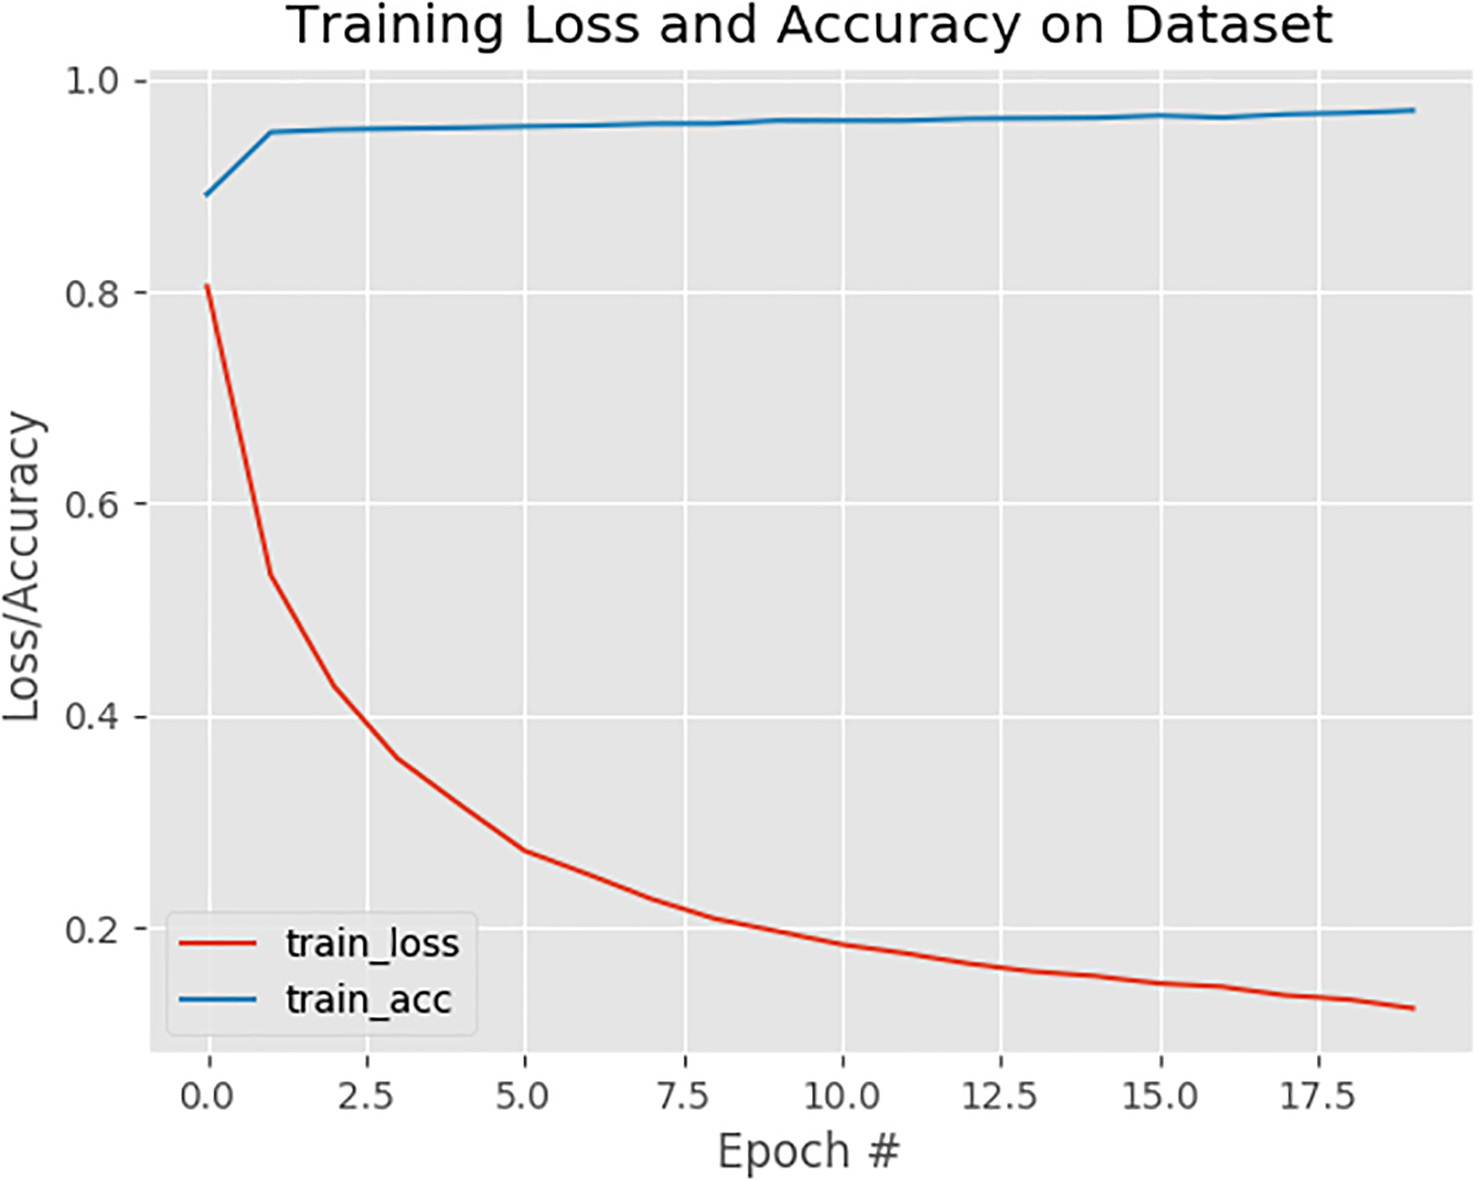
Based on above obtained confusion matrix following parameters are evaluated in Eqs (6)–(10). These equations formulate the various statistical measures of a classification method given as true positive (tp), true negative (tn), false positive (fp), false negative (fn), precision and recall. For further analysis, Mean square error is also calculated as shown in Eq. (10).
The performance statistics have been graphically shown and compared in Figs 7 and 8. Various classification methods have been applied on the same range of dataset with malaria infected images and compared on statistical metrics in Table 2. Figure 9 shows a comparison among taken methods in terms of accuracy. A lower loss signifies a better and efficient model (unless the model has over-fitted to the training data). The loss is calculated on training and validation and its interpretation is how well the model is doing for these two sets. Unlike accuracy, loss is not a percentage. It is a summation of the errors made for each example in training or validation sets.
Val_loss is the value of cost function for your cross validation data and loss is the value of cost function for your training data. On validation data, neurons using drop out do not drop random neurons. The reason is that during training we use drop out in order to add some noise for avoiding over-fitting. During calculating cross validation, we are in recall phase and not in training phase. We use all the capabilities of the network. Training and validation loss as well as accuracy is shown in Figs 10 and 11 respectively. Figures 12 and 13 shows Training loss and Validation on dataset for different epochs respectively.
In this paper, we used deep residual network for accurately classifying microscopic blood cells images for malaria detection amongst 2 different classes: parasitized and uninfected. The accuracy obtained is 97% with 20 hours of training of data. We have relied only on general computational power of Intel core i3 processor for training and arriving at results. We have also evaluated computer metrics to support performance of our model. For future studies, researchers should try other neural networks such as Inception network as base model for building the classifier. Results may improve by improving the quality of training dataset.