
Abstract
Segmentation and classification of latent fingerprints is a young challenging area of research. Latent fingerprints are unintentional fingermarks. These marks are ridge patterns left at crime scenes, lifted with latent or unclear view of fingermarks, making it difficult to find the guilty party. The segmentation of lifted images of such finger impressions comes with some unique challenges in domain such as poor quality images, incomplete ridge patterns, overlapping prints etc. The classification of poorly acquired data can be improved with image pre-processing, feeding all or optimal set of features extracted to suitable classifiers etc. Our classification system proposes two main steps. First, various effective extracted features are compartmentalised into maximal independent sets with high correlation value, Second, conventional supervised technique based binary classifiers are combined into a cascade/stack of classifiers. These classifiers are fed with all or optimal feature set(s) for binary classification of fingermarks as ridge patterns from non-ridge background. The experimentation shows improvement in accuracy rate on IIIT-D database with supervised algorithms.
Sample images from IIIT-D combined latent fingerprint database (a) Latent database, (b) Latent_mated_1000ppi, (c) Latent_mated_500ppi.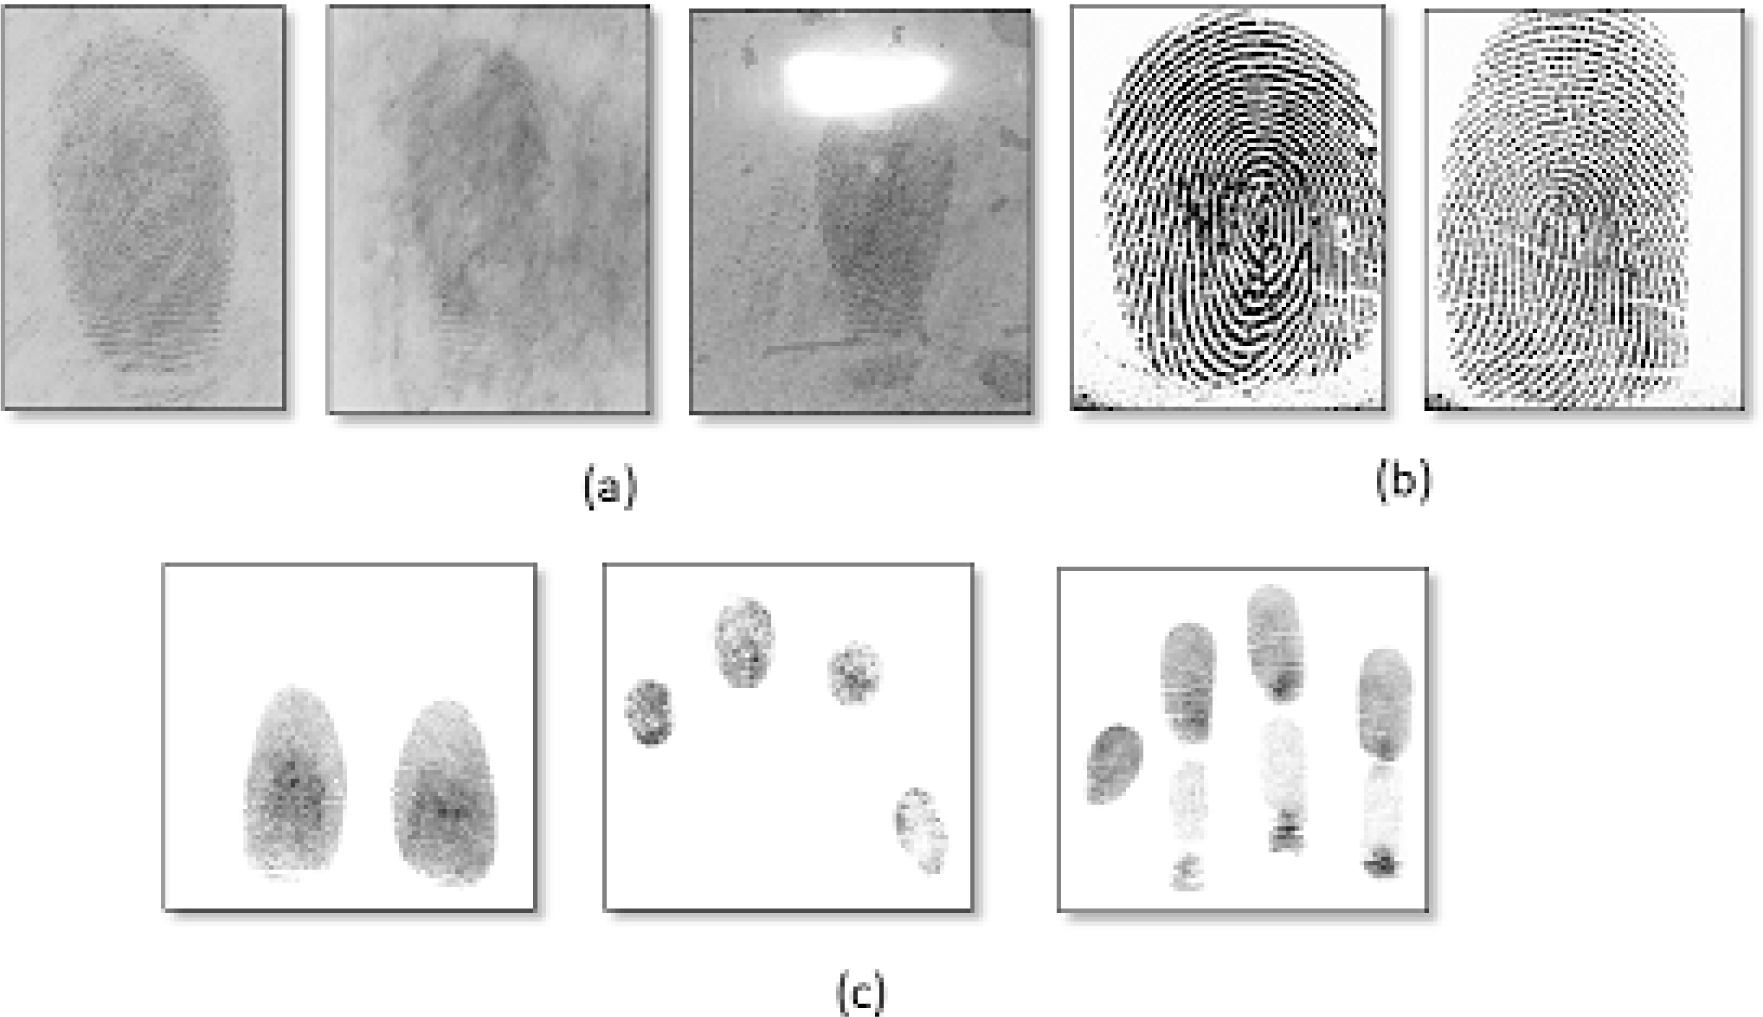
Set of images from IIIT-D combined latent fingerprint database demonstrating segmentation issues such as noisy image, blurred ridge information, effect of light on ridge information.
The primary task of the Automated Fingerprint Identification Service (AFIS) [1] is to recognise the fingerprints. Ten-print based identification and latent fingerprint identification are the two types of fingerprints under scrutiny by police agencies. Former prints are recognised via whole sequence match of all 10 finger prints whereas in latter, the person is identified from unclear fingerprints captured from crime scenes, hence demand special process [2]. The volume of the database of fingerprints, for identifying guilty party out of suspects of the crime, in case of latent fingerprint matching compromises the efficiency of identification task. The image segmentation and classification of latent fingerprint image (LFI) into ridge and non-ridge pattern for further process is a valid strategy in order to reduce the amount of matching during fingerprint retrieval, thereby improve the identification performance. Implementation of proposed work relates to schemes for binary classification [3], more precisely, classification of ridge pattern in foreground from non-ridge area as background. A binary classification [4] task performs separating or segmenting given image into two groups, class 1 and class 0 label, one possessing certain properties and another not. Multiple schemes exist in literature for binary classification, decision trees [5, 6], Random forest trees (RDF) [7], Support vector machines (SVM) [8], Adaboost [9] etc. In some applications, classification is performed multiple times, which may require deciding whether a group of pixels posses a certain property or not, for instance, whether pixels belonging to ridge have similar dominant color or higher discontinuity measure etc. In present work, LFIs from IIIT-D CLF [10] database is classified into two regions, ridge pattern as foreground and non-ridge pattern as background region of the image. Figures 5–7 demonstrate the difference between foreground and background information in sample LFIs from IIIT-D images.
The entire semi-automated process of latent fingerprint matching consists of a) pre-work, b) manual markup of features, c) ranking top probable matches using (AFIS) and manual verification of suspects by forensic experts. With pre-work, image segmentation of foreground region from background region is performed. The segmentation is performed after classification of pixels into one of the two classes/regions. The classified label as foreground are kept and another label is masked as black or background. The information in foreground labelled pixels is kept as such as segmented portion. Further enhancement is performed using connecting regions in order to keep the entire fingerprint.
This paper focuses on automated classification and segmentation of IIIT-D-CLF database of LFI using various binary classification schemes. Figure 1 shows sample images from IIIT-D database. Segmentation is found difficult process in LFI due to some factors, but not restricted to poor quality, noisy image or ridge, incomplete information in the image, structured noise such as lines, texts etc, overlapping of prints [11, 12, 13], segmentation representation problem etc. Figure 2 demonstrates the issues of segmentation on sample images taken from IIIT-D Latent fingerprint database.
The empirical study of latent fingerprint segmentation in [14] shows how LFIs are commonly explored. Initially ridge based features and later deep learning based feature extraction is exploited. The performance metrics are invariant to model used and later more experiments are done with use of statistical measures to graphical approaches. Karimi and Kuo [15] used local window based approach to compute variability in ridge frequency and orientation. Short et al. [16] used ridge template cross-correlation with local blocks of LFI. The performance metrics Equal Error rate (EER) of 33.8% was achieved on NIST SD-27 [17] database. Choi et al. [18], local block based ridge frequency and orientation and removed background noise. The approach achieved Missed Detection Rate (MDR) and False Detection Rate (FDR) [18] of 14.78% and 47.99% and accuracy of 16.28% in NIST-SD 27 and 35.19% accuracy on WVU database [19]. Zhang et al. [12] applied a total variation and adaptive total variation (ADTV) approach for latent fingerprint segmentation. The ADTV model does not remove the noise from texture ROI but suppress it for better identification of ridge. MDR and FDR of 14.10% and 26.13% respectively is achieved on NIST SD27. Rank-1 identification accuracy of less than 2% by VeriFinger SDK 6.6 [20].
With advancement in number of features [21, 22], Anush et al. [23] proposes classification based segmentation. The database images are divided into local blocks of size 32
Steps to illustrate random decision forest classifier.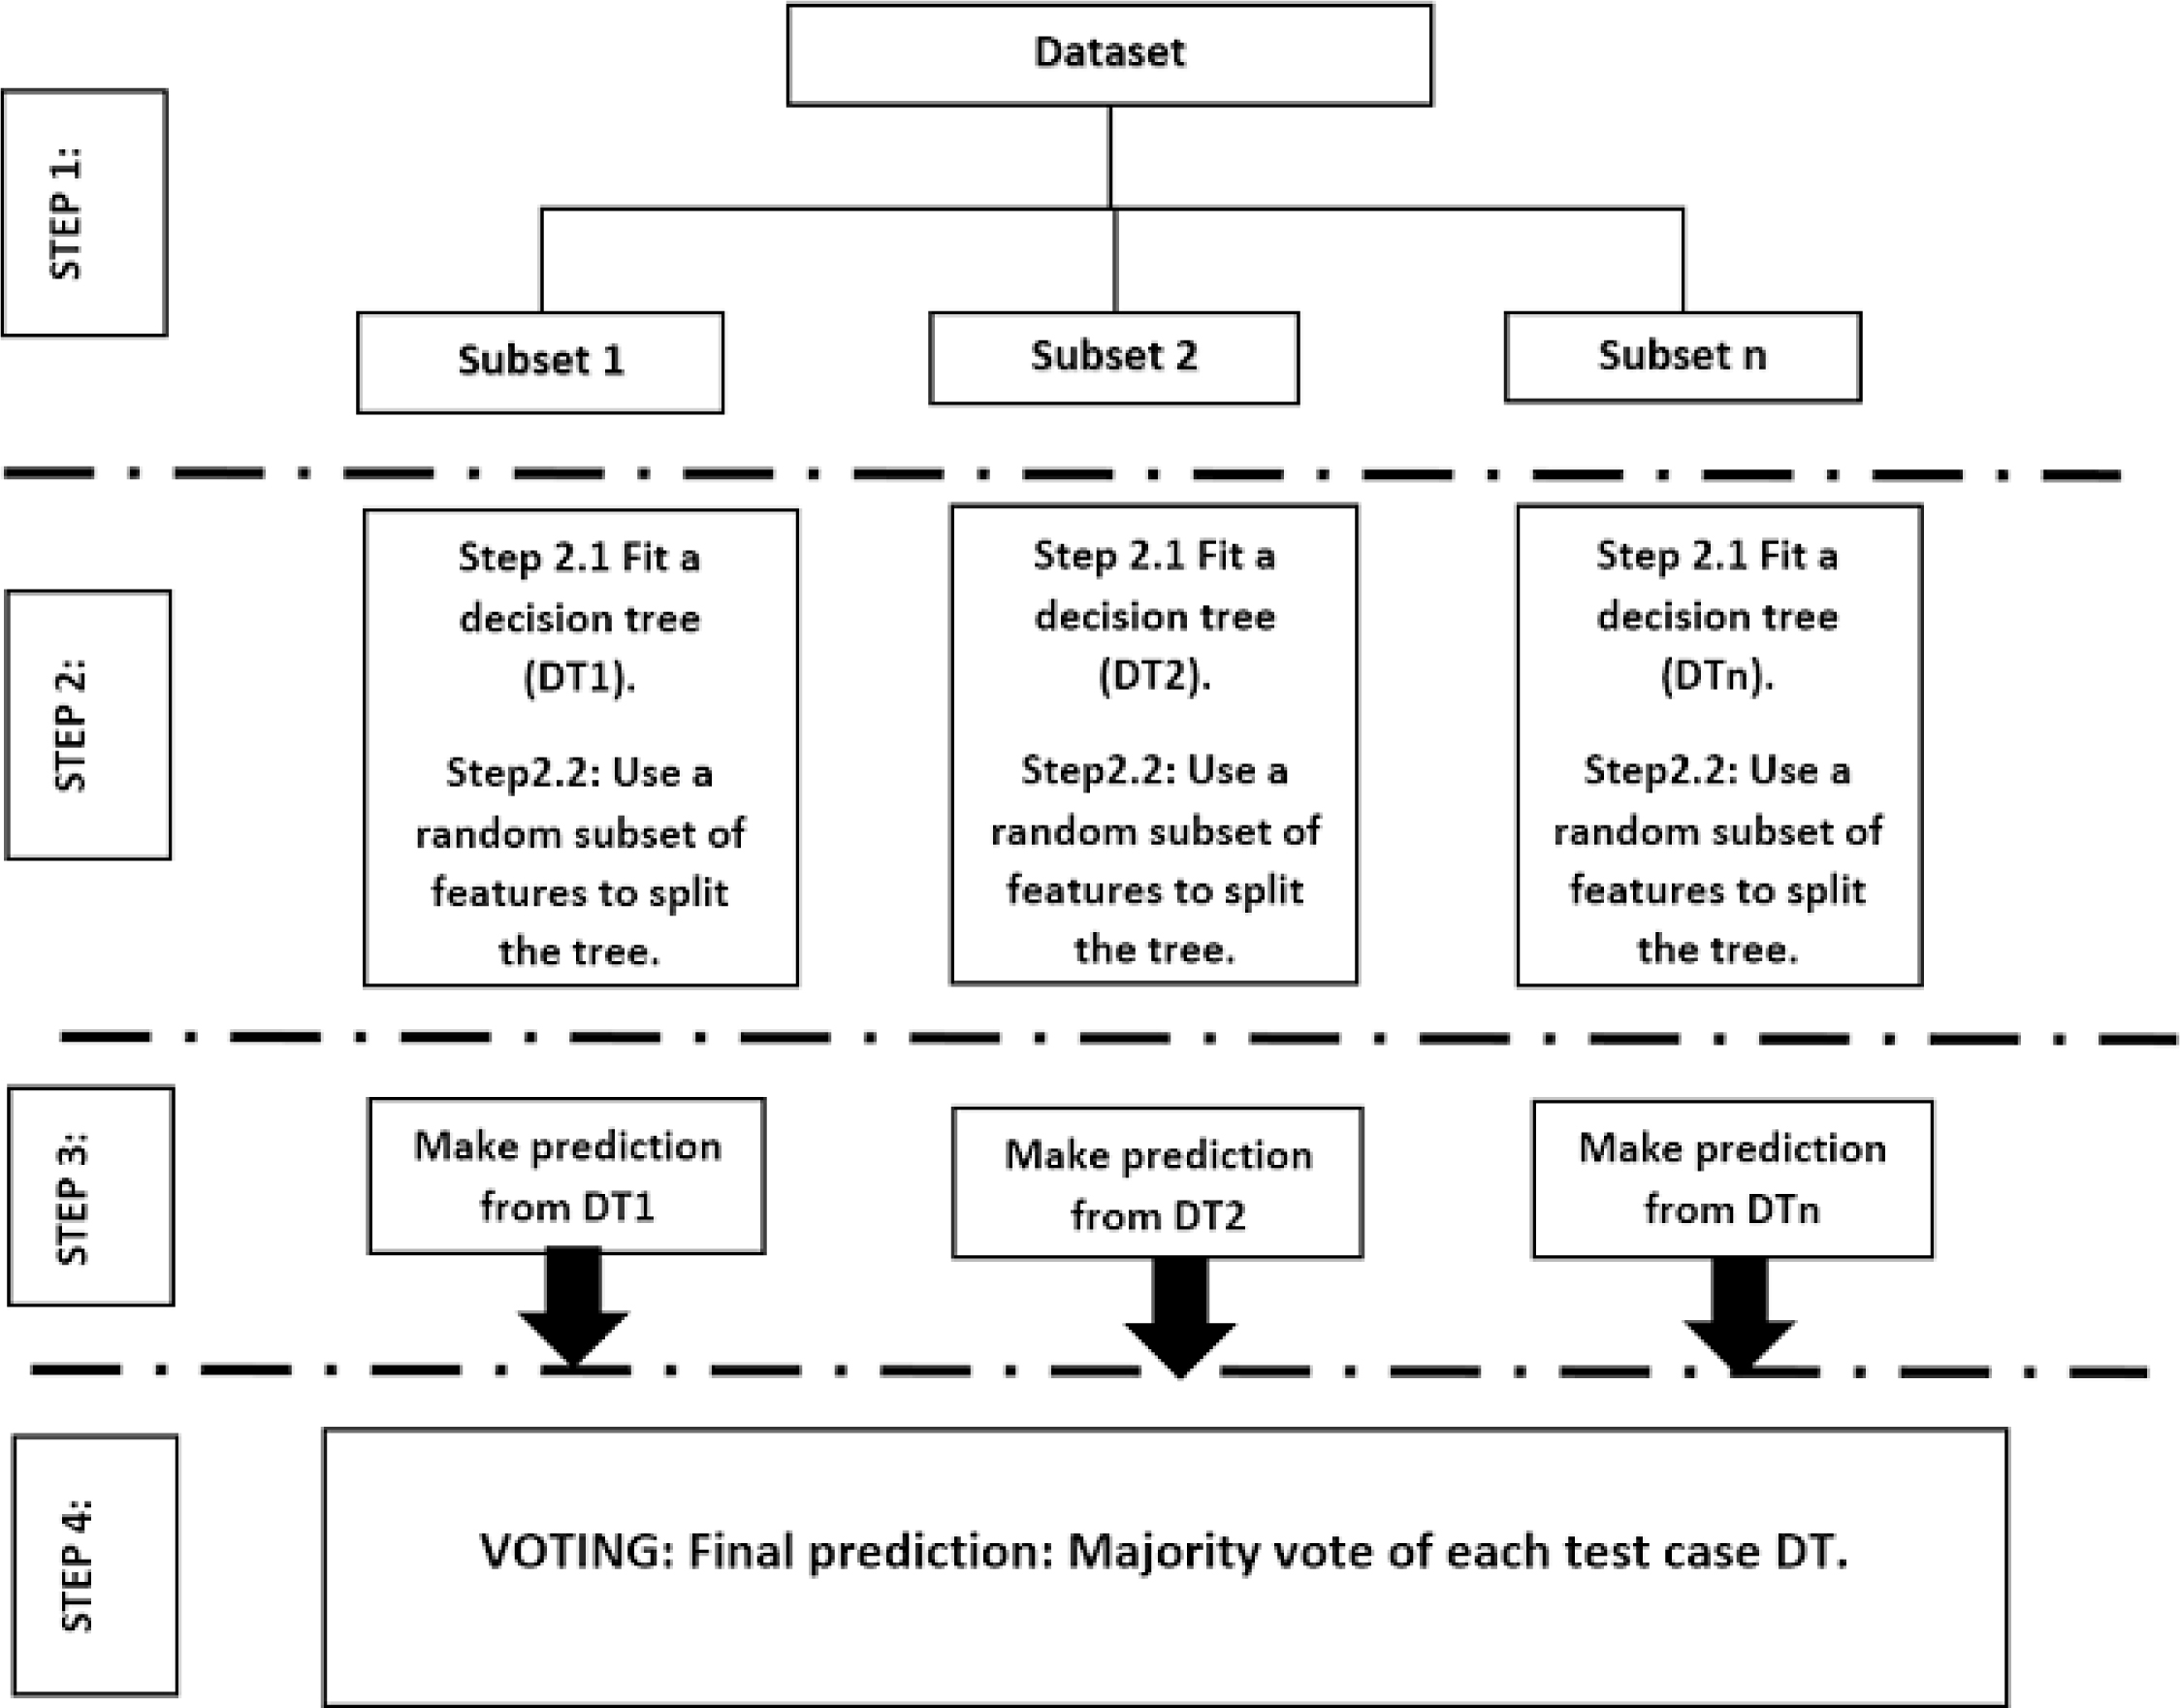
Ensemble learning models make predictions based on aggregated strong predictions from multiple weak models. The aggregation makes ensemble models more flexible thereby reducing bias and less data sensitive, hence less variance.
Decision trees (DTs)
A DT classifier recursively partitions the dataset into smaller subdivisions based on decision rules or thresholds. DT is a non-parametric classifier which does not require distribution of the data to be known prior to the processing to classifier [5]. The classifier has substantial advantage in latent fingerprint classification due to its simplicity and computational flexibility. The tree consists of a root node formed with all data presented, internal nodes, also called splits, and leaf nodes. Each node contains a decision rule of the form
Numerous types of DTs have been developed [27] and used in various application areas in literature [28, 29, 30]. Dts have several advantages over conventional supervised classification procedures. DTs handle non-linear relations between features and classes, allow any missing vales. The structural ease of interpretation makes DTs more appealing to use and are better understandable than its predecessors. The accuracy of decision tress is affected by multiple factors including decision threshold. Also, Dts have been found to be sensitive to bias and variance. DTs show large bias with simple trees and large variance with complex trees.
There are few techniques to perform ensemble decision trees. The most generally used methods are Bagging [31] and Boosting [32].
Bagging: It trains a collection of individual models in a parallel way with random subsets of data fed to each model. Boosting: It trains a collection of individual models in a sequential manner. Each individual model learns from mistakes made by previous model.
Random forest classifier (RDF) is an ensemble model which uses DTs as individual model and bagging as ensemble method. RDF is a set of random trees. Along with random selection of subsets of data-set, RDF randomly selected the subsets of features as well. Feature which provides the best split is used to split the node iteratively. The steps to perform RDF classification are as follows:
Step 1: Select n random subsets from training data set. Step 2: Now train n DTs with these n random subsets. The optimal splits for each DT are based on random subsets of features. Each trained tree predicts the class of test sets by considering majority voted class from all decision trees as final class.
Figure 3 describe the process of RDF classification. Unlike DTs, the averaging of the results of different DTs in RDF helps to overcome the problem of overfitting [33]. Since large DTs tend to have large variance, RDF also have less variance that a complex DT therefore, RDF is mostly used due to its capability of handling high dimensional data effectively. RDF handles missing values and maintains accuracy for missing data. Therefore, no prior preparation of data is required in terms of data standardization. RDF is famous as a classifier in multiple different research areas [34, 35, 36].
Steps to illustrate Adaboost classifier.
Random forests is a complex model. RDF is time-consuming and require more computational resources. Also, with large number of parallel DTs, the relationship between data fed to the DTs is difficult to relate. Unlike RDF, Adaboost uses boosting as ensemble method. Boosting helps reduce misclassification as boosting helps in learning from mistakes of previous model. Hence instead of working with all n DTs, now any
Initialize the weight of data points averaged over total data-points such that weight of each point is 1/total. Train a decision tree. Weight error is calculated by counting number of wrong prediction/total predictions. Also, higher the weight of wrong prediction, the more the corresponding error is weighted during calculation of weight error. Calculate decision tree’s weight (
Since the error is based on misclassification, therefore, higher the weight error rate of the tree, less weight is given to prediction of the corresponding DT during the final voting and vice versa. Weight update of wrongly classified points: The weight of each point is calculated as follows: correctly classified point Repeat Step 2 such that set number of DTs is a reached. Make final prediction.
New prediction is made by adding weight of each DT at final level multiply the prediction of each tree (Weighted sum). Hence, the tree with higher weight provides more prejudice to influence the final decision.
Adaboost is susceptible to lesser overfitting. It is used in major application areas due to its continuous learning ability and sequential handling of complex DTs [37]. Table 1 compares the properties of above mentioned classifiers in terms of data-set and feature handling.
Comparison of DT, RDF and Adaboost classifiers
Set of images from IIIT-D latent_mated_1000ppi fingerprint database demonstrating ridge pattern from non-ridge background.
Set of images from IIIT-D latent_mated_500ppi fingerprint database demonstrating ridge pattern from non-ridge background.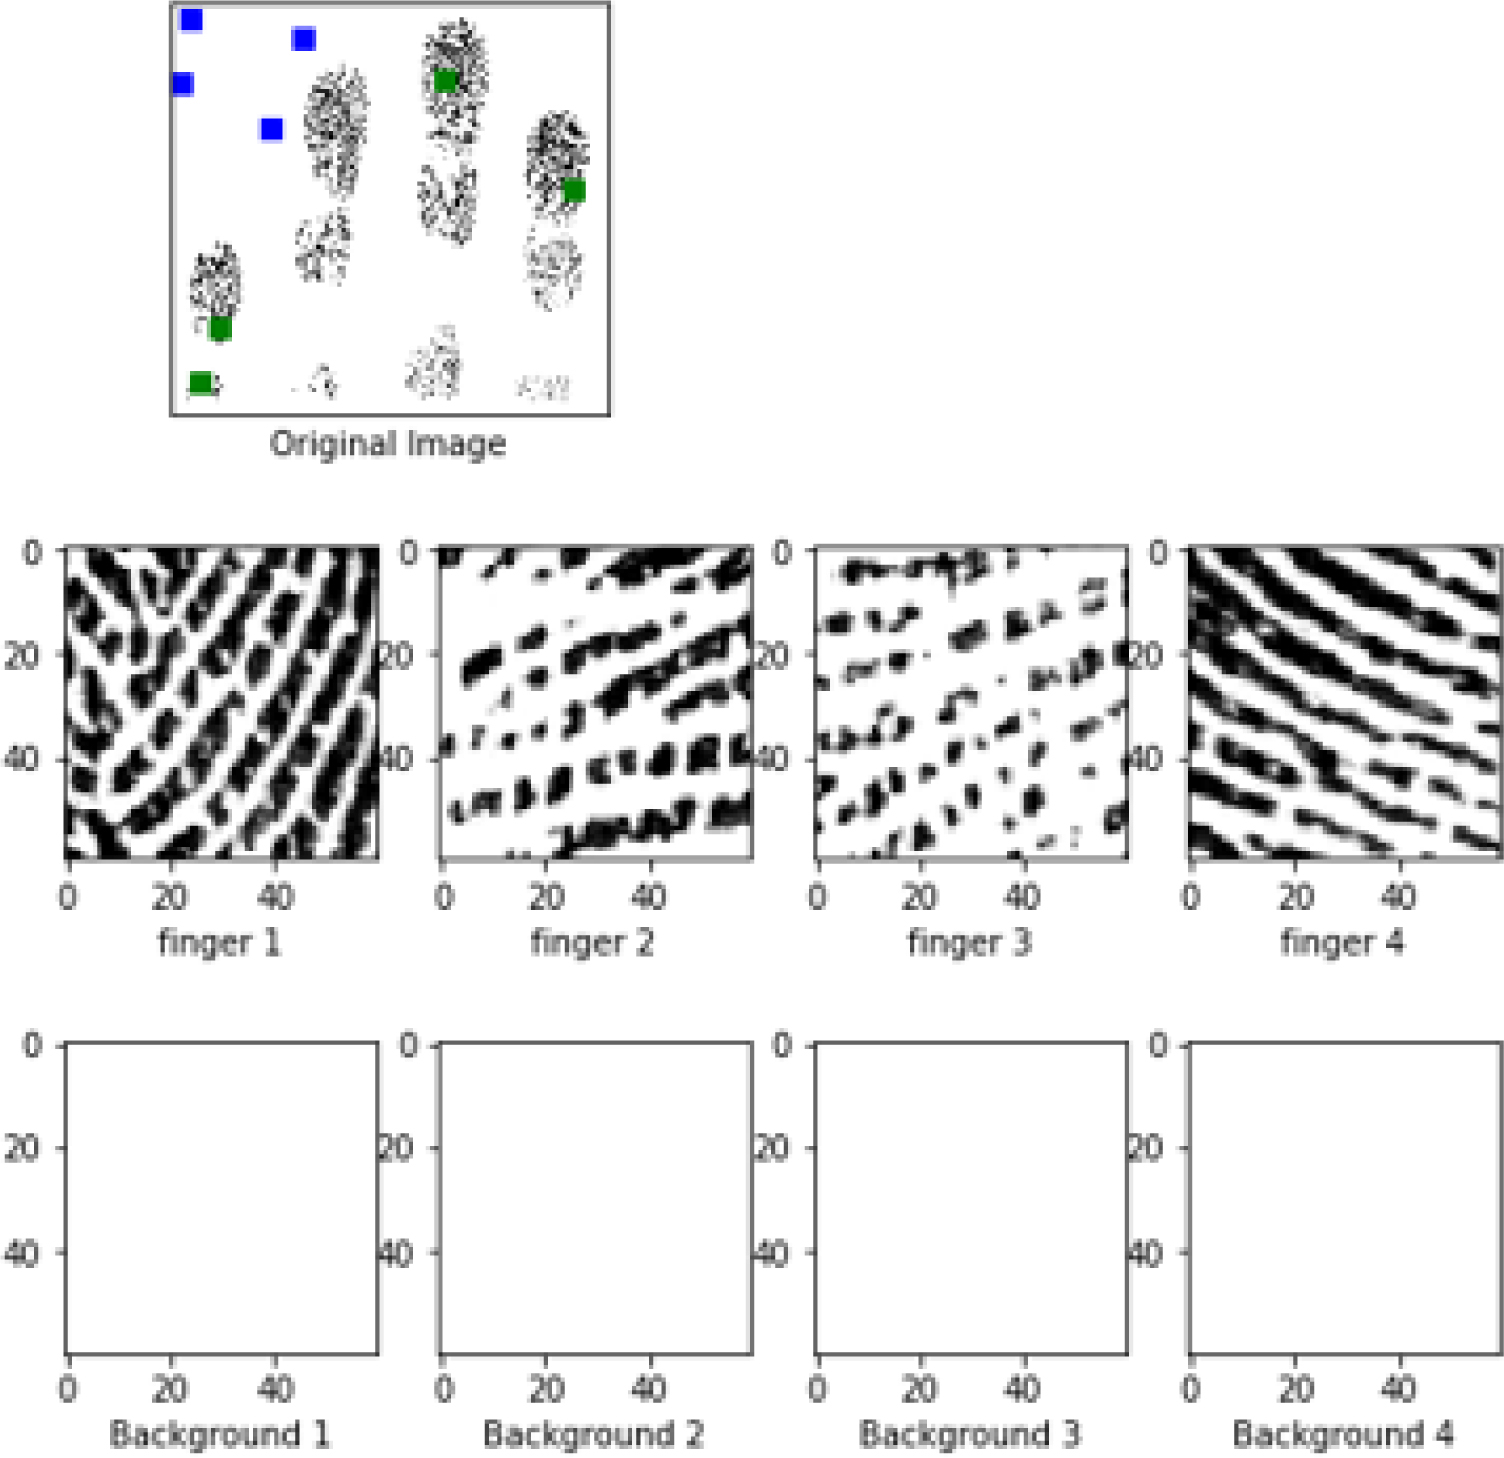
Set of images from IIIT-D combined latent fingerprint database demonstrating ridge pattern from non-ridge background.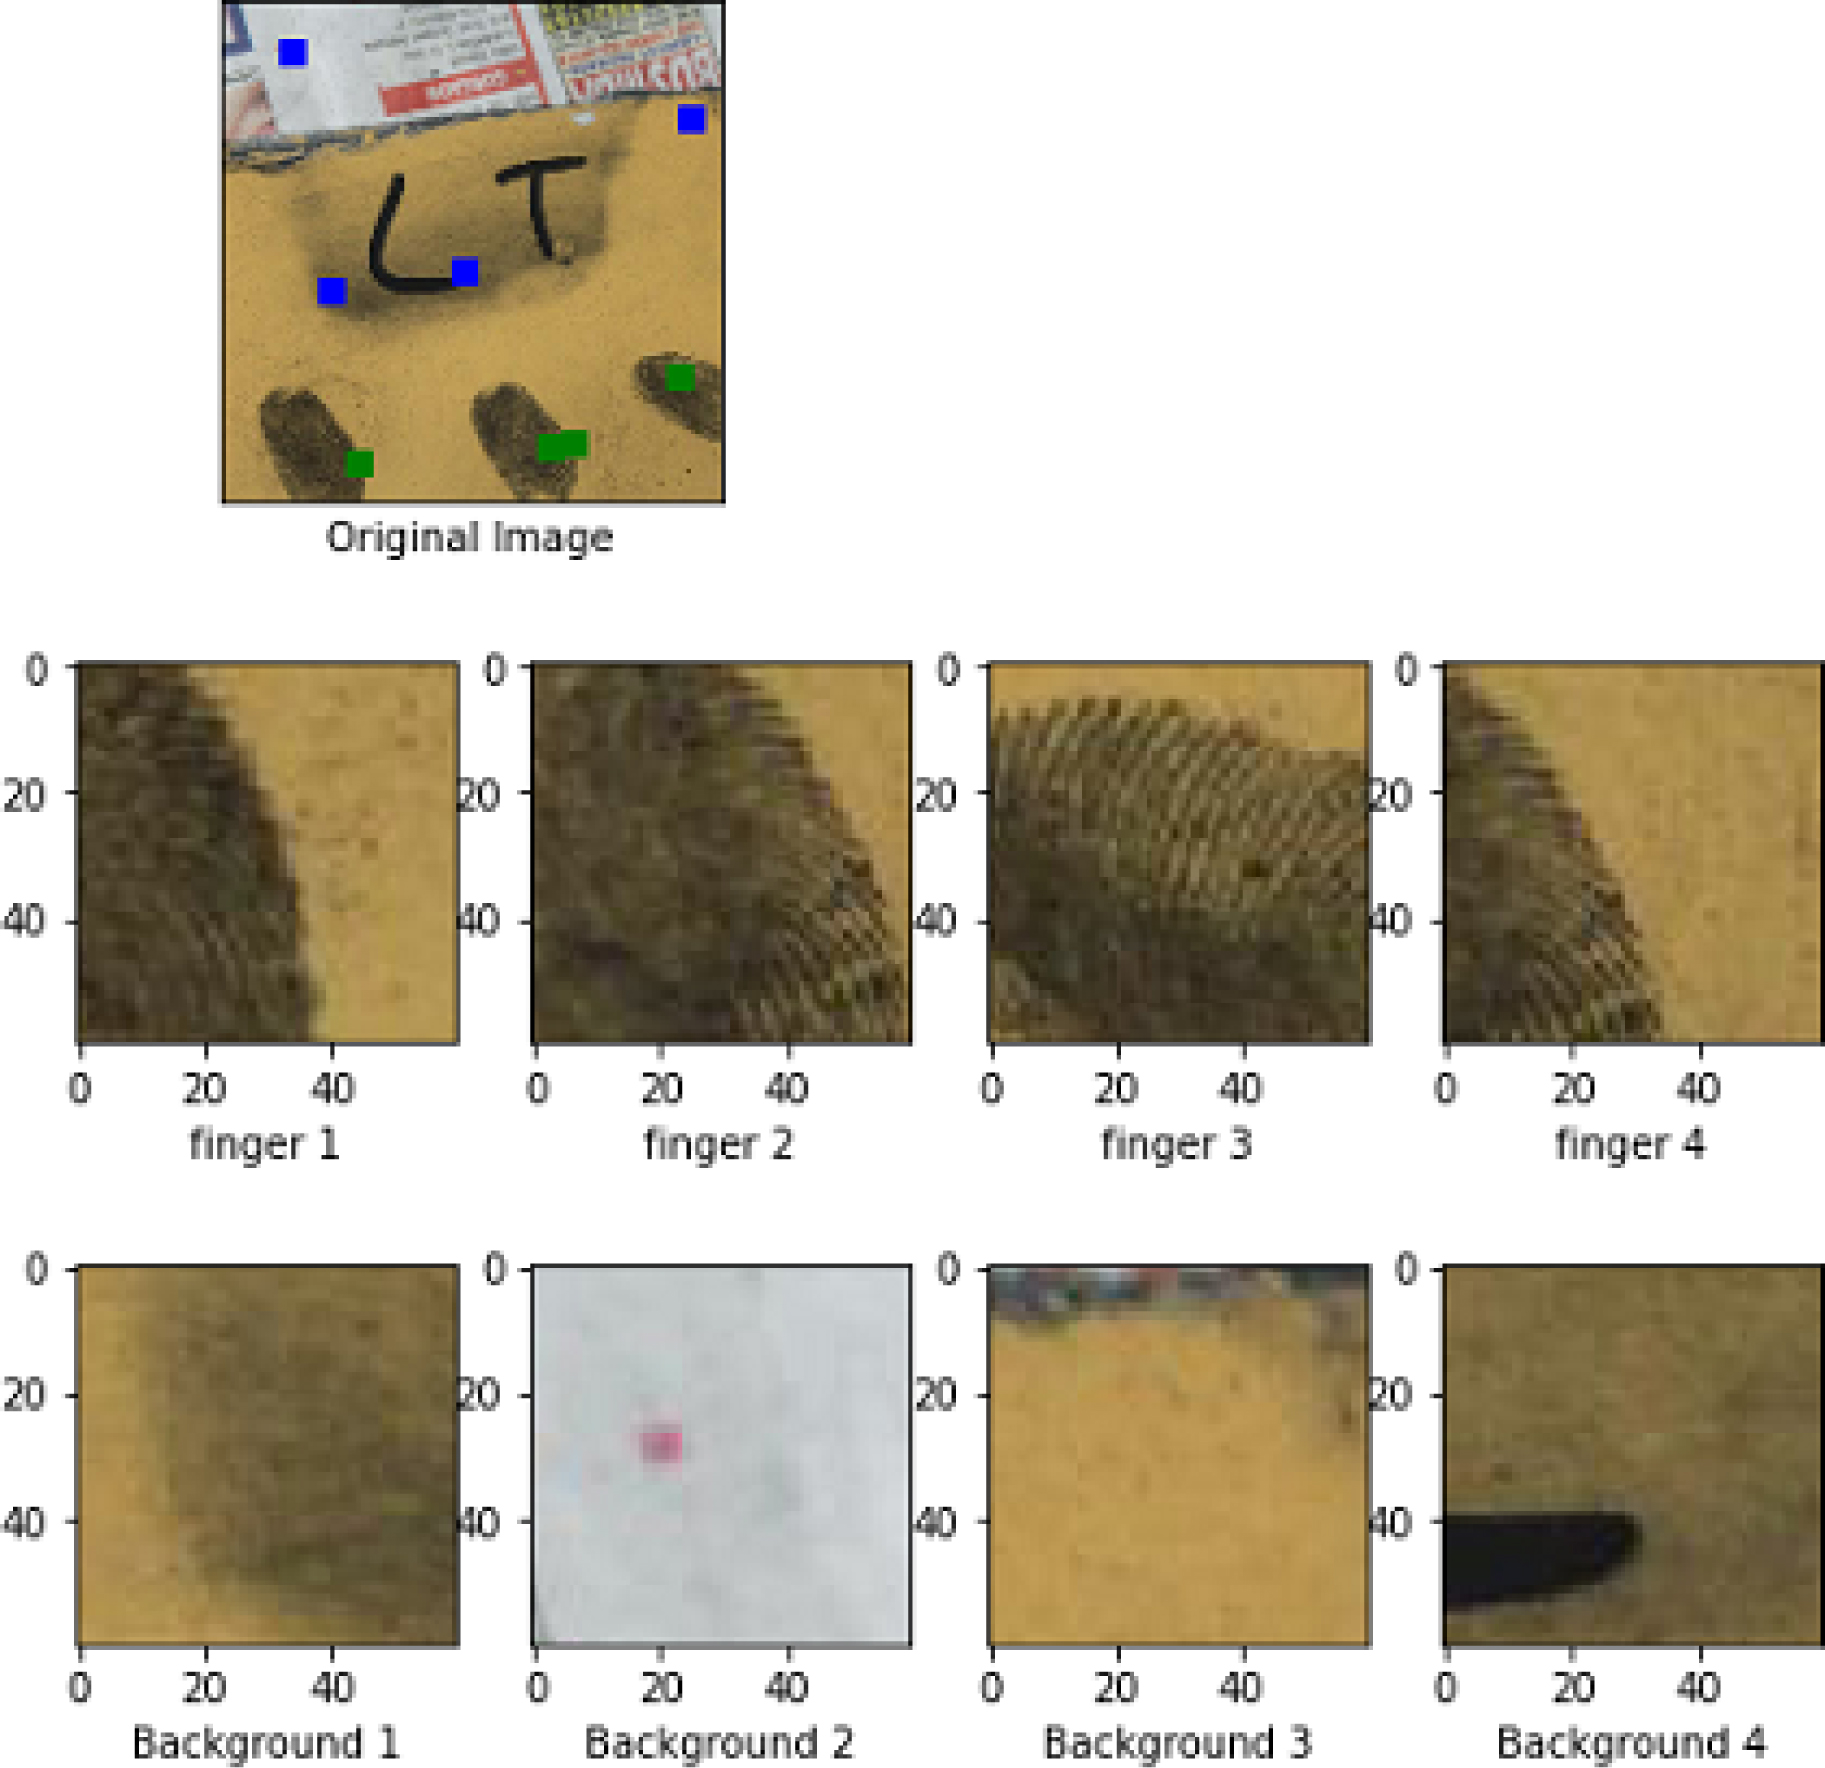
Proposed methodology for binary classification of latent fingerprint images.
Due to unclear ridge valley patterns and background distinction, the segmentation of latent fingerprints from background is difficult. Therefore, not single but substantial set of features is required to extracted from LFI. The features are representation of source and higher the complexity of the source, lower is the correlation factor of features. Hence, the classifier needed be chosen accordingly. Since the intra-class variance of the classes is high due to small sample size, hence ensemble based classifiers are expected to perform better than traditional classifiers. As shown in Fig. 8, The proposed work is divided into following steps:
Feature extraction and optimal set selection
Each LFI is divided into local blocks of size, say
Saliencymap and threshcount: This feature provides score of a pixel which is prominent in the neighbourhood. The intensity value of the pixel is detected in log spectrum of the image. Saliency residuals are computed and mapped back to salient locations in corresponding spacial domain. Consequently, binary map using threshold selection is used to calculate thresh count which is used to extract salient regions from image. Image/local block mean and variance: This feature computes the intensity mean and variance of local block. The mean difference between local block and image average intensity tends to be low for ridge structure and high for background structure. Ridge cluster and orientation: Ridge cluster directs towards cluster of ridge pixels using image mean and variance. This features helps in finding ridge structures with noisy background. Ridge orientation is output of Gaussian smoothing over the local block via Gaussian kernel. Orientation is clearly visible in ridge structure rather than unstructured background. Color map: With the help of threshold and luminance adjustment, color based mask is applied on image to cluster color based regions. Dominant color can be accurately found if there is adjusted color information applied on a good to average quality of image. This feature helps in reducing MDR. Image texture: Inverse Difference Moment (IDM) is extracted as a image texture feature. IDM is the measure of local homogeneity. Lesser the homogeneity, more ridge field presence is detected. Image Energy: Energy provides information about presence of organised structure within the image. The lower the energy, disturbed is the local block, thereby identified as ridge pattern.
The model’s weak learning is mostly due to variance, noise, and bias. By using ensemble methods, the stability of final model can be increased. By stacking models, the predictive probability of the classifier is improved. In order to avoid random errors from single classifier, the combined models are generated. The sequential integration of classifiers started with taking input as extracted features in a base classifier and the predicted output of the base classifier as input to next classifier(s) forms the cascade/stack of classifiers. The output of the final classifier is considered as final prediction. In this paper, The results of best combination of cascaded classifiers are compared with single classifier predictions.
AllVsPipeline features
The main principle behind ensemble modelling is to strengthen the single weak learner. Pipeline of features is created based on maximal independent set of features. Each set is added with a feature with higher correlation factor among each other, negative or positive such that no feature in a set must have lower correlation with other features. Each pipeline is tested with individual classifiers and best pipeline is utilized for cascade classifier.
Performance evaluation
After feature extraction, selection and implementing proposed set of model(s), the results predicted in the form of label or a class is evaluated to achieve stability of the chosen model. The metric that is used to evaluate machine learning model influences how the performance is measured and compared. The performance of algorithm is evaluated on IIIT-D database. The performance of the output is measured using MDR, FDR, Accuracy.
Experimentation
The proposed work is implemented in Python 3.6.8. The database used is published by Indraprastha Institute of Information Technology, Delhi (IIIT-D). There are 150 latent fingerprints from 15 subjects and 1052 exemplar fingerprints. There are some images at 500 ppi and others at 1000ppi.
Performance metrics (in %) of proposed segmentation method for IIIT-D combined latent fingerprint database
Performance metrics (in %) of proposed segmentation method for IIIT-D combined latent fingerprint database
The images are divided into three categories a) Good b) Bad c) Ugly. The good images provide clear discretion between background and foreground data with no to least amount of noise obstructing the detection of ridge pattern in foreground from non-ridge pattern in the background. The bad images are the images with substantial data in foreground just as good images but unlike the good images, the bad images have noisy background which makes the detection, consequentially, the classification a difficult task. The ugly image category is the one where the ratio of foreground to background ration is significantly low. The lower value of the ratio makes it difficult to produce any significant feature value out of image. Due to unavailability of significant data from such blocks, these blocks are considered as background data.
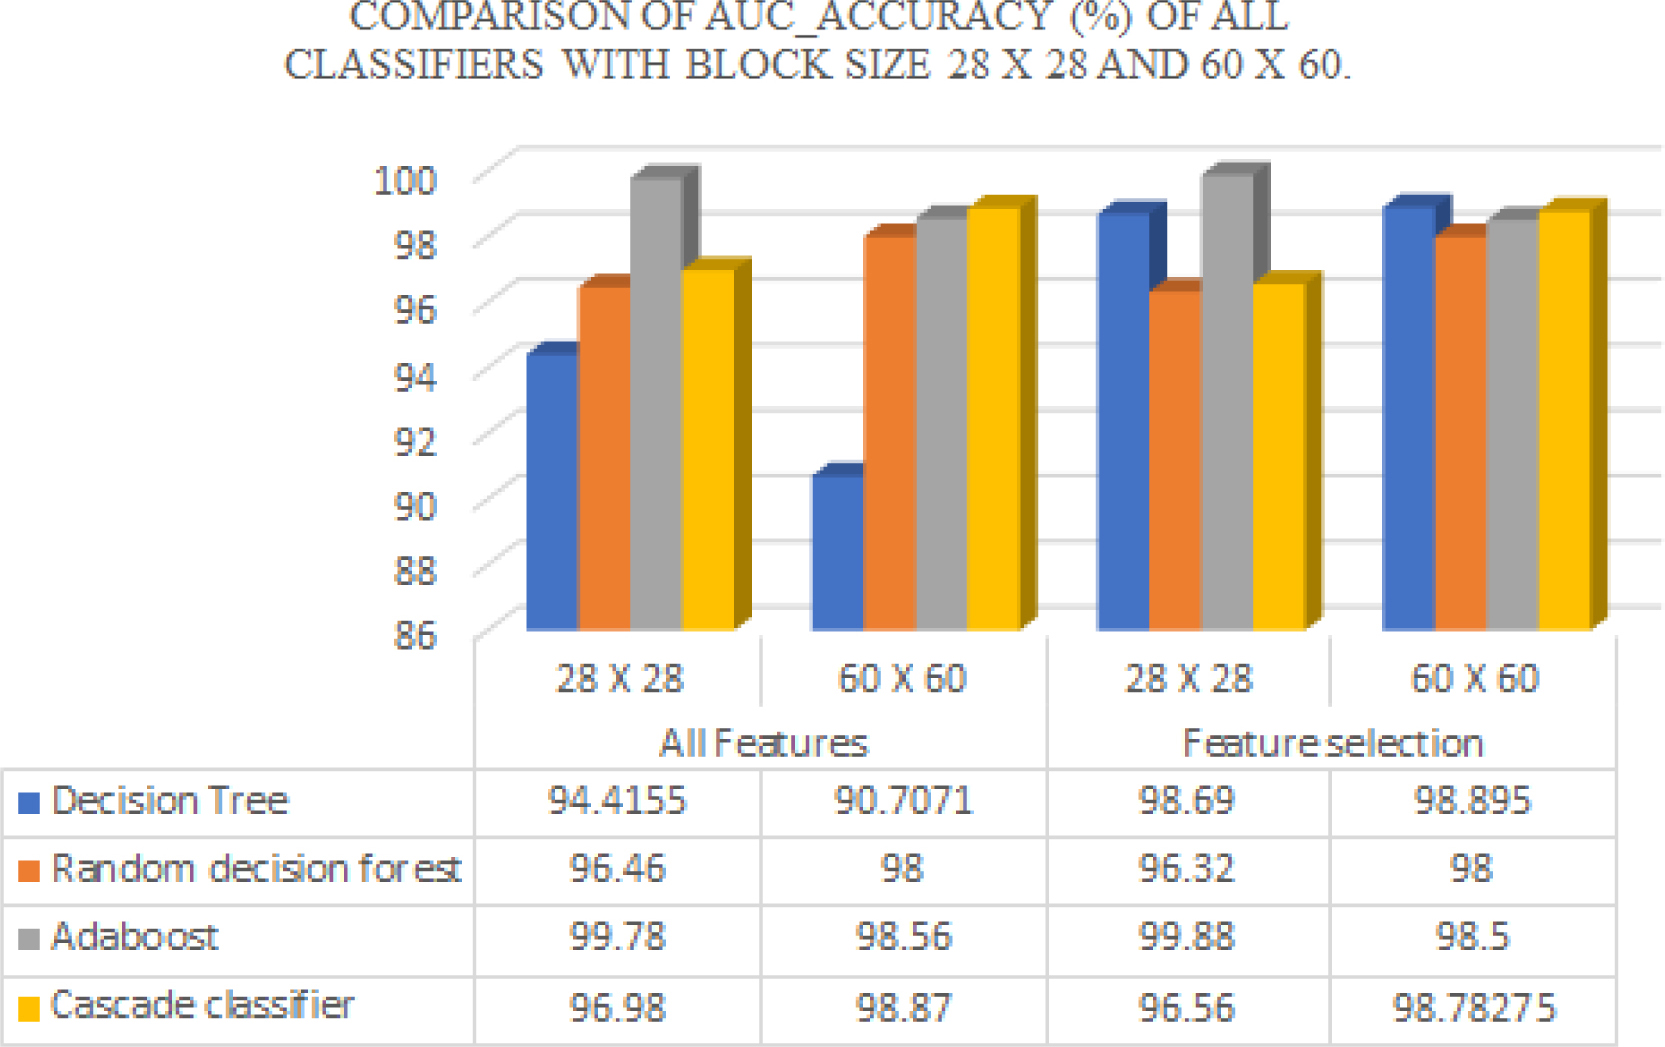
Graphical comparison of accuracy (%) of classifiers with all features with block size 28 
Preparing data
The performance of the proposed method is evaluated on IIIT_D combined latent fingerprint database. Each image is resized to size 512
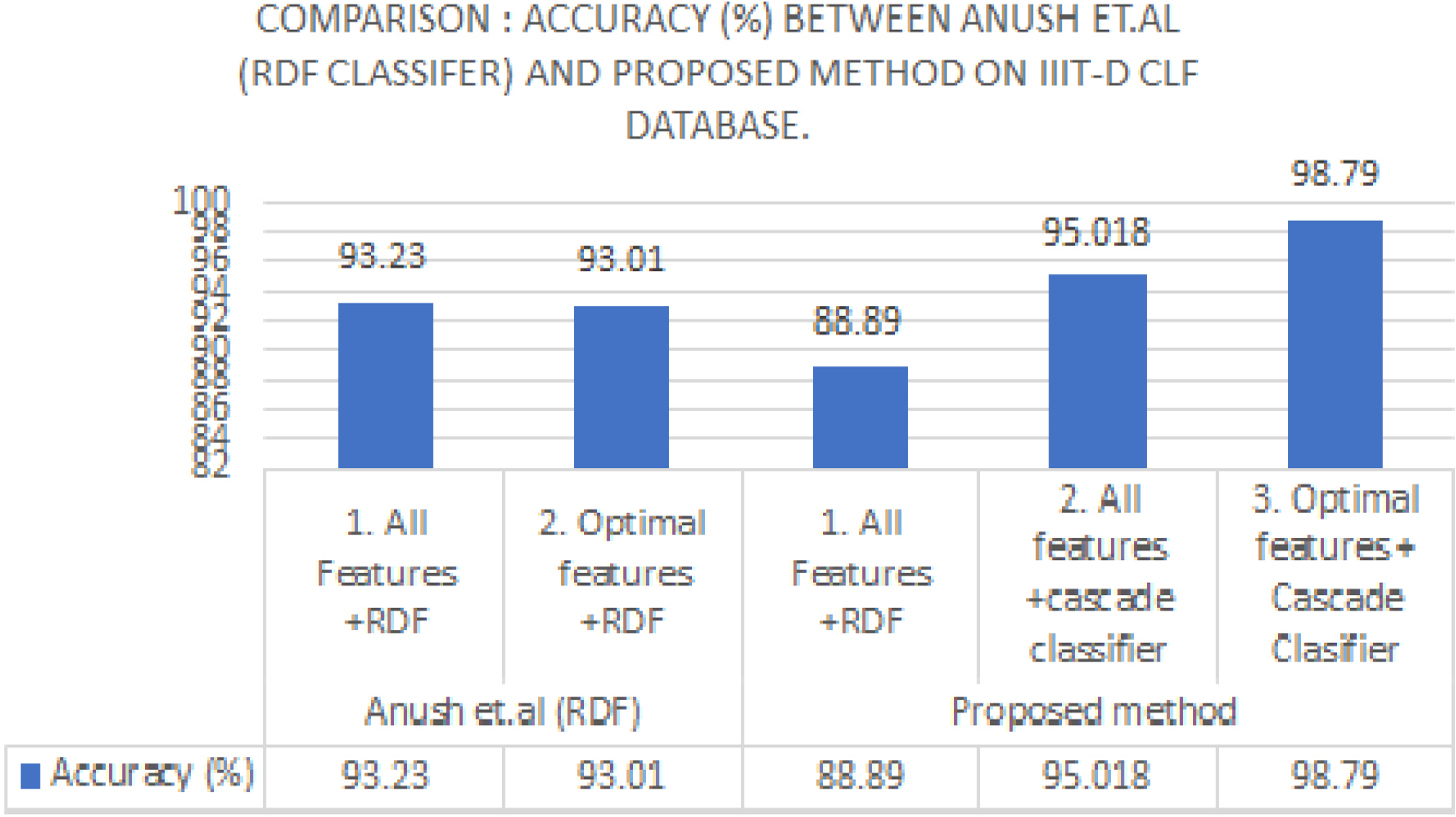
Comparison: Accuracy (%) between Anush et al. (RDF Classifier) and proposed method on IIIT-D CLF database
Comparison: Accuracy (%) between Anush et al. (RDF Classifier) and proposed method on IIIT-D CLF database
The data is trained on various individual classifiers such as DT, RDF and Adaboost. The test data is used to predict probabilities of label of the local block based on these trained classifiers. The results are generated with classifiers trained on various feature sets. Following are the categories in which features are provided to classifiers:
Using all features: All the handcrafted features are calculated to form feature vector and corresponding image features are fed to all classifiers(individual and cascade) for classification. Feature reduction [4] using maximal Independence of features: Best set of features combined for each classifier is fed to each individual classifier for predicting class label.
Along with individual classifier predictions, in order to reduce variance in results and to improve the weaker classifier, the cascade of classifiers is constructed. This cascade is stacked with base classifier as logistic regression. The first classifier in the stack is decision trees, followed by RDF and last layer of classifiers is Adaboost. The final prediction on test data is after the third layer of the stack of classifiers. Any combination of the mentioned three classifiers can be used. We used the combination with best outcome. Table 2 shows the performance of all above mentioned classifier with all features as well as after feature reduction using independent maximal set of features. Major points from analysis of results:
The IIIT_D combined latent fingerprint image database is classified using all features and optimal set of features for individual classifiers as well as cascade of classifiers. The results are obtained on data obtained by dividing images into local blocks of size 28 Table 2 describes performance metrics (in %) of proposed segmentation method for IIIT-D combined latent fingerprint database. The proposed method shows improvement in accuracy with all features fed to classifiers. With In addition to it, Using optimal set of features with maximum dependency, each classifier takes best combination of features from feature vector. Only DTs show improvement in the accuracy when fed with suitably chosen features where as there is no substantial improvement noticed in terms of accuracy or AUC_Accuracy of all other classifiers in experiments. It shows that optimally chosen subset of features out of used features in the proposed work do not improve the performance in terms of accuracy. The improvement can be expected if different and more features are explored. With poor quality images, MDR and FDR tend to be high. As shown in Table 2, RDF shows improvement in terms of MDR and FDR when optimal set of features are fed to the classifier in comparison to all features. Whereas, DT classifier is highly affected by noise in the images, thereby producing high MDR and FDR when all features are used. On the contrary, MDR and FDR is recorded low with optimal set of features in Adaboost and followed by cascade classifier. There is a trade-off between MDR and FDR values with Accuracy in both mentioned classifiers.
Graphical comparison of AUC_accuracy (%) of classifiers with all features with block size 28
Graphical comparison of accuracy (%) between Anush et al. [23] and proposed method on IIIT-D CLF database. Figure 9 shows comparison of accuracy of classification between individual classifiers and cascade classifier. From the No free lunch theorem, same set of features may not result best performance across all databases. Also, different classifiers may yield best out put based on different feature sets. It is apparent that Adaboost produce best results with fluctuations over MDR and FDR, Where as cascade classifier, shows stable results across all categories of Accuracy, MDR FDR and AUC_Accuracy with all or optimal set of features fed to it. Figure 10 shows the comparison of AUC_Accuracy (in%) of all classifiers. Table 3 shows the performance metrics (in %) comparison of proposed and existing supervised technique based segmentation algorithm on IIIT-D combined latent fingerprint database. IIIT-D database is first used by [23]. Later, [24] and [25] have experimented on it with deep networks. Since we are using supervised technique, there comparing results with deep networks is not fair. RDF is common classifier used in both, [23] and proposed work. Hence, resultant accuracy is compared and proposed work shows improvement in the results when cascase classifier is used over only the use of RDF. Figure 11 is the visual representation of comparison of accuracy (%) of RDF and Cascade classifier between Anush et al. [23] and proposed method on IIIT-D CLF database. The comparison of performance metrics on the bases of local block size shows that there is improvement in terms of performance when block size 28
Latent fingerprint segmentation is a significant step is fingerprint recognition. classification based segmentation helps in learning better areas of foreground regions than background regions of the image. In this present work, we propose a segmentation algorithm that extracts features from local blocks of LFIs. All features and optimal set of features formed on the basis of high dependency, are used to learn the foreground and background regions of the image with the help of classifiers such as random decision forest, decision trees, Adaboost and cascade of these classifiers. The performance is evaluated and accuracy of cascades classifiers yields stable and efficient performance.