
Abstract
Precision Medicine has emerged as a preventive, diagnostic and treatment tool to approach human diseases in a personalized manner. Since precision medicine incorporates omics data and knowledge in personal health records, people who live in industrially polluted areas have an advantage in the medicinal field. Integration of non-omics data and related biological knowledge in term omics data is a reality. The heterogenic characteristics of non-omics data and high dimensional omics data makes the integration challengeable. Hard data analytics problems create better opportunities in analytics. This review cut across the boundaries of machine learning models for the eventual development of a successful precision medicine forecast model, different strategies for the integration of non-omics data and omics data, limitations and challenges in data integration, and future directions for the precision medicine forecasts. The literature also discusses non-omics data, diseases associated with air pollutants, and omics data. This information gives insight to the integrated data analytics and their application in future project implications. It intends to motivate researchers and precision medicine forecast model developers in a global integrative analytical approach.
Keywords
Introduction
The aim of this review is to take up the scope and aspects of the research area in data analytics for integrated data and to evaluate the problems to construct, evaluate, and to utilize the machine learning models in precision medicine. Most of the time, the machine learning evolution happens with the uniqueness of the dataset, not the algorithms. For example, Google came up with Chinese to English translation using an old algorithm but data collected in 2015. This is an excellent example to show that the data is critical.
Precision medicine embraces all steps of new therapies, disease processes, and disease prevention. According to the sociodemographic and environmental background of individuals, there would be a difference in treatment plans, medical interventions, medication, hospital care, specialized care, and healthcare services. A large number of clinical trials in individuals for the detection of diseases can overwhelm healthcare professionals and can lead to treatment delays. The accurate characterization of individuals at high risk of developing precise diseases from those at low risk can benefit this problem. Epidemiological studies in an industrially polluted region will provide important clues about the most common non-communicable diseases in and around that area. Choices in epidemiological study have become delicate because of the ample knowledge development in medicine, and computational methods. What we need is wisdom. Choosing Wisely [1] is a global perspective in the medicinal field today. The goal of this initiative is to discuss the need for medicinal interventions attributable to the patients. It promotes a good rapport between the healthcare professionals and patients. This approach discusses the medicinal care supported by evidence and non-duplication of tests that have already been received. This is obviously a part of personalised medicine.
There are two types of modelling inculcated in environmental air pollution exposure and health fallouts. First one establishes a casual link amidst environmental air pollution and health effects [2, 3]. The other emphasizes the association amidst environmental air pollution and health issues [4, 5]. In the former case, it is unethical to anatomize human exposure to possible environmental air pollutants. The latter one relies on predictive modelling using empirical methods such as the machine learning techniques, and ensemble learning. In the casual link or fuzzy method, a casual inference or approximation of the parameters has been made through certain linguistic terms such as very high, high, low, very low, etc. [6, 7]. In this method, the final interpretation will be done through mapping of the identified parameters. In the empirical method, algorithmic identification of the parameters associated with an outcome of interests allow researchers for independent validation and interpretation of the results for subsequent studies [8, 9]. Usually ensemble models that combine outputs from several pretrained models outperform while comparing with individual models [10, 11]. Hybrid models using deep structured networks also perform well in large heterogeneous datasets [12, 13].
The genetic scope to environmental interactions leads to the evidence in the existence of a confounder in the machine learning model. That is, disease and gene-environment must be an extraneous factor for the disease. It may not be the actual cause of the disease, but can be a surrogate factor for the disease. Precision medicine is an integrated approach that incorporates predictive, preventive, personalized, and patient satisfaction. This study foresees the applicability of advanced machine learning techniques in precision medicine forecasts for individuals in the industrially polluted region by integrating non-omics data such as sociodemographic characters, environment data, and clinical data into omics data. Figure 1 shows the strategy for a precision medicine forecast model.
The strategy for a precision medicine forecast.
The different types of non-omics data in epidemiological approach, and associations amidst pollution exposures and its health outcomes are discussed in Section 2. Section 3 discusses different types of omics technologies, and omics factors for chronic diseases. Section 4 focuses on the strategies for data integration and mathematical background for the machine learning algorithms for integration. Section 5 goes through the machine learning models for precision medicine forecast. Section 6 discusses the results of integration strategies and Section 7 implicates the limitations and challenges of non-omics data, omics data, integration strategies, and the precision medicine forecast models. Finally, we conclude with future directions in Section 8, and the conclusion in Section 9.
In this part, we discuss the different types of non-omics data in epidemiological approaches for precision medicine forecast in the industrially polluted region. It consists of epidemiological data, environmental data, and clinical data. Epidemiological data is susceptible to survey or interview mode, and standardization of questions, which also affect data quality and comparability. It includes: sociodemographic characters, health problems, the family history of diseases, air pollution exposure, the proportion of time exposed, etc. Environmental data comprises of air pollutants, industrial emissions, air quality, etc. Clinical data includes health records and insurance records. Clinical parameters may have the problem of complexity in their medical terms. For instance, the results of cancer diagnosis are from pathological descriptions and medical image reports. Figure 2 shows the outline of non-omics data. There exists a demand for the integration of non-omics data due to the heterogeneity of the data. As our aim is to focus on an integrated empirical model, there is no need to make prior assumptions on the data, its functional form, or probability distributions.
Overview of non-omics data.
Residents sustenance in close proximity to an industrially polluted area are prone to several types of diseases. The World Health Organization (WHO) termed air pollution as a silent executioner since its impacts are often unnoticed or not measured. Countless research found that detrimental health effects of long-term air pollution exposure are subject to the levels of national air quality standards. Environmental factors are always directly proportional to the health issues of individuals. According to the objectives of the analysis, epidemiological approaches can be grouped into three categories, namely:
Health profile of communities and association with local environmental risk factors. Associations amidst pollution exposures and health outcomes. Surveillance risk prediction.
Summary of air pollution and identified health impacts
Since our study needs associations amidst air pollution exposures and health outcomes, we have done an unbound search and come up with twenty-five articles with identified health impacts. A study done in China found that there was an upsurge in medicinal utilization for allergic rhinitis with a rise in PM
Omics data
Omics refers to the composite technologies used to scrutinize the roles, relationships, and actions of molecules such as genes, proteins, and small metabolites that make up the cell of an organism. These technologies [39] append by the suffix “omics” include:
Genomics: Study of genes and their functions. Epigenomics: Structure that persistently alter gene expressions without truly existing changes in the gene/DNA sequence. Proteomics: Subject of proteins. Metabolomics: Subject of molecules muddled in cellular metabolism,
High dimensional biotechnological platforms generate different types of omics data that have a huge number of raw parameters. In the current development of biotechnology, there occurs a new field known as radiomics which generates high dimensional image data. Sometimes omics data itself needs to be integrated since there are same types of omics data in distinctive studies [40], and distinctive types of omics data (multi-omics) for the same study [41]. A collective analysis of multiple datasets with distinctive study samples and overlapping omics features established on homogeneous and heterogeneous assumptions is an example of integrating the same types of omics data [40]. Many studies with cancer benchmark data has been observed multi-omics data integration [41]. ‘Omics only’ based algorithms cannot explain the traits in public health or give high predictive accuracy in epidemiological studies for precision medicine. Social and environmental parameters also should be considered. Therefore, it is necessary to integrate it with non-omics data such as epidemiological, environmental, and clinical data.
Gene-environment interaction influences most of the chronic diseases. Versions of genes are known as gene variants. These variants are different locations of DNA sequences that constitute individual genes. The combination of all the variants in the genome is known as genotypes. The physical expression of genotype is known as phenotype. Figure 3 shows the outline of omics technologies. When health fallout alters by genotype, and lacks one or more environmental stimuli, the health issue is said to be a consequence from a gene-environment reaction. Chronic ailments such as cancer, diabetes, and Parkinson’s disease are admitted to a consequence from interactions amidst environmental exposures and gene variants.
Summary of gene-environment interactions and diseases
Omics technologies.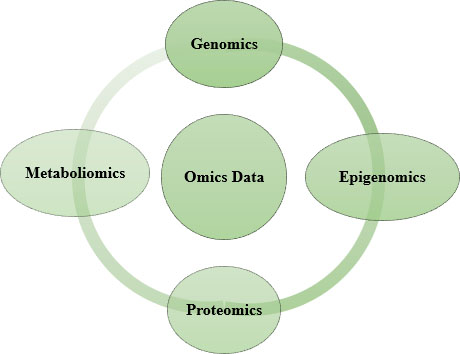
Diseases that draw in gene-environment interactions are developed from the input of genetics and environment [42]. Some of the gene environment interactions and concerned diseases are discussed here. The PON1 gene code metabolizes organophosphates [43]. Individuals that possess an inadequate variant of PON1, when disclosed to organophosphates, have an augmented risk to enroot Parkinson’s disease [44]. The glutathione (GST) gene and the epoxide hydrolase (EPHX1) gene have variants associated with an elevated risk of developing asthma from oxidative stress [45]. Oxidative stress includes O
Strategies for integration of non-omics and omics data
The arrival of omics data and technological advancements led to the evolution of unique tools for the integration of variant data types. The multidisciplinary field of precision medicine that incorporates non-omics and omics data urges an increase in the accuracy of the model, while integrating the data. This needs an additional layer of complexity in the integration strategy. Only a few presented researches accomplished real omics and non-omics data integration. Most of the studies consider only one type of omics for analysis. Few studies incorporated more than two types of omics data integration. Based on the challenges come across by the heterogeneous characteristics of non-omics data, variants in omics data, a volume of omics and non-omics data, and the association between non-omics and omics data, the integrative strategies are classified as three types. They are:
Autonomous integration strategy. Decision based integration strategy. Collective integration strategy.
All require either variable selection, dimensionality reduction, or regularization because of a high dimensional nature of the data.
In this integration strategy, self-reliant models for non-omics and omics data were built separately and then the learnt variables will be combined in the final model. In the first part, the non-omics data is modelled, which is based on the non-omics variables, entrenched risk, or factors analysed in past efforts. In parallel, omics data are modelled accordingly with omics variables. Both the models come across either variable selection or dimensionality reduction. In the second part, the learnt variables from both non-omics and omics models are combined to build the required model. The accuracy or error rate of the built final model is distinguished with the non-omics data model. Figure 4 shows the model for autonomous integration strategy.
Autonomous integration strategy.
Performance of bayesion model (Autonomous).
A probabilistic model by integrating clinical and microarray data has used the concept of the Markov blanket to perform the feature selection to predict the prognosis of breast cancer [49]. They have used van’t Veer data [50] which is publicly available, that is online or ITTACA [51] data. The performance measure, AUC of this best Bayesian network model with autonomous integration strategy is 0.845. A comparison for the average AUC performance for 100 iterations of non-omics, omics, and an integrated model is shown in Fig. 5. A comprehensive integration with a kernel fusion Cox model to predict the survival time of cancer patients has been done in a study [52]. They used multi-omics data such as gene expression data, a copy number of alterations (CNA), SNPs, methylation data, and microRNA (miRNA), out of which gene expression data is high dimensional, and most informative in terms of prognostic utility. Clinical pathological variables such as specific tumour scales, Lauren classification in stomach adenocarcinoma, cancer subtype definition, PAM50 signature for breast cancer, and MammaPrint are the non-omics data used in the study. The classification performance measure, C index for both ovarian cancer and HNSC
Performance in ovarian and HNSC dataset.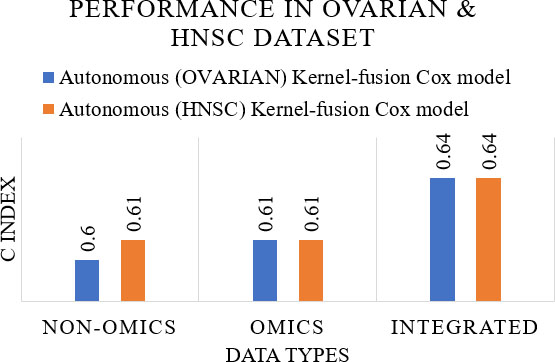
Performance in LIRI-JP & NCI dataset.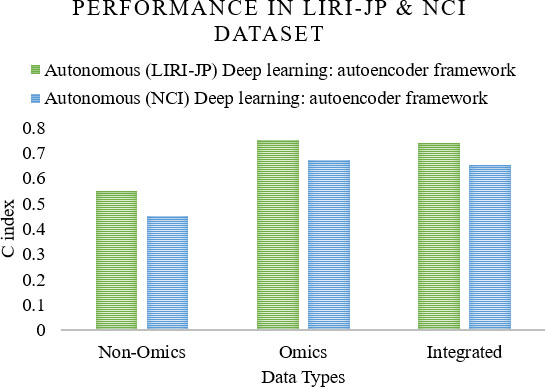
In this integration strategy, a self-reliant model for non-omics data is built and then omics variables are added to the built non-omics model. The variables to be added from omics data depends on the covariant variables from the non-omics model. Figure 8 shows the model for decision based integration strategy.
Decision based integration strategy.
The procedure for the variable selection can be the univariate model where each omics variable is approved and combined with the non-omics model for accuracy on trial and error basis. Other methods are partial dimension reduction, and least squares - partial least squares (LS-PLS). Cancer in the central nervous system was analysed using LS-PLS logistic regression to assess the treatment prediction vibes as a categorical variable in two datasets [54]. They have used omics data such as gene expression in dataset1, and somatic CNA in dataset2. Sex, age, chemo CX, and chemo VP are the non-omics data for dataset1, whereas grade, tumour stage, HER2 stature, tumour size, and progesterone receptor stature are for dataset2. The performance measure, AUC was 0.82–0.90 and 0.93 respectively. A comparison of performance measure, AUC for non-omics, omics, and integrated data for the dataset1 and dataset2 for the model is shown in Fig. 9. A Bayesian network model based on decision integration has a performance [49], AUC of 0.810. A comparison for the average AUC performance for 100 iterations of the non-omics, omics, and integrated model is shown in Fig. 10.
Performance in dataset1 & dataset2.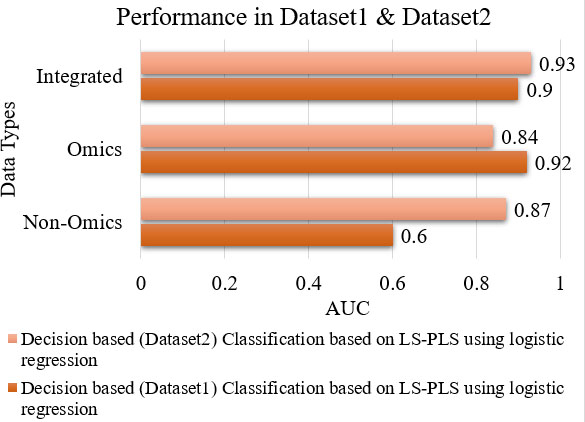
Performance of bayesian model (Decision based).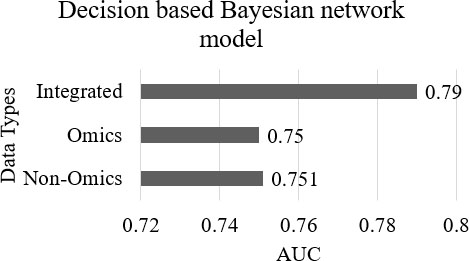
In the collective integration strategy, both non-omics and omics data are put together and is considered as one single dataset and analysed in a supervised or unsupervised manner. By doing it this way, the final model can hold indiscriminate type of relationships amidst the omics and non-omics variables. Depending upon the objective of the analytical model, this collective integration strategy can be of two types [55], multi-staged and meta-dimensional. In the multi-stage approach, an independent analysis of association amidst distinct data types is done, whereas in the meta-dimensional approach, simultaneous analysis of different data types is done. This meta-dimensional approach is again divided into three categories, namely: concatenation, transformation, and model integration. Figure 11 shows the model of collective integration strategy.
Collective integration strategy.
Collective integration strategy can be used for large scale omics and non-omics data because of its capability to capture the complexity of the data and can accommodate the correlation structure between the omics and non-omics data. Survival time in patients with glioblastoma, a central nervous system cancer using multi-omics data such as high dimensional gene expression data, CNA, SNPs, and methylation, and non-omics data such as sex, and use of temozolomide has been evaluated in a study [56]. They have used the multi layered Bayesian regression framework to build the model. It adapted the transformation-based meta-dimensional analysis, which combines multiple datasets after the transformation of every data type into a transitional form known as a graph or a kernel matrix. The same model has been used in another study to evaluate survival time, and censoring in breast cancer patients [57]. It also accessed the non-omics-omics interaction factors with two types of omics data, namely gene expression and CNA. They have used non-omics data such as age, cancer subtype, histological type, Nottingham prognostic index (NPI: tumour size, grade, and nodal involvement), and treatment. The performance measure, AUC for the models are 0.72 and 0.74–0.81 respectively. A comparison of the performance measure for both the models is shown in Fig. 12. A model to predict outcomes for bladder cancer by transforming each occurrence into binary results by accounting for censoring and time, ignored sub phenotypes [58]. It utilizes only one type of omics data, SNPs, and few non-omics data such as the area, gender, the number of tumours, TSG, tumour size, and treatment. It is a concatenation based integration and implemented with Bayesian LASSO coupled threshold model. The calculated performance measure, AUC is 0.61. A comparison of performance measure, AUC for non-omics, omics, and integrated data for the dataset SBC/EPICURO is shown in Fig. 13.
Performance of TCGA & METABRIC dataset.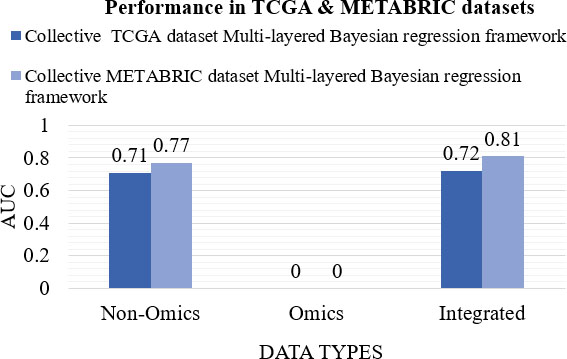
Performance of bayesian LASSO coupled threshold model.
Bayesian network model
A Bayesian network model consists of two parts: A dependency structure and local probability models [59, 60]. The dependency structure decides how the variables are related to one another. Each variable depends on a probably empty set of variables, called parents. The Eq. (1) shows the dependency:
where
where
where
The kernel fusion Cox model used omics similarity matrix as the kernel [52], assuming
The Cox proportional hazard model and the prognostic score is given in Eqs (6) and (7):
where
where
An autoencoder is an unsupervised feed forward, a non-recurrent neural network. Considering an input layer
where
where
A blend of least squares (LS) and partial least squares (PLS) were used in a study [54]. The vector
Multi layered Bayesian framework
In the multi layered Bayesian framework [56], the logarithm of survival time was modelled as a function of the covariates of the baseline model and omics data. While seeing two omics data, the regression took the form as Eq. (4.4.5):
where
Bayesian likelihood
For items with observed survival time, the Eq. (13) shows the conditional distribution of the data given the parameters and covariates was normal with the mean and variance
The Eq. (14) shows the likelihood function for the right censored data and unknown survival time.
where
where
A sequential threshold model to analyse time to event data for the prediction of outcomes for bladder cancer was used in a study [58]. The model speculates that for an observation of a patient to be present at a given period, that patient must have survived through all the previous time periods. The probability of not presenting the event of interest until interval
where
Machine learning algorithms are of higher accuracy for risk prediction scheduled to the competence to handle multidimensional data. The supervised machine learning algorithms with regression based methods imply polynomial parametric or nonparametric procedures to find the pursuit between multi-dimensional data. The application of machine learning techniques in precision medicine, tailor medical interventions for a community or individuals living in a community, based on the sociodemographic characteristics, the environmental background, and the clinical records. These non-omics data, when integrated into omics data, have an extreme power to assess the pursuit amidst environmental exposures and related health effects. According to omics technological advancement, the perception of precision medicine enhances disease prediction, prognosis, and prevention. Thus, an early warning system or risk prediction is possible through a precision medicine forecast system. Here we provide an overview of performance of machine learning techniques for precision medicine forecast in heterogeneous and high dimensional data environment, with or without omics data integration.
Machine learning methods are usually beneficial for huge, often noisy, heterogenous and high dimensional datasets. A range of these methods include Bayesian inference Networks (BN), neural networks, Random Forest (RF), Support Vector Machine (SVM), and Logistic Regression (LR). Fatty liver ailment is a prevalent clinical snag related to immense morbidity and mortality. Machine learning models such as RF, Naïve Bayes (NB), Artificial Neural Networks (ANN), and LR to predict liver ailment can aid physicians in labelling high risk patients and to make innovative diagnosis, has been developed in Taiwan [62]. They collected data from New Taipei City Municipal Hospital, Banqiao branch, which is beneath a liver care project. They also incorporated the patient’s demographic and clinical data from electronic health records. A total of 577 patients were embodied, out of which 377 patients suffer from fatty liver disease. The measure, AUROC of RF, NB, ANN, and LR with tenfold cross validation was 0.925, 0.888, 0.895, and 0.854 respectively. Among the models, RF performs well with an accuracy rate 87.48 which is more than the other machine learning models. The comparison of machine learning models in terms of AUROC and accuracy rate are shown in Figs 14 and 15 respectively. The study suggests that exercising a RF model in the clinical framework will support physicians to layer fatty liver patients for immediate prevention, surveillance, early treatment, and management.
Comparison of ML models in terms of AUROC.
Comparison of ML models in terms of accuracy.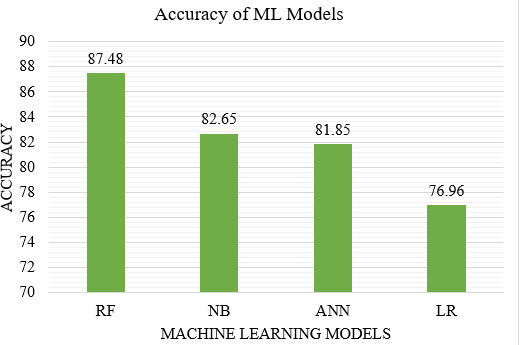
Comparison of ML models.
Comparison of ML models.
Another study with 593/401 fatty/non-fatty patients using the machine learning techniques such as RF, SVM, an ANN, and logistic regression (LR) were done in Taiwan [63]. Among the models in the said data, logistic regression performed better and obtained 70.70% accuracy with a tenfold cross validation. Performance measures such as the area under ROC curve (AUC), accuracy (AC), sensitivity (SN), specificity (SP), positive predictive value (PPV), and the negative predictive value (NPV) obtained for the models are shown in Fig. 16.
The same kind of study using machine learning techniques such as k-Nearest Neighbour (kNN), SVM, logistic regression (LR), NB, BN, C4.5, AdaBoost, bagging, RF, Hidden Naïve Bayes (HNB), and aggregate one dependent estimators (AODE) were done in China with 2522/7986 fatty/non-fatty patients and found that logistic regression obtained better accuracy, 82.92% with a tenfold cross validation [64]. Performance measures such as accuracy, specificity, precision, sensitivity or recall, and F-measure compared for the models are shown in Fig. 17. The study concludes that a novel machine learning technique may drive revised skill based clinical decisions with enhanced antiquated diagnosis rate and reduced end stage complexities.
Performance comparison of ML models.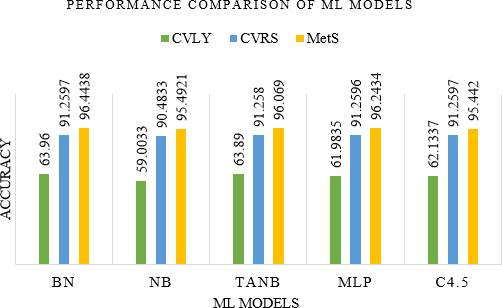
Sensitivity and specificity of ML models.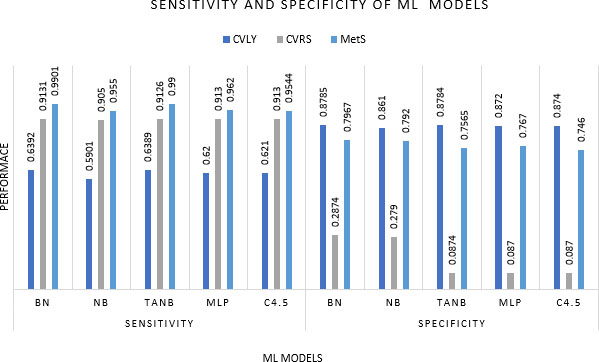
Exposure factor and diseases.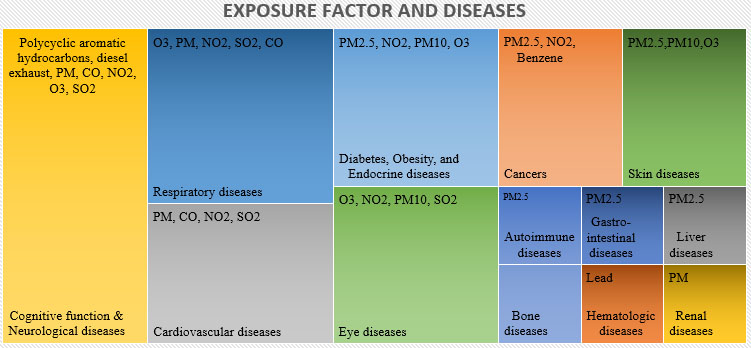
Regression based models measure only baseline risk, rate, or hazard and consistently spawn a linear blend of covariates using an algorithm that overestimates the likelihood of the results. Bayesian networks are compact and will be the graphical representation of joint probability distributions that can be used for casual reasoning and risk prediction analysis. A few challenges associated with the traditional risk prediction methods and the description of Bayesian networks, its construction and application, and advantages in risk prediction has been mentioned in a study [65]. They took cancers and heart disease as examples for prediction. The machine learning approach for the construction of Bayesian networks include constraint and score based learning. Constraint based approaches use conditional independencies in the data to extract the model structure. A score based approach investigates for a model that maximizes the likelihood of the model for given data. The advantages of Bayesian networks include individual risk prediction, and decision making under uncertainty. The main drawback is the inefficiency to handle missing data. The missing data can impact inference and learning of the casual structure.
Fuster-Parra et al. [66] have done an in depth study of cardiovascular disease (CVD) in epidemiological system analysis with Bayesian network modelling. Analysis discovered a relationship amidst thirteen significant epidemiological features of the heart age domain to analyse cardiovascular lost years (CVLY), Cardiovascular Risk Score (CVRS), and Metabolic Syndrome (MetS). Bayesian analysis demonstrated alluring results. Amidst them, the results of CVLY and MetS were deeply altered by smoking, and physical activity of men. The study compared performance of Bayesian Network (BN), NB, Tree Augmented Naïve Bayes (TANB), Multi-Layer Perceptron (MLP), and Tree C4.5 algorithms with measures such as accuracy, sensitivity, and specificity for the three epidemiological features CVLY, CVRS, and MetS. The compared results are shown in Figs 18 and 19. The ability of Bayesian networks to predict new sequences of events when hypothetical information has been introduced, makes the model a machine learning tool in epidemiological studies.
Association between pollution exposures and diseases are discussed in Section 2 of this article. Although air pollution is detrimental to lung and airways, it may also account to cardiovascular disease, stroke, allergic sensitization and rhinitis, bone ailments, cognitive function and neurologic ailments, diabetes, eye problems, hematologic disease, liver ailments, renal ailments, and skin ailments. The summary of the exposure factor and the factors appeared in several diseases are shown in Fig. 20.
Integration strategies and performance of models.
The data integration strategies, and performance of models are discussed in Section 4. Reviewed papers in this section focused to figure out the predictive competence of the integrated model. Most of the papers integrated only single omics data. Only a few variables of non-omics data were integrated in all the study. It consists of categorical and continuous variables. Large scale non-omics data were not incorporated in those models. The summary of the performance of the models from the reviewed articles are shown in Fig. 21.
From the reviewed papers, it has been learned that even though autonomous integration strategy was the simplest integration strategy, a decision based integration with LS-PLS classification model shows the highest performance among the models. Collective integration strategy is suitable for the integration of large scale non-omics and omics data since they must consider the correlation structure between those data types. For risk prediction and association testing, decision based strategy is a better fit since it follows multistage method. Autonomous integration strategy is suitable for low dimensional data.
Non-omics data
Epidemiological data are produced from different sources with different methods. Due to this heterogenous factor, the data must be integrated to keep the uniformity and consistency. Another issue is reporting bias caused by the complex elaboration and previous knowledge of the evaluator about the data.
Omics data
A common issue with omics data is the existence of many covariates. Other challenges include high correlation amidst factors, the distinct nature of information, and its hierarchical dependence. The heterogenetic characteristics of omics data types, inadequacy of standards for homogenous data from distinct omics platforms, and the high dimensionality of omics data makes the data analysis complex.
Integration of omics and non-omics data
Even though autonomous integration strategy is an uncomplicated method, some critical issues arise. They are:
Predictive competence of omics data will be inflated since the same feature is passed down in the feature selection process. A zero interaction or correlation possibility for different types of data.
Autonomous integration strategy is the simplest and popular strategy for non-omics-omics data integration. Decision based integration strategy is more complex because of the variable selection in omics data and computational intensity. Collective strategy is a sophisticated method but fairness in the variable selection has to be ensured. The heterogenous and subjective characteristics of non-omics data, and high dimensional omics data make the integration challenging.
Machine learning models have their own challenges, which are often application specific. Modelling and evaluation are important to dodge erroneous interpretations. The number of features selected and the sample tested is always critical. A good sample to feature ratio should maintain in order to make the model robust. The number of features distinguishing the data and the number of samples on which these features are measured is the data dimensionality versus data sparsity problem. Similarly, training sets should be chosen from a sufficiently large and representative sample population in order to avoid overtraining the model. Machine learning for precision medicine forecasts are presented with ample choices and often build models with high performance in terms of accuracy. The top challenges for the current precision medicine forecast model include:
Lack of clarity of data. Data integration. Resources for the data. Global approach with a broad understanding of ethical values. Recognizing benefits, since the results of the model is not always obvious. For example, in epidemiological studies, if omics data are generated based on individuals’ exposure to pollution, then integration could induce additional correlation amidst non-omics and omics data.
Understanding the benefits and limitations attached to the non-omics data, omics data, non-omics and omics data integration, and machine learning techniques for a precision medicine forecast model is the first step towards building a model. Tackling these issues directly with a comprehensive machine learning technique for a precision medicine forecast model will help to generate valuable outcomes and lead to real social change in the specific community, especially healthcare of individuals in the industrial region. The machine learning mechanisms have the capability to turn into the gadgets to address the challenges such as processing a large volume of data with robustness, integration of heterogeneous and high dimensional data to establish features in their full complexity, and the efficient delivery of results in the medicinal field.
Conclusion
Improvement of population health requires precision medicine approaches to spot high risk individuals in the generic population, presenting a few assurances of bettering possibilities for disease prevention in specific groups, especially the individuals living in the industrial area. Precision medicine path may possess some advantage for early disease identification in this framework. Biomarkers are more trustworthy in predicting diseases than a preclinical marker and may be useful among individuals with a history of cancer, and heart disease. Also, it will be useful in predicting effects of diseases such as sudden death. Molecular testing and genetic sequencing can recognize persons who are at huge risk of ailments, but it requires highly expertise technology and is not economically feasible. From this study, it has been learned that gene-environment and disease-gene data, when incorporated into non-omics data such as epidemiological data, environment data, and clinical data can evaluate health effects associated with the environmental exposure. Thus, developing a good precision medicine forecast model with the said data to improve the path on disease identification is a societal responsibility. Machine learning promises to assist medical practitioners in integrating medical knowledge, and the environment and sociodemographic background of patients into routine care.