
Abstract
This paper presents an optimized quantum Grey Wolf Optimization algorithm (qGWO), which is an enhanced version of the Grey Wolf optimization algorithm for feature selection of blood cells, which can further used for the detection of WBCs. White blood cells count in the human body determines the immune system of the human body. A deviation in the count of WBCs from the normal cell count in the human body may indicate an abnormal condition. The proposed model uses a quantum grey wolf optimization algorithm for the detection of White Blood cells among the dataset of various types of blood cells. Quantum Grey Wolf algorithm is used to find the minimal set of optimal features from the set of available features to detect the White Blood Cells optimally. As the ordinary Grey Wolf Optimization algorithm also used to find the minimal set of optimal features, but the features selected by qGWO are better in terms of computational time. Further, several classification algorithms such as Support Vector Machine (SVM), Random Forest algorithm, K Nearest Neighbor(KNN) algorithm are applied to the model to predict its accuracy for the selected subset of features after feature selection. The performance of several classifiers is compared, and the model attained the maximum accuracy of 97.8% using KNN with minimum computational time. The result obtained shows that the algorithm proposed is capable of finding an optimal subset of features and maximizing the accuracy.
Keywords
Introduction
The human body majorly consists of the following types of blood cells, i.e., White Blood Cells, Red Blood cells, and Platelets. WBCs or white blood cells, also known as leucocytes, are an integral part of the immune system. These cells help in fighting against bacteria, viruses, and other harmful germs that invade the body. The total number of white blood cells in the human body is known as “White blood cell count”. Any deviation from the normal cell count detects an abnormality in the body. Diagnosis of various diseases like leukaemia, aids, and many other fatal diseases can be made with the help of morphological analysis and cell count of white blood cells.
Manual detection of White blood cells is a very tedious and time-consuming process due to the vast multitude of the existing dataset, and it is necessary to ensure consistency in haematological laboratories. Hence automated blood cell detection and analysis using extreme Machine learning techniques can effectively increase the accuracy and efficiency of blood medical tests. Application of quantum grey wolf optimization algorithm on the dataset helps in minimizing the number of features available and maximizing the accuracy of detection of white blood cells [1, 24] Earlier work done on blood cells shows that several Extreme Machine Learning and Deep Contour techniques have been applied for Segmentation and Classification of blood cells [1]. In recent decades, researches are developing several bio-inspired algorithms for image diagnosis in the field of medical science and especially for blood cell images. Researchers have developed several computer vision techniques and automated systems for blood cell analysis, which may further be helpful in the medical diagnosis of diseases.
In recent works, Particle Swarm Optimization (PSO) algorithm has been used for optimal feature extraction [2]. Habba et al. proposed a Multiobjective Particle Swarm optimization algorithm for image segmentation and feature extraction. Grey Wolf optimization algorithm is an improved version of Particle Swarm Optimization as it provides a better approach for feature selection [3]. As proposed by Mirjalili et al., Grey wolf optimization is based on swarm intelligence techniques that follow the hunting hierarchy of wolves. Grey wolf optimization gives better results than ordinary particle swarm optimization because particle swarm optimization and other swarm intelligent techniques do not have any leader to control over the entire period whereas, in Grey wolf optimization, the complete process is controlled by leader wolves known as Alpha (
In the Binary GWO, the pool of solutions is in binary form; at any given time, all solutions are on the corner of a hypercube, whereas, in Grey wolf optimization, the Alpha wolves are majorly responsible for decision making. The subordinate wolves after Alpha, which help them in decision making, are called as Betas (
This algorithm efficiently combines the hunting hierarchy of wolves with feature selection of a given dataset of WBCs. This algorithm helps to find out the minimal and optimized subset of the features available to effectively and accurately detect WBCs from the dataset. The application of the quantum Grey Wolf algorithm is followed by several classifier algorithms like Support Vector Machine, Random Forest algorithm, Decision Tree algorithm, and KNN algorithm, which help in predicting the accuracy of the model for the particular subset of attributes. The performance of several classifiers is compared, and the accuracy of the model approximately comes out to be 97%. The result effectively shows that the algorithm proposed finds an optimal subset of features and maximizes the accuracy.
The key highlights of the paper include:
Quantum Grey Wolf optimization algorithm for the detection of WBCs has been discussed. Classification algorithms like Random Forest, Support Vector Machine, KNN, and Decision Tree have been discussed. Their results have been compared. Comparative analysis has been done for the detection of WBC using GWO as well with qGWO. The proposed algorithm has been imposed on the selected subset of the dataset of WBCs, which results in an average accuracy of 97.03%.
Grey wolf optimization algorithm
Grey wolf optimization (GWO) is a bio-inspired swarm intelligence method that was developed by Mirjalili et al. [7]. It mimics the leadership qualities of grey wolves, which are known for their group hunting skills. They have a fixe, dominant social hierarchy. The leader of the pack is the Alpha (
The hunting strategies and the social ladder of the grey wolves are modelled statistically to progress the Grey wolf optimization algorithm for feature selection and to solve other optimization problems [4, 7]. The GWO is found to have greater exploration capabilities than other swarm intelligence techniques. In most of the swarm intelligent techniques, leaders don’t have full control of the group over the entire period [8, 9, 29]. This drawback is removed in GWO in which the grey wolves have natural social leadership mechanism. The algorithm has a lot of fewer parameters as compared to other algorithms and is very easy to implement. Due to these versatile properties of the GWO algorithm, it is considered a standard to solve some of the optimization problems [10, 11].
The social leadership hierarchy of grey wolves is modelled by considering the three best solutions. They are named alpha, beta, and delta, respectively. The remaining wolves (other candidate solutions) are named as omega. The hierarchy for the wolves is shown in Fig. 1. The first step is to encircle the prey during the hunting process. The encircling behavior is simulated using the following equations, as shown below Eqs (1) and (2):
where
Hierarchy.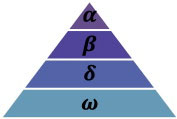
The value of
The hunt is mainly lead by the leader of the pack, i.e., alpha. The contribution is also made by beta and delta wolves in trapping and decision making. The three best solutions are found to mimic the social hierarchy and trapping behavior of grey wolves. The solutions found so far are saved, and the position of other search agents (omega wolves) is updated accordingly [27]. The position update for omega grey wolves is represented in Fig. 2, and the position of
The Fig. 3 shows a flowchart of the GWO algorithm is presented as under.
Position updating of the grey wolf.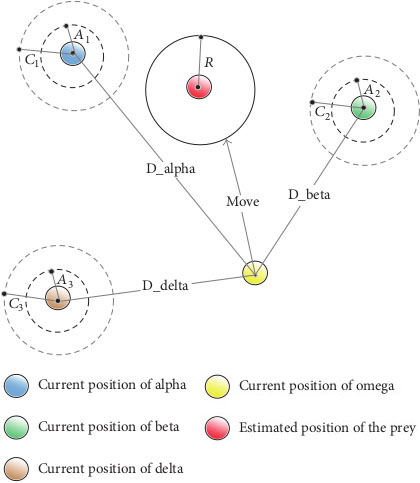
Flowchart of GWO Algorithm [14].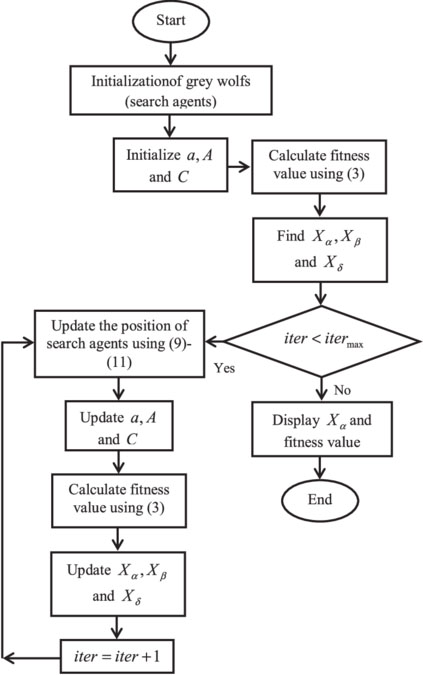
Selecting a subset or a small set of features consisting of only essential and relevant features is called feature selection. The subset of features selected is further used to train a machine learning model. The training time is reduced, and the model is simplified, which makes it easier to understand. It also improves generalization and reduces variances. Thus, a set of features is chosen such that the accuracy of the model does not suffer much, and the remaining features are removed [12, 13, 30].
Comparison of white blood cells detection with existing algorithms
Wang Shitong et al. proposed a novel detection algorithm based on fuzzy cellular neural networks. This algorithm combines threshold segmentation followed by mathematical morphology (TSMM) and fuzzy method to detect their drawbacks for cell detection and segmentation of white blood cells and further provide comparatively better accuracy [18]. An efficient method for the detection of red blood cells and white blood cells was proposed, which used hough transform filters for this purpose [19]. Further, Filip Novoselnik proposed a method of identification of white blood cells from an image using image segmentation and a Convolutional Neural Network (CNN) to classify into five classes [20]. An iterative structured circle detection algorithm has also been presented for segmentation and counts red and white blood cells [21]. K-means clustering and morphological operators have also been implemented to develop an improved algorithm by Bilkis Jamal Ferdosi et al. to detect and segment white blood cells from fluorescent images. Otsu thresholding and genetic algorithm have also been applied for the same purpose to detect the white blood cells [22, 23]. White blood cells have also been classified and identified using a novel approach, namely Capsule Networks, which obtained higher success rates as compared to other machine and deep learning models, which even had drawbacks to being overfitted. In contrast, Capsule networks overcame this drawback [25, 26].
Methodology
Selection of the optimal subset of features using qGWO algorithm
The proposed variation of the GWO algorithm is run on the features obtained from their images of the WBC dataset. The language used to implement the algorithm is Python. Support vector machines, Decision Tree classification, K-Nearest Neighbours, and Random Forest classification algorithm are the four machine learning models used. Initially, SVM is used to calculate the value of fitness function. Later, other models are also tested to find the best-suited model to calculate the fitness function.
The proposed algorithm is mainly used to find the best feature combination by extensible searching the feature space. The best feature subset is the one with maximum classification accuracy and a minimum number of selected features. The formula to calculate the fitness function Eq. (12) is given below:
where
A flag vector is used for the selection of features is shown in Fig. 4. The vector comprises a series of binary values of 0 and 1, which represents a subset of features, that is, an actual feature vector, which is standardized. For a problem with n features, there are n bits in the vector. The ith feature is not selected if the value of the ith bit equals zero; otherwise, this feature will be selected (
A flag vector for feature selection.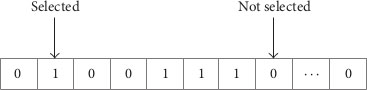
LISC Dataset images.
The pseudocode for the proposed algorithm is given below. The following steps are used to implement the algorithm.
Initialize parameters
popsize, dim, maxiter, pos and flag
where
Popsize: number of wolves, Maxiter: maximum iterations, pos: position of the grey wolf, Flag: vector of features of size no of features;
Generate the initial positions of grey wolves using a randomized function;
Initialize a, A and C:
for i
for j
if pos(i, j)
flag(j)
else
flag(j)
end if
end for
end for
Calculate the fitness of grey wolves with selected features using the fitness function proposed;
alpha
beta
delta
while k
for i
Update the position of the current grey wolf;
end for
for i
for j
if pos(i, j)
flag(j)
else
flag(j)
end if
end for
end for
Update a, A and C;
Calculate the fitness of grey wolves with selected features by fitness function proposed;
Update alpha, beta, and delta;
k
end while
Return the selected features;
The proposed variation of the GWO is better than the existing algorithm in the following ways:
In the qGWO, we have changed the fitness function, as shown in Eq. (12). The formulated fitness function guarantees generalization, reduced variance, and less training time for the model. A flag vector is introduced, as shown in Fig. 4, which helps in a feature selection from the dataset in minimal computational time.
From a total of 8 normal subjects, 135 samples of blood cells are collected and integrated to form a dataset. Haematology-Oncology and research center in Tehran authored LISC dataset. For acquiring the images, a microscope, an achromatic lens is used, which has a magnification of around 100 along with a digital camera. Earlier, the images were of the size 720
The information extracted consists of 35 features in total, which describe the properties of white blood cells. Out of 35, the dataset contains 12 Haralick based features which include – Haralick Angular Second Moment, Haralick Contrast, Haralick Correlation, Haralick Sum of squares variance, Haralick Inverse difference moment, Haralick Sum Average, Haralick Sum Variance, Haralick Sum Entropy, Haralick Entropy, Haralick Difference Variance, Haralick Info measure Correlation1, Haralick Info measure Correlation2. Other features in the dataset include Gabor Energy, Gabor Entropy, LBP Energy, LBP Entropy, Hu1 Moment, Hu2 Moment, Hu3 Moment, Hu4 Moment, Hu5 Moment, Hu6 Moment and Hu7 Moment. Features which describe the shape and size of the white blood cells are as follows – Area of Nucleus, Area of Cytoplasm, Area of Cell, Perimeter of Cell, Perimeter of Nucleus, Ratio of Area (Nucleus to Cell), Roundness of Nucleus, Roundness of Cell, Eccentricity of Nucleus, Eccentricity of Cell, Type of cell and Outcome.
All these 35 features in the dataset altogether describe the white blood cells, which are used as input for the quantum grey wolf optimization (qGWO) algorithm.
Feature extraction
Extraction is necessary to differentiate among the features and to reduce the count of features without compromising with the figure of accuracy. Different cells may have different characteristic features that may vary in the dataset, so a prior pre-processing is required on that dataset, which mostly includes normalization (the random values in the dataset are rescaled within a range of 0 to 1). A disparate data collected is required to be prepared before it is ready to be used effectively for the required purpose. The act by which the raw data sources are converted to a refined form is known as data preparation. It includes the cleaning of the data, its integration, transformation, and then reduction. The above mention process of data preparation is the core component of feature extraction, which helps us to attain an acceptable figure of accuracy.
There were a total of 35 features in the dataset, which were to be used for the detection of WBCs. Our key motive is to remove all the noisy, redundant, irrelevant features and to select the most representable ones. Several features are used to detect the WBCs and identify the abnormalities. Our algorithm initially generates the wolves randomly. So initialization somewhat affects the final selected features. When we ran our algorithm on the WBC dataset, the average number of features varied by using different algorithms in the fitness function. The average number of features selected out of 35 was 17 for SVM, 11 for the random forest, 12 for the decision tree, and 11 for KNN. The selected KNN method was able to predict with an accuracy of 97.8%.
Implementation
After the preprocessing of the data, training and testing datasets with a ratio of 70:30 is maintained for further processing. The strategy is to evaluate the accuracy using all the 35 features in the data (without the effective extraction or selection). Then the accuracy of machine learning models is used to calculate the fitness function in the Quantum Grey Wolf Optimization (qGWO) algorithm. The features obtained from the subset in the previous step are then used for classification. Finally, a comparison is made using the above-mentioned algorithms with GWO.
The fitness function in this process is the accuracy of one model, whereas rests are passed down for validation at a point of time. It validates the accuracy of the rest of the classifier algorithms over the optimal feature subset obtained.
The accuracy of different models using selected features, GWO and qGWO
The accuracy of different models using selected features, GWO and qGWO
Number of features selected out of 35
The average time is taken to perform ten iteration-run of each machine learning model with qGWO
There are a total of four most prevalent and typical learning models that are being taken for comparing the results. The first one is a Decision tree, in which each branch of the tree represents a choice between all the alternatives available, and every leaf node represents the decision or the outcome at that particular node. It is a general, predictive modeling tool used for supervised learning. The deeper the tree, the more complex its rules will be, and the model will be much fitter. It is a kind of Supervised Machine Learning where the data is regularly split based on certain parameters. The second one is K-NN, which uses data and distance function as a similarity measure. It classifies the new data done by a majority vote to its neighbor. It works between the two data points taking Euclidean distance and its corresponding nearest neighbors. Third is Random Forest, which builds the various number of trees (decision trees) and merges back together to attain a much accurate prediction. It aims at the precise and even results by assimilating the sub-decision trees formed so far. The fourth is Support Vector Machine, and it deals with the graphical presentation of the data points in some space, mapped and classified them well-defined by untying hyperplane. It is mostly used for classification purposes where imaginary hyperplanes in a multi-dimensional space are constructed such that it evenly segregates the cases of different class labels. It can handle both continuous and categorical values. It works out very well in case of a limited amount of data in the dataset.
Results and discussions
The results of the implementation of the proposed Optimized GWO Algorithm on features extracted from the WBC dataset are discussed in this section. K-Nearest Neighbours, Random Forest, Decision Tree Classification and Support Vector Machines are four machine learning models used. Time-taken and accuracy are compared for each model. A total of 35 features are obtained from the WBC sample pictures. Each model is used for calculating the fitness function for ten iterations. The average accuracy is calculated using the remaining three models on the subset of features selected, as shown in Fig. 6 and Table 1 summarizes the accuracy of different models.
Comparison of accuracy using different models.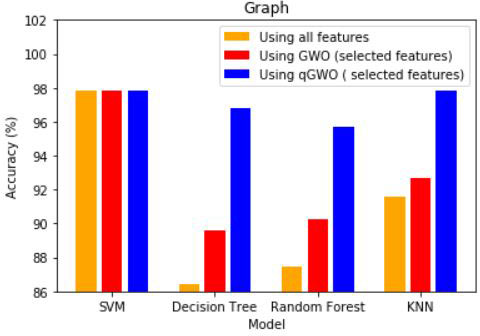
Table 2 summarizes the comparison of the total number of features obtained on applying different discriminative classifiers along with the associated algorithms. It was found that the number of features extracted is different for different machine learning models. Accuracy diagnosis, along with the number of features, is together responsible for the selection of the learning model. A total of 11 features were obtained using KNN, 11 using Random forest, 12 using the Decision tree, and 17 using SVM as in the table below. So, SVM extracted the maximum number of features among all other learning models, i.e., 17 out of 35 and a minimum number of features among all is 11 using Random forest and KNN. But you can see in Table 2, using GWO, the number of attributes/features selected by algorithm is different.
Table 3 summarizes the average time taken to perform ten iteration-run of each machine learning model using qGWO, and Fig. 7 shows the running time comparison between different models that are used.
Running time comparison using different models.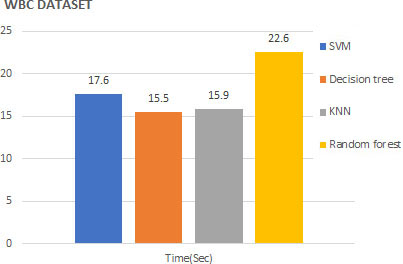
To compare qGWO with simple GWO, feature subset selection is implemented by using the features extracted from images of WBC. A total of 35 features were obtained. The proposed algorithm selects 12 features, has an average accuracy of 97.03%. 17.89 seconds is the average computational time with qGWO. Simple GWO selected 18 features, has an average accuracy of 92.58% with an approximated 21.29 seconds as an average computational time. The proposed algorithm outperforms the simple GWO with a nearly 5% increase in accuracy.
The following paper introduces a bio-inspired Optimized Grey wolf algorithm for performing feature selection in different machine learning models. Accuracy is improved, and computation cost is significantly reduced by using the novel approach introduced in the paper. The qGWO is applied to the features extracted from images of WBC. An average of 12 features was selected out of 35, with the highest accuracy of 97.80% using qGWO with KNN with minimum computational time as compared to the highest accuracy of 92.66% using simple GWO with KNN. The proposed algorithm surpassed the simple GWO in terms of both computational time and accuracy. The algorithm proposed by us can be used for feature selection in various fields such as medicine and diagnosis. It can also be used to study the cause and treatment of various diseases related to blood. Diagnosis of various diseases can also be performed by developing techniques to combine the proposed GWO optimization algorithm with the various machine and deep learning models. The hybridization of both algorithms can be further used to get better accuracy with minimum computational time.