
Abstract
This work is aiming to contribute to the field of Distance Learning through Learning Analytics. We propose a methodological framework based on network analysis metrics to provide multiple indicators for Course Learning Analytics. Social Network Analysis is proposed for this purpose due to its capacity to provide an integrated representation of students’ interaction, where individual behavior is expressed within the context of a learning community. We perform experimental evaluation on real-life data from anonymized forum posts of postgraduate students and their tutors in the School of Science and Technology at the Hellenic Open University. Initially, we create and examine two-mode networks (participant-discussion) for two different modules. Subsequently, these networks are transformed into one-mode networks. Key measures are estimated and compared and the differences between their pedagogical interpretations are highlighted. We conclude that the choice between working with a bimodal network or projecting it into a unimodal one is determined by the nature of the research questions because of the distinct features that each one of them exhibits.
Introduction
Social behavior is endogenous to humans while at the same time is almost impossible to be fully understood and interpreted. The difficulty arises from the fact that certain behavior is being determined by others’ behavior, causing an intractable problem of distinguishing the cause from the result. Since education is a social process, social proximity comes with great advantages in conventional education. Multiple signals like the tone of the voice, the body position, and a series of minor yet important characteristics, enhance communication and facilitate the two-way process of teaching and learning. In Distance Learning some of these features are absent. Learning Analytics techniques have been introduced lately to fulfill an important role: they reduce the transactional distance [1] between teacher and learner by providing a part of the “missing link” that physical distance causes. Learning Analytics and its application to different contexts and environments has the power to transform the educational system as a whole, as well as to tailor the learning experience to the specific needs of individual students which will lead eventually to their success [2].
In online learning environments, social behavior is mainly expressed in the discussion fora. Students are encouraged to use them to interact with peers and their tutors, to ask questions about their courses or simply to chit chat. Regardless of the specific purpose of the posts, a discussion forum can provide information about students’ behavior, tendencies, emotions, or even learning styles that can help education stakeholders to design, prepare and adjust the course to learners’ needs. These benefits are highly recognized in the educational field [3]. In Distance Learning, in order to gain insight into the educational needs, we have to look into the data mined from a different angle. Engagement for example cannot be measured by mere counting of the number of students’ logins. Consequently, a more holistic approach has to be undertaken [4]. Social network analysis can provide measures, help in the visualization of the data and respond to complex research issues such as collaborative learning [5]. There are available tools that permit an in-depth analysis of the data, providing measures that show how members of the community are placed in the network, as well as indications about their rapport or their influence. Studies, mainly in the field of economics and marketing, are focusing on influence maximization. Analysis of influence and susceptibility together with network structure reveal that influential individuals are less susceptible to influence than noninfluential individuals [6]. However, in education, things are more complex. Tutors with very high influence in the network may undermine students’ autonomy [7]. At the same time, peer interaction is of great importance [8]. Thus, there should be a thin line between influential or leading network members and centrality distribution in order to have a functional collaboration community. Perhaps the biggest outcome of Social Network Analysis is the ability to draw conclusions in very complex problems based on nodes’ characteristics [9]. This is justified by the argument of Borgatti and Halgin [10]:
“Any theory of social networks must take into account actors’ agency in creating those networks. The problem with this is that it is not the actors’ intentions and actions leading to occupying a certain position that creates the outcome but the actual occupation of the position.”
Social network analysis metrics were defined mainly for one-mode networks. One-mode (or unimodal) networks are networks that consist of nodes of the same type. When we are dealing with social interactions, nodes represent persons. However, in some cases, nodes can be of two types. For example, using discussion forum data we can create a network that contains participant-nodes and discussion-nodes. Another example is the investigation of co-authorship networks that consist of researcher-nodes and papers-nodes. It is straightforward that there are certain differences between bimodal (2-mode) and unimodal social networks regarding the definitions, the interpretation of the metrics and the methods used in their analysis [11]. The projection of a bimodal network into a unimodal is possible but it results in significant changes in the network’s structure and, most certainly, in information loss. Thus, the choice about the type of network to investigate forum participation is not an obvious one. Our research questions are driven by the abovementioned concerns and are succinctly described as follows:
How can we leverage network analysis metrics to understand the underlying structure of students’ communities in the discussion forum of a distance learning course? In which extend specific metrics differentiate after the transformation of a two-mode network into a one-node network? One-mode or two-mode networks can best describe the participants’ interaction?
Our study has the following structure: In Section 2, the main metrics their properties and their significance are briefly described. In Section 3 related work concerning Social Network Analysis is presented. Section 4 discusses the proposed methodology using visualization analysis. Section 5 includes information about the experimental evaluation and the data collection analysis, followed by the next section of results and discussion. Finally, in the conclusion section, we evaluate our results within the framework of Distance Education and we present our scope for future research.
Metrics and concepts that concern edges or nodes individually
The degree is the simplest metric about a node. It is the sum of the number of edges of the node. In both one-mode and two-mode networks, the degree shows the number of interactions a participant has. Inevitably, the type of network assigns a different meaning to each node’s degree. In the bimodal network, a participant with a high degree has posted in a lot of discussions. However, this does not provide us any information about the number of the other persons he interacted with. In a unimodal network, the degree rises as a person interacts with more persons. In the bimodal network, the degree rises if the person posts in more discussions even if always the same person participates in them. Weighted degree, on the other hand, counts not only the number of connections but also takes into account how many times a person has interacted with a certain person (in the unimodal network) or with how many times a person has posted in a certain discussion (in a bimodal network).
In the “family” of measures that describe some of the main properties of a node are closeness centrality, betweenness centrality, and eigenvector centrality. Closeness centrality indicates how easily a node can reach other nodes. To define closeness centrality, we have to use the concept of geodesic distance. Geodesic distance is the number of edges that are needed to create the shortest path between two given nodes. Closeness centrality is inversely proportional to the total geodesic distance from a node to all other nodes of a network [12]. The definition suggests that closeness centrality is a measure strongly affected by the network’s type. In a bimodal network, for a given person
Closeness of a vertex is defined as:
In other words, if the sum of the distances is large, then the closeness is small and vice versa [13]. A vertex with a high closeness centrality would mean it has close relationships with many vertices.
Betweenness centrality shows a node’s contribution to connecting other nodes. A node with a relatively low degree might be important due to its position connecting two, otherwise disconnected, parts of the network. Betweenness centrality of a given node
The betweenness centrality captures how much a given node (hereby denoted
Eigenvector centrality is considered to be indicative of the influence of a node in a network. High eigenvector centrality nodes are connected with nodes with influence as well. Consequently, it is a weighted degree measure of a node that is proportional to the sum of centralities of its connected nodes. Therefore, a node’s eigenvector centrality mainly depends on its neighbors’ characteristics. Given a matrix
where
Metrics about the entire network
Initially, we can calculate the mean value of several basic measures described in the previous section and use them to get an overall sense of what is happening inside the entire network. Thus, the average degree, the average weighted degree, and the average clustering coefficient indicate some of the properties of a collaboration network. Average Path Length is defined as the average graph distance between all pairs of nodes. It is obvious that when we are coping with a bimodal network the minimum value for the average path length would be 2 because geodesic distances cannot be less than two. That is, for every node that is connected with another node of the same type there is a node of different type interceding between them.
Related work
There is lots of information that can be extracted from a discussion forum [15] but extracting knowledge and detecting useful feedback can be a tedious task even when using latent semantics. Knowledge flow, influence, and behavioral change are complex phenomena that require the involvement of multiple scientific fields like sociology, phycology, and statistics for their study. Exploring the adoption patterns of interventions related to public health issues, it was found that targeting the most highly connected individuals cannot produce greater adoption than random targeting. However, targeting nominated friends can increase the adoption of the interventions concerning public health [16]. Even weight gain is largely affected by our close network [17]. Another study indicated that loneliness occurs in clusters, extends up to three degrees of separation, is disproportionately represented at the periphery of social networks, and spreads through a contagious process [18]. Network analysis research can provide solutions in practical problems as well, like organizational design and planning [19]. Curran et al. [20], proposed an approach that combines topic modeling with network techniques to characterize the political discourse using a Latent Dirichlet Allocation model to discover the thematic structure of the government’s digital database of parliamentary speeches, and two-mode networks linking Members of the Parliament to discussion topics.
In the educational field, and specifically in Distance Education, due to the barriers posed by the physical distance between learners and their tutors the investigation of students’ actions, participation and emotions using learning analytics and methods to improve teaching and learning process were in the spotlight of a series of studies [21, 22, 23, 24, 25, 26] concerning the students of the HOU. The combination of data about students’ emotions over time together with network analysis was used by Kagklis et al. [27], to detect patterns of interaction. They concluded that students’ participation in the forum did not prove to be an important factor that affects their final performance and the polarity of the students’ messages proved marginally to be related to their performance.
In relevant research [28] data mining, data analytics, and exploratory data analysis techniques were used to make sense out of information for students’ profiling. Amongst other visualization methods, one -mode networks were created for demonstrating student’s activity. Active and peripheral students were identified, allowing the tutor to have a visual imprint of their interactions and to act accordingly. Rabbany et al. [28], also identified central and peripheral participants. Additionally, hierarchical summarization of the discussed topics was used to give the instructor a quick view of what is under discussion. Grunspan et al. [29], used social network analysis to explore a plausible relation between network position and success on two successive exams. They found no significant correlation for degree and betweenness centrality measures for the first exam but there was a significant correlation between both centralities and exam performance on the second exam.
Real-world communication networks often consist of two types of nodes. One of the first bimodal networks that were investigated was the actor by event network [30] that describes social events attended by a group of women. Another significant work in the bimodal networks was conducted by Borgatti and Everett [11] that studied issues of visualization, projection, metrics validity, and interpretation. Wasserman and Lacobucci [32], proposed models allowing studying networks in which different groups of actors have been observed interacting on different relations.
A proposed methodology using visual analytics
Methodological approach
In this section we present our approach for student collaboration networks analysis. Algorithm 4.1 depicts the approach in order to detect key indicators for each student and course learning and communication behaviour. A number of indicators are proposed based on network metrics. The algorithmic approach assists the course tutor to drive conclusions on:
Active Participants per Topic Active Participants across Topics Verify Fairness and equal participation in student forum Detect Trust to other Peers and Total Trust of a Course Detect Student Maturity in participation and Total Maturity of a Course
Analysis of student fora
% anonymize
clear personal data fields
keep only event id
assign uuid to event record
edgeTable
nodeList
% create bimodal network
bimodal_network
bimodal_network
unimodalProjection(bimodal_network)
% calculate metrics per network
% check for Active Participants Across Topics
weighted_degree
closeness_centrality
% prepare Trust indicator
% prepare Maturity indicator
calculate(eigenvector_centrality
% nodes with minimum closeness centrality nodes are instructors
sort
% use closeness to Verify Fairness and equal participation in student forum
VF
% use betweeness_centrality to Detect Trust to other Peers
StudentNodeTrustList
CourseTrust
% use eigenvector centrality to Detect Maturity in participation
CourseMaturity
The proposed algorithm attempts to serve as a systematic guideline for analysis of forum based communication in the dynamic and rapidly increasing usage of Distance Learning. It is employing both bimodal and unimodal network analysis to verify that the results in the metrics are equivalent and therefore trustable. The approach is divided in two parts, first the preparation of the forum data and transformation of these into bimodal and unimodal networks and next computation of indicators that show the behavior of the students, the class and the course overall. Network analysis provides lots of metrics that are used across domains. In this case we propose specific distance learning and communication behavior indicators that are experimentally verified in Section 5. The approach makes use of two different representations of forum data as networks in order to detect a number of useful indicators that are solid in both of the network transformations.
The proposed approach can be graphically depicted using network visualization. For this reason, we employed Gephi that is a network visualization solution that is used in various disciplines (social network analysis, biology, genomics etc). One of its key features is the ability to display the network as a map, and we use the Force Atlas 2 layout algorithm to achieve that [33].
Following we present the discussion that has driven Force Atlas 2 authors [33] to develop a continuous algorithm and avoid other existing powerful techniques that have been excluded as incompatible.
According to [33] simulated annealing cannot be fully implemented, nor can any auto-stop feature. Layout stops exclusively at the user’s request. Phased strategies, used for example by OpenOrd are by definition incompatible, even if in this case it allows OpenOrd to spatialize much larger networks. Finally, strategies, where forces do not apply homogeneously, do not necessarily fit, because the motion of the network during the layout is not as fluid and it impacts the user experience [33].
Force Atlas 2 ability to show clusters is better than Fruchterman and Rheingold’s algorithm [33] to tweak the repulsion force so that it is weaker between a very connected node and a poorly connected one. As a consequence, they will end up being closer to the balanced state [33].
Force Atlas 2 implementation gives also good performances for network of fewer than 100,000 nodes, while keeping it a continuous layout (no phases, no auto-stop), fitting to Gephi user experience [33].
Experimental evaluation
The Hellenic Open University dataset
The Hellenic Open University (HOU) is the only University in Greece that provides exclusively Distance Learning academic programs. Students do not have any obligation of physical presence, except for some laboratory courses held on summer vacation. However, all study programs offer the opportunity of face to face meetings, mainly for advisory and motivational purposes. Communication between students and their tutor can be achieved via telephone call, SMS text message, e-mail, or through the discussion forum of the course. Peers officially interact only through the discussion forum although students usually create groups in social media to communicate outside of the formal learning environment. Forum interaction takes place with no external motivation. Students do not gain extra credits and forum-related assignments are not usually assigned. Students post online only if they feel that they want to communicate with their peers for any reason. Thus, discussion forum topics may vary from general questions or statements to specific course-related questions.
The postgraduate program Master’s in Information Systems, at the School of Science and Technology, is consisted of five courses that last an academic year. During this year students can attend up to five OSS (Group meeting for consulting) and have to hand over up to six written assignments. These assignments are obligatory and the average grade (it has to be above 5/10) determines whether a student would be permitted to sit on the final exams or not. In some cases, there are quizzes and online tests available that can contribute a percentage of the final grade, but this feature usually varies. The online environment that supports learning is in a Moodle platform.
To achieve our research goals, we focused on two specific courses: PLS50-Fundamental Specialization in Theory and Software and PLS60-Specialization in Software Engineering. The first one is a compulsory course offered in the first year of studies and the second course is optional, available in the second academic year. The idea is to use two courses with distinct characteristics to investigate whether these differences are reflected in differences in students’ way of interacting. Moodle log files were collected for the period from October 1
Experimental evaluation tools
HOU has setup its discussion fora based on Moodle technology. Moodle provides several options for data retrieval. Since our interest is focused on forum participation, we collected all data concerning “content creation” in the discussion forum. All processes required to ensure anonymity were followed. Additionally, validation, sorting, summarization, and aggregation of data ended up in a data file for each course, that after the final modification was imported to Gephi.
Gephi is an open-source network analysis and visualization software package for Network Analysis, commonly use in Social Networks to reveal a community’s structure and participants’ connections. Apart from visualizing the network, Gephi provides a wide range of relevant metrics. Additionally, there is a collection of several plugins available.
Once a data file is loaded in the Gephi environment several steps are followed to create a readable visualization of nodes’ interactions. Networks, especially multimodal ones should have certain features to provide information efficiently. Borgatti et al. [11] described three main characteristics:
Networks should contain a minimum number of lines. Nodes should be separated through adequate space. Adjacent nodes should be placed near each other.
To achieve these results, we have chosen to use the Force Atlas algorithm. Force Atlas is a force-directed real-world network algorithm. One of its advantages is that it can provide quickly a clear image with no overlapping nodes and minimum number crossing edges based on gravity, repulsion, and inertia [35].
One key feature of a network is the type of nodes. Communication Networks can be represented by one-mode networks where a person is connected to every other person with whom interacted directly, but also, by a two-mode network where nodes can represent either persons or discussion topics. Data retrieved from Moodle log files can be used to create two-node networks as participants are connected with the discussion topics in which they posted on. Therefore, nodes representing persons are directly connected only with nodes representing discussion topics. Since most network analysis metrics are created for one-node networks, it is interesting to transform our communication two-mode networks into unimodal to investigate how this transformation affects the results.
Briefly, the methodological steps that describe our experimental evaluation are technically the following:
Retrieve log files from forum activity in Moodle Platform for PLS50 and PLS60 for a two-month duration (October and November). Clear data and keep only every event’s id. Each student is represented by a unique id number. Create edges files and nodes files with nodes annotation. Import data to Gephi. Run Force Atlas algorithm for network formation. Run statistical measures for the bimodal network. Use partition to format the network. Save this file and create a copy to transform the network into unimodal using the plugin Multimodal Network Projection. Transform the bimodal network into a unimodal network and run metrics from scratch.
Participants and Networks’ features
The first course (PLS50) is a first-year obligatory course, so it has almost twice as many students from the course PLS60 that is an optional course. Therefore, forum participants are also more in the PLS50 course than in the PLS60 course. However, the participation rate in both courses is almost the same. Low levels of participation in both courses (Table 1) can be explained by the fact that no external motives are given to the students. Their choice to communicate via the discussion forum is one of several communication alternatives. Peer to peer interaction is often relocated in social media groups where tutors are not present. Thus, the forum participation rate is indicative of the communication where both peers and tutors are present by choice.
Description of the courses
Description of the courses
Basic features of the four networks
Initially, two-node networks were created and basic measures were calculated. Afterward, the transformation of the two-node networks for PLS50 and PLS60 was made and the basic measures were calculated once again for the new networks. The basic features of the four networks (unimodal PLS50, bimodal PLS50, unimodal PLS60, and bimodal PLS60) that emerged are shown in the following table (Table 2). The number of nodes of the one-node network represents the number of participants while in the two-network it represents the sum of participants and discussions. In the two-mode network, an edge between a participant and a discussion is created when a participant creates a post in this discussion. In the one-mode network, two participants are linked with an edge when they both created a post in the same discussion. This method does not ensure reciprocity because of the possibility that a certain participant is addressing at a certain person in a large discussion and not at all of its participants. However, in terms of communication and interaction, there is mutual participation in a common subject either directly or indirectly.
Visualization of the networks.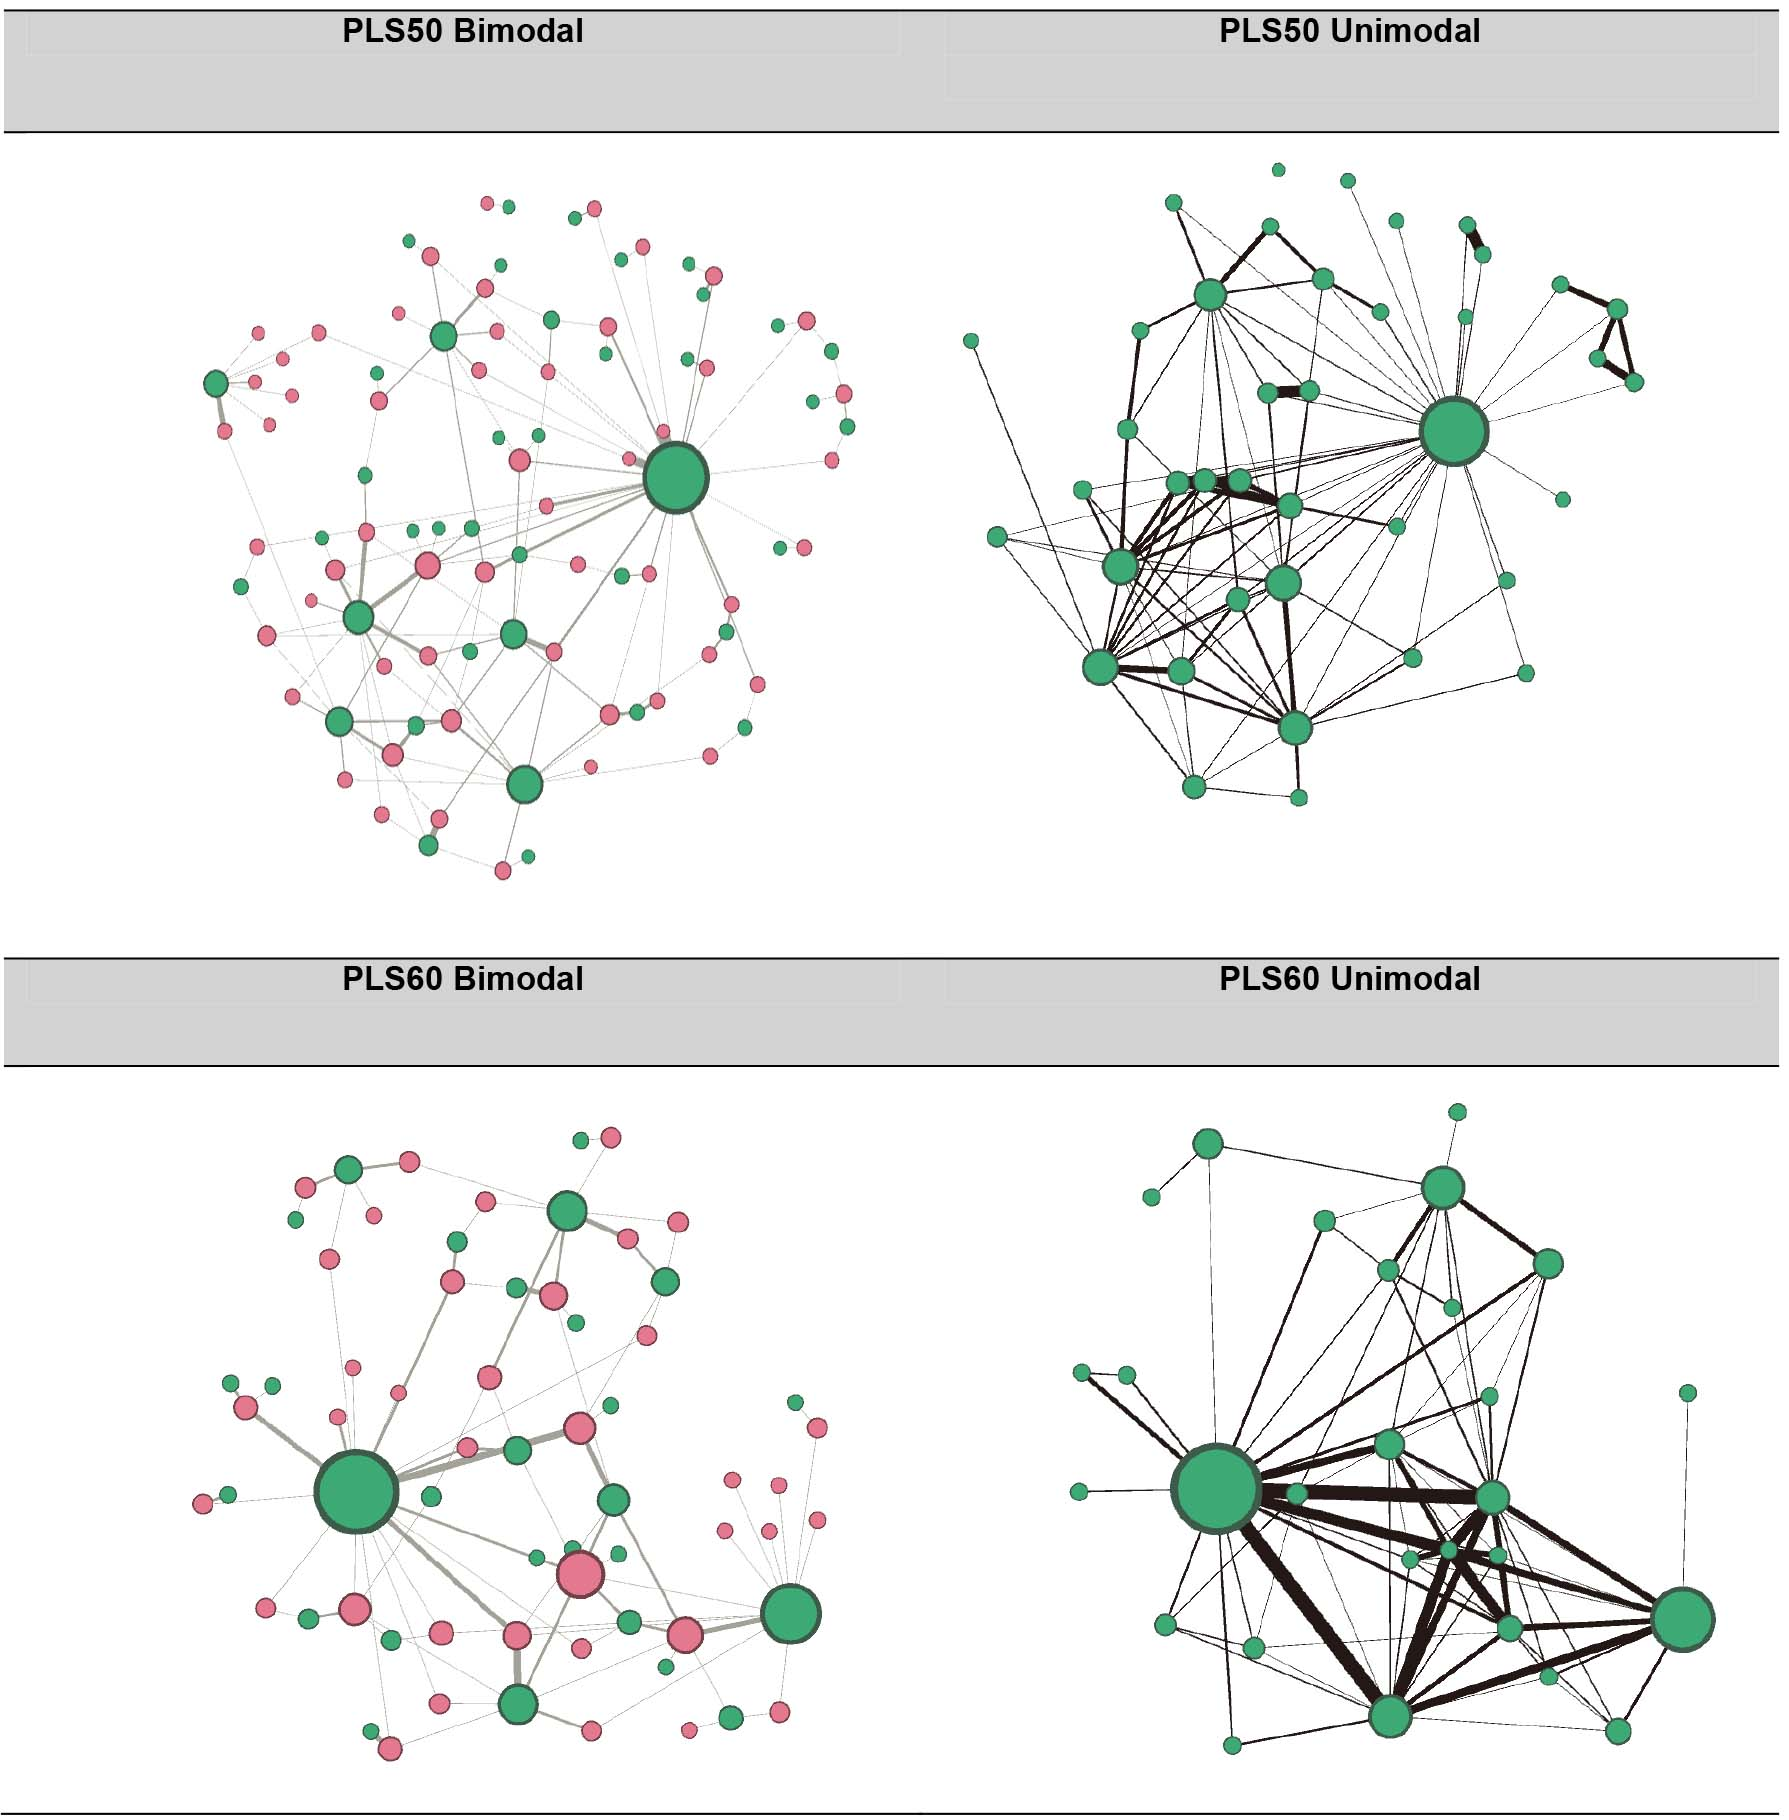
We cannot know in advance whether the number of edges will increase or decrease due to the network transformation. Given the fact that the transformation relies on discussion nodes’ removal, it should be expected that edges should decrease. On the other hand, a participant who was connected to a certain discussion, after the removal of the node would be connected to all other participants of this discussion. Thus, in the projected unimodal network, instead of the edge connecting him with the discussion, there should be edges connecting him with all the participants in this discussion. For example, in a network where the discussions are long and have a lot of participants, and at the same time, participants interact in their discussions with a variety of other participants, the transformation will probably increase the number of edges. On the other hand, in a network where discussions have a few participants who participate in many discussions but with the same persons each time, or in the extreme case of individual posts with no reply the number of edges should be decreased. In our case, in both courses, the transformation resulted in a small decrease in the number of edges providing us the first indication for the structure of the networks.
Participants’ degree.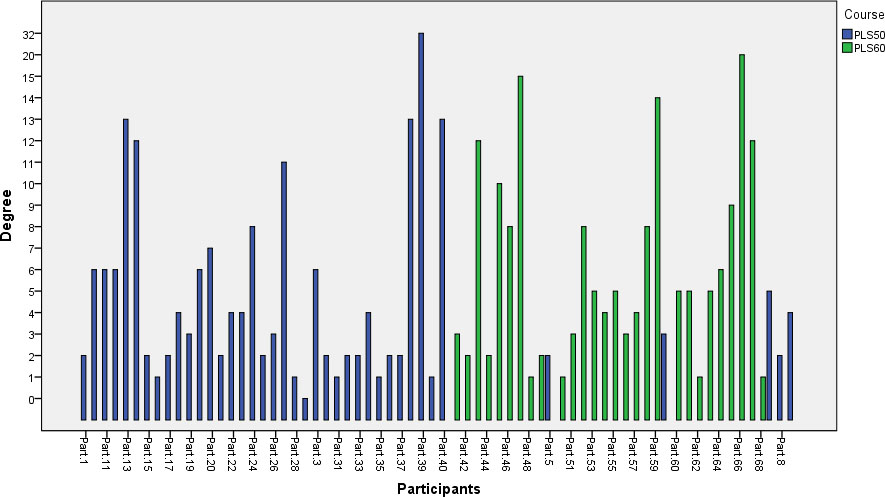
Degree distribution of the Unimodal networks.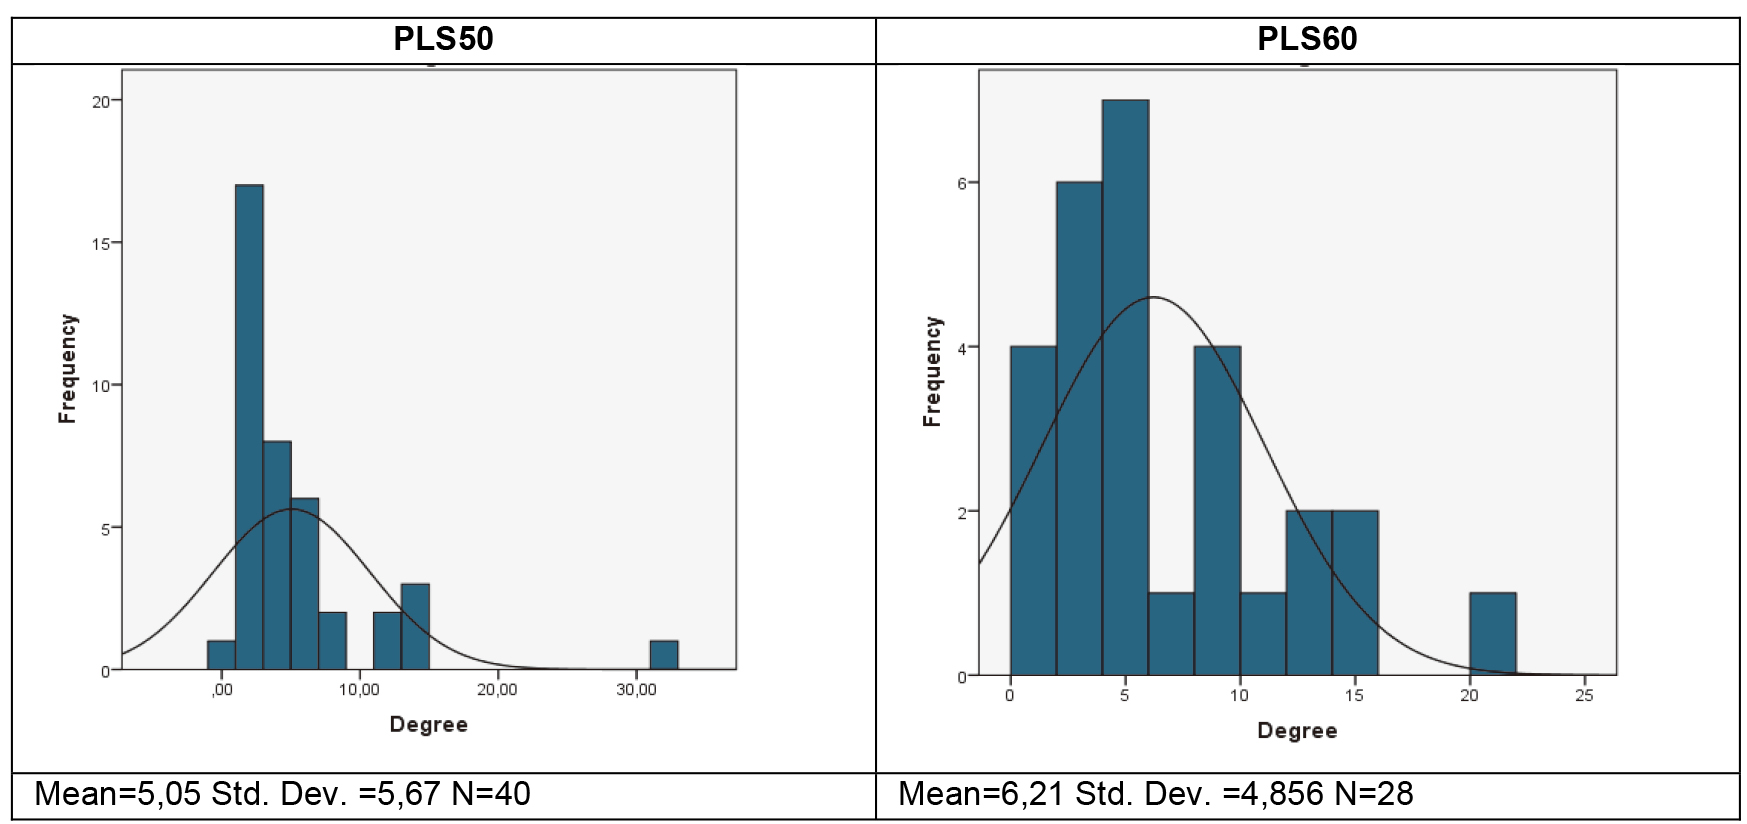
An important step of the analysis is the networks’ visualization. In Fig. 1, all four networks are shown. Graphs in the right represent the initial two-node networks. Green dots represent the participants and light red dots represent the discussions. In the networks in the left, the participants’ nodes have been removed after the projections and edges have been reattached accordingly. Dots’ magnitude is proportional to the degree of each node. In the PLS50 course, the largest node belongs to the coordinator of the course. The rest of the leading nodes represent both tutors and learners. Discussion nodes are all approximately the same size, so we conclude that there was not any discussion topic that attracted the attention of a large number of participants. In the PLS60 course, the two leading nodes belong to the coordinator of the course and the director of the program. There are also some other leading participants and some discussion topics with high participation.
In both networks, denser areas can be detected. These are indicating the existence of inner groups or communities. The visualization of the network easily provides us some hints about its features and its properties. Nevertheless, it is needed to verify these results using relevant metrics.
Participants” weighted degree.
Weighted degree distribution.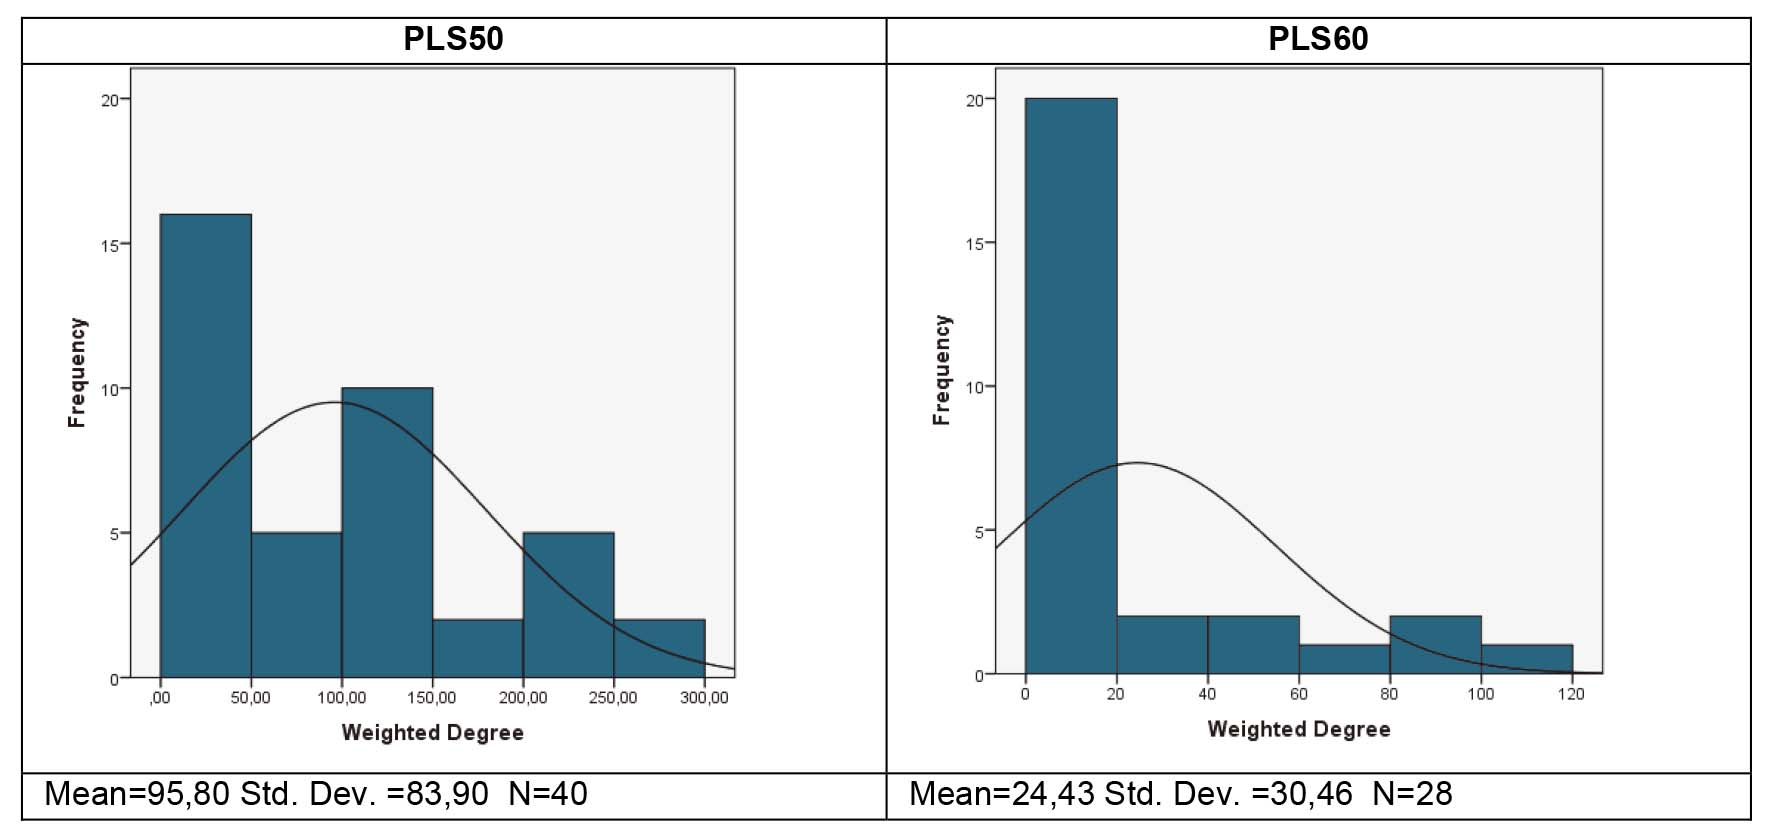
Centrality measures are very important for investigating the social behavior and the role of the participants in the learning community. Also, they can reveal sub-groups, collaboration patterns, and even information about the teaching approach that tutors use. As it was mentioned above, individual measures’ interpretation is altered depending on the type of the nodes. Therefore, to gain insight into participants’ characteristics we investigate the distribution of centrality measures. Each variable has a different interpretation in this specific context. It is noted that they present significant differences in their distribution. In Fig. 2 the degrees of the participants in both courses are presented. The degree varies from 1 to 32. This measure reveals the number of persons with whom each participant interacted with. Thus, in the PLS50 course the most active person interacted with 32 out of 39 other participants in total, while in course PLS60 the most active participant interacted with 20 persons out of 27 others.
Degree distribution in both courses reveals that most of the participants present a low degree level and there are some fewer participants who are open to wide interaction. Since most of the high-degree nodes represent tutors, this result confirms their role as communication facilitators. It is interesting to note that there is a narrower distribution in the first year’s course (PLS50). There are more nodes with a high degree in the second-year course (PLS60) indicating that students are more comfortable interacting with each other. This result is consistent with our previous study [36] where we analyzed data from previous academic years and discovered that the interaction networks of second-year students were denser than those of the freshmen. The explanation arises from two main facts: Firstly, we have to take into account that the wide range of admissions of this program leads to a student community with a variety of skills and academic background. This means that is not certain that everybody has had a previous distance learning experience or online communication skills. Thus, in the second year of study, they have gained valuable experience. Secondly, face to face meetings can be an excellent opportunity to create social bonds that, in later times, they bring in the online environment.
Participants’ closeness centrality.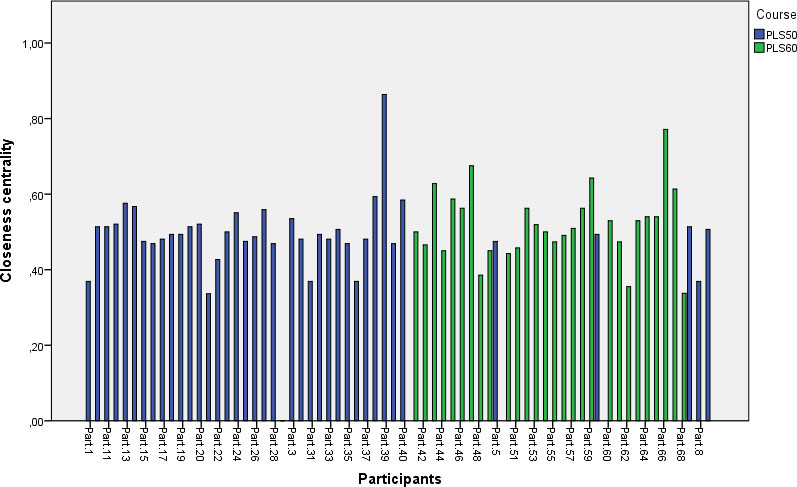
Closeness centrality distribution.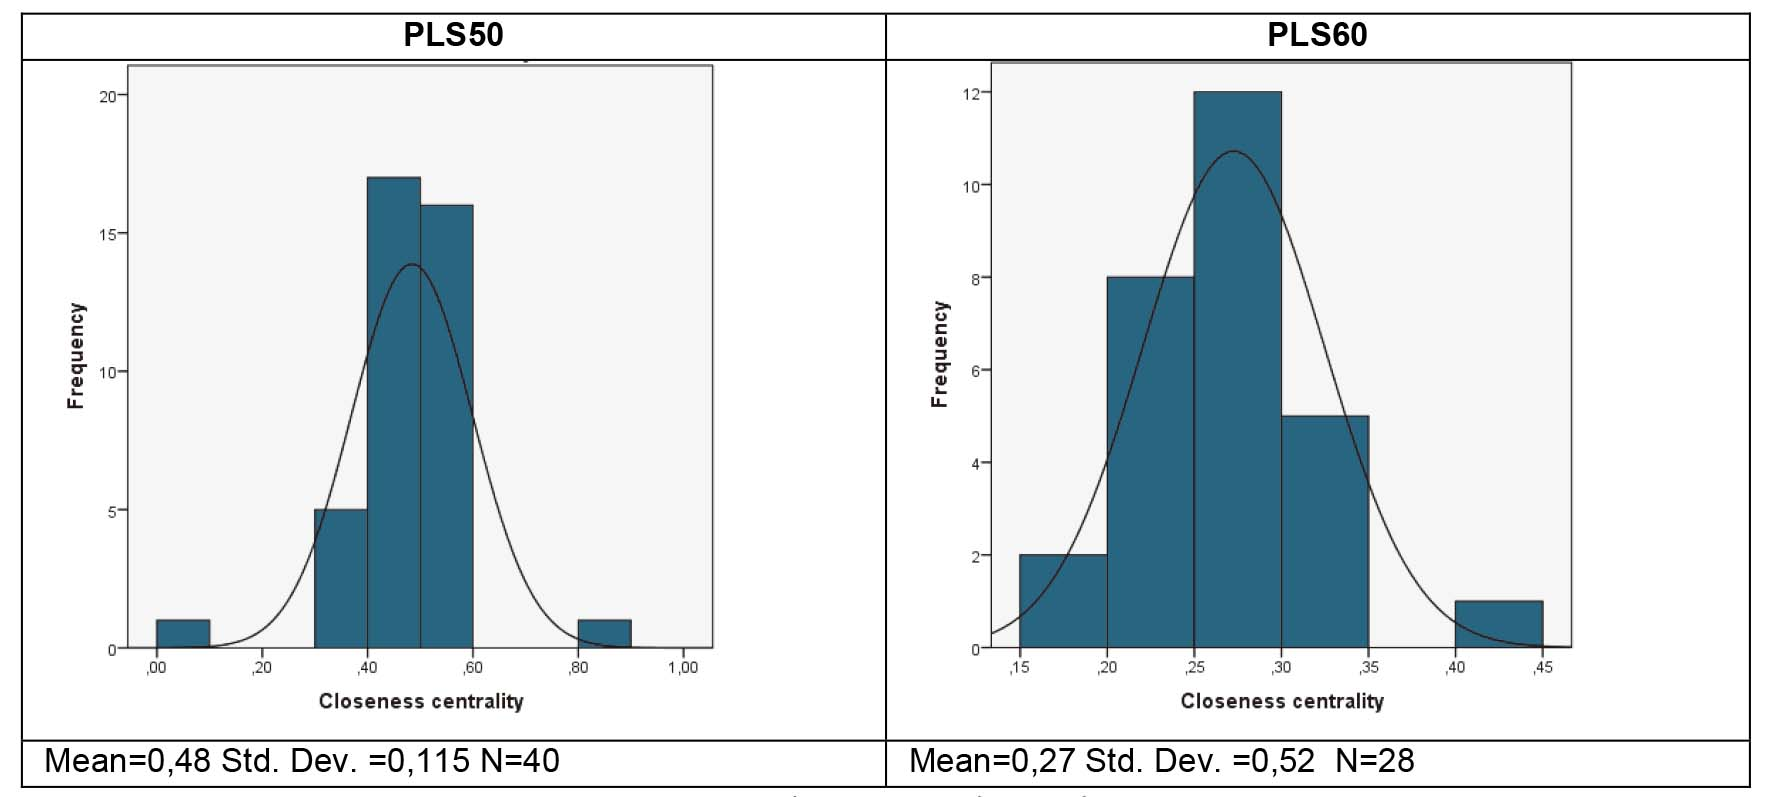
Participants’ betweenness centrality.
Betweenness centrality distribution.
Participants’ eigenvector centrality.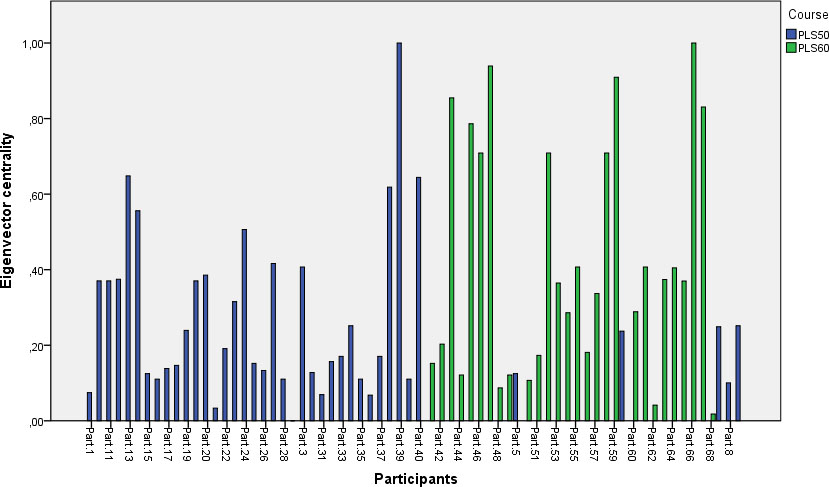
Eigenvector centrality distribution.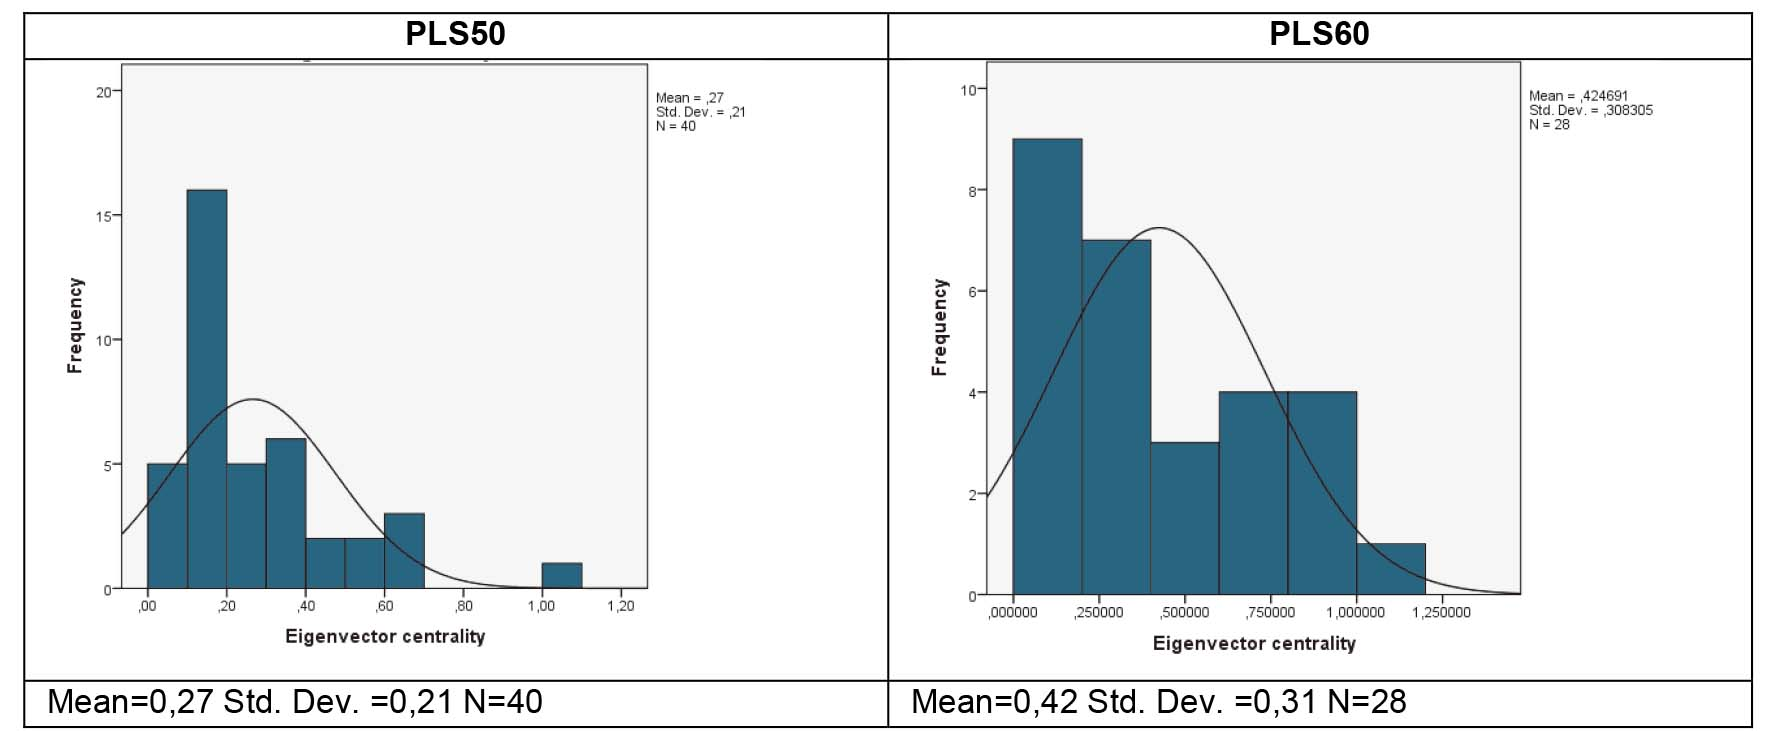
After the transformation of the two-mode into one-mode networks, weighed degree can be interpreted as the sum of connections a participant has by posting into the same discussion. Thus, if a participant has posted in a very popular discussion, his weighted degree quickly rises by far. Additionally, a very active participant who posted in a lot of discussions can have a very high weighted degree because he is connected to all the other participants more than once. He is connected to them as many times as he encountered them in every discussion. That explains that the maximum weighted degree in PLS60 is 113 and in PLS50 is 281. In the following chart (Fig. 4) weighted degree of all participants is shown. Significant differences between them are emerging, probably due to the Mathew effect since an active student who participates in many discussions has much more chances to create new connections and begin new collaborations.
Weighted degree distribution appears to follow a power-law distribution. This result is consistent with the properties found in co-authorship networks analysis conducted by [37] where the degree distribution approximates a power-law distribution.
The majority of the participants have a closeness centrality between 0.2 and 0.4. The low values show that nodes are placed close to each other. There are a few participants with zero closeness centrality. These are participants who had a single post with no reply, thus, with zero connections. The fact that most of the participants have similar closeness centrality indicates a “fair” network where all peers are easy to reach. Equally distributed centrality can be thought of as a feature of a well-functioning team. In distance learning, the autonomy of the learners and peer collaboration is encouraged. Thus, a well-connected group of peers is a significant goal to reach. Equal participation and inclusion of all group members, reciprocity, and group cohesion are also highlighted by [38] Saqr et al., as predictors of a functioning group. The nodes with lower closeness centrality are representing the tutors of the courses.
Although closeness centrality charts give us the impression of a relatively homogenous network where participants lie in similar positions, betweenness centrality reveals a very different situation. Most of the nodes’ low betweenness centrality reveals that students do not mediate to create new relations, presumably due to their preference to communicate with peers who already know or with their tutors. A similar conclusion, indicating difficulty in trusting peers, emerged in our previous research [34]. Students tend to address their questions to the “de facto” knowledgeable of their group, perpetuating the hierarchical structure of pedagogical relationships. The nodes with the higher betweenness centralities tend to fil in “structural holes” bringing together groups of students and enhancing collaboration. Thus, apart from the role to pass through subject-related information, they also mediate connections, linking students together, and supporting collaborative learning. It is interesting to notice that this mediating role is much more intense in the first year’s course (PLS50) where students have not yet established a solid position in the learning community.
Highly influential participants combine high values in all of the centrality measures presented up to this point (degree, weighted degree, closeness centrality, and betweenness centrality). However, eigenvector centrality describes a node’s influence efficiently or, in other words, its prestige score. Students who are linked with well-connected nodes increase their eigenvector centrality. Thus, students who communicate a lot with the tutors (who in this case are very central nodes) gain more influence in the peers’ community. Consequently, unlike the very narrow betweenness centrality distribution (Fig. 9), the distribution of eigenvector centrality is quite wider (Fig. 11), placing more participants in influential positions. It is obvious that students “upgrade” their status in the learning community by interacting with participants that lead to information transmission. Another interesting observation is that the maximum betweenness centrality in the course PLS50 is a lot higher than the maximum betweenness centrality in the course PLS60. At the same time, the number of nodes with high eigenvector centrality is higher in the course PLS60. This may be a hint that PLS50 is a less “mature” community because in PLS50 students rely more on their highly central tutor for communicating.
The projection of the bimodal network into a unimodal one is a process that creates a simpler and more obvious visualization of participants’ relations, along with a new set of metrics. The change in the edges’ number could be indicative of the network’s structure, to begin with. The bimodal network shows both leading actors and high popularity discussions while its projection shows a denser image with clear peer to peer interactions but misses topic-related information. Centrality measures were investigated in a node-level analysis and it was proven that even similar defined metrics allow us to draw different conclusions about the behavior of the members of the learning communities. The image of a fair collaborative network with a wide distribution of closeness centrality is modified when the distribution of betweenness centrality comes into the scene. Nodes acting as bridges imply that the mediative role of the tutors and some of the most active students support the interaction in the network. Similar distributions in both networks were found and minor changes can be explained by the fact that students of PLS60 course are more mature and experienced than the freshmen of PLS50 course.
Therefore, degree, closeness, betweenness, and eigenvector centrality provide useful and distinct insights for the participants’ behavior in the collaboration network. Different characteristics can be examined by using each one of them, with a different interpretation in the bimodal and the unimodal network. Most of the metrics mentioned in this research are strongly affected in terms of their literal value by the projection of the bimodal into a unimodal network. However, the proposed indicators are based on comparative results of the two courses’ networks and therefore were not affected but rather re-enforced. This conclusion is important from a pedagogical aspect as it provides the opportunity to use any of the two types of the network to explore certain characteristics, leaving other parameters related to our research questions, to determine the choice between going bimodal or unimodal.
Network metrics provided a wide opportunity for interpretation and further analysis. On one hand, the unimodal metrics have a more solid explanation and validity but there is certain information loss and structure alteration. On the other hand, the bimodal network provides a genuine image of the network with larger information abundance but there is difficulty to apply certain methods and produce certain metrics. Ideally, a combination of both bimodal and unimodal networks would provide a holistic view of students’ and tutors’ community by leveraging all the metrics that could otherwise be invalid or questionable and, at the same time, avoiding information loss.
Future steps include the analysis of the graph-based network structure based on semantics of forum subtopics. The impact of parameters like the duration of the course in the proposed methodology will be investigated. Furthermore, analysis of the proposed metrics using data in the time window of course milestones is a promising approach to detect quality indicators for each different thematic section of the course.