
Abstract
The current trends in education for distance and personalized learning, calls for further investigation on the educational benefits of a Virtual Reality (VR) software, regarding laboratory science courses. In this study, we investigated the teaching effectiveness of a VR-oriented innovative method vs a more traditional pedagogical approach, by measuring the Pre-Post change, commonly called as Learning Gain (LG). An Item Response Theory model, The Rasch Model (RM), was used to assess the LG as the difference between the students’ ability before and after the educational treatment. The participants, (
Keywords
Introduction
Virtual Reality has drawn much attention in the last decades. Many studies agree on that it can successfully enhance and support conventional and open, undergraduate and postgraduate education [1]. VR-based educational tools may offer a highly interactive, self-paced, cost effective and safe learning experience that overcomes limitations of laboratory facilities, insufficient support of technicians, size of classes and low funds for traditional educational experiments [2, 3]. Makransky and Lilleholt [4], mentioned that many business analyses and reports predicted that VR would be the biggest future computing platform of all time, as it could revolutionize the entertainment, gaming and education industries [5, 6]. When referring to Biology, new Information and Communication Technology (ICT) applications such virtual labs, contribute to the teaching methods so that educators can overcome the educational problems that arise from the complexity of these courses. Data, gathered through the participation of students in educational scenarios are an invaluable asset to researchers as they can utilize them in order to generate conclusions and identify hidden patterns and trends by using analytics techniques [7, 8, 9, 10, 11].
Over the past decades several comparative research studies have attempted to find out whether the use of physical manipulatives is more effective to students’ learning than the use of virtual manipulatives [12, 13, 14]. According to Paxinou et al. [15] and Makransky et al. [16], VR technology has been proved to be a promising supplementary tool to the traditional teaching methods in laboratory biology courses. The authors mentioned that students who were trained on their lab exercises via a VR application, obtained statistically significant higher scores in tests, were more certain of the gained knowledge and exhibited a greater ability in conducting the microscopy experiment in the physical lab, than their fellow students who only attended more traditional teaching methods [17]. Many supporters of the VR technology believe that this alternative educational approach facilitates learning due to the ability of human brain to perceive better and assimilate easier a three dimension (3D) computer-graphics representation than a simple text [18]. Review papers mention the research methodologies used in the area of adaptive systems like 3D virtual learning environments [19]. Many studies show that simulations can be a very promising and affordable tool for learning and instruction [20, 21, 22], especially for users who are not aware of information technologies [23]. Virtual laboratories have overall positive effects on students’ cognitive load, skills development and motivation [4]. Virtual learning simulations provide students and trainees with cost-effective teaching methods that enhance both cognitive and non-cognitive outcomes [24]. According to Trundle and Bell [25], VR laboratories are useful educational tools as they highlight significant information and remove unnecessary details making this way the educational process more effective. In addition, like all modern ICT educational applications, virtual applications have general features that can support constructive learning [26], while they are very effective in dynamically engaging learners in the learning process [27]. Simulation based learning environments have great potentials for improving students’ knowledge on scientific subjects and students’ experimental skills [28, 29, 30, 31, 32, 33, 34, 35].
The new generation of students, growing up in a wide-spread technological environment, has improved the learning capacity through visual and tactile modalities [36] and embraces such technological innovations. The digital age students process information, fundamentally differently from their predecessors [37] and hold expectations that the educational institutes will embed some innovations in the science curriculum. The question of whether the use of an educational application of cutting-edge technology, like the VR technology, contributes to the better conceptual understanding of science, has preoccupied many researchers [38, 39, 40].
A way to evaluate a new educational intervention is through the evaluation of the changes in students’ performance using a Pre and Post-Test design. Two are the main concerns when designing and creating a Pre-Post assessment test: (a) to come up with the appropriate and targeted questions (items) and (b) to apply the most suitable grading model so as to obtain accurate and useful scores [41]. Accurate scores are those scores that can be trusted. Therefore, it is expected that if the same test is given to the specific student more than once, the student will demonstrate every time the same performance. Useful are those scores that can lead the teachers to take some strategic decisions regarding the teaching procedure. Based on useful scores teachers could include some extra teaching hours in the curriculum, for those students who had a low ability in understanding a newly introduced scientific subject, and therefore received a low score in the assessment test.
After designing a targeted test, the issue of choosing an appropriate grading model to assess the students’ aptitude test performance comes in order and the following very important questions, must be taken into consideration: Do all students who obtain the same score in a test, have the same ability? Does the student’s ability depend each time upon the difficulty of the given test? Are all the items in the test equally difficult, and if not, is there an objective way to decide upon the level of their difficulty?
In many studies changes in students’ performance, commonly called Learning Gain (LG) is assessed based on the raw Pre and Post-Test scores [42, 43, 44]. But, as raw scores are measures of students’ ability defined by the number of items students get correct, and are independent of item difficulty, basing the measurements on raw scores is most of the time problematic. Having in mind the above limitation, in this study we use an alternative evaluating technique to estimate the magnitude of the Pre-Post change. This technique is not based simply on the number of items correctly answered, but uses a probabilistic Item Response Theory (IRT) model, the Rasch Model (RM), developed by the Danish statistician Georg Rasch [45]
Although there is a vast literature on students’ Pre and Post-implementation performance, the assessment of the learning gain has not been the subject of biology education research studies. Furthermore, and as far as we know, there is no published study on the measurement of the students’ learning gain after following a teaching scenario, in the context of a laboratory biology course. In this research the sample comprised an entire class of 54 4
The assessment framework
Measuring the learning gain with an IRT model
In the context of an educational intervention, an obvious way to calculate the LG for an individual student (
The main disadvantage of calculating the LG through the above equation is that the observed raw scores are independent of the item difficulty. For example, a student may do well on a test either because he/she is a well prepared student or because the items in the test are easy, or finally because he/she is a well prepared student and the items are easy. So, if we only use the classical test theory for grading the tests, then we may not measure fairly students’ abilities. Additionally, the assessment of the student’s ability on the observed raw scores, has the following prominent extra limitations: (a) The characterization of an item as easy or as difficult, depends upon the examiner’s subjective criteria and (b) The definition of reliability is established through the concept of parallel tests which is difficult to achieve in practice, as individuals can never act exactly in the same way on a second trial due to factors such as development of new skills or changes in motivation or even stress [46].
An alternative to gain calculations based on differences in raw scores would be to use a probabilistic IRT model to estimate students’ performance. A number of papers have described the advantages of the IRT models: continuous, interval-level scoring, item-level parameters that facilitate the development of valid measures, precise scoring and reliability estimates, and valid comparisons of respondents who took more, fewer or different items [47, 48, 49]. IRT attempts to model a student’s ability and the probability of answering a test item correctly [50, 51]. With an IRT model, students’ abilities can be estimated independent of the specific items they take. Furthermore its parameters are sample-independent [52] and as a result the item parameters can be estimated independent of the population of examinees [53].
According to the item response theory, each item has three parameters: (a) the difficulty, (b) the discrimination power and (c) the guessing parameter. The simplest IRT model is the RM, one-parameter (1PL) logistic model.
The RM, unlike other IRT models takes into account only the difficulty parameter of an item in order to assess the student’s ability [54]. Bond and Fox [55] claim that tests and questionnaires should produce data that fit the RM as this model sets out the criteria for successful measurements. RM is a dichotomous model since, when applied, every incorrect response in a test is scored with 0 and every correct one is scored with 1. The RM uses the following probability function to estimate the probability of a student to get the item
The parameter
For each item in a test an Item Characteristic Curve (ICC) can be made. The ICC shows the probability of a correct response as a function of the ability of a student. Figure 1 shows three ICCs for item A, item B and item C included in a test.
Item characteristic curves for three items in a test.
The student’s ability is shown on the horizontal axis, while the corresponding probability to give a correct response to this item, is shown on the vertical axis. According to Fig. 1 the probability of a student responding correctly to an item with difficulty lower than that person’s ability, is greater than 0.5, while the probability of responding correctly to an item with difficulty greater than the student’s ability is less than 0.5. Under the RM, the theoretical item characteristic curves for a set of items in a test, are all parallel and that they all have the same shape except for a location shift. This property is known as equal discrimination. That is, each item provides the same discriminating power in separating individuals by their levels on latent trait (person’s ability). The Item A curve, seems to correspond to the easiest item whereas the Item C curve to the most difficult one, out of the three items in the test.
In this study the LG is calculated, as presented by Wallace and Bailey [53], by using the estimates of the student’s ability according to the RM:
where
Screenshots from the Instructional Mode of Onlabs.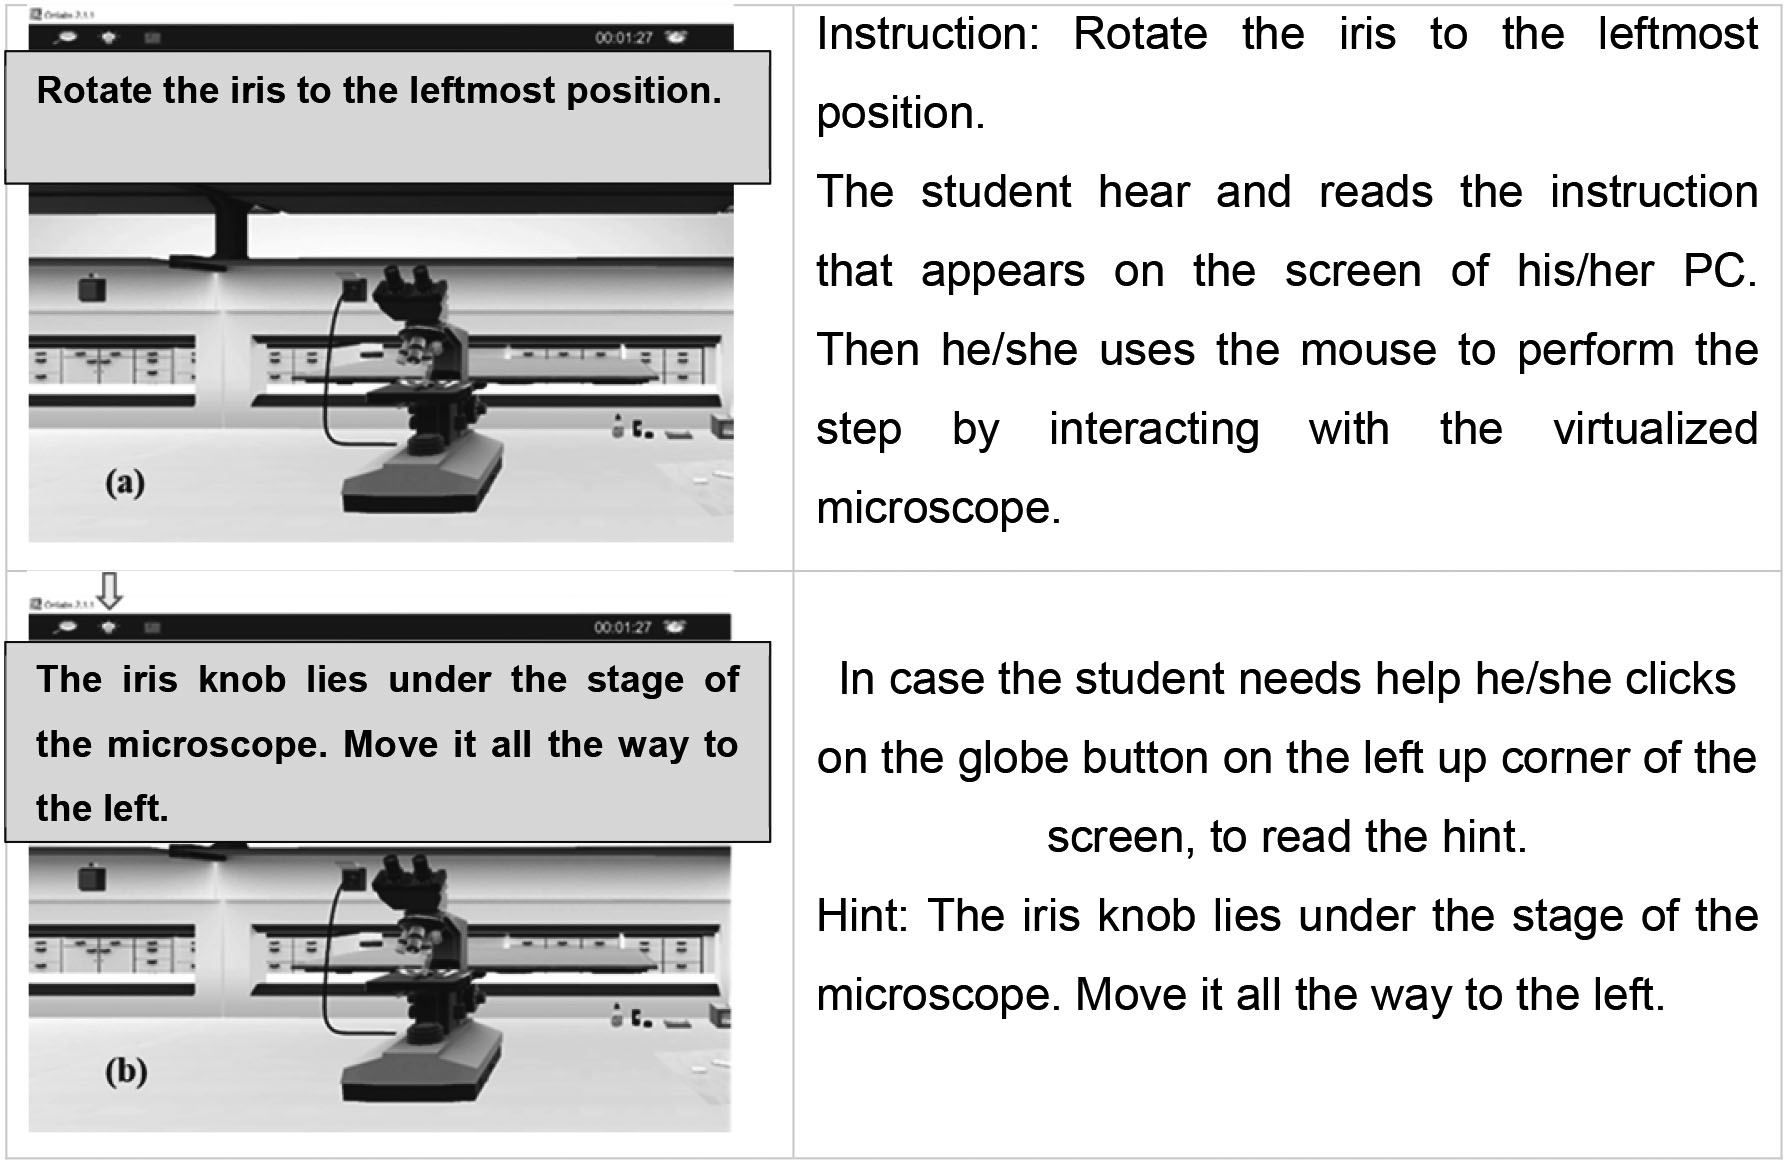
The participants
Our sample comprised an entire class of 54, 4
The process of this empirical study didn’t harm or put the participants in a position of discomfort. The participants were volunteers, taking part in the process of their own free will. They were given information on the purpose of the research, the methods being used and the possible outcomes. All the participants filled in the tests and the worksheets by using as id, a number, randomly selected, protecting this way their anonymity. Furthermore, every student had the right to withdraw at any stage in the research process.
The VR biology lab
In this empirical study the VR educational software, Onlabs (
The Instruction and the Experimentation Mode of Onlabs
Via the Instruction Mode, the trainee performs the experiment under instructions. To decrease the intrinsic cognitive load of the experiment, the latter is divided into numerous steps. For each step a written instruction appears at the top of the screen, whereas a narrator also reads the specific instruction (Fig. 2a). There is globe-button on the left up corner of the screen to click on, for help (Fig. 2b). When a step is performed successfully, the narrator congratulates the user and instruction for the next step appears on the screen.
The Experimentation Mode allows the user to explore the microscope without any instructions. Through this interaction the user has a first-person viewpoint this instrument. He/she learns by trial-and error without any worries about causing damages and accidents by misusing an expensive and sensitive microscope.
The teaching scenarios
The 54 students were separated in two groups: (a) the T-Group who attended a traditional teaching scenario for microscopy and (b) the VR-Group who was educated on microscopy through Onlabs. Figure 3 gives the experimental outline of this study which lasted two hours in total, and was implemented in a research day.
The scenario of the project.
According to Fig. 3, at the 1
The average score and the standard deviation for the first group (named as T-Group) was 5.63
In the 2
On the other hand, the VR-Group entered the Computers and Educational Technology Lab to be trained in the microscopy via Onlabs. Upon training with Onlabs, the tutor used the Experimentation Mode and through a projector screen, she performed a virtual microscopy experiment. After this demonstration, each student used a PC and through the Instruction Mode of Onlabs, performed virtually, the microscopy experiment without any further assistance from the tutor.
For each of the two groups, the 2
The Pre and the Post-Test contained exactly the same 20 multiple choice items. To fit our data in the dichotomous RM we represented each item as a binary variable, so that a value of 0 corresponds to an incorrect response and a value of 1 to a correct one. For a group of
For the data analysis the open source statistical analysis language R was used, and more specifically, the TAM (Test Analysis Modules) package of R [58]. This package functionality covers the RM as it contains the tam function [59] which tries to fit the RM with the dichotomous data by using the Maximum Likelihood Estimate (MLE) method [60, 61]. TAM can be found at the R CRAN site which is the official R repository for packages (
The matched data sets (Pre and Post-Test for each individual) were used to calculate the difficulty of the items, as well as the ability of each student. All Rasch analyses were done using the Statistic Language R.
As already mentioned, in this study the LG was calculated based on the student’s abilities and according to the Eq. (3). Item difficulty data in Pre or Post-Test, were used to estimate these students’ abilities, but when comparing students’ ability between their pre and post assessment, this analysis was anchored by using only the Pre-Test item difficulties. In this way, the change of students’ ability was not enmeshed with any changes in the values of the item difficulty. Values for the item difficulty in Pre-Test according the T-Group and the VR-Group responses are presented in the following Table 1.
Pre-test item difficulties for T and VR-group
Pre-test item difficulties for T and VR-group
According to Table 1, the first observation is that these two groups consider different items as the easiest and the most difficult ones. For example, the RM analysis of the VR-Group data, presented the item N
Figure 4a and b present the item characteristic curves of the 20 items in the Pre-Test. As these figures show, no two ICCs cross over each other. Items that give such curves are ideal for separating students, based on their ability to give correct answers [53].
Item characteristic curves for the (a) first ten and (b) last ten items in the Pre-Test.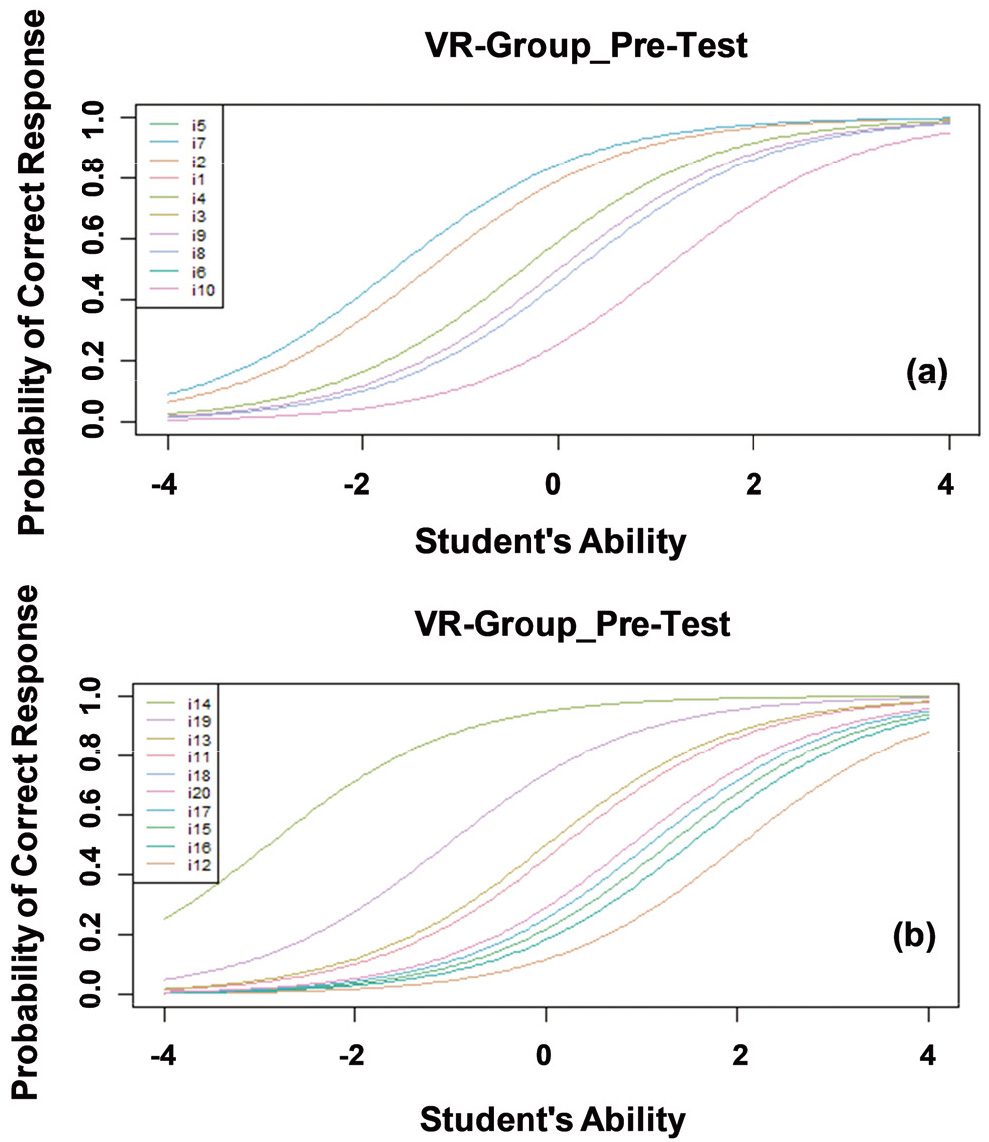
Figure 5a and b present pictorially, through a Wright Map, the direct comparison, on a logits scale, between the distribution of the students’ ability and the items difficulty. The distribution of the students’ ability in the Pre and Post-Test is aligned with the distribution of the difficulty of the items in the Pre-Test. The left side of the map shows the distribution of the measured ability of the students, from most able at the top, to least able at the bottom. The items on the right side of the map are distributed from the most difficult at the top to the least difficult at the bottom.
Distribution of students’ ability compared to items difficulty for (a) T-Group and (b) VR-Group, in the Pre and Post-testing situation.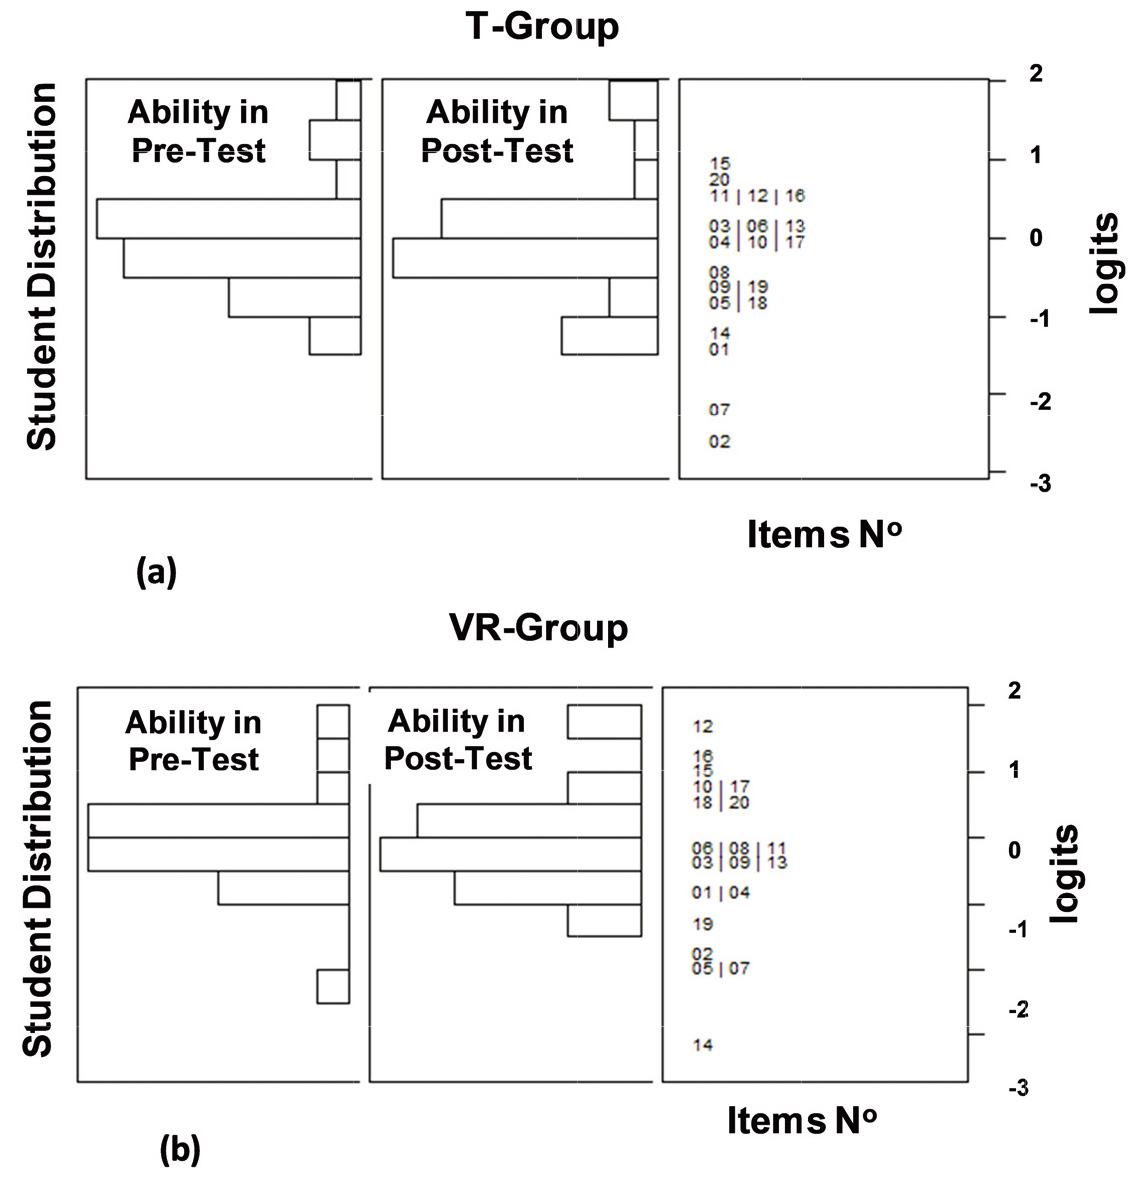
The Pre-Test and Post-Τest average students’ ability, the SD and the Rasch LG, for T and VR-Group in logit units
The Pre-Test and Post-Test averages in items difficulty for T and VR-Group, in logit units
Looking at the student distributions in Fig. 5, it can be seen that there is a shift of the students’ ability to the higher values after the educational intervention for the VR-Group, but not for the T-Group. To reinforce the above observation, the results of the Rasch analysis for the LG are displayed in Table 2. In this table the Pre-Test and Post-test average students’ ability
Table 3 presents the Pre-Test and Post-Test average difficulty of the items. The numerical results from the Rasch analysis indicated that the VR educational application helped the VR-Group to gain knowledge on the subject of microscopy, as the VR students considered the test items easier (with smaller, more negative, logit values) after the applied teaching scenario. The T-Group also considered the test items easier, when filling in the Post-Test, but this reduction of the items difficulty, was smaller for this group.
Based on the two tables above, it is indicative that the VR technology helped the biology instructor to communicate knowledge in a more effective way offering to students more confident knowledge and bigger learning gain.
In this study, the main goal was to compare two teaching interventions based on the learning gain measured via the Rasch model. The fact that the students in the VR-Group used the Onlabs to interact with the VR lab environment only once, might not be the best way to evaluate the effectiveness of the VR technology for learning and training. A more appropriate way of using the VR-software could be to persuade the students to download the application at the beginning of a term and urge them to use it at home at their discretion. Therefore, a fairer way to assess learning gain could be to conduct a study across a longer period of time, during a semester or an academic year. It is also understandable that this study was carried out with a small sample of participants. Parameters as time, cost but mostly the students’ availability and willingness, determined this size. The procedure of this research was an extracurricular activity, and therefore, it was quite difficult to persuade more participants to be involved.
Those results were indicative, and therefore not catholically accepted. During this study, a scientifically correct strategy was followed and applying this strategy on a larger scale in order to be validated, will be the subject of future communications.
A global shift towards the independent learning experience of students revealed a need to assess the contribution of a virtual reality technology intervention to the delivery of science courses. A Rasch-based analysis of the students’ ability facilitates a fair measurement of the Learning Gain which is estimated as the change of the students’ ability from a Pre-versus Post-testing situation. This analysis was performed in a group level and identified a larger learning gain for those students who attended a VR-oriented teaching procedure than their fellow students who participated to a more traditional teaching method and did not exhibit any learning gain. Our study provided an indicative proof that virtual laboratory simulations are very promising tools in laboratory education in terms of obtaining higher ability and bigger learning gain. With the certain assumption that physical labs play a critical role in lab learning, there is a need for educational institutions to become attuned to this new trend to communicate knowledge in science through technological tools, and design scenarios that consist, at least partially, of activities that involve simulations and other similar innovations.