
Abstract
Classification of land cover from remote sensed image is quite challenging task. Since the satellite images preserve spatial and spectral information, thus it is essential to identify the land cover classes and classify them to generate the thematic map. The remote sensed images and thus produced thematic maps are useful for extracting the esteemed information in diagnosing, supervising, and management of earth’s surface. In this paper, a multiclass land cover classification model is proposed that comprise of pre-processing method, a multiclass classifier and performance evaluation strategy. The land cover-based satellite images are applied to this model to generate a land cover map labelled with seven land cover classes. The morphological opening, closing, and a fusion technique are involved in pre-processing stage to extract the spatial information as well as reduce the incurred noise from the input image. Then a supervised classification methodology is introduced to classify the image into 7 number of land cover classes based on the spectral values of each pixel of the image. The overall achievement of the proposed model is compared with some existing multiclass supervised and unsupervised classification techniques such as Naïve Bayes classifier (NBC), Decision tree (DT), K-nearest neighbour (KNN), Convolution Neural Network (CNN).
Keywords
Introduction
Spatial Database is a huge database that collects data from different sources such as satellite images, geological surveys, maps, etc. The size of this database grows rapidly by adding new data day-by-day. The spatial database system requires complex calculations used in spatial queries for retrieving those data, which requires more processing power as well as more memory space. Hence, the classification and prediction techniques are used to extract data models which describe the data classes to predict future trends. Such data analysis is useful with a better understanding of larger data. Land cover [1, 2, 3] specifies the characteristics of the earth surface, which is categorized with water surface, forest, soil surface, human-building structure, etc. The task of multiclass problem is to assign some instances to the particular mutual exclusive classes. Land cover classification is a type of multiclass problem [4, 5] where classifier is used to recognize the different classes to obtain a land cover map for future analysis. Remote sensing land cover image classification is a complicated process that associates many steps, such as determination of a classification system, an assortment of remotely sensed data, collection of a supervised or unsupervised multiclass classification algorithm, generation of the thematic map, and accuracy assessment.
The remotely sensed tool [6, 7, 8, 9] performs an important role in classification of land cover surfaces [10] of any satellite images. There are many classification techniques used in various fields to solve various data analysis, such as Naïve Bayes classification [11, 12, 13], Decision tree [14], Support vector machine [15, 16, 17, 18], K-nearest neighbour [19, 20], Deep Neural network [21, 22], Logistic regression, etc.
Such satellite images are emerged with mixed noise and having loss of data. To classify those data efficiently, some techniques can be used to restore and denoise these image data. The morphological image processing [23] is a nonlinear process of extracting shape characteristic or morphological features of an image with excellent speed and denoising performance [11]. This depends on the shape of a structuring element, which is used as a probe for the image. If the pixel value of the structuring element hits or fits with the pixel value of the image, then the max or min of pixel value will be taken in the resultant image. It mainly adds pixel at the edge or boundary region through the dilation process of morphological operation and subtracts pixels from the boundary by using the erosion process of morphological operation [24].
A substitute approach to intensify the denoising quality of an image is by executing a fusion technique [25], which can be studied from Fig. 1. This technique generally incorporates the most relevant information of different sources to constitute a single image [26, 27], which has more information than any general input image.
Aim of image fusion.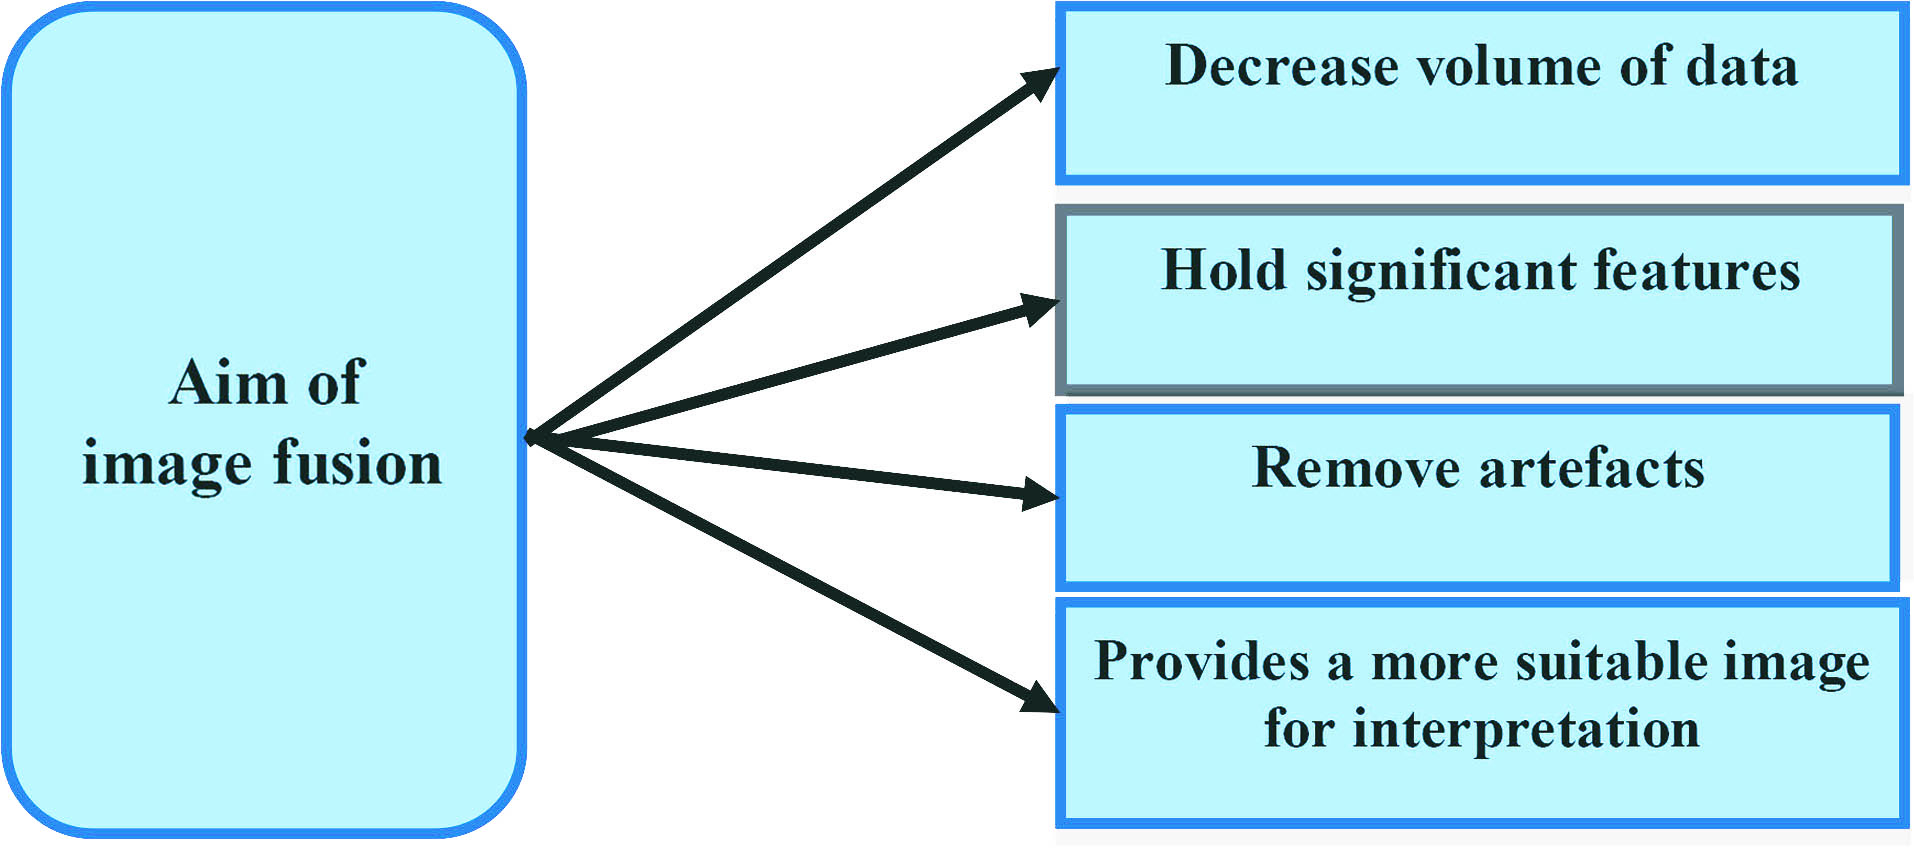
Fusion is carried out for better image segmentation [28, 29], feature extraction [30], etc. for further processing. Some of the image fusions techniques are served as high pass filtering techniques, PCA based image fusion [26], wavelet transform image fusion etc.
In this paper, morphologically opened and closed images of the same image are fused to gather contextual information of each pixel by employing a pixel level fusion technique. Then, the final fused image will be served as input to the multiclass classifier. The outcome of classification is compared with some existing classification techniques such as Naïve Bayes Classifier (NBC), Decision Tree (DT), K-Nearest Neighbour (KNN) and Convolution Neural Network (CNN).
The organization of this paper with its respective section is described as follows. The introduction is followed by Section 2, where there is a brief description of the literature survey on supervised and unsupervised classification techniques. In Section 3, the proposed FMC is described elaborately with its workflow diagram, and pseudocode. Section 4 is all about the result analysis with five classification parameters. Finally, the last section is ended with a conclusion and references.
List of some previously used supervised and unsupervised classification techniques on land cover image
List of some previously used supervised and unsupervised classification techniques on land cover image
The main objective of using satellite images is to supervise the changes in the earth’s land cover. Land cover is the presentation of the peripheral surface of the earth, which is used in many fields. Many supervised [29, 31, 32, 33, 34, 35] and unsupervised classifiers [10] are trained to classify a land cover image of different remote sensing imagery [4, 5, 35, 36] into different class levels and performance is analysed by different parameter metrics [1, 37].
Workflow diagram of proposed fusion based multiclass classifier (FMC).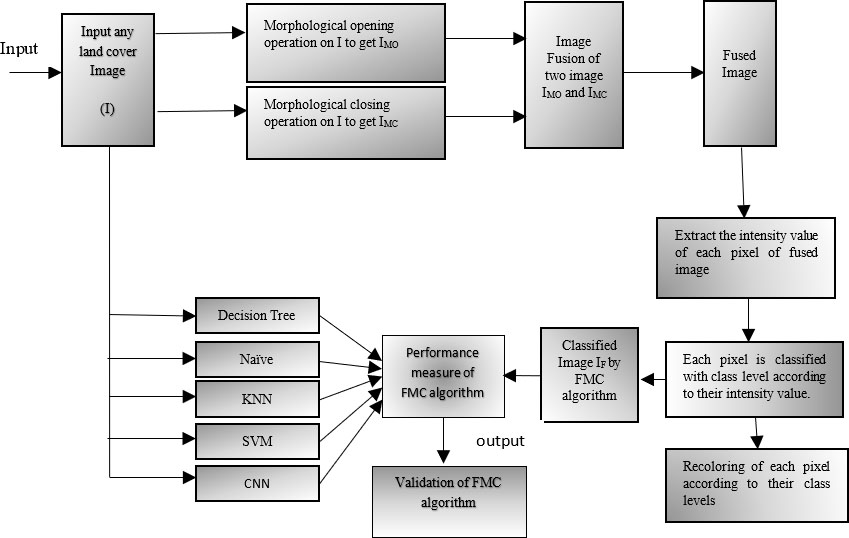
The supervised and unsupervised classification techniques can be combinedly used for better performance. Kumar et al. [37] adopted a hybrid-based classification technique in which maximum likelihood classifier, ISODATA clustering methods, and decision tree approaches are merged for Land Used Land Cover (LULC) multi-temporal dataset classification. Liu et al. [1] used Spatial-Temporal Land Cover Filter (STLCF) to remove the illogical land cover change events and naïve Bayesian equation and decision tree combinedly used for classification. Shaker et al. [36] used two automatic training data selection methods such as Gaussian Mixture Model (GMM) to split preliminarily the land and water region based on the elevation/intensity histogram, and the second method is developed based on the use of Scan Line Intensity-Elevation Ratio (SLIER) demonstrated on multispectral airborne LIDAR data. Li et al. [17] used Bayesian network classifier, decision tree, and convolutional neural network combinedly for UC Merced Land set datasets. Some researchers follow image pre-processing techniques to reduce the noise of raw satellite images. Nair et al. [11] proposed a model named enhanced streaming random tree, in which morphological processing was performed to remove the shadow from the image. Zhang et al. [23] proposed a power disturbance identification scheme based on generalized morphological open-closing and close-opening undecimated wavelet. To extract feature-level information from the land cover image, the fusion technique is adopted by many researchers. Li et al. proposed a novel non-rigid inter-subject multichannel image registration method [25] along with Gabor wavelets transformation and independent component analysis for multichannel image registration. Xia et al. [24] used a cooperative neural fusion algorithm for image restoration and adopted a cooperative neural fusion for the enhancement of the image quality. Chang et al. [26] adopted multisource fusion followed by the fisher criterion-based nearest feature space approach for Lands slide classification.
From the above surveys, we are taking into account the morphological operations and a fusion method to exploit contextual information as well as to reduce the noise before permit the input to the proposed classification method. The performance of classification is evaluated and the classification result is compared with some supervised and unsupervised classification models such as DT, NBC, KNN (with neighbours 3, 5, and 7), and CNN.
The workflow diagram of the proposed fusion based multiclass classifier is demonstrated in Fig. 2. It comprises of three basic stages for land cover image processing. The 1
Dataset description and image pre-processing
Google Earth is an approved geolocation program that can be used to explore the world from the android mobile or computer. The spatial resolution of satellite images of Google Earth depends on the source of data. We were searching for images with multiple objects within so that to validate our proposed classification algorithm. So, the study area is not confined. Three image datasets have been chosen from Google earth on the Android 9.0 mobile. The first two images were taken from the location- Data SIO, NOAA, U.S. Navy, NGA, GEBCO, Landsat/Copernicus 22
Image dataset1 (Source: Data SIO, NOAA, U.S. Navy, NGA, GEBCO, Landsat /Copernicus 22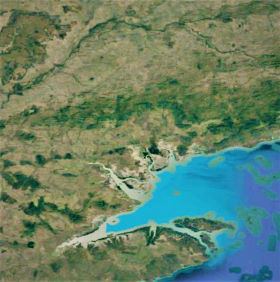
Image dataset2 (Source: Data SIO, NOAA, U.S. Navy, NGA, GEBCO, Landsat/Copernicus 20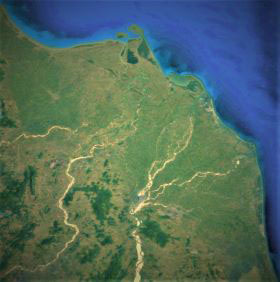
Image dataset3 (Source: Maxar technologies 19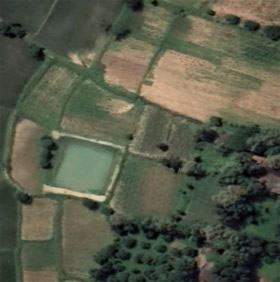
Let
Similarly, erosion of
Let
Similarly, the closing operation is the dilation followed by erosion, which can be expressed a
where
First, a morphological open operation is applied on the image (
where
Thereafter, both images IMO and IMC are preceded for pixel-level fusion technique. This technique is used to fuse or combine the images into one image IF with an alpha factor
where
The applied pixel-level fusion technique is compared with Discrete Wavelet Transform (DWT) fusion technique and Principal Component Analysis (PCA) based fusion technique [38, 39] by these two metrics.
The proposed multiclass classifier is based on the concept of supervised classification technique. In this model, first, the model is trained with a training image dataset, after that the model is ready to predict the land cover classes for the test image dataset. Image data are given to the computer in the form of digital values. The smallest unit of the image is known as a pixel. In the RGB colour model, the intensity level of each pixel is the combination of three colour components i.e., red, green and blue. Each component is associated with the intensity values within the range of 0 to 255. For the training dataset, image dataset is chosen from Google Earth and segmented in different classes with predefined colours as shown in Table 2 by annotation tool. In this approach seven number of class levels are considered for land cover classification such as dense forest (Class 1), less dense forest (Class 2), grass (Class 3), pure water (Class 4), impure water (Class 5), bare soil (Class 6), mountain (Class 7). By considering threshold ranges of intensity values of R, G, B, each class level is defined. If the spectral features of one pixel of the tested image dataset are fallen into the spectral features of the training image dataset, then that pixel is classified into a particular class level. In the same way, all pixels are classified with defined land cover classes. After that, each pixel is re-coloured with different ranges of colour according to their associated class levels to generate land cover maps for an elegant view. The colours for pixel classification are mentioned in the 3
List of land cover types with their re-colouring shades
List of land cover types with their re-colouring shades
In this section the pseudocode for proposed FMC approach for any land cover image is briefly described.
/* Steps to approach proposed FMC */
Read the LC image Apply morphological opening and morphological closing operation on Apply pixel-level image fusion technique with alpha-factor 0.5 on both IMO and IMC of step 2 to get a fused image IF. Read the fused image IF from step 3 to determine the size of the image in the form of Initialize a variable named Initialize the array with size Read the intensity values of R, G, and B component of each pixel and store those values in the array. Assign class level according to the ranges of R, G, and B values and add class level to each row of the array. Such that one column is added as class levels to that array of 4 Each pixel of the original image is re-coloured according to its class level.
Result of morphological opening (a), closing (b), and corresponding fused image (c) of image dataset1.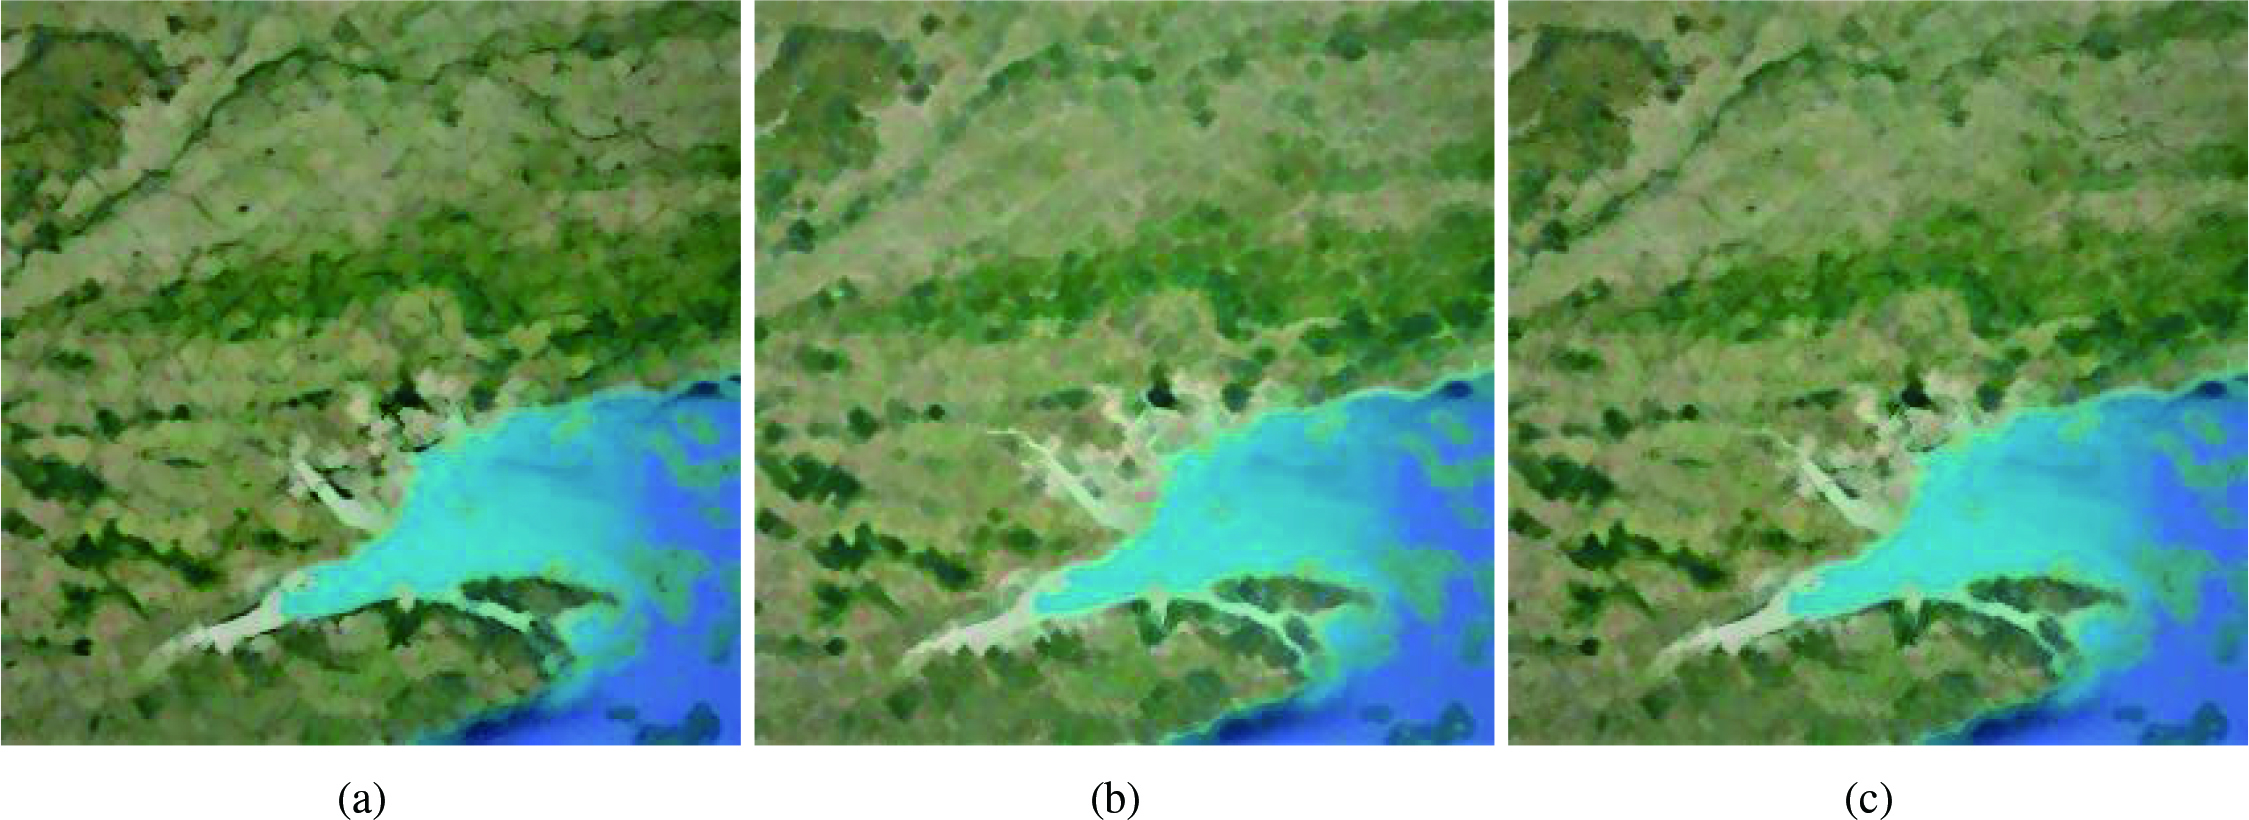
Result of morphological opening (a), closing (b), and corresponding fused image (c) of image dataset2.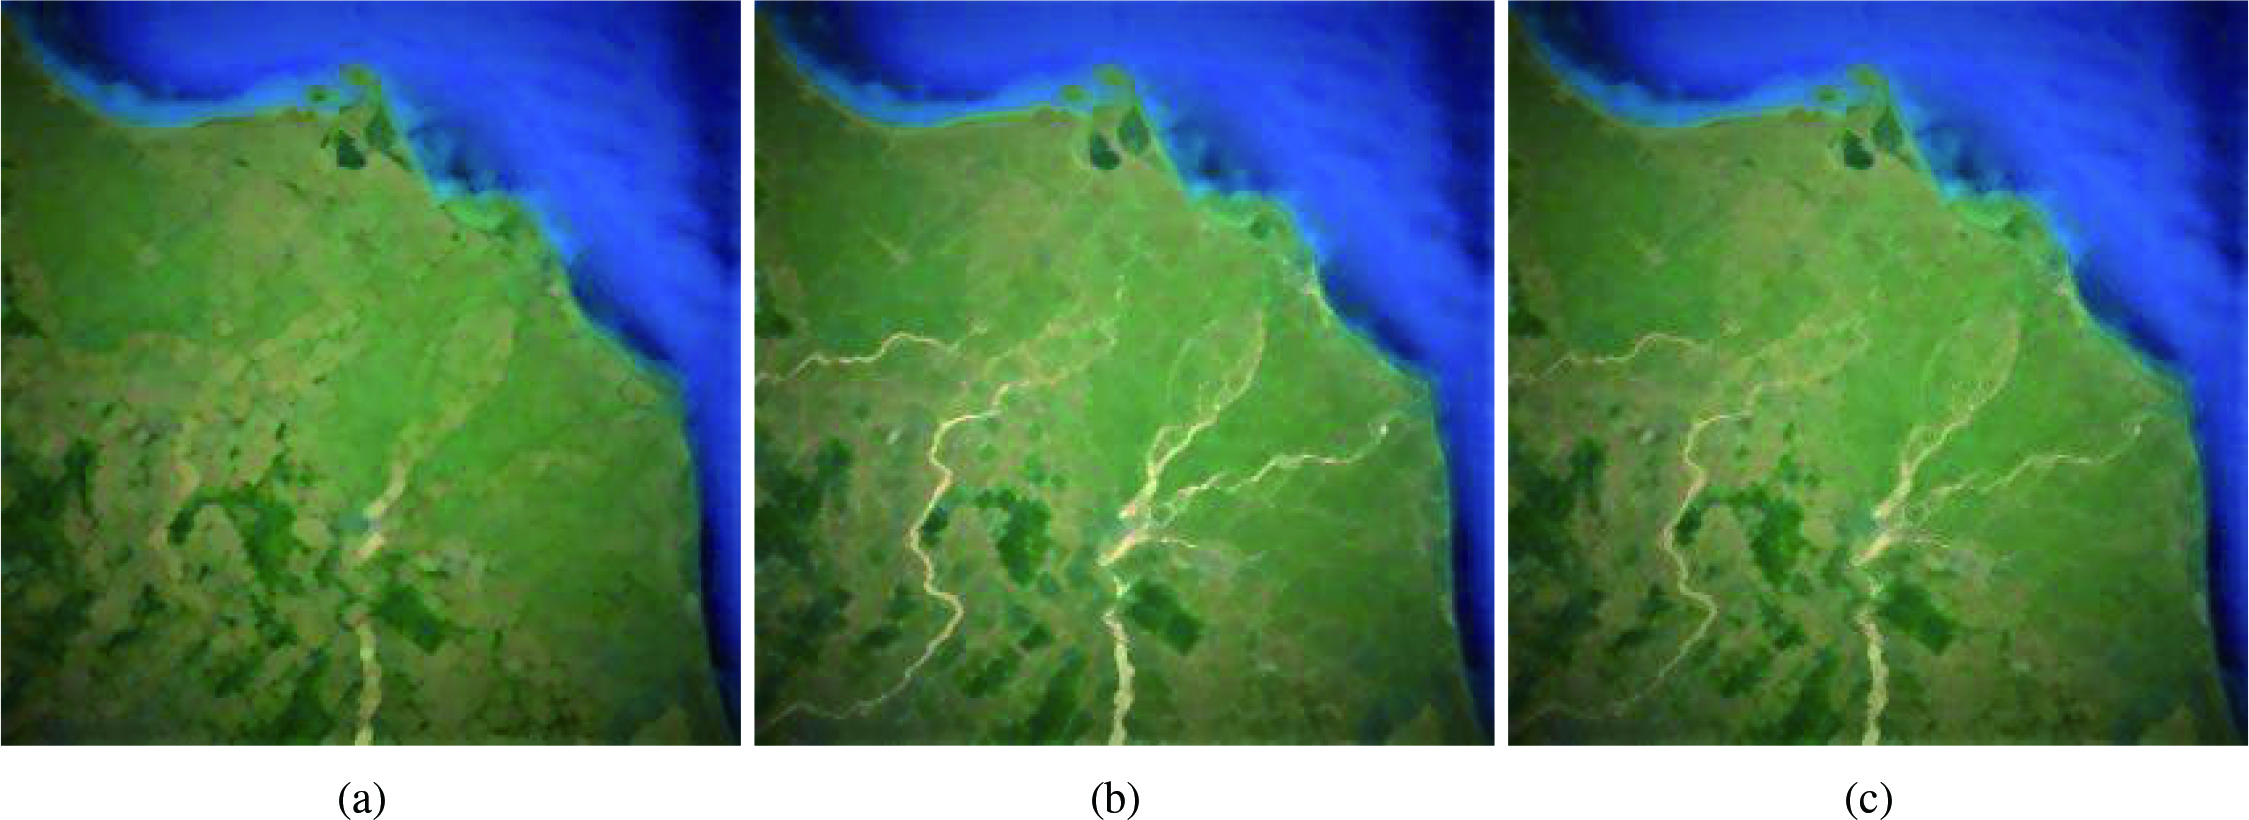
In this research work, land cover image processing is carried out using fusion based multiclass classifier. Five number of performance metrics such as precision, recall, f1-score, overall accuracy, Cohen’s kappa coefficient is adopted to measure the performance of proposed FMC with existing classifiers such as NBC, DT, KNN3, KNN5, KNN7, and CNN. All these mentioned metrics are evaluated from the confusion matrix or error matrix. It is a matrix of predicted and actual performance result of a classifier. Based on the confusion matrix (
Considering the values of
Image pre-processing
As discussed earlier, three image datasets are randomly collected from Google Earth, whose actual locations are mentioned in Figs 3–5. These images are cropped to the size of (280
The PSNR and SNR are typically adopted for quality evaluation of the fused image. Table 3 highlights the comparison among the pixel-level fusion technique with two other fusion techniques such as DWT fusion technique and PCA based image fusion technique.
Comparison between three fusion techniques by quality measurement metrics PSNR and SNR
Comparison between three fusion techniques by quality measurement metrics PSNR and SNR
Result of morphological opening (a), closing (b), and corresponding fused image dataset3.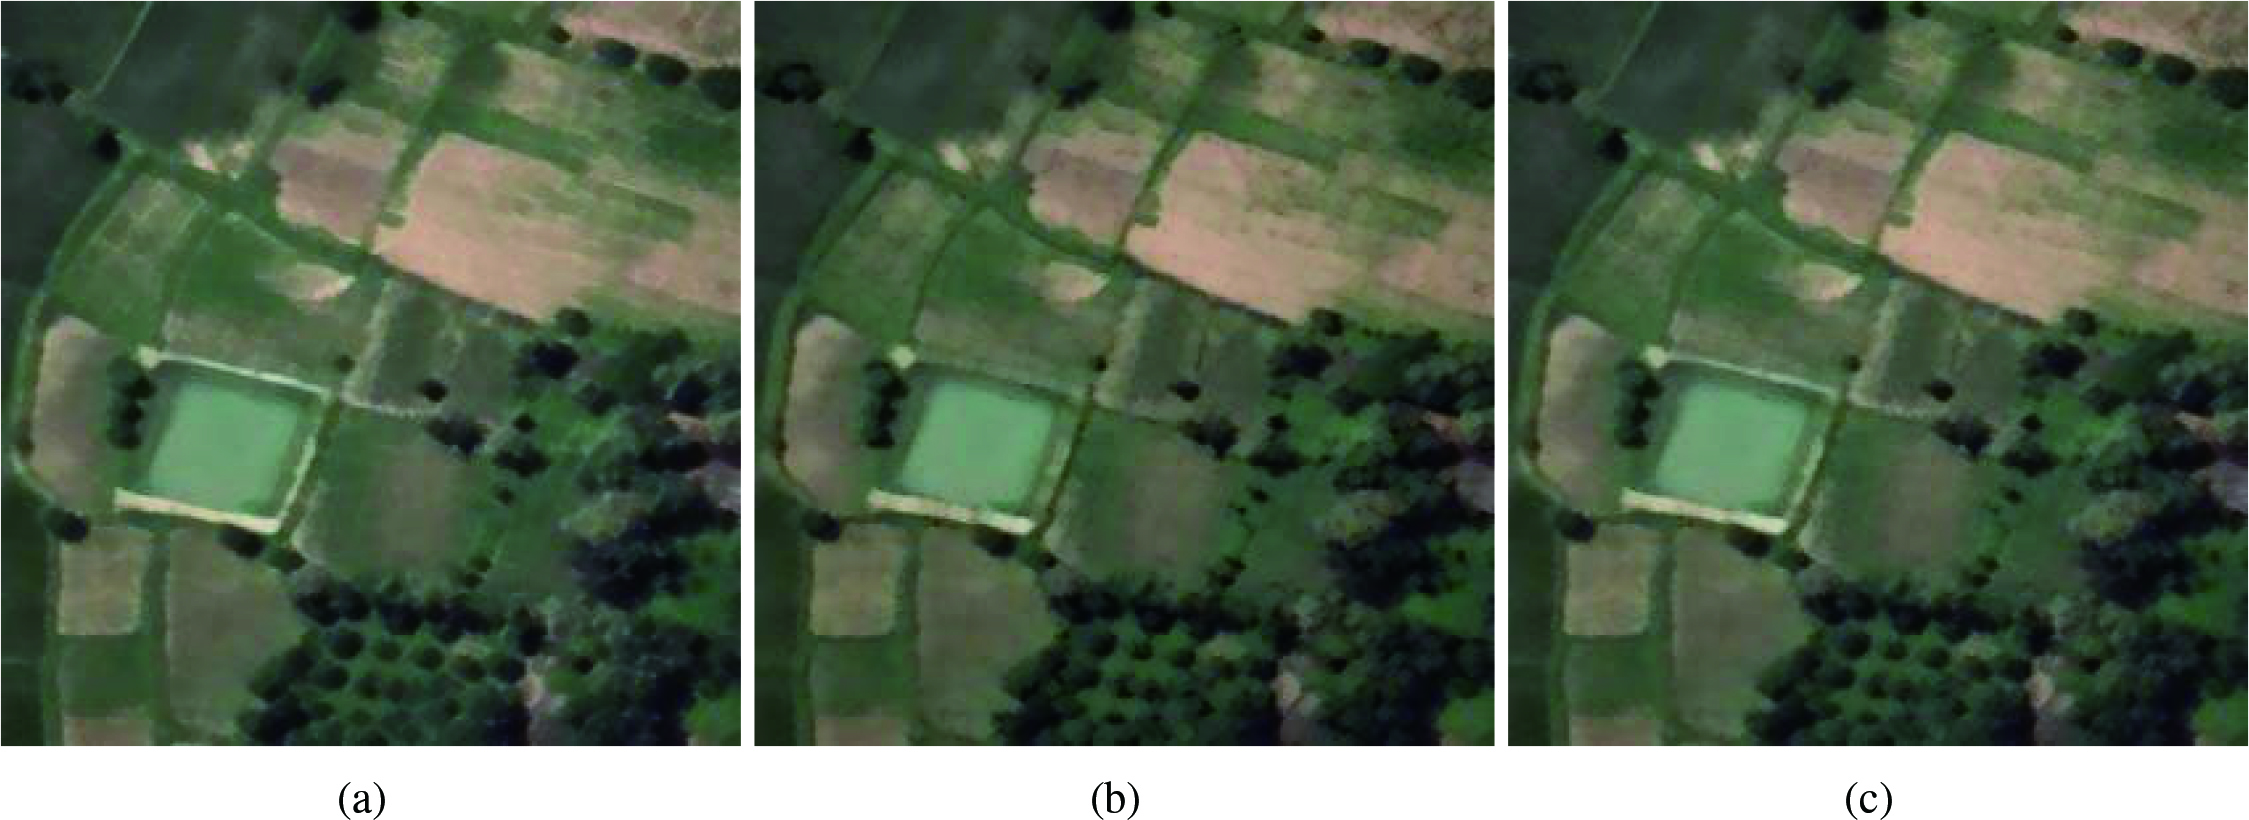
Re-coloured classified image dataset1 (a), image dataset2 (b), image dataset3 (c).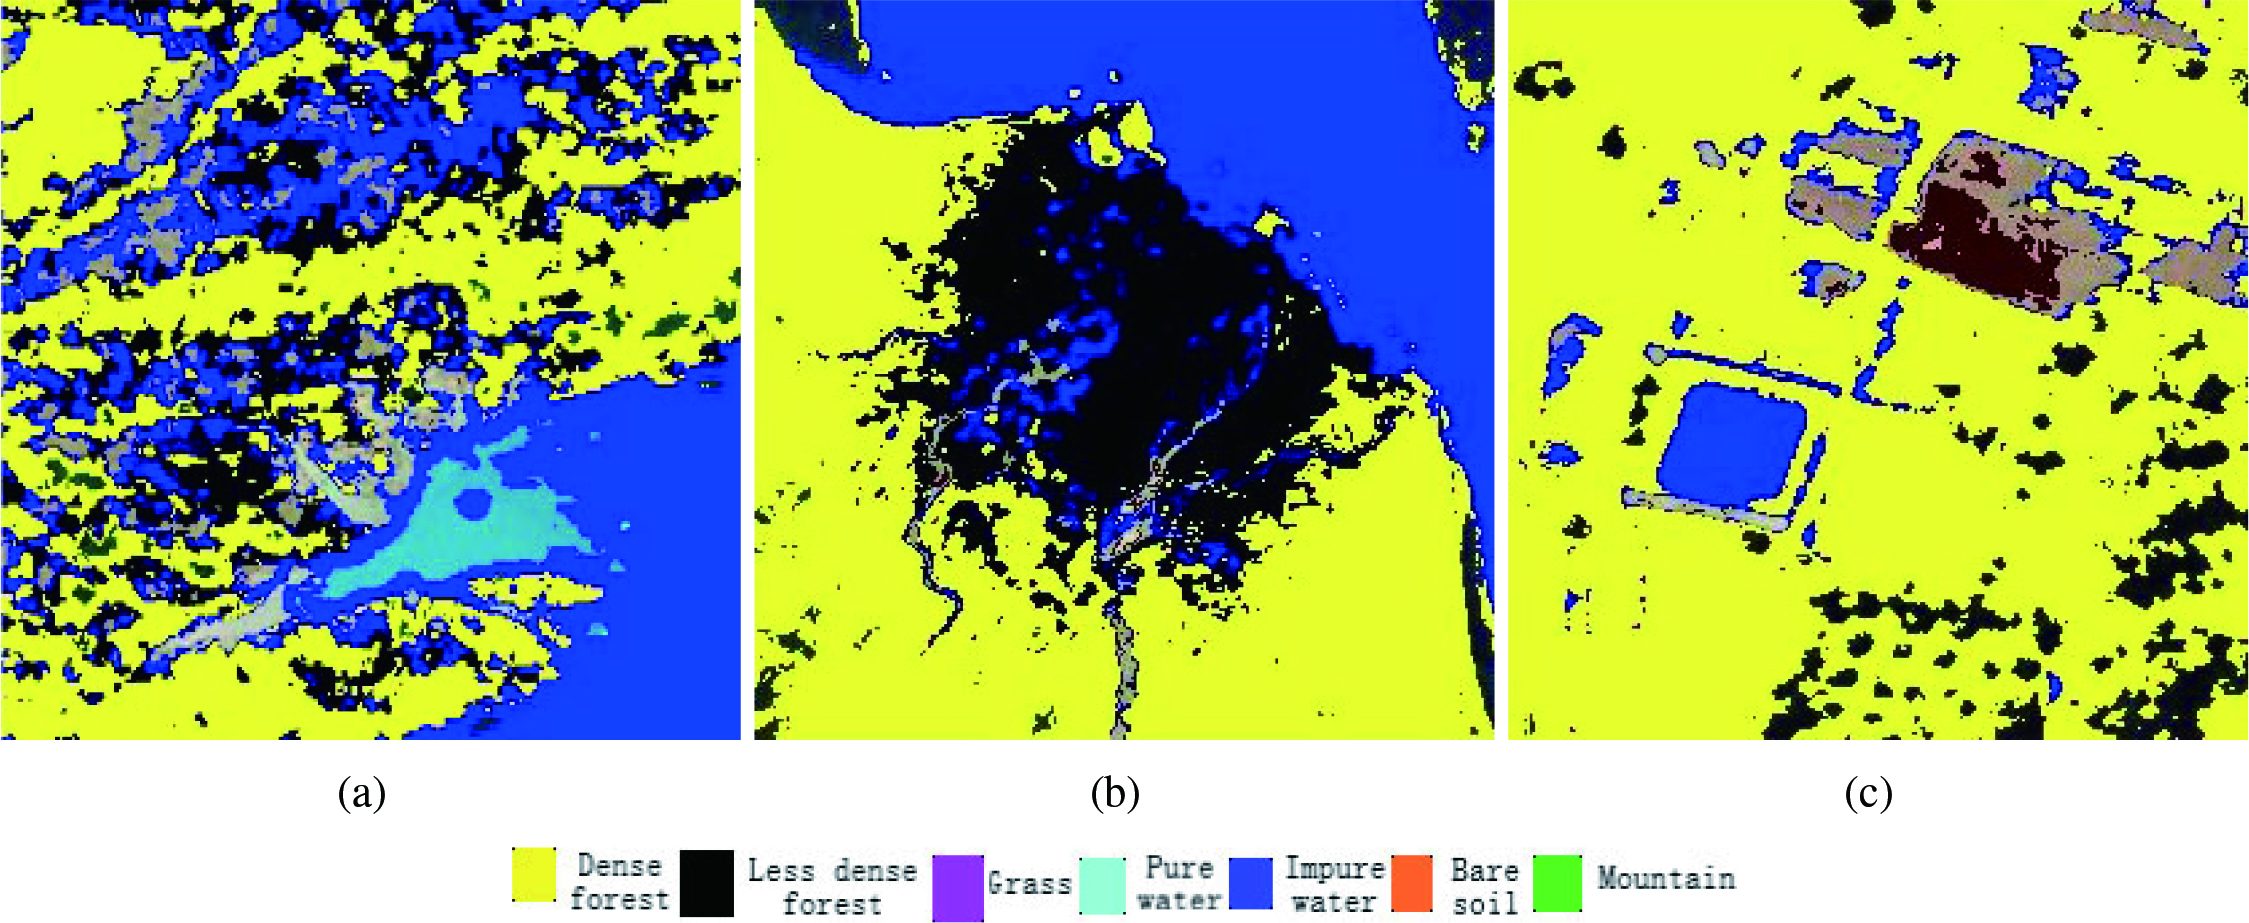
Precision, recall, f1-score of each class level of proposed FMC and considered classifiers on image dataset1
Precision, recall, f1-score of each class level of proposed FMC and considered classifiers on image dataset2
The output of the discussed image pre-processing stage is presented in Fig. 6c, Fig. 7c, and Fig. 8c. These images represent the fused images of image dataset1, image dataset2, and image dataset3. These fused images are served as the inputs for the next stage. For implementing of FMC algorithm, first, the R, G, and B value of each pixel of fused image is extracted and compared these intensity values with R, G, B value of training dataset to obtain the class level of each pixel. According to the class level, each pixel is re-coloured with reference to Table 2. The resultant three re-coloured images of three fused images Fig. 6c, Fig. 7c and Fig. 8c are shown in Fig. 9a–c.
Result analysis
In this experiment, the precision, recall, and f1-score [29] of each class level are calculated. The validity of prediction by proposed FMC is analysed comparing with NBC, DT, KNN3, KNN5, KNN7, and CNN for each class based on these metrics. The architecture of CNN constitutes 1 convolution layer, 1 max pooling layer, and 3 FC layers for our experiment. Tables 3–5 show the classification result for the input image dataset1, image dataset2, and image dataset3 respectively.
From Table 4, the FMC classify Class 2, Class 4, Class 5, and Class 6 with high precision and recall value. On the other hand, NBC, DT, and KNN3 show high precision and recall value for only one class label such as Class 3, Class 7, and Class 1 respectively.
The f1-score of Class 2, Class 4, Class 6 is the highest in the case of FMC. So, from this Table 4, it is observed that FMC can be considered to be a better performing classifier in comparison to rest classifier for image dataset1. However, evaluating with respect to only one image dataset, analysis can’t be concluded, hence two more images are analysed in the next two tables.
Precision, recall, f1-score of each class level of proposed FMC and considered classifiers on image dataset3
Precision, recall, f1-score of each class level of proposed FMC and considered classifiers on image dataset3
Average precision, average recall, average f1-score, overall accuracy, kappa coefficient of image dataset1 with respect to considered classifiers
From Table 5, the proposed FMC shows high precision, recall, f1-score for Class 3, Class 4, Class 5, and Class 7. However, DT also shows higher side performance for Class 1, Class 2, and Class 6. Therefore, DT shows superiority over FMC on image dataset2. On the other side FMC identifies maximum number of classes [i.e., Class 3, Class 4, Class 5, and Class 7] as compared to DT [i.e., Class 1 and Class 2]. Hence, for image dataset2, the performance of FMC and DT is comparable. Therefore, another image dataset is taken for deeper analysis purposes, which is listed in Table 6.
Average precision, average recall, average f1-score, overall accuracy, kappa coefficient of image dataset2 with respect to considered classifiers
Average precision, average recall, average f1-score, overall accuracy, kappa coefficient of image dataset3 with respect to considered classifiers
Overall accuracy of all classifiers for image dataset1 (a), image dataset2 (b), image dataset3 (c).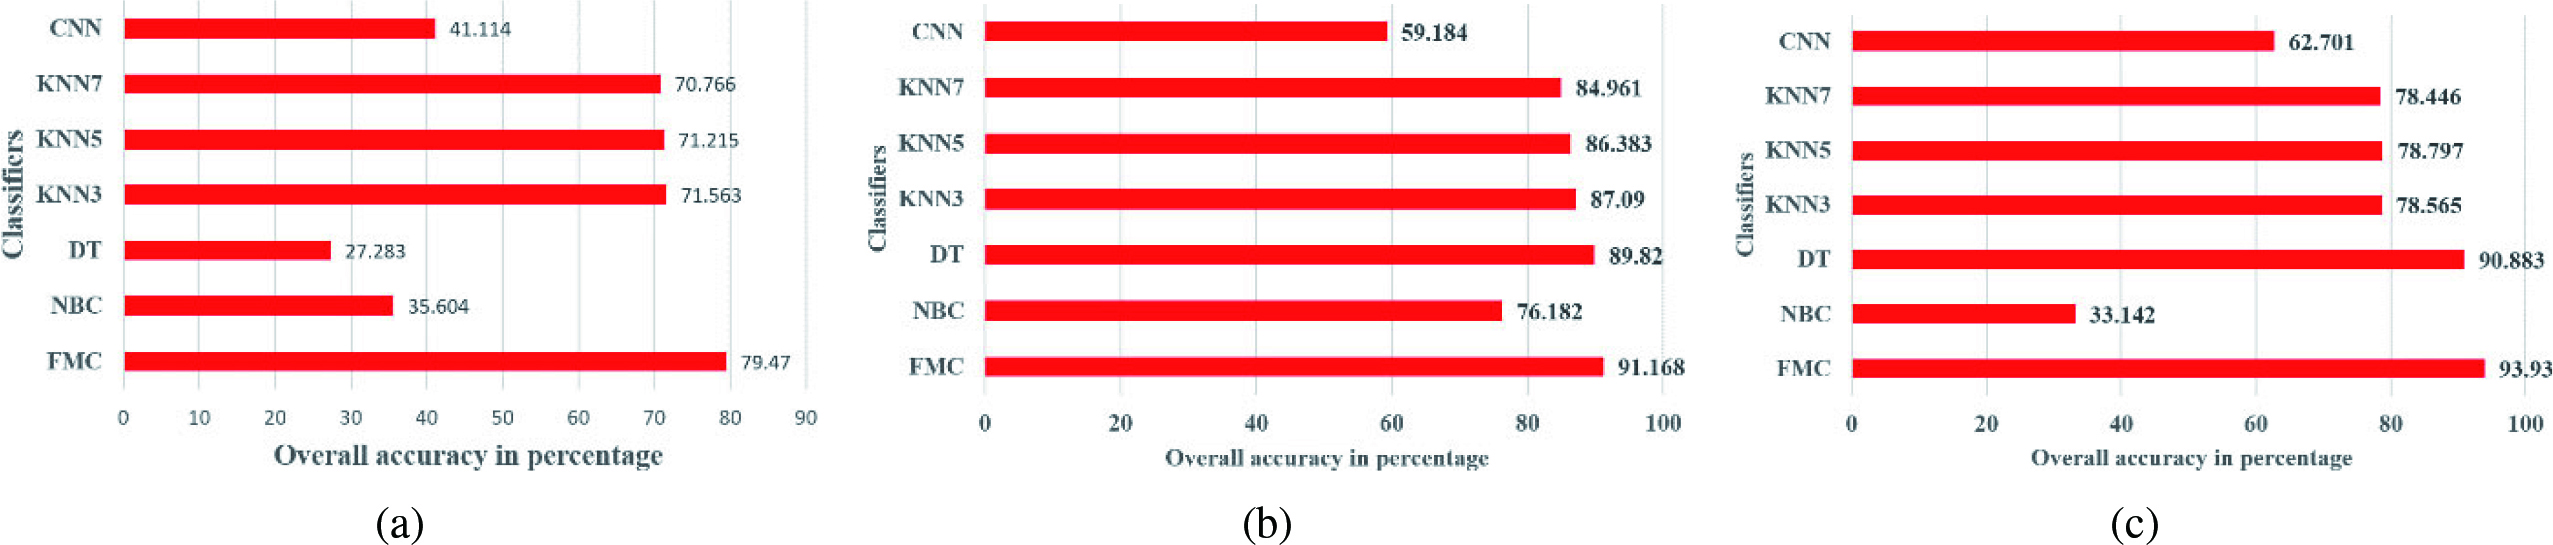
Shows kappa coefficient value of all classifiers of image dataset1 (a), image dataset2 (b), image dataset3 (c).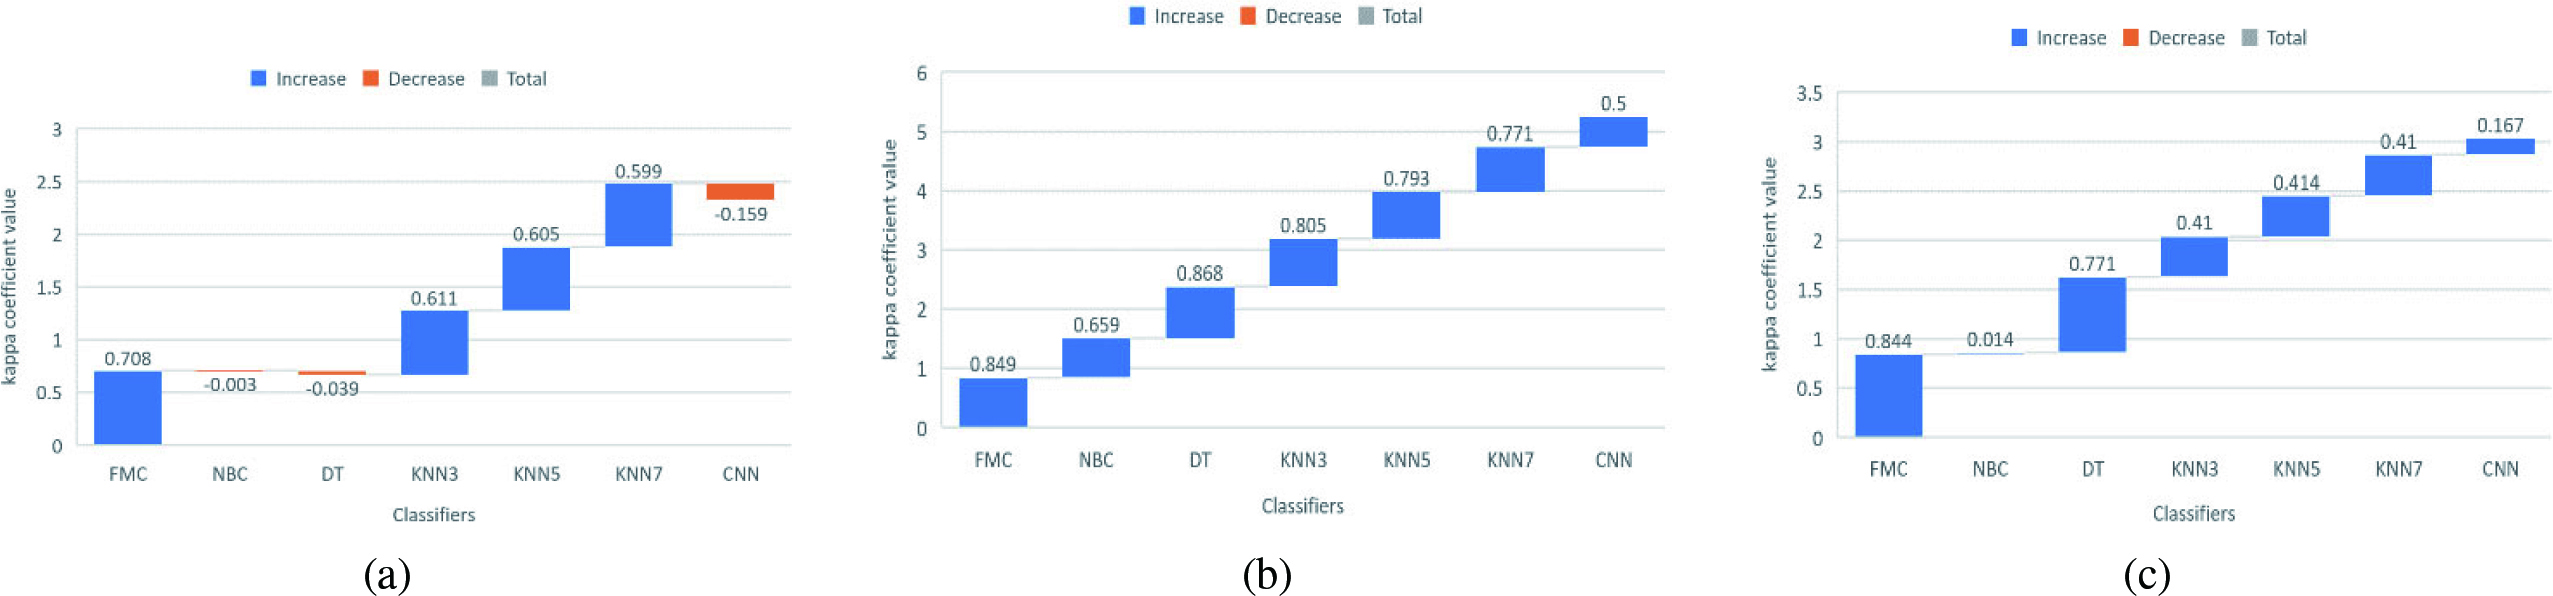
From Table 6, the proposed FMC shows the maximum number of class identification with high precision, recall and f1-score value for Class 2, Class 3, Class 4 as compared to DT and NBC.
Further in another direction, the performance of FMC is analysed by the other two metrics such as overall accuracy [15, 40] and kappa coefficient value [1, 13]. The overall accuracy of a classification model is the accuracy of the classifier for all classes rather than a single class, which is calculated from Eq. (17). Similarly, the objective of the kappa coefficient is to measure the agreement between classification and true value. It can be computed from Eq. (4.3).
Each classifier is trained with the training dataset of 3 features and seven number of class levels. The training accuracy of each classifier is evaluated as FMC (98%), DT (99%), NBC (95.15%), KNN3 (98.10%), KNN5 (97.18%), KNN7 (96.71%), and CNN (max 91%). The overall accuracy (testing accuracy), kappa coefficient value of each classifier is listed for image dataset1, image dataset2 and image dataset3 in Tables 7–9 respectively. It is quite difficult to analyse precision, recall, f1-score of each class level of each classifier, so the average precision, average recall, and average f1-score are also shown in the same table.
Shows a comparison between kappa coefficient and overall accuracy of each classifier of image dataset1 (a), image dataset2 (b), image dataset3 (c).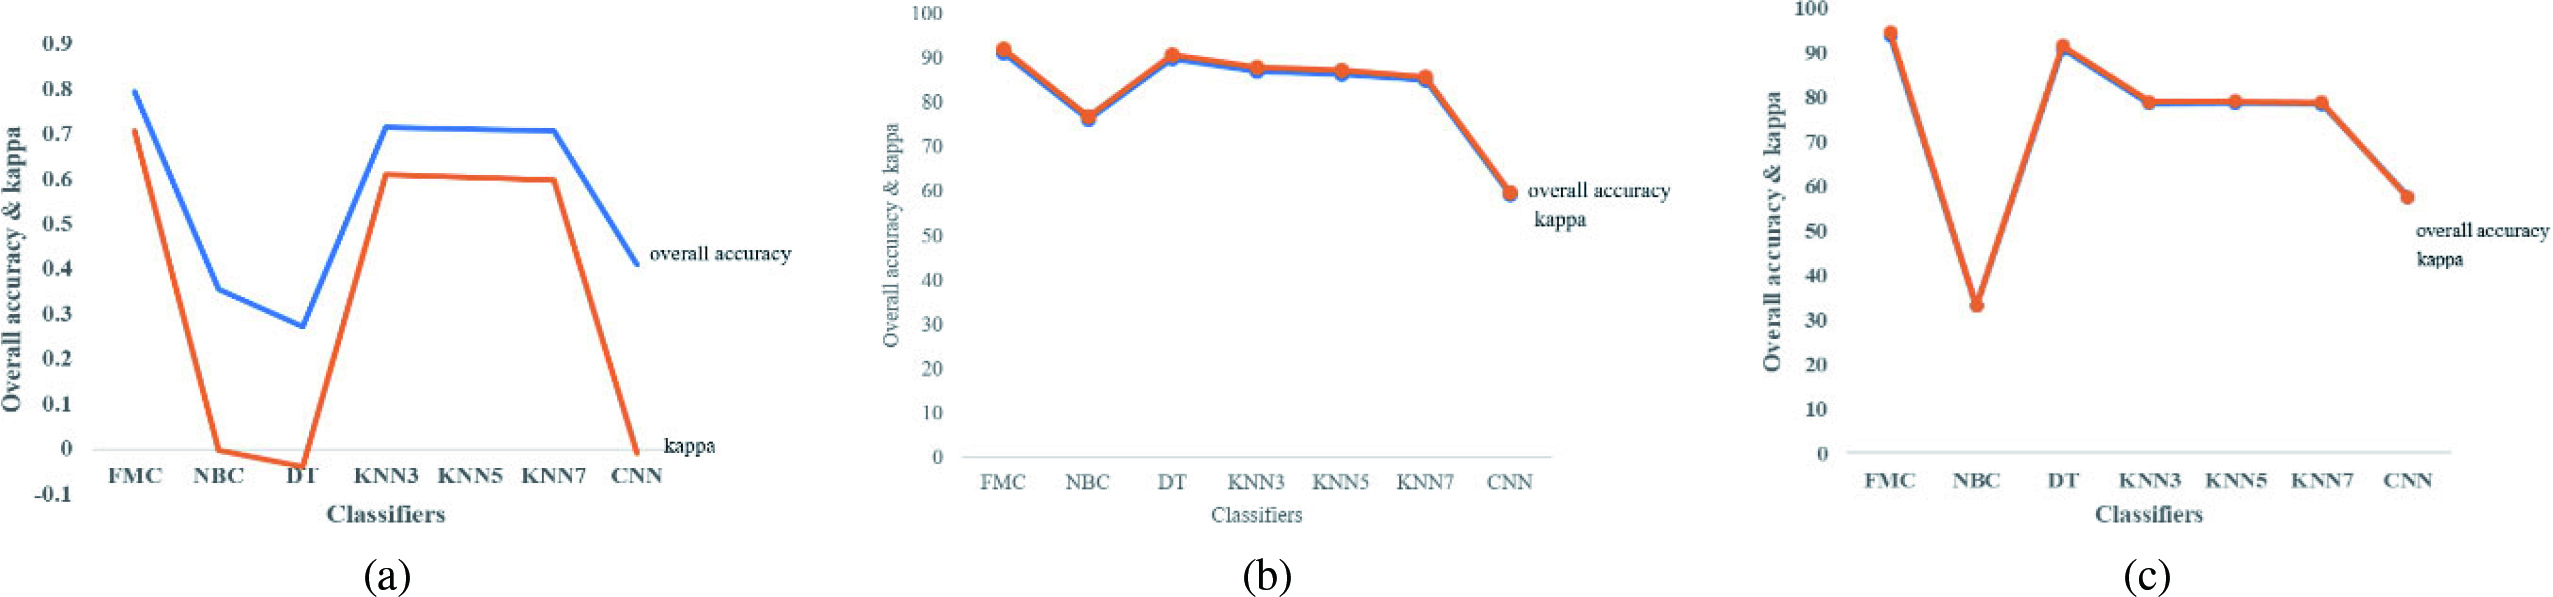
In Table 7, the average precision, average recall, average f1-score is the highest in the case of proposed FMC. The FMC is considered to be more suitable classification model to handle overall classes as compared to other classifiers for image dataset1.
In Table 8, the FMC has the highest performance for three metrics such as recall is 0.605, overall accuracy is 91.168% and the kappa coefficient is 0.849. Further for the rest two metrics, FMC shows comparable result for image dataset2. This indicates the superiority of FMC over other classifiers.
In Table 9, the FMC model has the highest average precision and recall value for image dataset3. This signifies the FMC is a more suitable classification model to handle all classes.
The overall accuracy of all classifiers for the three images is also presented in Fig. 10a–c. The figure shows the overall accuracy of FMC is the highest among all considered classifiers.
The kappa coefficient value varies between 1 to
A good classification model should have good accuracy and kappa value and both values should be close to each other. The proposed FMC classification model has closed values of overall accuracy and kappa value for image dataset1, image dataset2, and image dataset3 in Fig. 12a–c as compared to other classifiers.
This research work presents a fusion based image classification approach for a land cover image. The input images are randomly taken from Google Earth for the classification maps. The employing of morphological (i.e., closing and opening) operations and fusion techniques are highlighted in the image pre-processing stage. Then designed classifier FMC is employed on pre-processed image data. A comparative result is shown taking a few other classifiers such as Naïve Bayes classifier, Decision tree, KNN3, KNN5, KNN7, and CNN. Entire experimentation is carried out taking five performance metrics such as precision, recall, f1-score, overall accuracy, and kappa coefficient metrics. Finally, the overall analysis shows FMC shows its superiority over other classifiers for all considered images.
The purpose of this model is used to classify seven numbers of features of any land cover image and develop a system which monitors the changes on the surface of the earth. However, the designed approach can’t be restricted to land cover image only and can be used to classify any RGB image which is the future work of this research approach.