
Abstract
Animal Vehicle Collision (AVC) is relatively an evolving source of fatality resulting in the deficit of wildlife conservancy along with carnage. It’s a globally distressing and disturbing experience that causes monetary damage, injury, and human-animal mortality. Roadkill has always been atop the research domain and serendipitously provided heterogeneous solutions for collision mitigation and prevention. Despite the abundant solution availability, this research throws a new spotlight on wildlife-vehicle collision mitigation using highly efficient artificial intelligence during nighttime hours. This study focuses mainly on arousal mechanisms of the “Histogram of Oriented Gradients (HOG)” intelligent system with extracted thermography image features, which are then processed by a trained, convolutional neural network (1D-CNN). The above computer vision – deep learning-based alert system has an accuracy between 94%, and 96% on the arousal mechanisms with the empowered real-time data set utilization.
Introduction
According to the World Health Organization (Feb 2020), global vehicle crash fatalities are estimated annually as high as 1.35 million. As per Defender’s Organization (Sep 2011), the total [1] estimated American spending is over $4 billion annually for property damage, and the mortality rate is around 200 per year due to Deer-Vehicle Collision. Deer are lethal for vehicle crashes, especially in Europe and North America. According to Farm Progress (Nov 2010), the U.S. faces 1.5 million Deer-Vehicle Collision (DVC) yearly. National Highway Traffic Safety Administration [2] unveiled: deer-car accidents killed 200 Americans causing more than 10,000 personal injuries. According to [3], the insurance claims for animal collisions are as high as 1.9 million between July 1, 2019, and June 30, 2020. Deer-Vehicle collision claims contributed to 1.5 million for the above estimated period. Most of these claims come from West Virginia, which tops the ungulate collision for the last five years. The statistics in [3] show that 1 in 37 vehicles faces a Deer-Vehicle clash compared to 1 in 38 deer-vehicle crashes in West Virginia. All the advanced technologies and mitigation measures failed to eliminate this edge habitat hazard due to extensive urbanization.
The current work focuses on an arousal system based on the real-time test data collected from the edge habitat and dense forest of San Antonio, Texas, during nocturnal (i.e., dark) hours. Texas State, with its natural landscape, rolling hills, deserted plains, winding highways, and dense population of wildlife with a highest of 3.6 million white-tailed deer, makes it a vivid candidate for the Deer-Vehicle collision study.
Deer-Vehicle collisions’ mitigation comprises of two types: driver behavioral change and the other is ungulate behavioral change. Changing driver behavior comes with public awareness. The second is signage usage in collision hotspots, and the final one is to reduce the speed physically with the help of chicanes or speed bumps. The wildlife behavior change is a multi-prong approach with unpredictable results. However, the process includes changing the road color, surface by distracting animals from the roadways. Secondly, prevent animals from road crossing by equipment usages such as fencing, ultrasonic whistles, and reflectors. Lastly, allow animals to do safe crossing by using additional structures like escape routes and underpasses. All the preventive mechanisms have failed to prevent the deer-vehicle crashes in this scientifically advanced era. That’s why this study focuses on the arousal mechanism (bifold approach) followed by its initial implementation of hotspot identification of deer during accident-prone hours between dawn and dusk in [4] (Texas Department of Transportation states). In [5] author has established hotspot identification using thermography with the implementation of Convolutional Neural Network (CNN) and Histogram of Oriented Gradients (HOG). This intelligent system utilizes the efficiency of thermal images, machine learning, and computer vision techniques for higher accuracy on deer detection.
Crash warning systems, commonly called the pre-crash system, are used for collision mitigation mechanisms, including sensors, motion/event detection, and response/decision sub-systems. Early-warning or crash-warning systems perform risk analysis by involving systematic dataset collection, risk assessment, or deer detection of hazardous spots/time and arousal system. An effective arousal system consists of four significant functions: risk analysis, monitoring, dissemination, and response-ability. Deer-Vehicle collisions have existing warning systems across various geographic locations. For instance, Minnesota Department of Transportation (MnDOT) used its enhanced deer warning system, which used passive infrared devices for detection-making while it also comes with solar panels for its power generation and wireless communication.
The traditional/passive road system sinology and additional structures gradually decreased vehicle collision; however, this mechanism to mitigate animal/deer-vehicle collision comes with a high financial cost [6]. The abovementioned active warning systems have reduced the crashes to 60%, but still this is not considered as an efficient mitigation rate [7]. With the identified pitfalls of the traditional approaches, vision detection systems may be efficient, robust, and reliable in reducing WVC. However, misdetection and misclassification, along with false positives on intelligent strategies on the hotspots, are prone to happen. This study focuses entirely on the deer-vehicle collision’s unaddressed dimensions using deep learning techniques for the precarious nighttime aiming at increasing the reliability of the alert system.
Driven by image-based detection of the animals, the proposed response system assists the driver receive on-time various types of alerts. Without the response system, the system’s objectives are deteriorated and obsolete. The response interface has different types of watches, like alert notification via text message display (text), prompt alarm (beep sound), and red-light alert (red light). Due to reduced light in nocturnal hours and driven by the factors such as availability of heat radiation, texture, low contrast, and distance, a thermal camera is used instead of a standard camera. Figure 1 shows an example of an image captured during a nocturnal period with the thermal camera. Motivated by the possibilities offered by thermal imaging, the current work explores the processing of acquired thermal images by a camera mounted on a vehicle with the goal of identifying the object’s presence based on photographic representation and alerting the driver on-time. This research targets a result-oriented intelligent system framework design from to enhance transportation safety from the driver perspective as opposed to traditional measures that are taken from the animal perspective.
Thermal Image sample captured after 8:00 PM.
In summary, the objectives and contributions of this paper are to,
Design and develop an intelligent system utilizing the synergism of HOG – 1D-CNN applied for for the detection of wildlife (deer), Implement an efficient Response System to alert the driver of the vehicle.
This paper progresses as follows: literature study section explains about different countermeasure ideas and techniques, which vitalize the current research’s basic concepts. Intelligent system section states the whole methodology of the system design and response system. The results section shows the findings of the proposed approach in bar charts and tabulation, and the last section concludes the paper.
This section elucidates the existing work related to animal-vehicle collision mitigation in urban highways or highly dense areas. The plethora of suggested solutions in the papers exhibit that researchers are persistently working to meet the target.
With the government’s help, the U.S. transportation department [4] implemented basic techniques like constructing bridges across the road in shady environments, reflectors, speed-limits, signboards, and fencing. The prediction of animal behavior is highly challenging, making this social model ineffective [7]. The U.S. transportation department again invests enormous amounts for the construction of overpass and underpass in highways (in US191, US$400K and US$2M respectively), which considerably reduced road accidents but is not adequately productive [8]. Notably, in [9] the author proposed area-independent methods for the estimation of number of collisions occurred due to wild animals in daylight period.
In thermal image analysis, computer-based technology played an extraordinary role in the last few decades. These computer vision algorithms mainly use feature detection, interpretation, and classification [10]. Significantly, gradient-oriented, or contour-based methods are used for feature detection from the acquired image [11]. The different animal stances like inactive, leaping, walking, semi-sitting, and standing are detected by a depth-based tracking system in [12]. The detection of wild animals is more critical because of these types of stances and their sudden reactions. In [13] the author proposed the basic warning system to alert both the animal and driver through various sound signals. Author in [14] suggested the Roadside Animal Detection System (RADS) used in cypress park and Florida highway 41 uses daisy-chained infrared sensors running parallel on each road-side. The Colorado Department of Transportation (CDOT) installed Wildlife Detection System with sensors under Colorado Highway 160. CDOT warned the vehicles through roadway light up upon animal detection. Animal Detection & Driver Warning System (Colorado) used buried electromagnetic cable for its animal detection. In [15] author implemented a buried cable protection system combinedly with the collaboration of Virginia Tech Transportation Institute and Virginia Department of Transportation, whereas only flashing light was used as the warning system.
The importance of mounting active and passive infra-red sensors in vehicles and generating images are shown in [16]. The significance and implementation of dynamic warning systems due to weather condition, speed, and weight combination of the vehicle, animal, and humankind presence are explained in [17]. Author in [18] discussed the alerting system with speeding consideration. This approach has fewer scenarios to alert the driver based on animals’ detection and requires a hardware model. The alert system is used to alert the driver when the speed limit violation happens, or any animal detection is predicted in the roadways, explained in [16]. In [19] author proposed a model that sends signal warning to the web, signal to wildlife, and migration database, based on the camera input and motion detection. These systems help reduce humans and deer fatalities and decrease highway road accidents, especially during the nocturnal period.
In a divergence from the research described above, none of the existing techniques intended for animal detection and alert notification during the nocturnal period to the best of the authors’ knowledge. This idea rejuvenated the following research: a promising intelligent system for implementing advanced transportation systems that integrates machine learning and computer vision technology as part of the response or alert system.
Intelligent system
This section discusses three main stages of the proposed system: data collection, image detection, and mainly focus on the alert/response system. This section explains the implementation of a response or alert system using computer vision-based HOG and pre-trained 1D-CNN to detect wild animals. The response system aims to help the driver eliminate road crashes due to the high time sensitivity and accuracy of road-side wild animal detection during nocturnal periods only. The confusion matrix, probability calculation will give the number of detection and misdetection rate, whereas the response system will push the alert notification.
Thermal camera and thermal images
Thermal images, also called thermogram images, measures the heat emitted from an object in the form of infrared radiation. The image or entity will have more clarity or intensity because the hottest regions will produce high radiation.
Thermal camera operational process.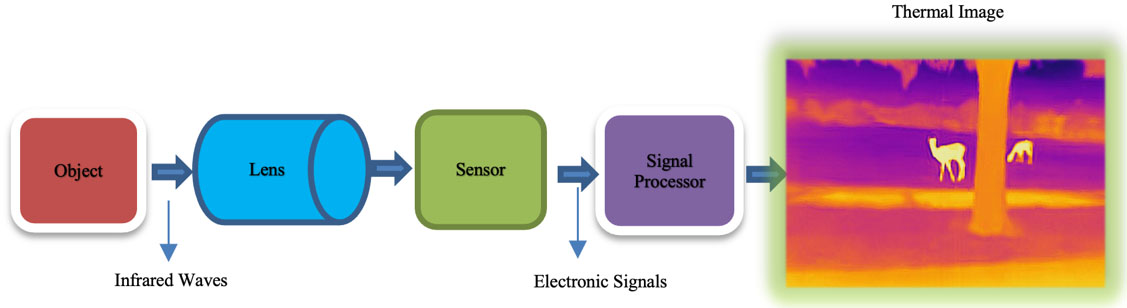
The method of capturing the infrared radiation differentiates night vision and thermal camera images. In [20] author discussed the shorter and longer wavelength radiation of the object. The night vision camera works under the principle of capturing the shorter wavelength, and the thermal camera works under the principle of capturing the longer wavelength. The FLIR ONE Pro camera used for data collection will work on the higher or longer wavelength synergism. Based on the presence of assorted objects, the wavelength emission varies in the radiation. Thermal images have both warmer and cooler things. The high-temperature areas appear red, yellow, or orange and the low and moderate temperature areas appear purple, blue, or green. Figure 2 shows the entire image acquisition process. The camera lens set focuses on the infrared waves emitted from the object and the light focused by the detectors’ array, which is called a thermogram image. Then the sensor converts the object captured into the form of electronic signals (impulses), which is given to the signal processor. The processor will convert the impulses into thermal images. The input thermal sample images consist of different deer postures and the non-existence of deer shown in Fig. 3.
Thermal images with and without deer.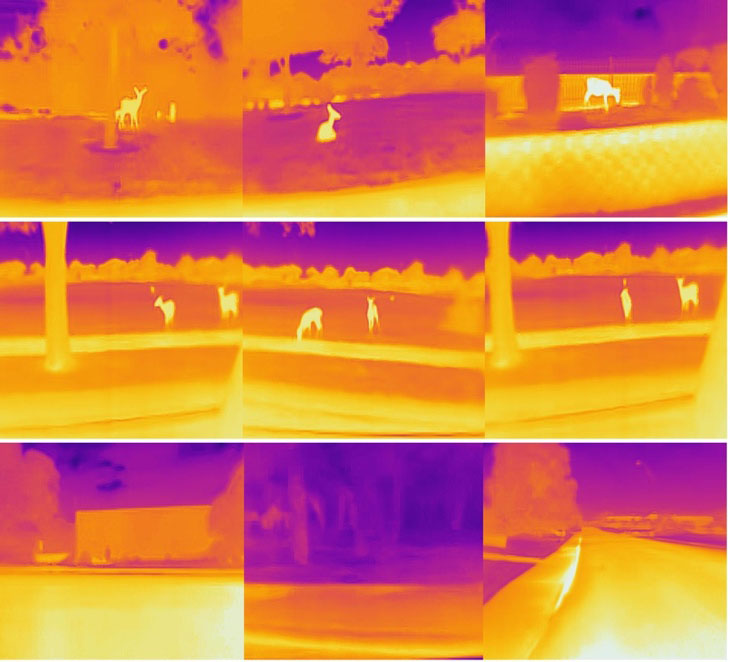
In this research, Forward-Looking Infrared (FLIR) thermal camera FLIR ONE Pro for an iOS device is used for capturing the deer image during nighttime hours. The basic principle and operational process are clearly explained in the previous section, thermal camera and thermal images. The FLIR operating temperature One pro camera is between 0 to 35 degrees centigrade with the scene dynamic range of
This section explains the data collection and the images used for the proposed system. The data set consists of occluded images, lightly visible images, faraway images, blurry images, and multiple object images. The proposed response system’s datasets comprise data collected every day between 6 pm to 10 pm for two consecutive weeks. In summary, the dataset is used for the proposed response system as follows.
For the proposed response system,
Total images – 1000 (Before filtering) Images used for the research – 800 (After filtering like resizing and cropping) Images with animal – 450 Images without the animal – 350
The challenges in data collection are
Animal unavailability due to rainy and high dense foggy nights, The distraction of animals due to increased vehicle speeding, and Extended hibernation due to the natural calamity.
More accidents occur during the nocturnal period, as explained in the introduction. The images are captured at different places around the San Antonio area in Texas, the USA, in November-December 2020.
The sample images shown in Fig. 3 are explained as the first row represents the postures like standing behind the tree, sitting on the grass ground, and eating the food. The second row shows the deer in different positions, and multiple objects are seen. Finally, the last row shows no deer on the roadside.
The 1440
The whole system is divided into four subsections, as shown in Fig. 4:
HOG Transformation – Extraction of Features. Machine learning Pre-Trained model – Convolution Neural Network (CNN) – Feature Extraction, Classification, and Detection. Image Detection – Accuracy Calculation – Confusion Matrix. Response/Alert System – Display Messages (Push Notification).
Block diagram of the proposed model.
The computer vision-based technique, Histogram of Oriented Gradients, is used as the pre-processing tool to identify the given image’s localized feature. This technique recognizes the gradient and edge detection information. The descriptor detects the feature of the image based on the shape, color, and dimension. In detail, the HOG transformation includes image normalization, gradient computation, gradient histogram computation, block normalization, and feature vector generation [21]. Gradient computation is known as image separation into cells and histogram computation on directions on each cell. The discretization of each cell into angular bins based on the order is known as orientation binning. The normalizing group of histograms is defined as the block normalization and serves as a block descriptor.
The HOG transformation setup and algorithm that identifies the object’s edges or features are shown in Fig. 5.
Preprocessing – Global Normalization (optional). Calculate the gradient magnitude image in x and y – Sobel Operator. Calculate the Histogram of Oriented Gradients in 8 Normalization across the blocks (16 Calculate and flatten the HOG feature vector.
HOG transform – Block diagram.
The input thermal image with dimension 640
The second section of the whole system is a machine learning classifier used to detect the animals’ features and general classification and detection. By using the pre-trained 1D-CNN network model, the accuracy is calculated based on the detection and misdetection. Here the detected 10 frames are fed into the proposed response or alert system. Based on the number of images detected and probabilities calculated by the computer vision-based machine learning system, the response system will display warning messages including red light alert, change the direction, high alert, slow down the speed, wake up, and low-level warning, as shown in Fig. 6.
Response/alert system – Detailed block diagram.
The Response/Alert system algorithm are as follows:
Thermal Image input from directory (10 image frames per run) HOG image Conversion – HOG Transformation Use Pre-trained 1D – CNN model for Detection/Misdetection Calculate the Accuracy based on the probability measure of the image Based on the number of detections the alert messages are displayed
Create the if else loop,
if number of detected images is == 10
Message: Red Light Alert
if number of detected images is
Message: Change the direction
if number of detected images is
Message: High Alert
if number of detected images is
Message: Slow Down the Speed
if number of detected images is
Message: Wake Up
if number of detected images is
Message: Low Level Warning
end
From the response system algorithm, step 4 will decide the push notification based on the detection count of the image from the given input 10 frames. All the 10 frames will be in the continue and consecutive order.
The current study confirms the experimental findings and their proposed solutions. Unfiltered and the Output Dataset of thermal images are discussed here. The result delivers optimal results of the current system’s accuracy and performance, which are incredibly time-sensitive. This section summarizes the challenges faced due to the dataset collection and the contribution made.
Result analysis
Image classification
Deer Images that are collected during various calamities make a vital contribution to image classification. Figure 7 shows the original thermal image and pre-processed HOG image from the proposed response system’s dataset. The dataset contains input thermal images of 640
Accuracy and alert notification obtained from 200 images for twenty test runs with deer
Accuracy and alert notification obtained from 200 images for twenty test runs with deer
Input thermal image(left) and pre-processed HOG image (right).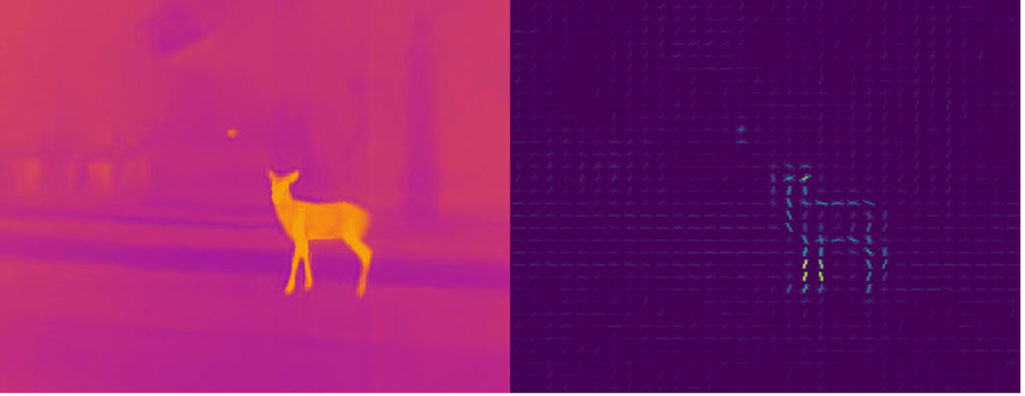
The accuracy of the proposed system is calculated by the accuracy equation (Accuracy
Accuracy and alert notification obtained from 200 images for twenty test runs without deer
Accuracy and alert notification obtained from 200 images for twenty test runs without deer
Accuracy and alert notification obtained from 200 images for twenty test runs with and without deer in different combinations
Accuracy chart for twenty sets of 10 image frames with deer.
Accuracy chart for twenty sets of 10 image frames without deer.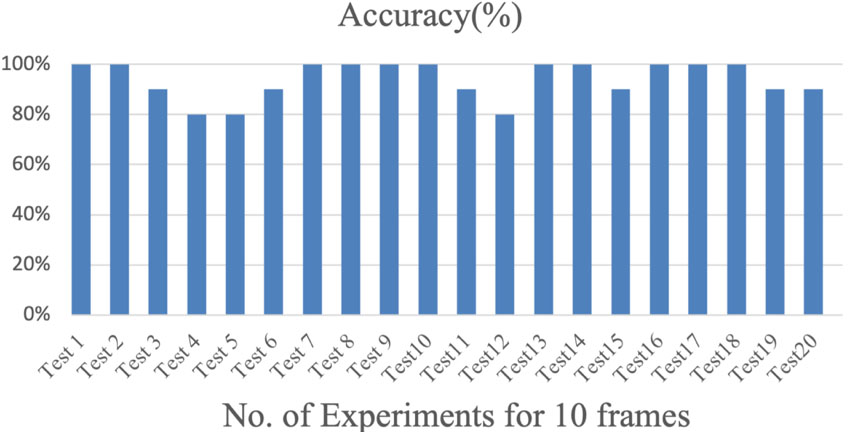
Accuracy chart for twenty sets of 10 image frames with and without deer.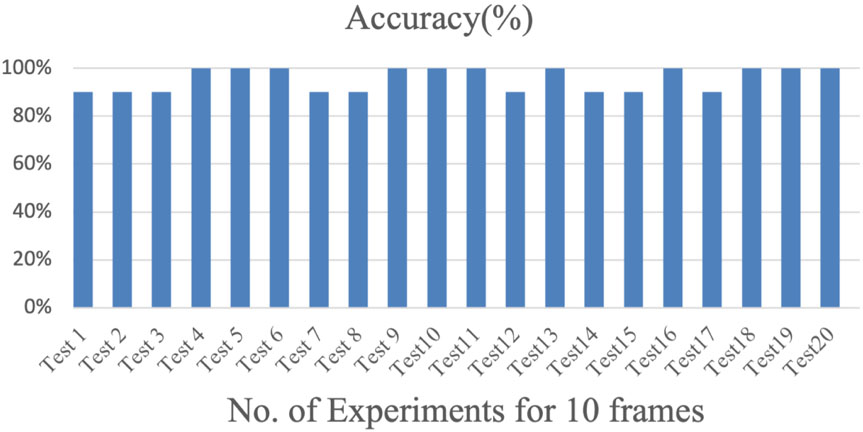
The notification alert messages for the response or alert system are as follows:
Alert 1: Red Light Alert Alert 2: Change the Direction Alert 3: High Alert Alert 4: Slow Down the Speed Alert 5: Wake Up Alert 6: Low-Level Warning
Tables 1–3 show the detailed form of accuracy, actual and detected image count, misdetection, and message notification based on the detection. For all the twenty experiments, different consecutive counts of 10 image frames have been taken for testing. The output generated from the response system based on the detection is shown in detail. This response system is more time-sensitive, and the time measured is very delicate.
Table 2 describes that test 1, 2, 7, 8, 9, 10, 13, 14, 16, 17, and 18 produces a maximum accuracy of 100%, and test 3, 6, 11, 15, 19, and 20 produces an average accuracy of 90% and test 4, 5 and 12 produces a minimum accuracy of 80%. On average, of all the combinations, the accuracy is 94%, which shows it is highly recommended for animal detection.
The deer’s action is unpredictable, and our proposed system must be more reliable, robust, and intelligent. Table 1 shows the time taken per frame to generate the alert message. The whole 10 frames need a maximum of 1.977sec and a minimum of 1.514sec to push the alert notification. Table 2 depicts the time required for the detection of one frame, and for all 10 frames, the maximum and minimum time required is 1.984 sec and 1.513 sec. Figure 9 shows a visual representation of the detail accuracy calculation.
Accuracy, processing time, and alert notification obtained from 90 images for time-centric condition (6:00 PM–7:00 PM)
Accuracy, processing time, and alert notification obtained from 90 images for time-centric condition (7:01 PM–8:00 PM)
Accuracy, processing time, and alert notification obtained from 90 images for time-centric condition (8:01 PM–9:00 PM)
Table 3 shows the alert notification from the response system with a detection accuracy of 95.5%. The maximum and minimum time required for the detection and to push the alert notification is 1.943 sec and 1.546 sec. Figure 10 shows the various accuracy changes based on the different image dataset combinations with and without deer. The Fig. 10 clearly shows that test 4, 5, 6, 9, 10, 11, 13, 16, 18, 19 and 20 produces 100% accuracy in the animal detection. Test 1, 2, 3, 7, 8, 12, 14, 15 and 17 gives the average and minimum accuracy of 90%.
The existing active warning systems are ample, but the implemented warning system is unique with its prediction model integration. The arousal system optimization and efficiency are tested under various variables to derive competitive results.
Time-centric arousal/notification system
All the learned studies have proven that deer are very active during nighttime. The intelligent system has been validated during different time frames to evaluate the proposed system’s performance.
The dataset collection images depend on the object’s temperature (deer) and its surroundings; that’s why this time frame (6:00 PM–7:00 PM, 7:01 PM–8:00 PM, 8:01 PM–9:00 PM) based stress testing is shown in Tables 4–6. This table describes the test output accuracy, processing time, and alert notification for the combination of with deer, without deer, and blend of both. From all these time frames, the average accuracy output is shown as 90, 97, and 97. Here, 10 continuous consecutive image frames are taken for the test.
Accuracy, processing time, and alert notification obtained from 60 images for distance-based condition – Very Close (3 meters)
Accuracy, processing time, and alert notification obtained from 60 images for distance-based condition – Very Close (3 meters)
Accuracy, processing time, and alert notification obtained from 60 images for distance-based condition – Average Distance (5 meters)
Accuracy, processing time, and alert notification obtained from 60 images for distance-based condition – Far Away (10 meters)

From Fig. 11, the identified truth behind this time-based stress testing is, the time frame 6:00 PM to 7:00 PM produces less accuracy for all the three combinations when compared with the remaining time frames. This variation is because of the sun’s temperature; the first time period is just after the sunset, which means the ground, road, tree, and the curb all have high temperature compared to the remaining two periods. There are no high differences in the processing time for all three testings
Figure 11 shows the graphical representation of accuracy and processing time variation for all three times frame-based testing. The processing time for the time period 7:01 PM – 8:00 PM consumed less time than the remaining two time periods. The time differences between all the three periods do not have a big difference, shown in Fig. 11.
The vision-based distance estimation on the arousal/ warning system is used for result determination as distance plays a critical role in collision mitigation. The behavior of the animals is tough to predict. The distance measure plays a prominent role in the avoidance of collision in roadways. Here, in this research, approximate distance is calculated based on the vision estimation. In the future, the other way can be introduced as, from the captured image, based on the object presence, with the help of both x and y-axis value, the distance is measured. Based on the distance, three categories are introduced, very close, average distance, and far away. Distance-based stress testing is essential to check the efficiency of the system. Here the proposed system performance and efficiency are shown in Tables 7–9.
Accuracy, processing time, and alert notification obtained from 60 images for seasonal condition – Spring Season – February, March
Accuracy, processing time, and alert notification obtained from 60 images for seasonal condition – Spring Season – February, March
Accuracy, processing time, and alert notification obtained from 60 images for seasonal condition – Fall Season – November, December
The distance-based calculation increases the likelihood of the proposed system. The vehicle’s speed, the distance of the deer, and travel time are the more complex models, which will increase the relative risk in the collisions. Therefore, the distance is measured and tested for the combination of deer presence and not presence and only with deer. Tables 7–9 shows the outputs for all three combinations. The very close scenario produces a 100% accurate result when compared to the other two scenarios. The second average distance produces an average accuracy percentage, and the third, far away distance, produces the same as the average percentage of the detection.
The pictorial representation of all three combinations is shown in Fig. 12. It shows the fluctuations in the accuracy and time required for the processing and pushes notification. In all three combinations, image frames with deer are detected most accurate, and the combination of both with and without deer have an average accuracy of 90%.
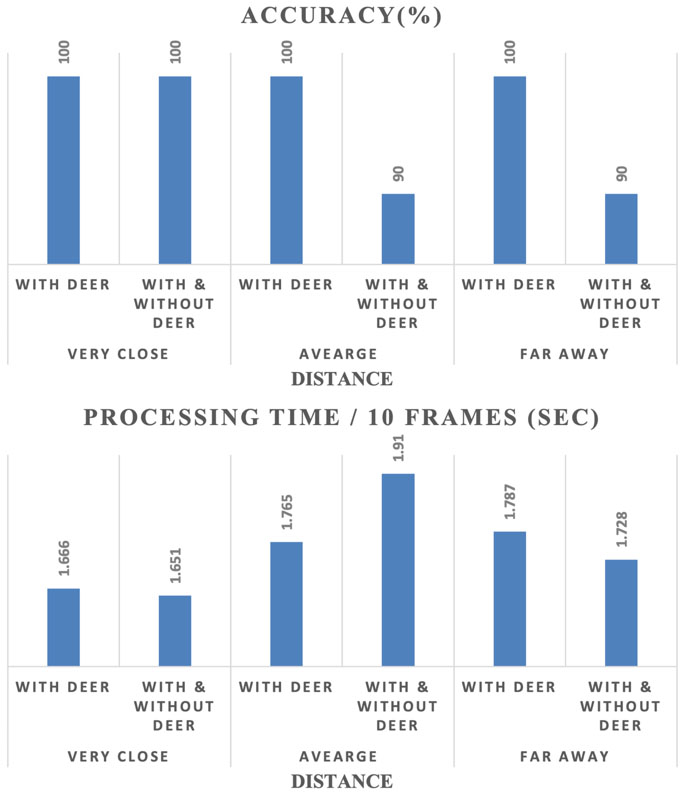
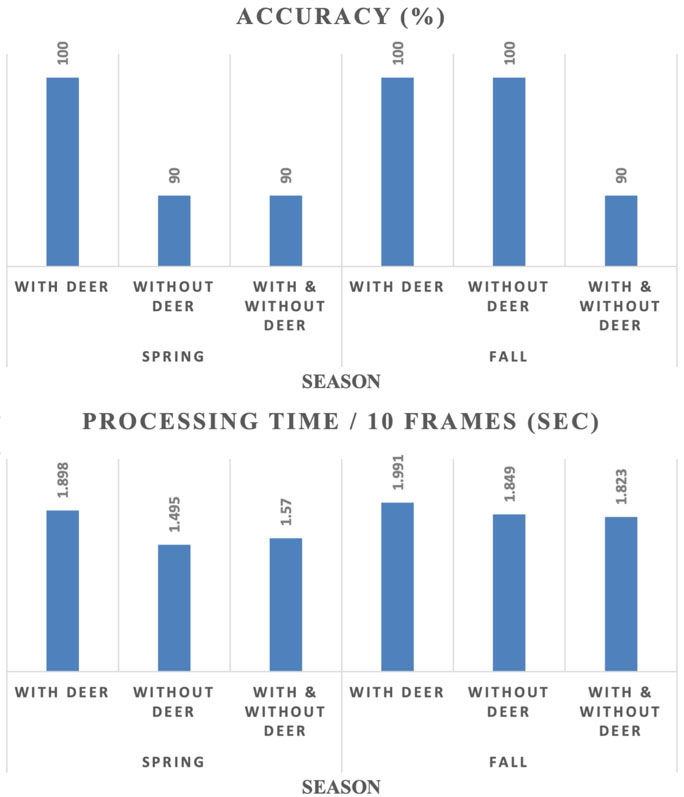
Figure 12 indicates the graphical representation of all three scenarios based on the risk factor distance. As per the processing time factor, the average distance takes more time compared with very close and far away (not high). The processing time plotted in Fig. 12 is for the whole detection and push notification process.
Predicting the crepuscular animal’s behavior is very hard, and it varies based on the season centric. The season-based arousal system is split into spring and fall. The datasets are collected in both seasons, as explained in the methodology section. Tables 10 and 11 shows the spring season (February and March) and fall season (November and December) testing results. The average accuracy for the spring season is calculated as 93.33%, and fall is 96.66%. These results clearly show that the detection of deer is high in the fall season. The observation is that the background, ground, and all the objects are icy because of the cold weather, and thereby, the warm-blooded deer will be easily detected.
Figure 13 shows the graphical representation of the calculated values from Tables 10 and 11. The images taken during the spring consumes less time compared with the fall image datasets. The ideology behind this variation is unknown, but from Fig. 13, the whole dataset’s processing time for three combinations (with, without, and combine) of animal detection is measured. If this methodology works will improvise the processing time for the research by considering fewer network layers and fewer conditions of the response system. The maximum and minimum processing time is 1.991 sec, and the minimum is 1.495 sec for all the 10 frames in a set.
Conclusion
In the current work, an intelligent system utilizing the synergism of CNN-HOG has been proposed and tested. This research aims to provide an arousal system integrated with crepuscular animal detection applications and warns the driver about the future peril to mitigate the collision. The detection model with the arousal system produced accuracy between 94 and 96%. As this research demands time-sensitivity for real-time implementation, the whole system has shown promising results with a maximum of 1.991 seconds to a minimum of 1.495 seconds. Multi-directional stress testing’s like time-based, distance-based, and seasonal based are conducted to check the arousal system’s efficiency and performance. As the system is overly time-sensitive, this problem solution will minimize the fatalities in the animal-vehicle crash. The system’s success factor is two-fold: i) the image detection accuracy, and ii) the short time taken to respond or alert the driver.
The future work shall be extended by implementing the control system to control the vehicle instead of pushing a notification to the driver. Additionally, integrated the system with the transportation crash system to alert the transport department by sending messages to the department automatically using WIFI. This feature will also address the under-reporting of deer-vehicle collision and improve the post-collision processes very fast. Also, the model’s performance can be implemented and achieved using various machine learning classifiers. Instead of collecting the image datasets, the researcher can implement video capturing.