
Abstract
Autism spectrum disorder (ASD) is a condition associated with impairments in communication, social, and repetitive behaviour; the degree of impairment varies between individuals with ASD. Since ASD has a substantial impact on the individual, caregivers, and family members due to the social and economic costs involved, early ASD screening becomes fundamental to enable faster access to healthcare resources. One of the important studied groups in ASD research is toddlers – detecting autistic traits at an early stage can help physicians develop treatment plans. This paper aims to improve the detection rate of ASD screening for toddlers using a data driven approach by identifying the impactful feature set related to ASD, and then processing these features using classification algorithms to accurately screen for ASD. To achieve the aim, a data driven framework consisting of feature selection and classification algorithms is proposed, and then implemented on a real dataset related to the ASD screening of toddlers. Empirical evaluations on the ASD screening dataset using different classification methods reveal that when support vector machine (SVM) or Naïve Bayes are integrated with the proposed framework good predictive models are constructed for toddler ASD screening. These predictive models can be adopted by different medical staff and caregivers to replace scoring functions of conventional screening methods.
Introduction
Autism Spectrum Disorder (ASD) is a developmental disorder which affects the social behaviours and communication ability in individuals [1]. Although ASD can be screened at any age, it can be typically identified in the first few years of a toddler’s life [2, 3]. It has been estimated that approximately 1–1.5% of the population worldwide is on the spectrum (Centers for Disease Control and Prevention [CDC], n.d.) [4]. One of the studied age categories in autism screening, and for which limited behaviour datasets related to autism are available, is toddlers [5]. Investigating this group is essential due to the benefits gained from early ASD detection including rapid healthcare access, supporting individuals and their family members, and the design of individualised treatment plans.
Currently, ASD screening of toddlers is performed using assessment methods such as the Quantitative Checklist for Autism in Toddlers (Q-CHAT), its various versions (M-CHAT, Q-CHAT), and the Screening Tool for Autism in Toddlers and Young Children (STAT) [6, 7, 8]. However, these methods often take a long time to complete during a clinical session besides at the time of pandemics when resources are limited, the availability of clinicians becomes a challenge [9, 10, 11, 12, 13, 14, 15, 16]. For example, the STAT method including its user manual, test protocol, scoring sheet, and simple toys like balloons, trucks, dolls, and balls, takes considerable time to complete. Therefore, there is a need to develop more efficient screening methods that are easily accessible and more accurate [17, 18]. One promising direction to accomplish accessibility, efficiency, and accuracy in autism screening research is the use of data driven approaches.
The aim of this research study is to identify influential features related to ASD for toddlers based on characterised behavioural traits within a real dataset. This research focuses on autism screening for toddlers between the age of 12 to 36 months, using the Quantitative Checklist for Autism in Toddlers (Q-CHAT) – 10 version screening method [19]. To achieve the aim, we propose a data driven framework for detecting ASD traits to discover correlations of autistic traits in a real dataset. Our framework uses machine learning techniques to derive robust and efficient models for classification decisions related to autism screening. These models are then employed to predict ASD traits during a clinical screening session. The dataset being used to evaluate the machine learning models is published by its prospective authors in a Kaggle public data repository (
The proposed framework consists of a feature engineering step to identify key ASD features, and a classification step to discover models with hidden insights. The benefits of the models generated are:
They can be exploited by physicians to take a more proactive approach towards the development and implementation of strategies for the early detection and treatment of ASD. They provide stakeholders such as caregivers with a clearer understanding of the behavioural traits that might be exhibited, thus enabling caregivers to offer the prerequisite care for toddlers at an early stage. Predictions from the models can be used as an indicator when screening for autism, and results can provide a descriptive reasoning for predictions to caregivers, parents, clinicians, etc., thus allowing them to further follow-up for comprehensive autism assessment.
This paper is structured such that Section Two contains a literature review which critically analyses related work on machine learning for ASD detection, and Section Three presents an initial descriptive analysis of our dataset and feature selection. Section Four covers five machine learning algorithms (Naïve Bayes, C4.5, Random Forest, SVM, and Ripper), and the results and analysis using different evaluation measures. Finally, we conclude the paper with our findings, recommendations, and limitations.
We will critically analyse related work in the domain of machine learning for the purpose of ASD screening and causes that impact the reliability of these methods. Given the non-feasibility of determining ASD on a large scale, classification techniques were applied on words and phrases that had been extracted verbatim from evaluation, predicting models with 86.5% accuracy [22]. This was done by identifying the consistencies in the description of symptoms recorded during evaluation. This method used Random Forest as the classification method [23]. A factor to be considered when training the model was whether the performance or quality is impacted when used on a geographically or demographically different dataset. However, this method allows for the identification of ASD from unstructured text data.
Despite a recommendation by the American Aca- demy of Pediatricians (AAP) for ASD screenings to be performed on toddlers between 18 and 24 months of age, only 50% of children in the USA are screened at this age. According to a study by the National Centre for Health Statistics (NCHS), only 20% of diagnosed children had been screened when they were two years of age, while more than 50% were diagnosed when they reached school age of five years or older [24]. Thus, early detection of autism is challenging due to the inability to pinpoint a specific reliable method based on behaviour and observation. However, this is crucial to ensure that the child receives the necessary help and medical resources as early as possible. Prior to the development of the Psychological Development Questionnaire (PDQ-1), it was also more challenging to diagnose females, as the tests were built around males [25]. The PDQ-1 test is based on 10 questions that can be completed in minutes, with an accuracy of 88% in identification, as found by researchers at Rutgers University, and consistent across children from all types of socio-economic backgrounds [26].
Various screening methods have been created to identify the potential symptoms and behavioural traits related to ASD. However, without proper training and experienced qualified medical professionals to appropriately diagnose the presence of ASD, these identifiers and results cannot provide a definitive diagnosis to establish the presence of ASD within toddlers [27] research into whether machine learning could be used to identify ASD without the need for a medical professional concluded the possibility exists for correctly predicting the presence of ASD in toddlers. Nevertheless, this approach will not be legitimate unless tests are conducted within a clinical environment to ensure validity of the tests [5]. Using the models derived by decision trees [28] against identifiable traits (developmental delay, learning disability, speech, etc.), the author found that the models achieved an acceptable level of predictive accuracy. Bekoram’s research extends beyond identifying ASD within toddlers, and uses machine learning to predict the severity of ASD. Utilizing the one-away method, Bekoram classifies his cases as having: No ASD, Mild ASD, Moderate ASD, and Severe ASD. When a decision tree algorithm was applied, a substantial increase in accuracy, from 54.1% to 90.2%, was observed.
[29] identified the weaknesses in the current approach of utilizing machine learning in ASD screening. Today’s methods separate machine learning from diagnostics tools and limits diagnosis as a static problem. Thabtah suggests utilizing the strength in machine learning’s classification methods, especially rule induction, as these types of machine learning methods generate easy-to-interpret models. Identifying ASD as a classification task, Thabtah’s research identifies that utilizing the machine learning method decreases diagnosis time without decreasing the sensitivity and specificity of the data. These findings support previous research works related to autism diagnosis such as [9, 10, 11]. However, [5] questions that current ASD clinical diagnosis tools need to be updated to reflect the changes proposed in the Diagnostic and Statistical Manual of Mental Disorders, Fifth Edition (DSM-5) [30].
[12] minimized ASD screening time by reducing the number of features using a new filter method called Variable Analysis (Va). This method retains influential features related to ASD screening and discards redundant and useless features. Experiments on datasets related to children, adolescents, and adults have been conducted to evaluate the performance of Va. The basis of comparison were various different evaluation metrics such as sensitivity, specificity, and predictive accuracy. The author used two machine learning algorithms, namely RIPPER and C4.5, to construct the classification models. In addition, the authors compared Va with other filter methods such as Information Gain and Chi Square Testing [31, 32]. The results reported that screening models derived by Ripper and C4.5 algorithms from the Va feature set based on the adolescent dataset were 10% and 6% higher than models produced from the original dataset using the same machine learning algorithms. Meanwhile, the sensitivity rates of the RIPPER model derived from the features of CHI, IG, Correlation, CFS filter methods were 87.30%, 80.95%, 80.95%, 84.13% and 80.00% respectively, which show the obvious improvement after applying feature selection.
[9, 10] conducted experimental studies to identify the least number of features on the ADOS diagnosis method [33] using a dataset from the Autism Genetic Resource Exchange (AGRE) [34]. The authors trained 15 different classification algorithms on the AGRE dataset to identify the least number of features that can represent the ADOS diagnosis methods. The authors claimed that only seven features out of the 93 were sufficient to classify ASD based on their occurrences within the models derived by the machine learning algorithms. The performance of 15 different machine learning algorithms shows that the Alternating Decision Tree (ADTree) obtained the best sensitivity and specificity rates against AGRE when the seven features were processed. Later on [11, 35] showed clear pitfalls with Wall et al. studies especially in the methodology, data, implementation and validity.
[36] claimed that the Brief Infant-Toddler Social and Emotional Assessment (BITSEA) [37] is an effective screening method for ASD as it detects ASD with acceptable accuracy in young children. This method includes the assessment of psychosocial problems, which could also be symptoms of other disorders such as autistic disorder, Asperger’s, and pervasive development disorder.
The proposed framework
The proposed framework is shown in Fig. 1; it consists of multiple phases including data integration, feature assessment and classification. In the next few sub-sections, we describe each phase.
Variables of the Toddlers’ dataset
Variables of the Toddlers’ dataset
The dataset is public, and it has a total of 1054 instances and 18 attributes. Some attributes are numeric, binary, and categorical as shown in Table 1, which also lists the variables and their description. The A1–A10 variables are based on the Q-Chat-10 questions and are mapped to “1” or “0” in the dataset. For questions 1–9 (A1–A9) in Q-chat-10, if the response was Sometimes/Rarely/Never, “1” is assigned to the question (A1–A9). However, for question A10, if the response was Always/Usually/Sometimes, then “1” is assigned to that question. If the user obtained a score of more than three, according to Q-CHAT-10 screening method, this will be an indication of autistic traits. The class variable was assigned “Yes” if the score is larger than three, otherwise it has been given “No” in the dataset. The score variable has been omitted from the analysis phase as this variable may overfit the models derived by the machine learning algorithms. This research is based on a public dataset related to toddlers that have been published by its prospective authors [20, 21].
The proposed framework.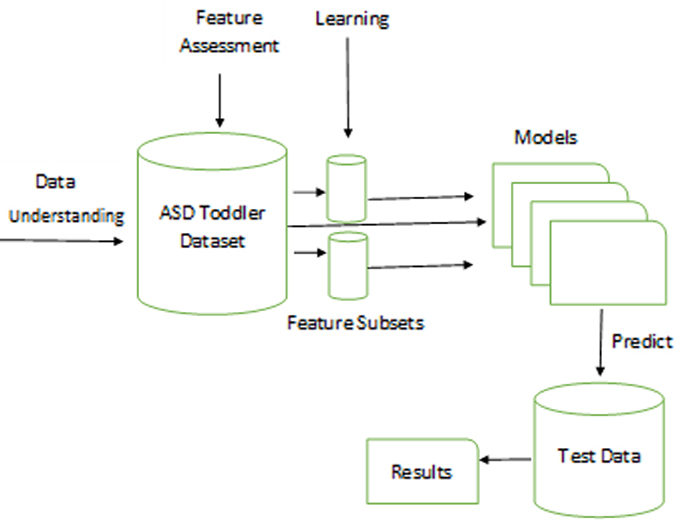
Based on the descriptive analysis conducted on the Toddlers’ dataset, the distribution of ASD class by “Family ASD History” is depicted in Fig. 2a in which 15.8% (170 observations) of the total observations that are linked with ASD symptom have Family-ASD history, and out of those 170 observations, 115, i.e. 67.65%, have ASD symptoms. This shows a strong relation between ASD class and family-ASD history. Moreover, the distribution of ASD class by the feature of “Born with Jaundice” shows that 215 toddler observations, out of a total 288 observed, born with jaundice showing traits of ASD which represents 74.65%. This leads us to assume that there is a relation between ASD traits and when a toddler is born with jaundice. The distribution of ASD by gender is illustrated in Fig. 2b. We can see that 69.7% of the toddlers which showed traits of ASD were male. If we consider only those observations, then 72.65% of them show traits of ASD, more than for female toddlers. This supports previous research on autism that ASD traits are more common in male. Lastly, the distribution of ASD by age in months is considered; out of 187 toddlers in this age group the (22–26) months age group shows the highest traits of ASD; 145 of them had ASD traits, which is approximately 77.54%. The age group of (27–31) months shows the second highest traits for ASD in the considered dataset at 74.54%.
(a) ASD Class by Family ASD History, (b) ASD Class by Gender.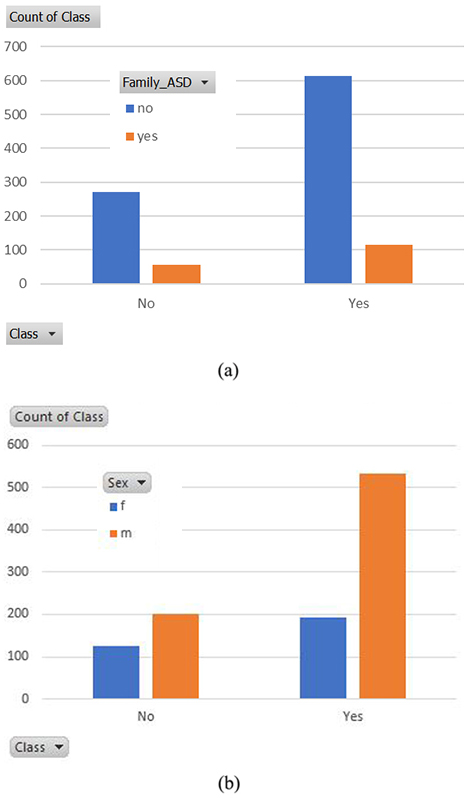
The purpose of feature selection is to ensure efficiency during the ASD screening; models produced by the machine learning techniques are less redundant. To determine the features that have a high influence on ASD screening we will use Chi-Squared and Minimum Redundancy Maximum Relevance (mRMR) feature selection methods [32, 39].
Chi-Squared, also known as
For feature analysis, WEKA (the Waikato Environment for Knowledge Analysis) software is used to pre-process the toddler dataset [40]. WEKA is an open-source tool, which helps researchers accessing feature selection and machine learning techniques for various real-life problems. WEKA contains the implementation of various techniques such as filtering, classification, association, regression, visualization, and clustering. For Chi-Square, a filter implementation in WEKA called ‘ChisquaredAttributeEval’, is utilized; it evaluates each attribute individually. This filter is used with a ranker search method that sorts the variables according to their computed scores. For mRMR, we have used its implementation in R tool along with Correlation Feature Set implementation (CfsSubsetEval) [41] with the search method RerankingSearch, and rerank method of Peng’s mRMR [39].
For the toddler dataset, number of feature subsets were obtained after applying Chi-Square & the mRMR feature selection methods are depicted in Table 2. The first column in Table 2 denotes the complete features set of the toddler dataset excluding the score and the class features and the subsequent two columns denote the results obtained after applying mRMR and Ch-Square feature selection methods on the toddler dataset respectively. The outcomes pinpoint that variables A1–A9 are the top features in the toddler dataset. In fact, mRMR has selected three additional variables as we have used a cut-off value in Chi-Square of 103 [29, 42]. So, any variable with a score below 103 in Chi-Square has been ignored during data pre-processing.
Classification
During the classification step, and to ensure that the predictive models derived are general, we adopted five classification algorithms that employ different types of learning approaches including Naïve Bayes, C4.5, Random Forest, Support Vector Machine, and Ripper. Naïve Bayes is based on probability theorem, where each attribute’s value contributes independently to the probability of the output, with complete disregard for the possible correlation that could exist between the values of these attributes [43]. Naïve Bayes relies upon Bayes theorem in computing the probabilities to detect the sets of unknown data in their class. The Bayes theorem is expressed mathematically as follows:
where
Selected variables using mRMR and Chi-Squared on the toddler dataset
C4.5 is a tree-based classifier that builds trees from the input dataset and then converts them into rules that can be easily understood by novice users. The rules are then used to predict the target variable [28]. The C4.5 algorithm is an extension of the Iterative Dichotomiser (ID3) algorithm [31]. C4.5 builds trees which are used for classification. In the implementation of C4.5, there is an important step to simplify the predictive model called pruning the tree.
Random Forest is a commonly used tree-based algorithm, which often produces good results despite the absence of hyper-parameter tuning. The advantages of this model are that it eliminates the problem of overfitting, can handle missing values, and can be used for categorical values, thus making it highly suitable for the nature of our dataset [23]. Random Forest creates decision trees upon dissimilar samples and obtains the highest vote when classifying the class label of test data. Random Forest can deal with datasets that include categorical and continuous variables thus it is suitable for regression problems.
Support Vector Machine (SVM) works by finding the largest minimum distance between two classes, based on the training dataset. This is performed by identifying the optimal hyperplane to segregate the data into two classes. The aim of this classification method is to maximise the distance between the hyperplane and the support vector [44]. SVM can be applied to regression or classification tasks.
Lastly, Ripper is a classification model that involves growing and pruning sets of data to produce a set of rules for each class in the training dataset. The rules are discovered incrementally, and whenever a rule is derived all its linked data examples are erased [45]. Ripper can be used in the presence of imbalanced class distribution or noisy datasets, and it employs a validation set to avoid model overfitting.
Experimental settings and machine learning algorithm
To identify the optimal combination of feature selection and classification method performance for the screening of ASD in toddlers, we compare the results of 15 different combinations of filter and classification methods as illustrated in Fig. 3 using the WEKA tool [40]. Machine learning techniques, including Naïve Bayes, J48 (C4.5), Random Forest, Support Vector Machine (SVM) – LIBSVM, and Jrip (Ripper), have been used for data processing on the toddler dataset to derive screening models [23, 28, 43, 44, 45]. Here, all the algorithms, are applied separately on the dataset, with and without feature selection. To reduce overfitting on the models, ten-fold cross validation has been employed during the training and testing phases and the score variable produced by Q-chat-10 was omitted.
Breakdown of the data analysis process.
Accuracy results using machine learning algorithms with and without feature selection.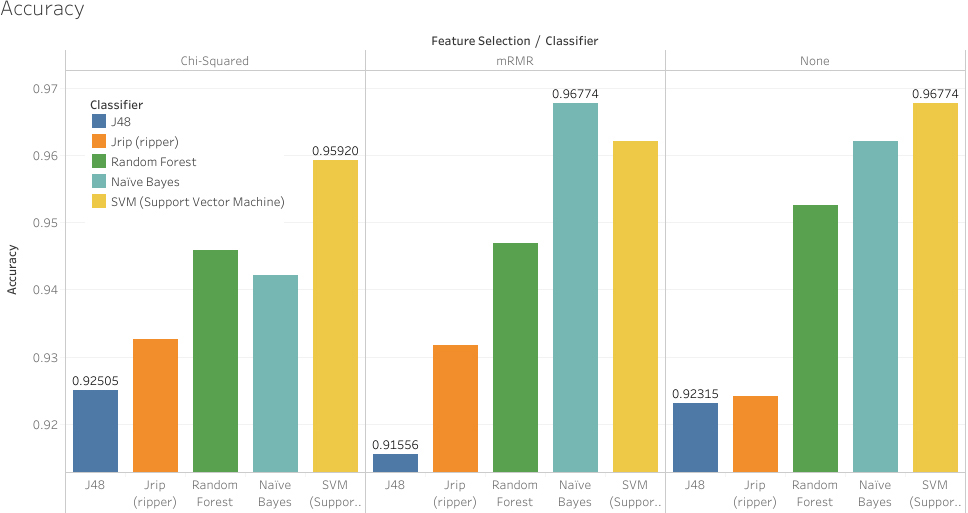
For the purpose of evaluating the performance of our classification models, we have compiled the results of the possible outcomes into a confusion matrix (Table 3). Based on the output of the confusion matrix, we were able to derive the values of the following evaluation measures which we will use for our investigation:
Accuracy = Specificity (True Negative Rate) = Sensitivity (True Positive Rate) =
Confusion matrix for a binary classification problem
Sensitivity results using the machine learning algorithms with and without feature selection.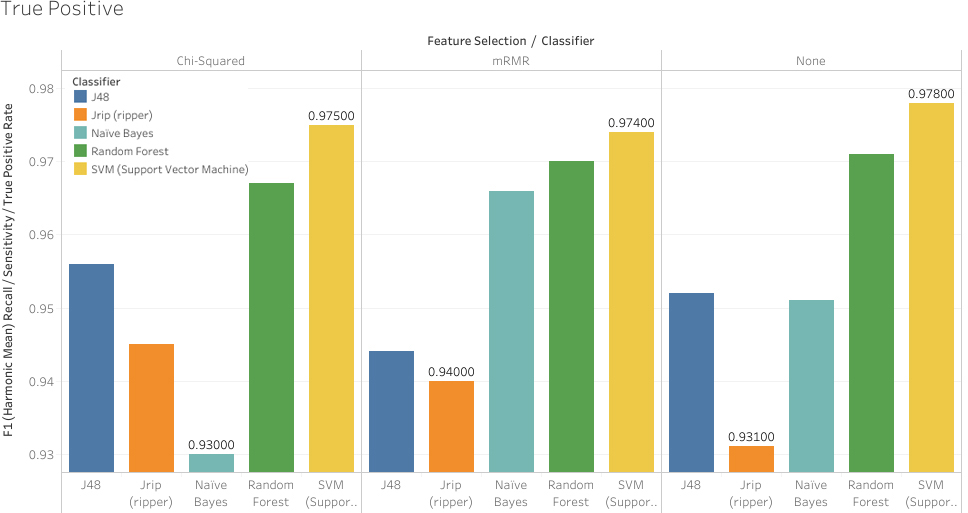
Figure 4 depicts the accuracy rate of the models generated by the machine learning techniques considered with and without feature selection. When Chi-Square testing was utilised as a filter method for the toddler dataset, i.e. nine features plus the class, SVM outperformed the remaining machine learning algorithms with respect to accuracy measure. This is not surprising, as SVM can deal with both nonlinear and linear relationships based on the different available kernel functions. In the experiments of SVM we have used the RBFKernel function. Based on the results against the features set of Chi-Square, Random Forest also performed well with respect to predictive accuracy; this algorithm employs a learning methodology that ensures a multiple votes strategy based on majority decision to assign the class to the test data, which consequently increases reliability and accuracy of the prediction. Conversely, decision trees produced the least accurate classifiers followed by the RIPPER algorithm against the Chi-Square features set; these algorithms normally may not perform well when a limited number of features is available.
A surprising result regarding accuracy was observed by the models generated by the machine learning algorithms against the mRMR features set (11 features). It has been noted that by adding three additional features (A10, age, jaundice) and removing one feature (A3) it boosted the performance of the Naïve Bayes classifier, i.e. 96.77%, making it more superior to the remaining machine learning algorithms. This indicates that replacing a communication feature (A3) with a behavioural feature (A9) (refer to Q-Chat-10 screening method for further details) and adding two new features (jaundice, age) played a critical role in the performance of the machine learning algorithm on the toddler dataset within autism screening. The change of the features set has a clear impact on the Naïve Bayes performance as this algorithm relies on both computed and observed probabilities in the training dataset to produce an appropriate prediction during the screening. The additional features that have been added seem to be influencing the performance of Naïve Bayes by boosting its predictive power by around 2.6%. The performance of SVM, J48 and Random Forest slightly declined when the aforementioned three features were added to the mRMR features set. However, RIPPER maintained its predictive power.
The results of the accuracy obtained against the complete features set in Fig. 4 show the superiority of SVM and the Naïve Bayes classifier; these were the only algorithms that produced models above 96% predictive rate. Overall, the machine learning techniques showed an acceptable level of accuracy (between 91.5% and 96.7%) against the toddler dataset, with and without feature selection. These figures are higher than conventional screening methods that use static rules with a scoring function.
Figure 5 show the sensitivity and specificity rates respectively of the models generated by the machine learning algorithms, with and without feature selection. Sensitivity is a measure, which denotes when an observation is classified as positive by the machine learning model and its true class is positive. In the context of autism screening, sensitivity measures whether a toddler has been correctly screened as ASD from the total toddlers that have ASD. Specificity is the probability of toddlers being correctly diagnosed to not have ASD, based on the total number of toddlers diagnosed as not having ASD.
In Fig. 5, when the entire set of features is processed by the machine learning algorithm, SVM performs the best in terms of sensitivity metric followed by Random Forest. When some features have been trimmed by mRMR and Chi-Square SVM and Random Forest algorithms maintained high levels of performance regarding sensitivity rate. Looking deeper into TP, FP, TN and FN rates within the resulting confusion matrices by SVM and the considered machine learning algorithms on the complete features set, SVM has the largest TP rate by correctly classifying 712 observations out of 728 (16 FNs). Whereas Random Forest, Naïve Bayes, Ripper and C4.5 derived models with 21, 36, 50 and 35 FNs respectively, obviously higher rates than that of SVM. This explains the high sensitivity rate of SVM as being able to screen toddlers with autistic traits better than the remaining algorithms. There was a notable result on the sensitivity rates in Fig. 5 in which the sensitivity rate derived by the Naïve Bayes algorithm on the features set of Chi-Square was the lowest despite having competitive sensitivity rates on the other features sets. It turns out that eliminating certain features-related behaviour (for example, a toddler staring at a parent without apparent reason), in addition to age and jaundice variables is critical for Naïve Bayes performance. Removing those has caused Naïve Bayes to misclassify 51 observations who are supposed to have autistic traits.
For the specificity figures of the considered algorithms on the toddler dataset. Naïve Bayes outperforms the considered algorithm in detecting toddlers who do not exhibit autistic traits. For example, the confusion matrix results derived by the machine learning algorithms on the complete features set show that only four observations for toddlers who do not exhibit autistic traits out of 326 were misclassified by Naïve Bayes algorithms. Whereas for the same target group, SVM, Random Forest, Ripper and J48 misclassified 18, 29, 30 and 46 respectively. This low FP rate for Naïve Bayes has caused a boost in the model’s specificity derived by this algorithm against the toddler dataset. The performance of Naïve Bayes regarding specificity was sustained even when the mRMR and Chi-Square feature selection methods were applied on the toddler dataset. However, there were more misclassification cases, i.e. 9 and 10, when Naïve Bayes processed mRMR and Chi-Square features sets respectively causing a slight drop in the specificity rate. Overall, Naïve Bayes is superior to the remaining algorithm in identifying toddlers who are not on the spectrum, at least on the considered dataset, due to its competitive specificity rate.
Overall, the results generated by the machine learning algorithms are competitive in terms of sensitivity, accuracy, and specificity rates; SVM and Naïve Bayes algorithms are suitable for autism screening of toddlers as they provide the highest evaluation measures’ rates when processing the complete features set of the toddler dataset. In addition, Naïve Bayes performance was highly competitive in terms of specificity specially when feature selection was applied using mRMR.
Conclusions
ASD screening is essential, as identifying autistic traits at an early stage may increase formal referrals for further assessments and accessibility to healthcare services such as speech therapy and special education needs. One of the studied age groups for autism screening is toddlers (12–36 months age); availability of datasets related to behaviour variables involving this age group is scarce. Therefore, it will be helpful to screen toddlers to assess any autistic traits they may exhibit so the necessary actions can be taken to limit further development in social, communication, and repetitive behaviours. Autism screening can be performed using data driven approaches to enhance the efficiency and accuracy of the screening process based on characterized behaviour indicators. This paper investigated the applicability of different machine learning techniques including SVM, rule induction, decision tree, Random Forest and probabilistic on discovering autistic traits of toddlers. We have developed a data driven framework that consists of feature selection, classification technique that process real autism dataset related to toddlers.
Several empirical evaluations on the dataset using five different machine learning algorithms and two feature selection methods (mRMR, Chi-Square) have been conducted using the 10-fold cross validation. The basis of the comparison is various evaluation metrics including predictive accuracy, sensitivity, and specificity. We evaluated classifiers generated by the considered machine learning algorithms with and without feature selection to seek influential features, as well as classifiers’ performance. The results showed that SVM derived higher predictive classifiers than the remaining algorithms on the complete features set, and the features set selected by the Chi-Square method. However, when three additional features are added on top of the Chi-Square’s set (Age, Jaundice, A10-social variable related to staring) Naïve Bayes showed competitive accuracy. More importantly, the results reported that probabilistic classifiers, i.e. Naïve Bayes, produced classifiers that are superior to those generated by the considered algorithms with respect to specificity rate on all features sets. This was attributed to the low false positives derived by this algorithm as Naïve Bayes achieved limited misclassifications for toddlers who do not exhibit autistic traits when compared with the considered algorithms.
There are a few limitations identified in this study. Firstly, the categories of ethnicity within a dataset are huge and can be minimized. For example, South Asians are a sub-category of Asians, hence South Asian respondents can also identify as Asians. Latino and Hispanic are commonly interchangeable and should be combined into a single category for representation. Secondly, the Q-CHAT-10 screening method was designed to test toddlers between 18 to 24 months, however, the dataset considered toddlers between the ages of 12 to 36 months. Hence, the validity of this testing method is restricted to toddlers between 12–36 months of age and not based on Q-Chat-10. Given that feature selection did not enhance the results of our classification models, we propose that further investigation into feature-to-feature correlations to screen for ASD should be considered to seek further improvement.