
Abstract
Deep Neural Networks (DNN) have significantly improved the capabilities for analysis and classification of data, including that of biomedical signals (eg. ElectroencephalogramEEG). Optimal classification of EEG signals from seizure onset zones has been challenging especially given the complexity of signals arising from multiple locations. Also, underlying electrophysiological abnormalities which signify epileptogenic zones have not been clearly defined. Previous studies have demonstrated, automatic feature generation based on deep learning as a useful tool for interictal epileptiform discharge (IEDs) detection. Also signals with transformations have been used in convolutional neural network (CNN) based models in the past for classifying EEG data. We explored the use of deep learning for identification of the seizure onset zones using regular dense neural network and CNN based models. After the training the model using sample data the results were validated with a smaller percentage (10%) of the data. The models were noted to be accurate in predicting the seizure onset zones with significant degree of accuracy (87–99%) with a much shorter duration of signal recorded, compared to previous studies. We further investigated model’s decision-making process with heatmapping (gradient-weighted class activation map: Grad-CAM) approach, combining with signal processing using Hilbert transform. To identify the visible features in the signal, which maximally contribute to the seizure onset zone prediction, correlation of heatmap and analytical signal of the EEG, was calculated. A high correlation between heatmap and analytical signal was noted, suggesting that the model may be utilizing the higher power regions of the data in decision making process. This study demonstrates the potential use of DNN based strategies in identifying the epileptogenic zones in the intracranial EEG. It also shows the heatmapping strategies can help in establishing how specific signal patterns may be contributing to the decision making of DNN.
Introduction
Approximately 1% of the US population suffers from epilepsy [1] and in 30–35% of these patients, seizures cannot be controlled medically and are considered to have refractory epilepsy [2]. They may be treated with surgical options which may need to be be planned based on intracranial EEG (iEEG) monitoring, which aims at accurate determination of the epileptogenic zones. These patients undergo intracranial electrode placement and signals from the brain is recorded for prolonged periods and analyzed for seizure onset zones.
Identifying the features suggestive of seizure onset in these signals can sometimes be challenging, given the huge amount of data that need to be visually analyzed by clinicians. Failure to accurately identify the epileptogenic zones in iEEG may be contributing to the inadequate seizure control reported even after epilepsy surgery, which ranges from 40–60% [3, 4]. This raises the critical need for tools which can accurately analyze the iEEG signals and identify the epileptogenic zones. DNNs have been used in multiple fields including image classification [5], signal processing and natural language processing [6]. In this study we evaluate the use of deep neural network for evaluating iEEG signals to accurately identify the seizure onset zones, using signals recorded during the interictal periods (when patients do not have seizures). We employed a short duration (1 minute) of signal to identify the epileptogenic zone in contrast with multiple days of iEEG monitoring used in the current medical decision-making process.
While being capable of processing huge amounts of data to arrive at conclusions, based on the training they received, it is often difficult to intuitively understand why the DNN reached a particular classification decision. It is difficult to identify which datapoints or features of data, lead the DNN to take a particular decision on behalf of a specific input. This difficulty, in understanding the decision-making process of deep neural networks can make it difficult to incorporate these tools to the medical decision-making process. Therefore, better understanding of the DNN’s decision making process is imperative in seamless incorporation of these advanced technologies in clinical field. In addition, understanding the signal features contributing to pathological states can further our understanding of the basic pathophysiology of disease states like epilepsy.
There have been efforts to understand what DNN has learned in the process of training. This included methods to estimate what individual neuron or a layer of neural network in a DNN has learned. These methods significantly depend on the implementation of the network, starting from the type of neuron and layers incorporated in the network. In general in a classification task DNN assigns a classification score
where
Apart from basic deep neural network methods, signals with time varying features can be analyzed and classified using convolutional neural network (CNN) which are better capable of capturing features using a sliding window along the signals [6]. This allows for identifying the local features of signal which are often used in identification of epileptogenic zones by clinicians (sharp waves, spikes, high frequency oscillations etc) and are particularly suited for evaluating pathological features in iEEG signals which may contribute to the decision making of DNN. Given this potential, CNN was employed as a second strategy for signal classification in this study and heatmapping method was implemented on CNN model.
The depiction of the input along with contribution of different regions of the signal in the decision making process, is referred as heatmap and can be estimated for individual layers using various algorithms. Essentially heatmaps help in identifying the key features that was used by the model to arrive at a particular decision. Heatmaps can be generated using (1) a sensitivity analysis of neural network using partial derivatives [8, 9] (2) deconvolution method [10] (3) the layerwise relevance propagation (LRP) algorithm [11] and (4) gradient-weighted class activation maps (Grad-CAM) [12].
Deep neural network strategies has been used in the past for identifying the epileptiform patterns of iEEG and evaluating epieptogenic zones. One of the previous studies demonstrated that automatic feature generation based on deep learning as a useful tool for interictal epileptiform discharge (IEDs) detection [13]. Specifically the meaningful features representing IEDs were automatically learned with CNN. The learning process of CNN was also explored by correlating the learning weights of convolutional layers with averaged IED. While it exemplifies the potential of evaluating and exploring IEDs this study did not address the evaluation of DNN for identifying the epileptogenic electrodes.
Another study evaluated deep learning based on CNN, where inputs were given after signal transformations. The study was based on two public datasets including ictal and interictal EEG and their Fourier, wavelet and empirical mode decomposition, achieving 99–99.5% accuracy in classifying non-seziure vs seizure recordings [14]. This study did not address the question of the features that the neural network learned.
In a study specifically addressing interictal activity detection of epileptiform discharges from mesial temporal regions was performed using CNN and reported a sensitivity of 84% at a false positive rate of 1 per minute [15]. This study showed the potential for detecting pathological features in iEEG using signals from specific electrode locations.
Our paper proposes use of DNN strategies on the higher frequency components of the raw signal, from interictal recording only, for classifying signal arising from epileptogenic vs non-epileptogenic locations in the same patient for surgical decision making. The current clinical standard for identifying epileptogenic zones involve several days of EEG monitoring, usually in intensive care settings. Allowing to have seizure for this purpose with intracranial EEG electrodes is fraught with medical risks to the patient. In addition, it may be noted that sometimes seizures may not be captured even after prolonged monitoring lasting several days or weeks. If a decision on ictal onset can be made with interictal EEG, that would provide significant improvement in care of the patients undergoing epilepsy surgery, 1. by minimizing the duration of intracranial EEG monitoring and 2. by obviating the need for capturing the seizures.
Method
iEEG data for analysis
The brain signals (intracranial EEG) from 10 patients undergoing epilepsy surgery evaluation, were recorded using intracranial electrodes, continuously for several days using Nihon Kohden (NK) software. The electrode placement for a typical patient is depicted in a 3D-image in Fig. 2A. The placement of electrode in individual patients differed, which was decided based on pre-surgical evaluation, including multiple modalities of brain imaging and scalp EEG recording. These patients had epileptic activity arising from various regions of the brain, including temporal cortex, hippocampus, insula or temporal-occipital cortex and were noted to have significant improvement in seizure control after surgery in these regions, thereby proving that these locations were critical in epileptogenesis. The signals for the purpose of analysis were selected from interictal periods (when the patients did not have any identified seizures). The signals were evaluated in bipolar montage and exported to the EDF format from NK software. Signals of one second duration (2000 samples), was considered as one sample data and were fed into model for learning and testing. The data from all 10 patients were pooled together and shuffled to avoid overfitting of the data based on individual results from each patients. Only high frequency components of the signal (60–600 hz) was evaluated in this analysis. There were two reasons for selecting the high frequency component of the signal, which included 1. minimizing the contribution of any potential artifacts and 2. the current knowledge that the higher frequency components tend to be more associated with the seizure onset zones [16, 17].
The scheme of data processing from raw iEEG signals.
Collection of raw data: A. The three dimensional rendering of brain with the placement of electrodes. The different electrodes are shown in different colors with each dot in the line representing one individual electrode contact. B. The signal from all the electrodes in a 14 second period. The labels are marked on the left side and the vertical lines separate each second. The colors are used to group all the signals from one electrode shaft which contains 10–16 electrodes.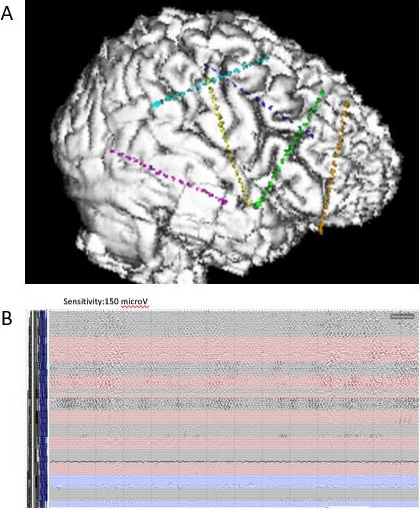
Two forms of deep neural networks were implemented for training with the data. A dense network was implemented as noted in Fig. 3 (left), with the parameters for individual layers noted. Also, a convolutional neural network is implemented, with structure as noted in Fig. 3 (right). The initial layer corresponds to the number of elements in the individual samples (2000). The network was trained with 90% of the sample and tested with the remaining 10%. A 10- fold cross validation was done after the initial training to establish the consistency across different subsamples of the data.
The scheme of two types of DNNs used for generating model. The individual layers are described in dense network (left), convolutional neural network (right).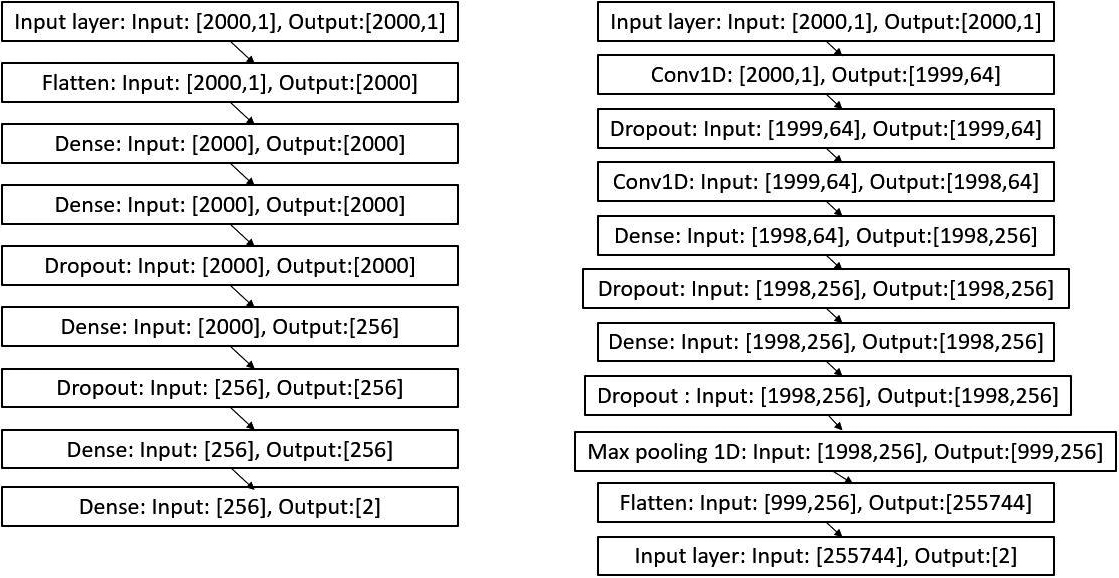
For calculating heatmaps Grad-CAM algorithm was used on the CNN model. Grad-CAM uses the gradient information flowing to the convolutional layers, thereby assigning the relevance values to individual neurons. This can be particularly useful in analyzing the classification of IEEG, given the relevance of transients in the classification process.
Class-discriminator map defined as Grad-CAM is evaluated as follows [12]
with the localized map Grad-CAM obtained as
This heatmap generated need to be evaluated side by side with signal features in iEEG, to establish the clinical correlations, so that the DNN results can be incorporated into clinical decision making. Conventional evaluation of the iEEG signals involve visual inspection. This employs clinical expertise and signals are evaluated for transients, high frequency components etc. Having an understanding of which visually discernible local features are captured by the CNN will help in incorporating the results of the model in clinical decision making. To this end, the instantaneous envelope of the signal was estimated as analytical signal with the help of Hilbert transform of the original iEEG signal as follows.
Where
This is a signal with no negative frequency and in continuous time, every analytical signal
To estimate how the original signal and analytical signal are related to the DNN decision making, cross correlation technique was used. Cross correlation between two signals (normalized with their standard deviations), was calculated as follows
where
Heatmap of the convolutional neural network was generated from 1000 samples with grad-CAM algorithm as described below. Correlation was calculated with heatmap vs original signal and analytical signal, as described above to assess the similarity between signals. The average of the absolute value of maximal/minimal correlation was estimated in each individual signal sample for comparison of two correlations. A flow diagram of the data processing for the entire study is shown in Fig. 1.
The data was obtained from 10 patients during interictal periods, for a duration of 60 seconds, filtered between 60–600 hz. The data from all 10 patients were pooled together, shuffled keeping the individual electrode labels. The information on the surgical procedure and seizure control was obtained from medical records. Two types of deep neural networks were designed as shown in the Fig. 3. The network is trained with 90% of the iEEG data for 100 epochs and the weights and biases are saved as model file and validated with 10% data. The trained network had an F1 score of 0.99 in case of dense neural network and 0.87 in case of convolutional neural network. The accuracy, loss and confusion matrix is shown in Fig. 4 and the details of results for each network is given in Fig. 5.
Training of the two types of model and the results: A. The change of accuracy noted in training and validation over a training period of 100 epochs. A. The change in loss during the training and validation. C. The confusion matrix shows accuracy in terms of positive and negative predictions. The lighter colored areas show higher numbers of the original data in that particular group.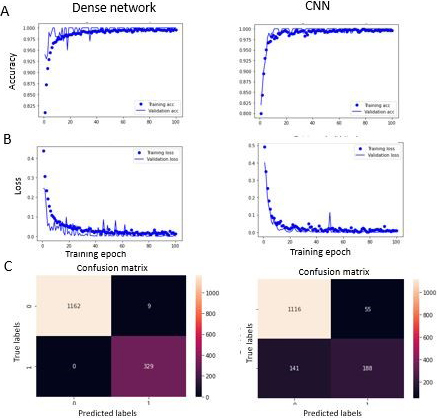
Analysis of reliability of the two models: Table 1. showing the results of the dense deep neural network, Table 2. results of conolutional neural network.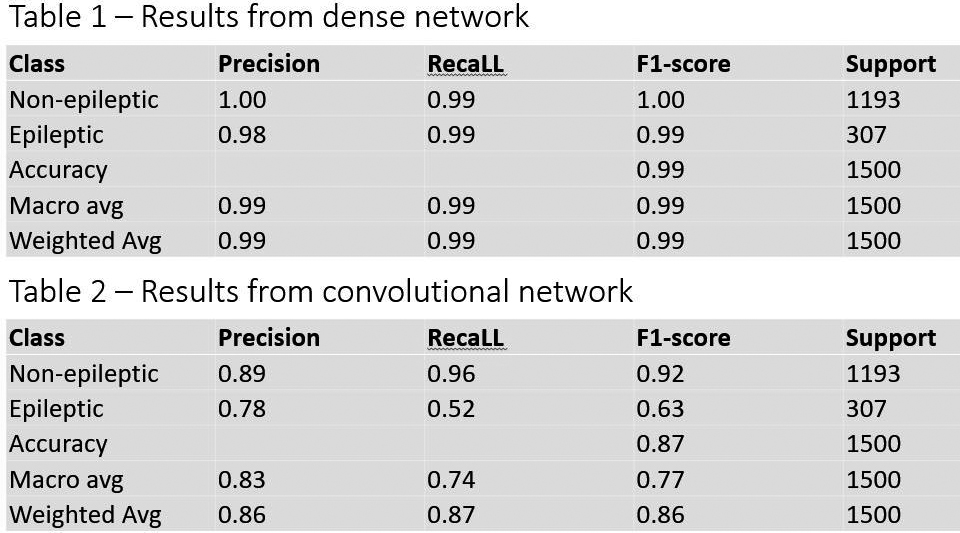
The heatmap generated by the model using Grad-CAM algorithm is compared with the original signal and its analytical signal obtained through Hilbert transform. A. The heatmap values generated through Grad-CAM algorithm is plotted along with raw signal and the analytical signal. B. The plot from A with an expanded time scale showing the periods of transients correspond to higher values in heatmap. C. The absolute value of the higher of maximal/minimal cross correlation between the heatmap and raw signal (left) and heatmap and analytical signal (right) plotted against the lags, from 1000 samples. The y-axis is plotted in log scale given the huge differences in two groups of correlations that need to be compared.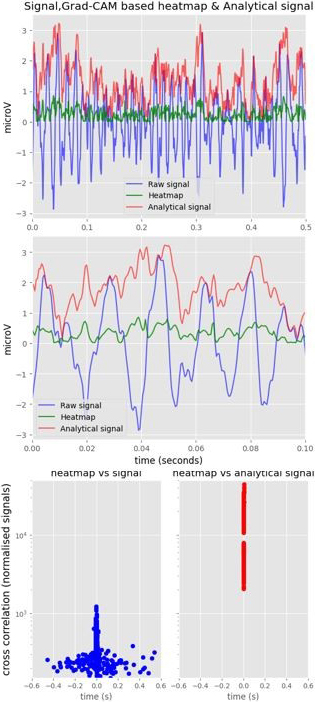
Comparison of the DNN model prediction with clinical data: A. MRI brain axial image showing area of epileptogenicity predicted by model (shown by the red box). B. The area of the brain after LASER ablation as a treatment for epilepsy. This patient became seizure free after the procedure. C. The signal from the same patient’s EEG around the time training data was collected does not show any significant changes in any single electrode.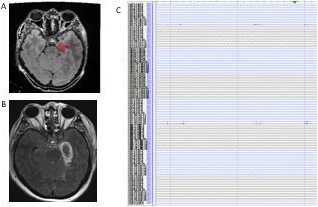
The heatmap was generated using the Grad-CAM algorithm for 1000 samples of data, for CNN, which showed regions of higher and lower relevance in decision making by the model, shown in Fig. 6. The analytical signal was generated using Hilbert transform for the corresponding signals. Cross correlation between both original and analytical signals with heatmap was estimated. The absolute maximal/minimal values of correlation was plotted against the corresponding lags (Fig. 6C), which shows significantly higher correlation between the heatmap and analytical signal. For comparison, between two cross correlation values the average of the absolute value of maximal/minimal correlation was estimated. This mean value for cross correlation between heatmap and original signal was 365.27
A K-fold cross validation [19] was applied on the data set with
Core contributions
The study evaluates the possibility of using deep learning models in identifying epileptogenic zones from intracranial EEG data during interictal periods. The models were able to identify the epileptogenic zones with an accuracy of 99% dense network models and 87% with CNN with cross validation test showing an accuracy around 91% in both models. The fact that the DNN is actually able to predict the epileptogenic zone with significant accuracy from interictal data lasting only one minute is highly promising. This is in contrast to the current paradigm in clinical settings, which involves monitoring the iEEG from patients for several days, including capturing clinical seizures, before arriving at conclusions regarding epileptogenic zones. The decision-making process of models (CNN) was evaluated with heatmapping techniques which unravelled the high correlation with analytical signal.
This strategy is promising in unravelling neurobiological substrates underlying epileptogenicity.
Discussion
The potential to predict epileptogenic zones with limited duration of iEEG signal has to be compared to the current clinical approach based on multiple days of iEEG recording and capturing seizure events. While the model offers a promising approach, one of the concerns of using the DNN models in medical field is the limitations in understanding the decision-making process of DNN. The conventional medical decision-making process already involves putting together several pieces of data. Adding a black box based system to this process can be difficult from the standpoint of clinicians as well as patients. It is in this context that the heatmapping approaches have to be considered especially to explain the decision making process of DNN. The use of heatmapping technique in this study with the Grad-CAM algorithm has demonstrated that the decision making of DNN can be unraveled to a significant extent, which could help the clinical teams in appropriately incorporating these kinds of models in clinical practice. A similar approach with Layerwise relevance propagation was described for classifying neurocognitive tasks [7] demonstrating the potential of this approach in understanding the neurophysiological patterns. Our study shows that the heatmapping points to areas of increased instantaneous power (as described by the the analytical signal) as contributory to the classification of an epileptogenic or non-epileptogenic region. A similar evaluation to identify epileptogenic regions in iEEG has been reported in previous studies with CNN [20] on short term Fourier transform of signal. This approach reported an accuracy of 91.8% in differentiating focal and nonfocal iEEG signals. That approach did not explore the features that the network was learning. Another deep learning approach with intracranial EEG data, for identifying interictal epileptic discharges (IED) has been reported [21]. This study employed CNN and reported a 70–90% classification accuracy in detecting IEDs. Compared to that study we did not specifically target identifying any specific pattern in the EEG.
Our strategy to identify the underlying features that the model is learning goes with the conventional medical approaches which tries to identify the transients in iEEG which is subsequently correlated with the regions of epileptogenicity. While being congruent with the conventional methods, this approach also helps in further unravelling the underlying epileptogenic pathophysiological processes that may be giving rise to certain forms of signals in the iEEG. A similar method can potentially be applied to classifying other brain states (sleep, drowsiness. alertness etc) and in further understanding the neurobiological underpinnings of it.
In the context of long term EEG data, several studies [22, 23] have been reported using CNN approach for detection of seizures. They reported high accuracy (90–99%) and sensitivity and specificity between 85–95%. But it may be noted that these studies were looking to identify seizures in the long term EEG data (and seizures are recorded usually after several days of EEG monitoring). Compared to those studies, our approach uses 60 seconds of recorded interictal data, when no seizures are recorded.
Limitations
The study was based only on data from 10 patients. Additional studies including data from other patients may help in better validating the reliability of predictions of epileptogenic zones as well as evaluation of heatmap. The parameter space tested for the models is limited which can be tested with additional parameters for further optimization. Also, only one method of heatmapping was evaluated in this study, and other approaches may also be considered in better understanding the decision-making process of the model. Another practical consideration from clinical standpoint is the fact that even though the recording utilized only one minute of recording, the entire procedure still necessitates brain surgery and invasive electrode monitoring.
Future work
This method of evaluating for epileptogenic zones and explaining the decision making with heatmaps may be extended to scalp EEG which is a less invasive monitoring technique. Also, similar approach can be implemented for evaluation of the ictal EEG, which is captured while the patient is having seizures, which may provide additional or more confirmatory evaluation about the epileptogenic zones. We have used the evaluation of correlation between the heatmap and the analytical signal in identifying the features of the signal that may be contributing to the decision making. Other aspects of the signal may be evaluated for further understanding of the signal characteristics that may be related to the epileptogenicity.