
Abstract
3D urban landscape visualization is a key technology in digital city construction. Based on the research and analysis of the three-dimensional space of the urban landscape space, the three-dimensional space can not only allow users to intuitively perceive the development of the city. It also enables decision makers, planners, and users to more intuitively, objectively, and rationally recognize and understand the current urban development and planning design. Defining the data content of the 3D city landscape image model is the basis for creating the 3D city image model. It not only guides producers to select data, but also serves as the basis for sharing data between different applications. With the continuous development of society, the number of people living in rural areas migrating to cities to make a living has increased rapidly, leading to the growing problem of “urban congestion” in many areas. In order to effectively solve these problems, “smart cities” came into being. It quickly triggered a boom in global urban development. Based on a survey of the state-of-the-art in the field of 3D modeling and engineering design visualization, this paper analyzes 3D rendering acceleration algorithms used to speed up rendering and improve the quality of 3D design. By utilizing BSP technology, transparent objects can be drawn in any order in any scene, which solves the problem of incorrectly occluding transparent objects during rendering. This paper also applies collision detection technology, which enhances the user’s immersive feeling when roaming the landscape. In the 3D reconstruction process, it can complete the column and wall recognition for the test image with complex composition. Its recognition rate for various urban features has reached more than 80%.
Introduction
The term landscape refers to an area or type of natural landscape, as well as artificially created landscapes. Furthermore, since landscape is related to human practice (e.g., landscape design, landscape architecture), it is easier to understand it as “the combination of man and nature”. Urban landscape is a kind of human landscape, including natural landscape and artificial landscape [1]. In fact, the line between natural and man-made landscapes is difficult to draw because humans have a long history of altering nature. Therefore, it is more appropriate to understand the urban landscape as a complex complex of natural and artificial landscapes. Cities are the most densely populated areas on Earth and the most active hubs of human activity in terms of population, resources, environment, infrastructure, and information. As a popular concept of a new generation of urban forms, smart city is gradually infiltrating the urban economy, economy, and ecology, which defines an important aspect of urban planning and management. Based on advanced information technology, it has become essential to create a highly interconnected urban service intelligence platform to meet the growing needs of human life [2]. The construction of smart cities is changing with each passing day, and people pay increasingly attention to the understanding of the urban landscape that exists in three-dimensional space. However, the current two-dimensional technology cannot meet the needs of the current society in the field of urban landscape design. There is an urgent need to establish a three-dimensional urban landscape model that accurately describes the spatial organization and characteristics of each urban landscape.
The rapid development of cities has led to many complex problems. The purpose of smart cities is to solve these problems with scientific methods. Urban green space (UGS) is an essential component of urban infrastructure. Approaches to smart UGS planning and sustainable landscape design help to integrate the ecological performance and other functions of UGS. Shan J proposed a novel UGS classification method based on functional combination. Ultimately, he optimized UGS based on public preferences and the current state of the site. It was found that the number, function, and management of scenic UGS improved according to public preference. Residential UGS has improved in number and accessibility. Commercial UGS, office UGS, and road UGS have been improved in terms of quality. These results provide innovative insights for smart UGS planning and sustainable landscape design [3]. Proper RE used a computer-based three-dimensional (3D) task. Individuals navigate to 21 locations in a realistic cityscape. In the test, participants were asked about their knowledge of the map’s classification and coordinate space. In this study, the classification and coordinate tasks may have inadvertently encouraged the linguistic encoding of learned spatial information. It has the potential to confuse spatial processing with the ability to recall language-based information. In addition, this study used an intersubjective design, which precludes the study of the relationship between spatial knowledge and hand function [4]. As one of the new urban forms, the impact of smart city on the city is still in the exploratory stage. Therefore, it is necessary to fully analyze the impact of smart cities in the field of urban planning. It actively explores planning ideas and methods that are compatible with the planning and transformation of old cities. Liu J studied the optimization of urban spatial structure on the basis of applying the concept of smart city. It focuses on developing the tourism industry, building an intelligent transportation system that prioritizes public transportation, and improving infrastructure construction. It provides guidance for the smart renewal of the old city [5]. With the application of ICT in various fields, our daily life is changing rapidly, and the concept of smart city is spreading. However, in the field of landscape design, preparation for changes in society due to technological evolution is not enough. Lee H S explored the concept of smart parks, investigating how smart technology can be applied to parks. He also determined user perceptions and satisfaction with smart park services. Smart parks can be defined as sustainable parks. By utilizing a variety of high-tech to improve the user’s experience in the park, it also solves the social and environmental problems faced. The survey results showed that AR services used for education in the history section had the lowest usage, while solar-powered benches and WiFi services were the top favorites for park users. In short, intelligent technology needs to be combined with diversified park contents and more focus on user needs. It provides services to enhance safety and environmental management to develop user-oriented smart parks [6]. Smart cities play a key role in improving the overall productivity of a city and the quality of life of its residents. But it’s still a relatively new concept, and research into its construction is still evolving.
3D rendering of urban landscapes requires consideration of various urban components. Current urbanization trends and the adoption of flexible and innovative transportation technologies will have complex and unpredictable impacts on urban transportation systems. Few approaches have been able to incorporate urban data in large quantities in planning tools, providing the flexibility of scenario-based design. Feygin S A introduced the Berkeley Integrated System for Transportation Optimization (BISTRO). This is a new open source transportation planning decision support system. It uses agent-based simulation and optimization methods to predict and develop plans to adapt to possible technological disruption and growth scenarios. He demonstrated the utility of BISTRO as a human-in-the-loop cyber-physical system: it uses scenario-based optimization algorithms as a feedback mechanism to assist urban planners iteratively refine the objective function and constraint specifications for intervention strategies. Ultimately, the combination of transportation intervention strategies he selected achieves high-level regional planning goals developed through participatory stakeholder engagement practices [7]. Filtering is one of the key steps in generating digital elevation models (DEMs) from airborne light detection and ranging (LiDAR) data. Most of the generated features are point-based geometric information. Several redundant and irrelevant features do not necessarily improve the filtering accuracy. Cai Z proposed a feature selection method using minimum redundancy-maximum correlation (mRMR) combined with Parzen window optimization to handle both discrete and continuous features. He constructed a subset of optimal/suboptimal features for use in machine learning filters in various landscapes. The experimental results based on AdaBoost show that the height-related features, especially the height itself, have the greatest significance in both urban and rural scenes. Furthermore, through a feature selection strategy, it can select different subsets from the datasets of the two landscapes. This increases the correlation of data describing each geographic landscape [8]. JiangXu analyzed the current state of the construction industry and project management issues during the construction phase. He then analyzed the principles of BIM application and the process of BIM-5D modeling. He then focused on the comprehensive application of BIM5D in the construction phase supported by large-scale central projects. It includes end visualization, paper review and collision detection, 5D construction, simulation, etc. He finally evaluated the effect of BIM application [9]. These methods provide some references for our research, but due to the short time and small sample size of the relevant research, this research has not been recognized by the public.
This paper discusses texture-mapped image modeling techniques. This paper applies these techniques to model the reconstruction of complex objects. It constructs a three-dimensional urban landscape with a high degree of realism. In order to make the landscape rendering faster and the quality clearer, he used the texture LOD algorithm. After a simplified algorithm to form a 5-level LOD, the number of parts for the original model is 120, and the number of parts for LOD4 is 12. Relative to the original model, the resulting incremental LOD sequence is a decomposition of the original model with hardly any new objects added. In the 3D reconstruction process, the recognition rate is above 80% for test images with complex composition. In the comparison of the scene rendering speed using the LOD algorithm and the scene without the LOD algorithm, it uses the LOD algorithm to draw faster than the LOD algorithm without the use of the LOD algorithm, and the speed of the geometric LOD algorithm is 8.852 frames/s. By calling the built model for 3D visualization, the results show that the final modeling effect of the building model under different viewpoint heights can display an average of about 45 frames. It can fully meet the needs of 3D city model visualization application efficiency and effect.
Methods of 3D urban landscape rendering and optimization algorithm
3D urban landscape under smart city
Smart city is a new concept and a new model of urban development based on a new generation of communication technology. It integrates and evaluates various information sources of the city and responds quickly and effectively to the needs of various social activities. It brings great convenience to people and realizes the mode of smart management and operation of the city [10]. Smart cities use intelligent technologies to capture, analyze, and integrate core information from key urban systems to accelerate system response. It promotes effective interaction and collaborative innovation among urban planning stakeholders, and it develops and creates better urban life for people. In the conceptual model of the smart city, “data and service integration” is an important part of the technical elements. And 3D data modeling is a key part of “data and service integration” [11], as shown in Fig. 1.
In essence, smart cities are characterized by comprehensive data understanding, deep integration of information networks, and sustainable development [12].
Comprehensive data understanding in smart cities is based on the materialization of ubiquitous central communication networks. It utilizes smart sensing devices (sensors, RFID components, etc.), Internet and mobile communication networks to achieve real-time sensing of infrastructure and information systems operating in cities. It also transmits various types of sensing and processing information securely and reliably in real time [13]. The deep integration of smart city information network includes the comprehensive capture and collection of key information of city operations through the Internet of Things. It then securely and reliably transmits the information collected and captured by the IoT to the city information platform for intelligent analysis. The processed information is then transmitted to the smart city application layer through the network [14]. The sustainable development of smart cities refers to the use of information technology to optimize their own services by the originally independent departments of the city, which makes the city an interconnected whole composed of multiple subsystems. It also coordinates and plans public administration departments and various city departments through the Smart City information service platform. It promotes the harmonious and sustainable development of the city.
Smart city conceptual model.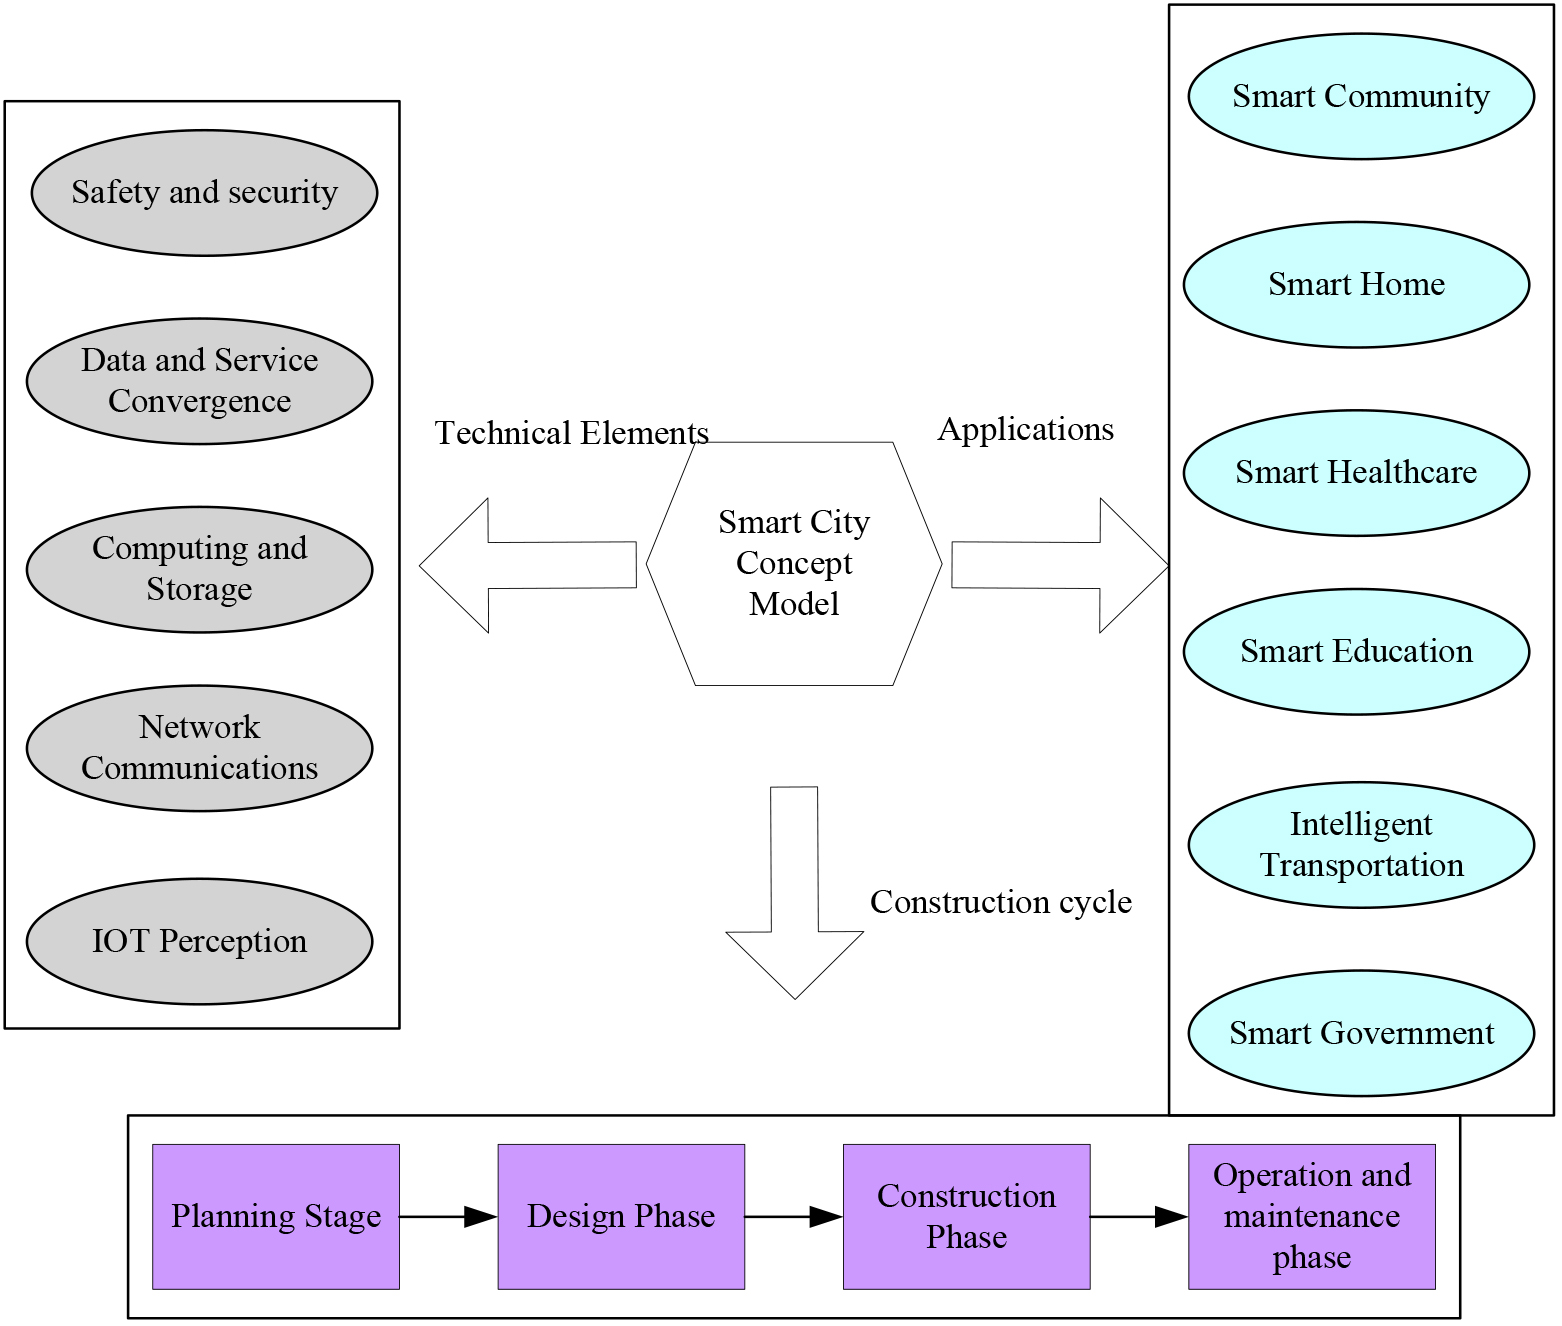
The 3D data modeling project involves the production of 3D geographic information maps that conform to general smart city standards by integrating and processing different types of data collected in the field [15]. It provides basic data support for future intelligent mining analysis, data management, governance, and various service applications.
The establishment of a three-dimensional urban landscape first includes an abstract definition of the real world, that is, the content of expression. This is the premise and foundation of building a three-dimensional urban landscape. At present, 3D visualization technology mainly includes computer perspective method, computer drawing, and 3D model, virtual reality, etc. [16]. The performance comparison of various visualization technologies is shown in Table 1 (1
Comparison of visualization methods
Object-oriented thinking has made great progress in the conceptual model, logic model, system design, and implementation of GIS. Before discussing architectural geometric modeling technology, it is necessary to clarify the terminal expression of spatial objects, that is, to use computers to describe three-dimensional entities, to facilitate their management and storage [17]. From the set of actual three-dimensional objects A to the features representing the set B, it can be regarded as a mapping off.
Boundary representation is a method of defining and describing three-dimensional objects in terms of object boundaries. The data structure of boundary representation usually includes five levels: body surface, surface, ring table, edge table, and vertex table [18]. Boundary descriptions focus on the details of an object’s surface. It also describes in detail the geometric features of each geometric element and the relationship between them, that is, topology information. In 3D modeling, the most commonly used is boundary representation [19].
The key to boundary representation is how to represent a three-dimensional surface. Surface representation is divided into algebraic representation and parametric representation, and the algebraic representation is further divided into implicit representation and explicit representation [20].
The display is expressed as:
Implicitly expressed as:
The parameters are expressed as:
Texture mapping is a computer graphics technique. It was developed to improve the fidelity of the objects it represents and to increase the fidelity of its representation without affecting the geometric elements of the model and its complexity. In the process of 3D visualization, if the model only adopts lighting technology, there is a big gap between what people see through the computer and the real world [21]. Texture mapping is the key to successful 3D visualization.
Texture mapping technology is used to represent the rich texture information of the feature surface, which can be done in two steps, as shown in Fig. 2.
It determines which surface parameters should be defined as textures, that is, define texture attributes. It defines the mapping relationship between the texture space and the display space and between the display space and the screen space, that is, defines the texture coordinates.
In terms of simulation, the use of textures can greatly simplify the modeling of complex models, but this can overload the system if a large number of textures or high-resolution texture images are used [22]. The improvement strategy is to divide a large texture into many small textures, and then find a representative texture image as the stitching factor. This way, these small images can be blended to form the result of one large image. Like terrain texture mapping, many small textures can be used to simulate large bodies of water based on the waterline of a lake or reservoir.
Texture mapping process.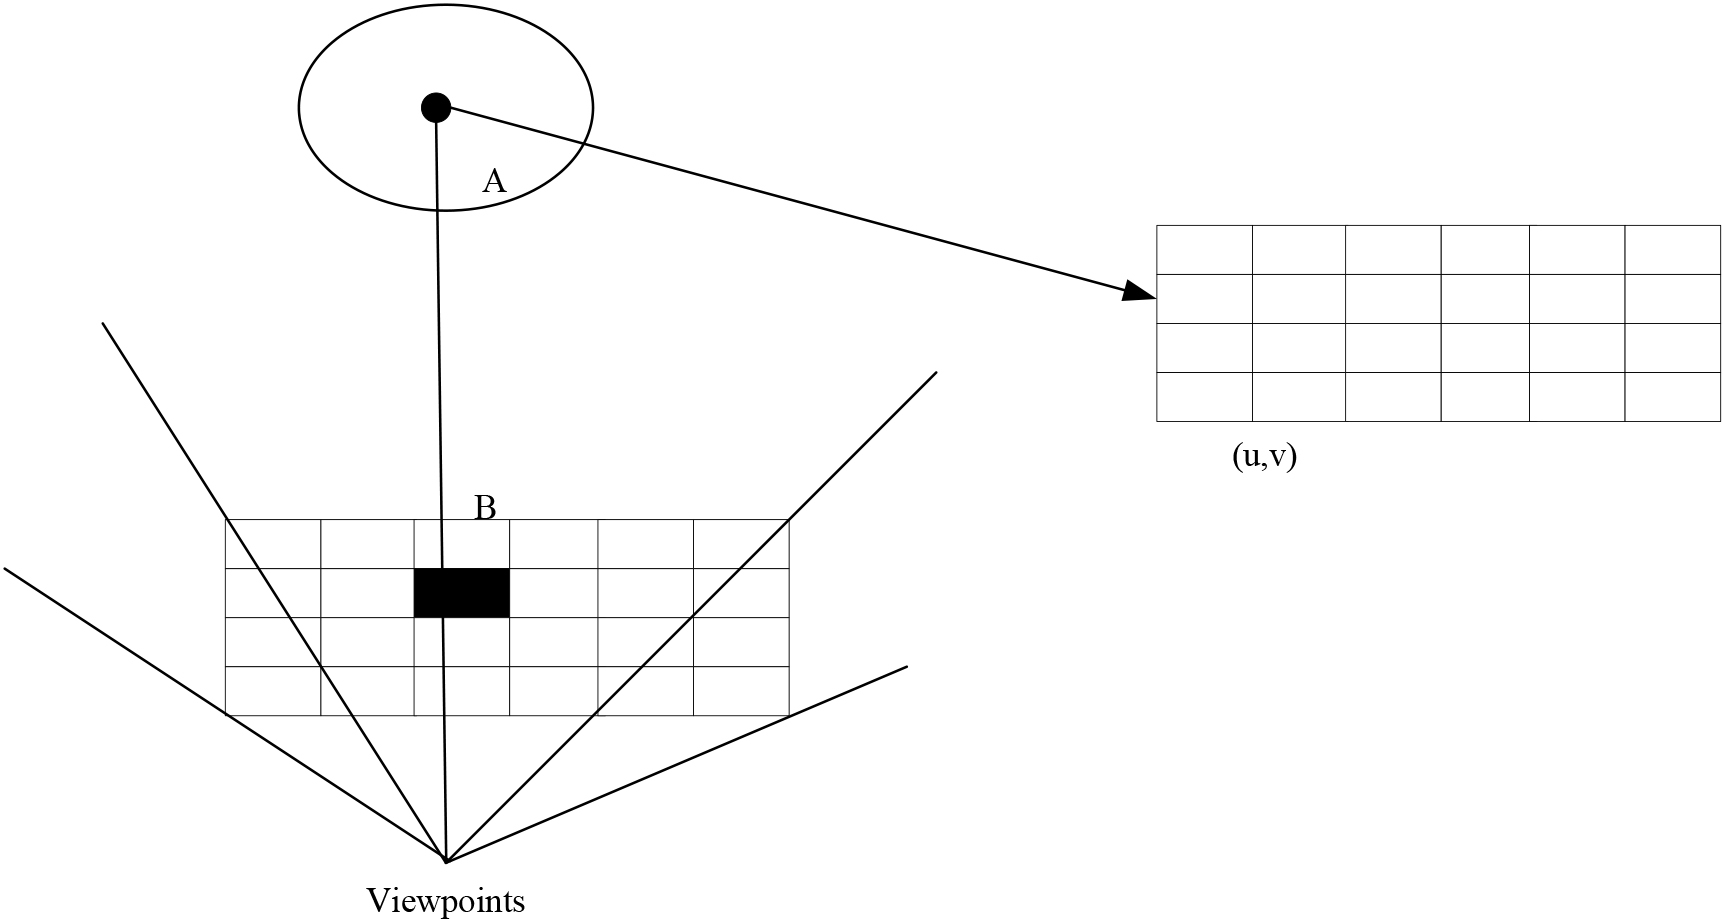
Taking a sloping roof house as an example, the roof of a sloping roof house is a slope, as shown in Fig. 3. Assuming that the three-dimensional coordinates of each corner of the roof in the figure are
So
The lower roof elevation
So
Based on the above geometric data model, the outer wall of the house can be divided into clockwise triangular meshes by directly dividing the polygons. It is constructed so that the normal vector of the triangle points outward, and the roof surface can be divided by the triangulation of the polygon. It is constructed with its normal vector pointing up.
According to the characteristics of human vision, as the distance from the viewpoint increases, the viewing angle of an object with a certain height in the field of view of the human eye will decrease. It exceeds a certain low threshold (5 or 10 pixels assumed in this article) and the visibility to the human eye is reduced. Conversely, the closer the viewing angle, the clearer the object. Figure 4 shows the specific relationship between visible distance, viewing angle, and model height.
In Fig. 4:
For an object of length
Cases with different visual tolerance values
Representation of a sloping roof house.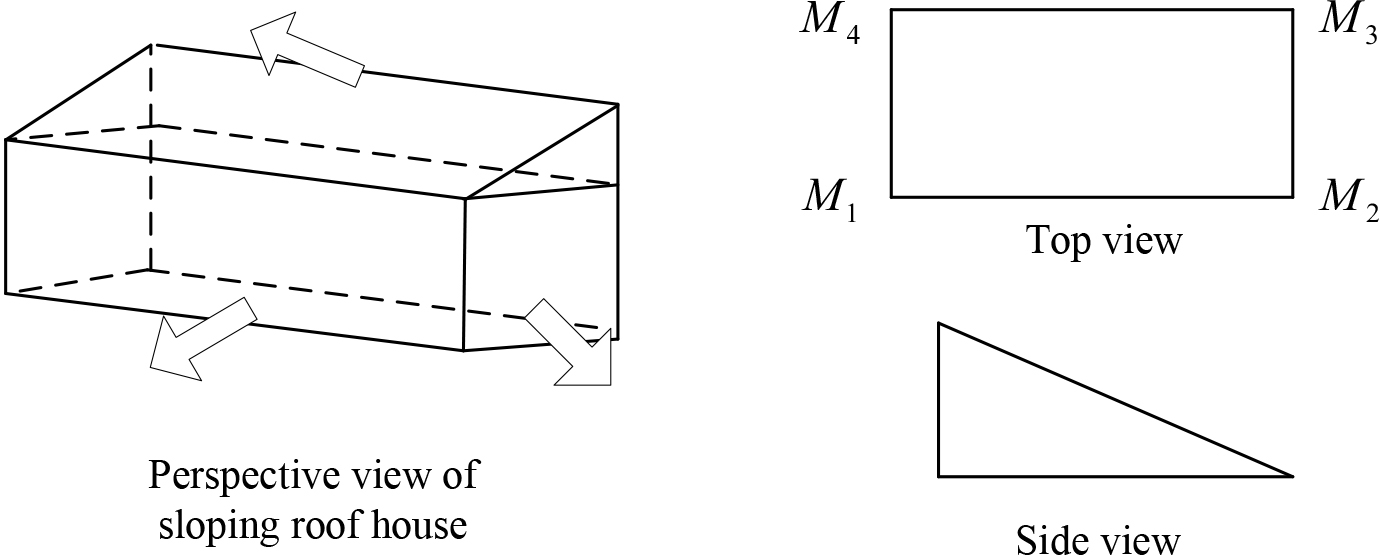
Relationship between viewing distance and viewing angle and model height.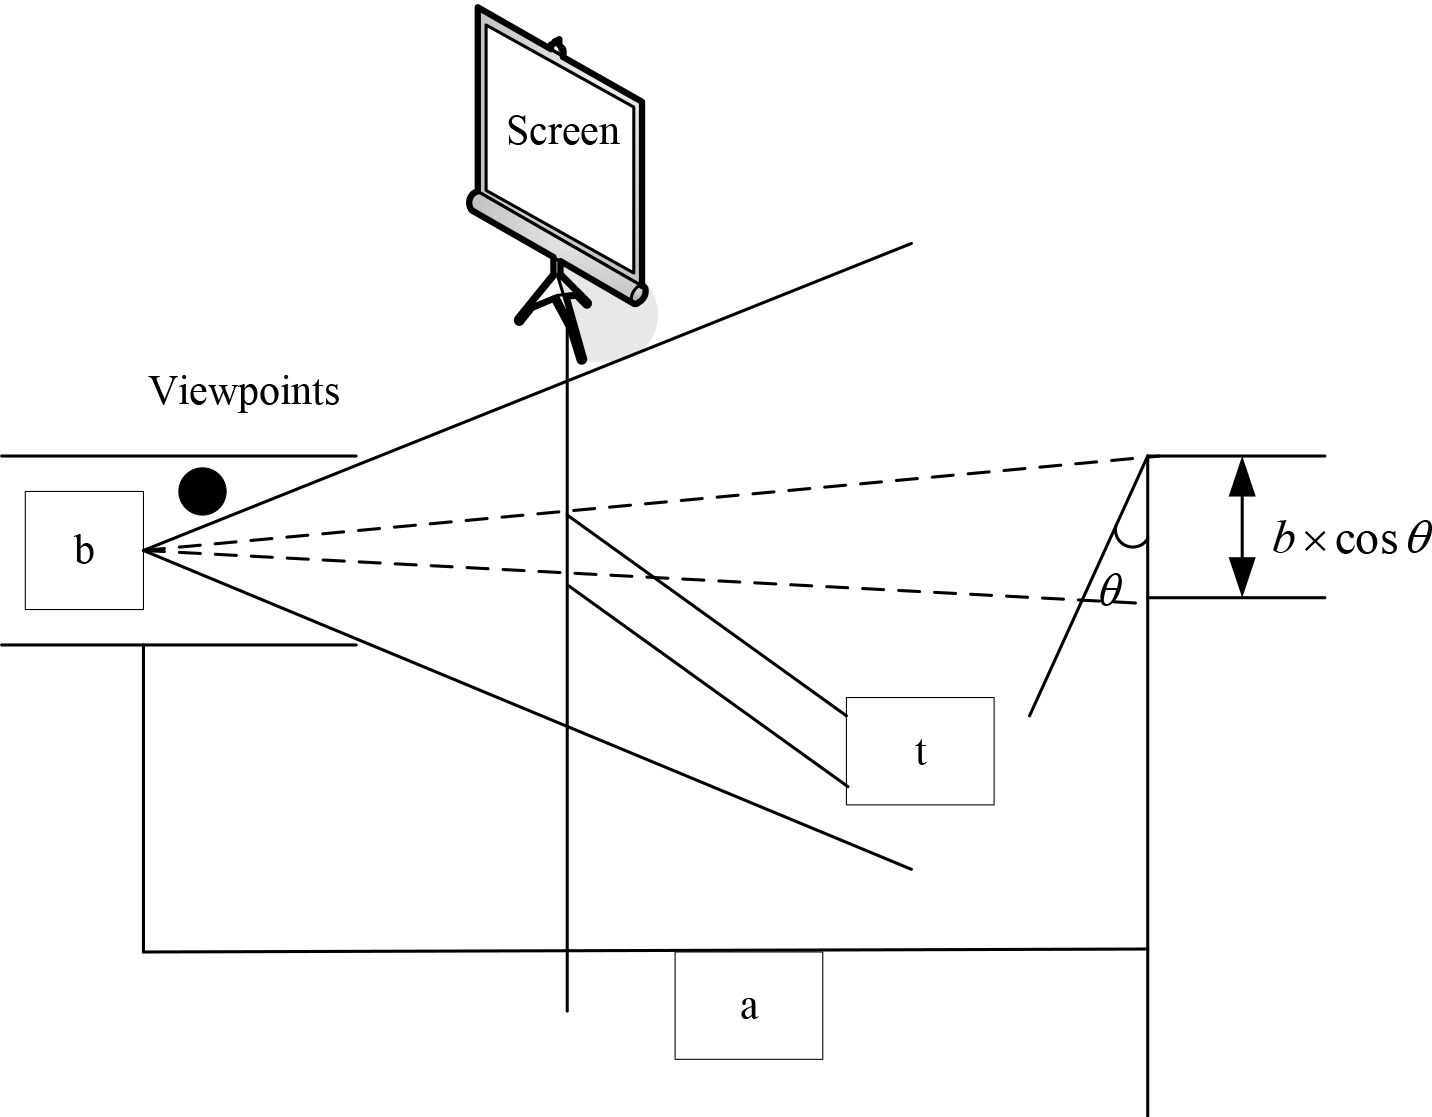
The diagonal length of the model object is:
When
Using a visual tolerance value of 10 pixels, an acceptable model object within 5000 meters has a radius of 40 meters.
In the realization of 3D visualization, the system requires that the model of the 3D scene is fine, beautiful, and realistic, and at the same time requires the system to operate with high efficiency, which requires the processing of massive 3D model data [23]. This requires the computer’s hardware configuration and software performance to meet the standard basis to accelerate the rendering algorithm. Nowadays, the continuous improvement of computer hardware technology and the double buffering and display list technology possessed by OpenGL technology have been required for the construction of three-dimensional scenes. Graphics and textures allow for accelerated rendering. However, optimization in software is also an extremely effective method to increase the speed of model generation. Accelerated rendering algorithms optimized for the models fall into two categories: visibility culling and LOD models.
The premise of visibility culling is to be able to efficiently identify visible parts of a 3D scene. The basic idea: in these visible cases, the system will automatically process these visible polygons, but not these invisible polygons. The most basic principle is to reduce the number of borders of polygons, which can speed up the drawing speed of the scene.
Object picking
Within the visible range of the viewpoint, if the bounding block of the object is not within the range of the field of view, it is required not to perform further surface rendering processing in this area. Sending some objects is called being picked, and the basic idea is to set a field of view and locate the field of view within an arc range along the line of sight. Area objects outside the arc are identified as the selection range, as shown in Fig. 5.
Object picking principle.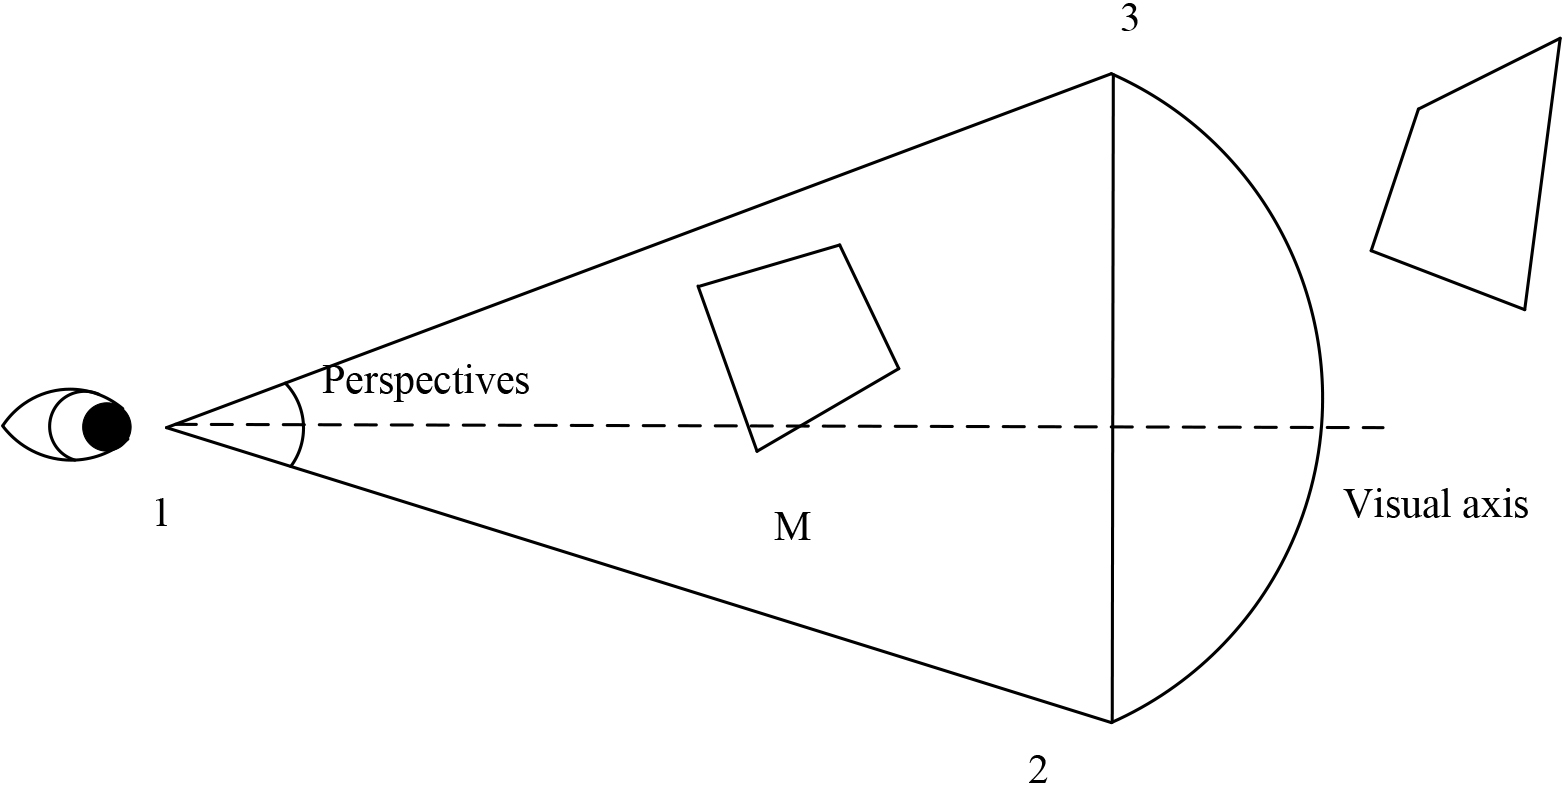
Usually, the objects within the viewpoint range are all facing the direction of the viewpoint, and the other side is back. Therefore, the objects whose back faces are facing the direction of the viewpoint should be culled within the field of view, and the geometric surfaces that are not common to the viewpoint should be eliminated, which can reduce the polygon memory by half and improve the drawing speed. The basic idea: let T be a certain line of sight direction, N be the normal of the geometric surface of the object, and assume that the angle
If
It is assumed that distant objects do not need to show much detail, because the operator cannot distinguish the details of these distant objects. Therefore, objects beyond a certain distance can be represented by fewer polygons without affecting the overall visual quality. This technique is called level of detail switching.
Immersion is the characteristic of city 3D display, and the premise of obtaining immersion is the full entry of viewpoints. Due to the occlusion of various spatial objects (including tall buildings) in the city, the fully entered viewpoint limits its field of view to a certain extent, and may not be visible to far areas and areas beyond the field of view. By eliminating these invisible redundant data, only the data in the visible range is drawn, and in the visible range, LOD models of different levels are displayed in sequence according to the distance of the viewpoint. This can significantly speed up the rendering of 3D scenes. The specific implementation is shown in Fig. 6.
Redundant data culling based on viewpoint distance and visible surface.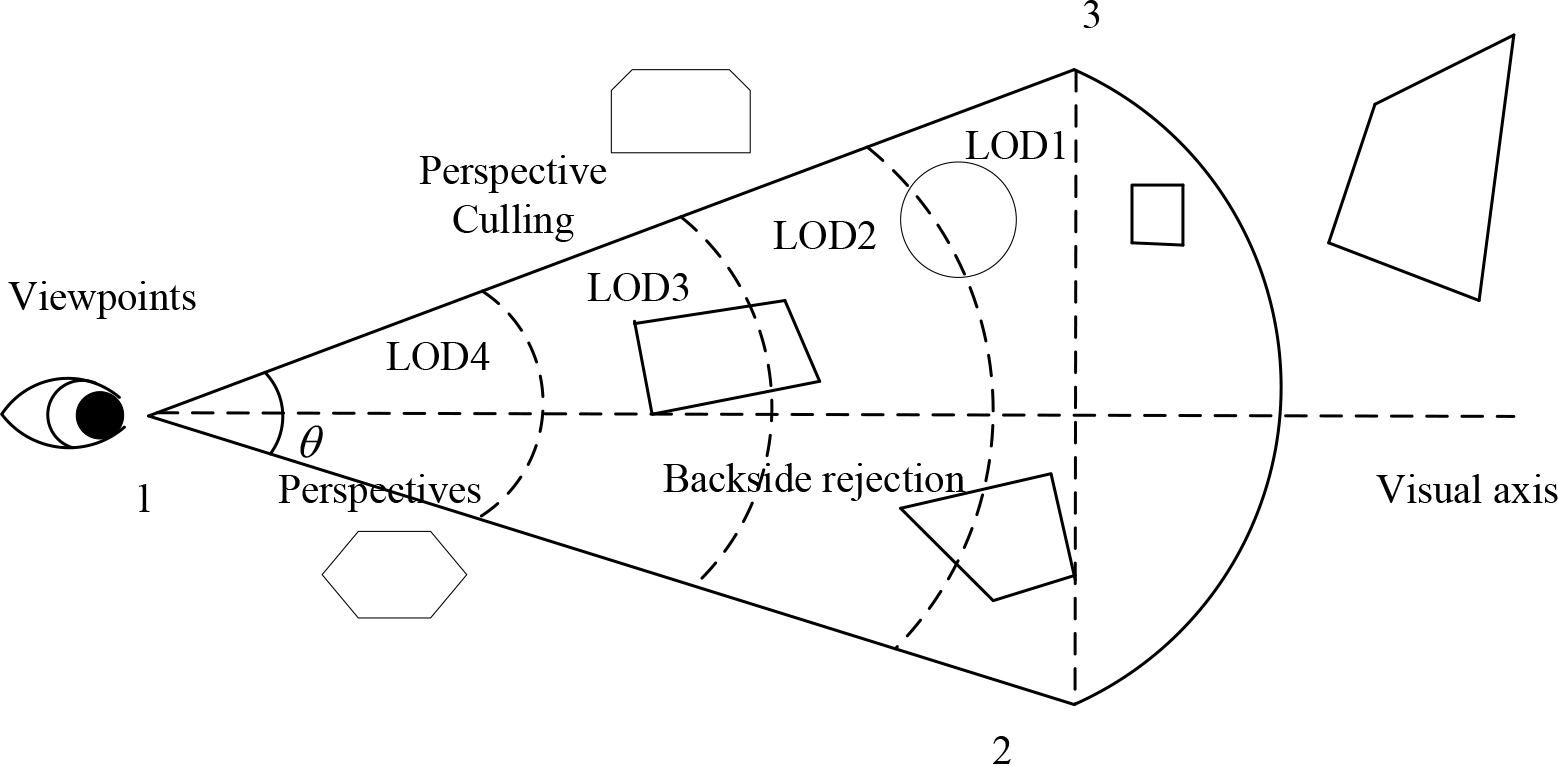
According to a certain field of view, the field of view is determined within an arc along the viewing axis, and objects outside the arc are considered invisible. It calls the LOD objects of different levels for the objects in the arc according to different distances. This method greatly reduces the amount of data that needs to be drawn, thereby improving the drawing speed. For the algorithm of judging whether the object is in the arc, it can be replaced by judging whether it is in the triangle. The specific algorithm is as follows: For the general space object, it can establish its boundary block. It is usually a rectangle, set a vertex of the rectangle as
Among them
For the entities within the field of view, the importance of each entity and the distance can be weighted to determine the fineness of the description of each object. Here, a fineness function
Among them,
In general, various collision detection algorithms require collision detection between the moving point and the triangular surface to be detected. It creates an outer selection bounding box for a computer-generated 3D geometric model. Regardless of the shape of the object, the box’s bounds are always parallel to the
Calculate the coordinates of the center of the object (
Therefore, the collision of the two bounding boxes can be easily tested by the distance between the corresponding center points of the two objects and the three-dimensional size of their bounding boxes. Suppose there are two objects
Among them
On the basis of using the bounding box method as the basic method of collision detection, we adopt some improved methods to improve the speed of collision detection and make up for the shortcomings of the basic method.
For large scenes with many objects, the box-based approach requires real-time collision detection for each object in the scene during the walkthrough. Undoubtedly, this will put a large computational load on the system and reduce its performance. For this reason, split filtering methods can be used to reduce unnecessary computation by filtering out unneeded data. Segmentation filtering is the process of dividing the virtual space into a regular grid, thereby dividing the objects in the scene into smaller groups. A regular grid of the virtual space is partitioned, and the corresponding flat index tables are created in memory. The purpose of this method is to reduce the number of feature comparisons when the system performs collision detection. When navigating the virtual scene, simply locate the grid where the viewpoint is based on the view index table. It then collides all objects on the mesh from the viewpoint, reducing the collision detection calculations and increasing the collision detection speed.
A BSP spatial binary tree is used to speed up the classification process of polygonal scenes when the viewpoint changes, allowing for proper subtraction. The establishment of the BSP tree is independent of the viewpoint. So when the viewpoint changes, we can quickly determine the order of polygons in the scene based on the spatial classification of the BSP tree in the viewpoint. It can significantly improve the speed of collision detection. Since BSP can only be applied to collision detection between moving viewpoints and stationary objects, it cannot detect collisions between two or more moving objects.
PowerCity3D takes into account the difficulty of implementing real-time LOD methods in 3D city display. It adopts the offline LOD method, that is, the data in the scene is preprocessed by LOD, and the processed LOD models of different levels are stored in the spatial database. In the 3D display, it first realizes the data exchange between the memory and the hard disk with a certain data structure, and then selects the LOD model of the corresponding level in real time according to a certain criterion for display. Figure 7 is an organizational structure diagram of a scene LOD.
LOD organization of the scene.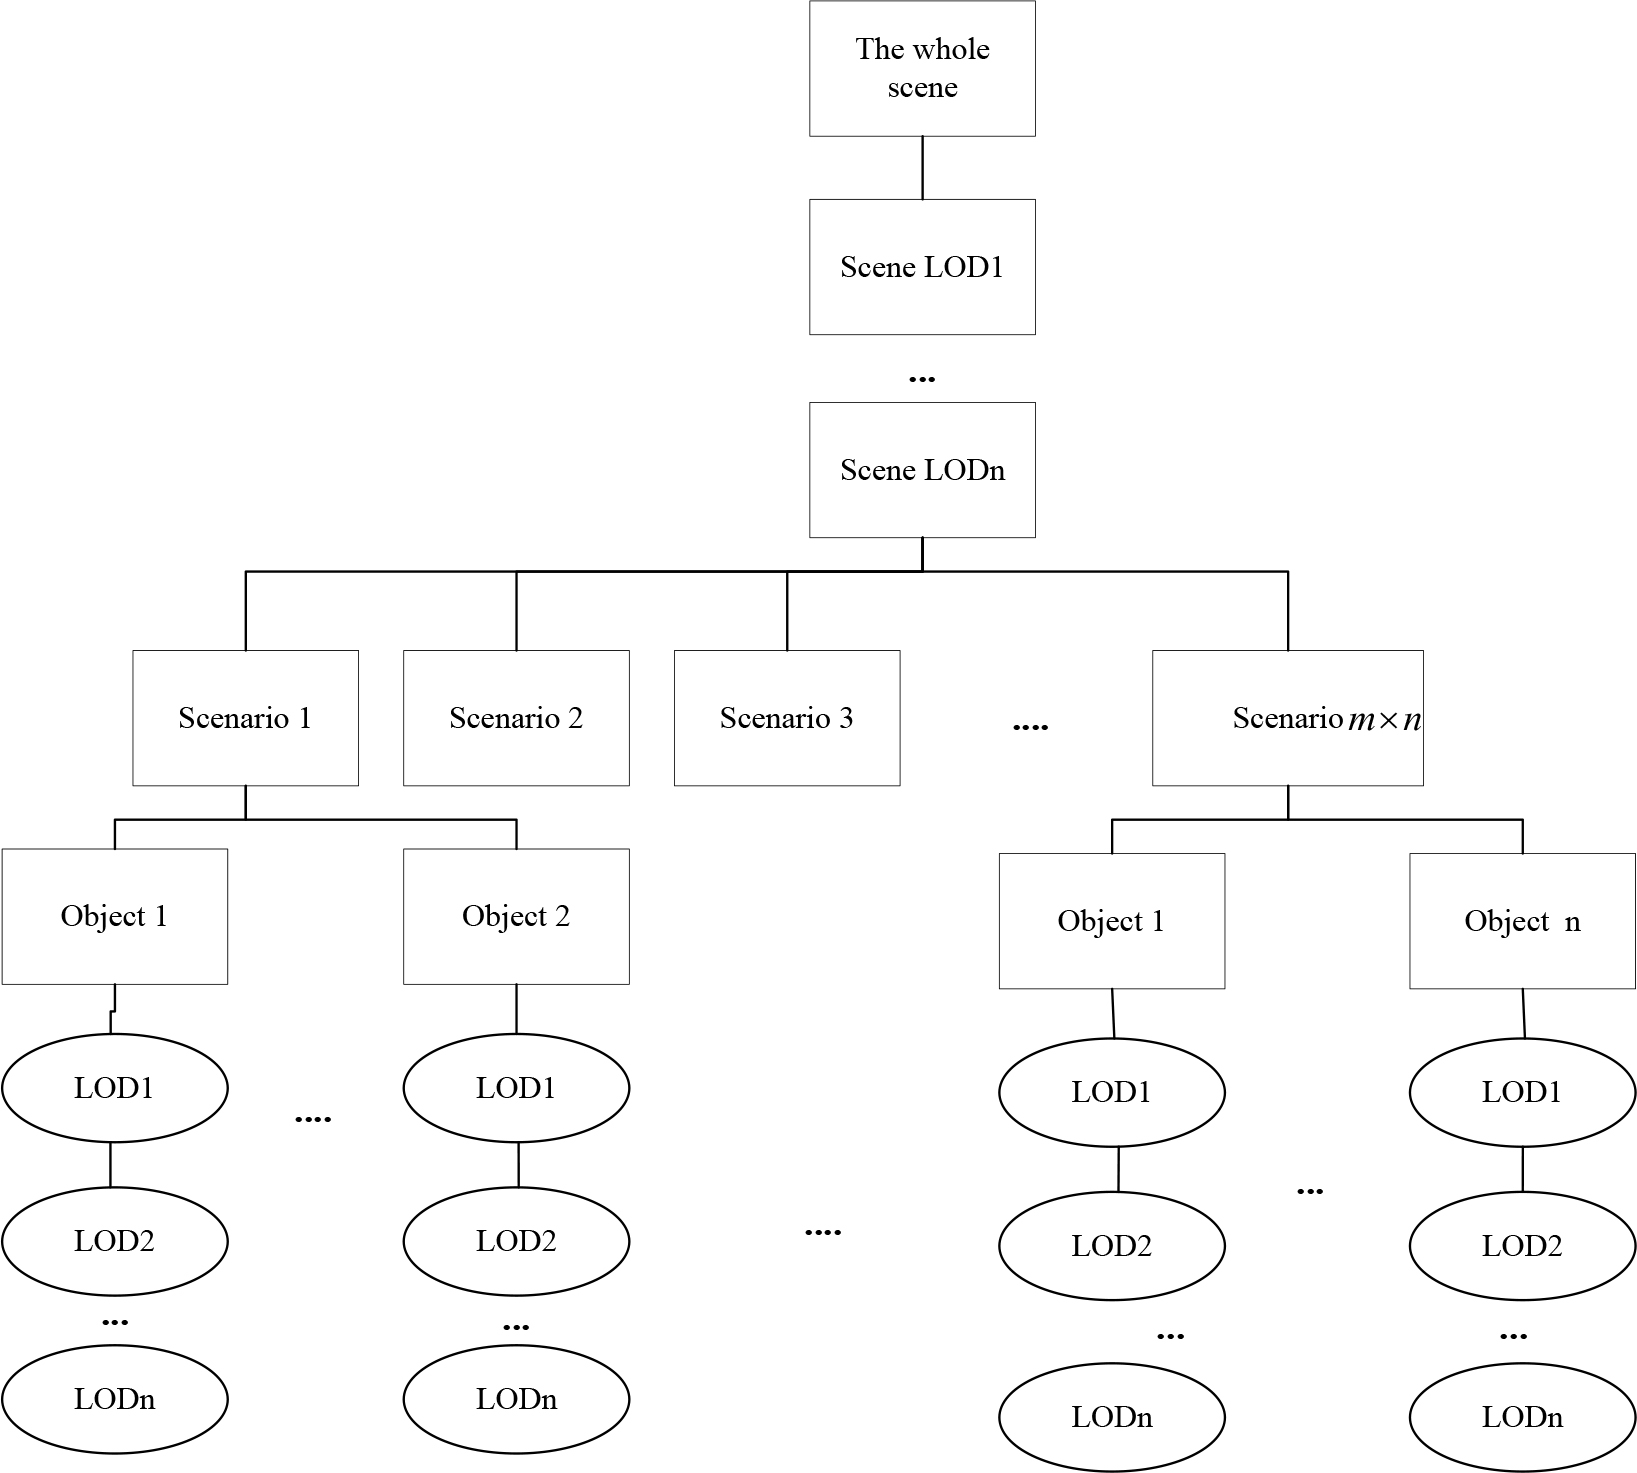
By effectively organizing the LOD model of various data in the scene, it uses viewpoint, distance, visibility, and object importance as the criteria for discrimination. It can effectively improve the display speed of the 3D scene by selecting the LOD model of the appropriate level for display. The disadvantage is that it will occupy more memory space.
In order to create an immersive feeling for users and make the model make meet the final requirements of project construction, it is not only required that the displayed object model is similar in appearance to the real building. It also requires them to combine the actual environmental characteristics, increase the texture, and change the shape. At the same time, it strengthens the effect of light slag, dyeing, smoke effect, and so on. The 3D MAX software is used for the 3D modeling of the ground objects in this project. The independent model of the space is fine and the texture is clear. The whole process is roughly divided into five parts:
Texture processing. Texture images obtained from close-up photogrammetry were modified using Photoshop software. It includes rotating, stretching, cropping, and stitching in preparation for making a complete and realistic image of the site’s texture. Special care was taken to ensure that the textures on both sides of the same building were consistent in height, and that all textures within the map area were tonal balanced to ensure the integrity of the main façade. Textures for individual elements include, for example, trees, lamp posts, public buildings, and structures. It also needs to be properly processed and eventually imported into 3D. Drawing in CAD. It uses AutoCAD to vectorize the landmark buildings corresponding to the aerial images. It then imports the vectorized data into ArcGIS to set a threshold for topology checking to ensure that all line segments are closed. If the original data is in XF format, it needs to be converted into DXF format.
Geometric information before and after generating the LOD model. 3D modeling of ground objects. It is based on the mentioned use of 3DMAX to perform fine modeling of ground objects. The commonly used modeling methods in the modeling process include stretching, extrusion, lofting, rotation, etc. When modeling, the shape of the model is first conceived, and appropriate methods are selected for modeling each part. It tries to choose a model with fewer edge lines to reduce the amount of data storage and improve the running speed of the system. Texture mapping map. A valid mapping relationship is established between the corrected texture pattern and the 3D object, and a UVWMAP modifier has been added to adjust the coordinates of the 2D texture image to ensure that it is mapped to the correct location on the 3D model. It selects different mapping views for different objects to ensure the authenticity of the 3D model. Drawing speed statistics table
Identification results of the number of test patterns.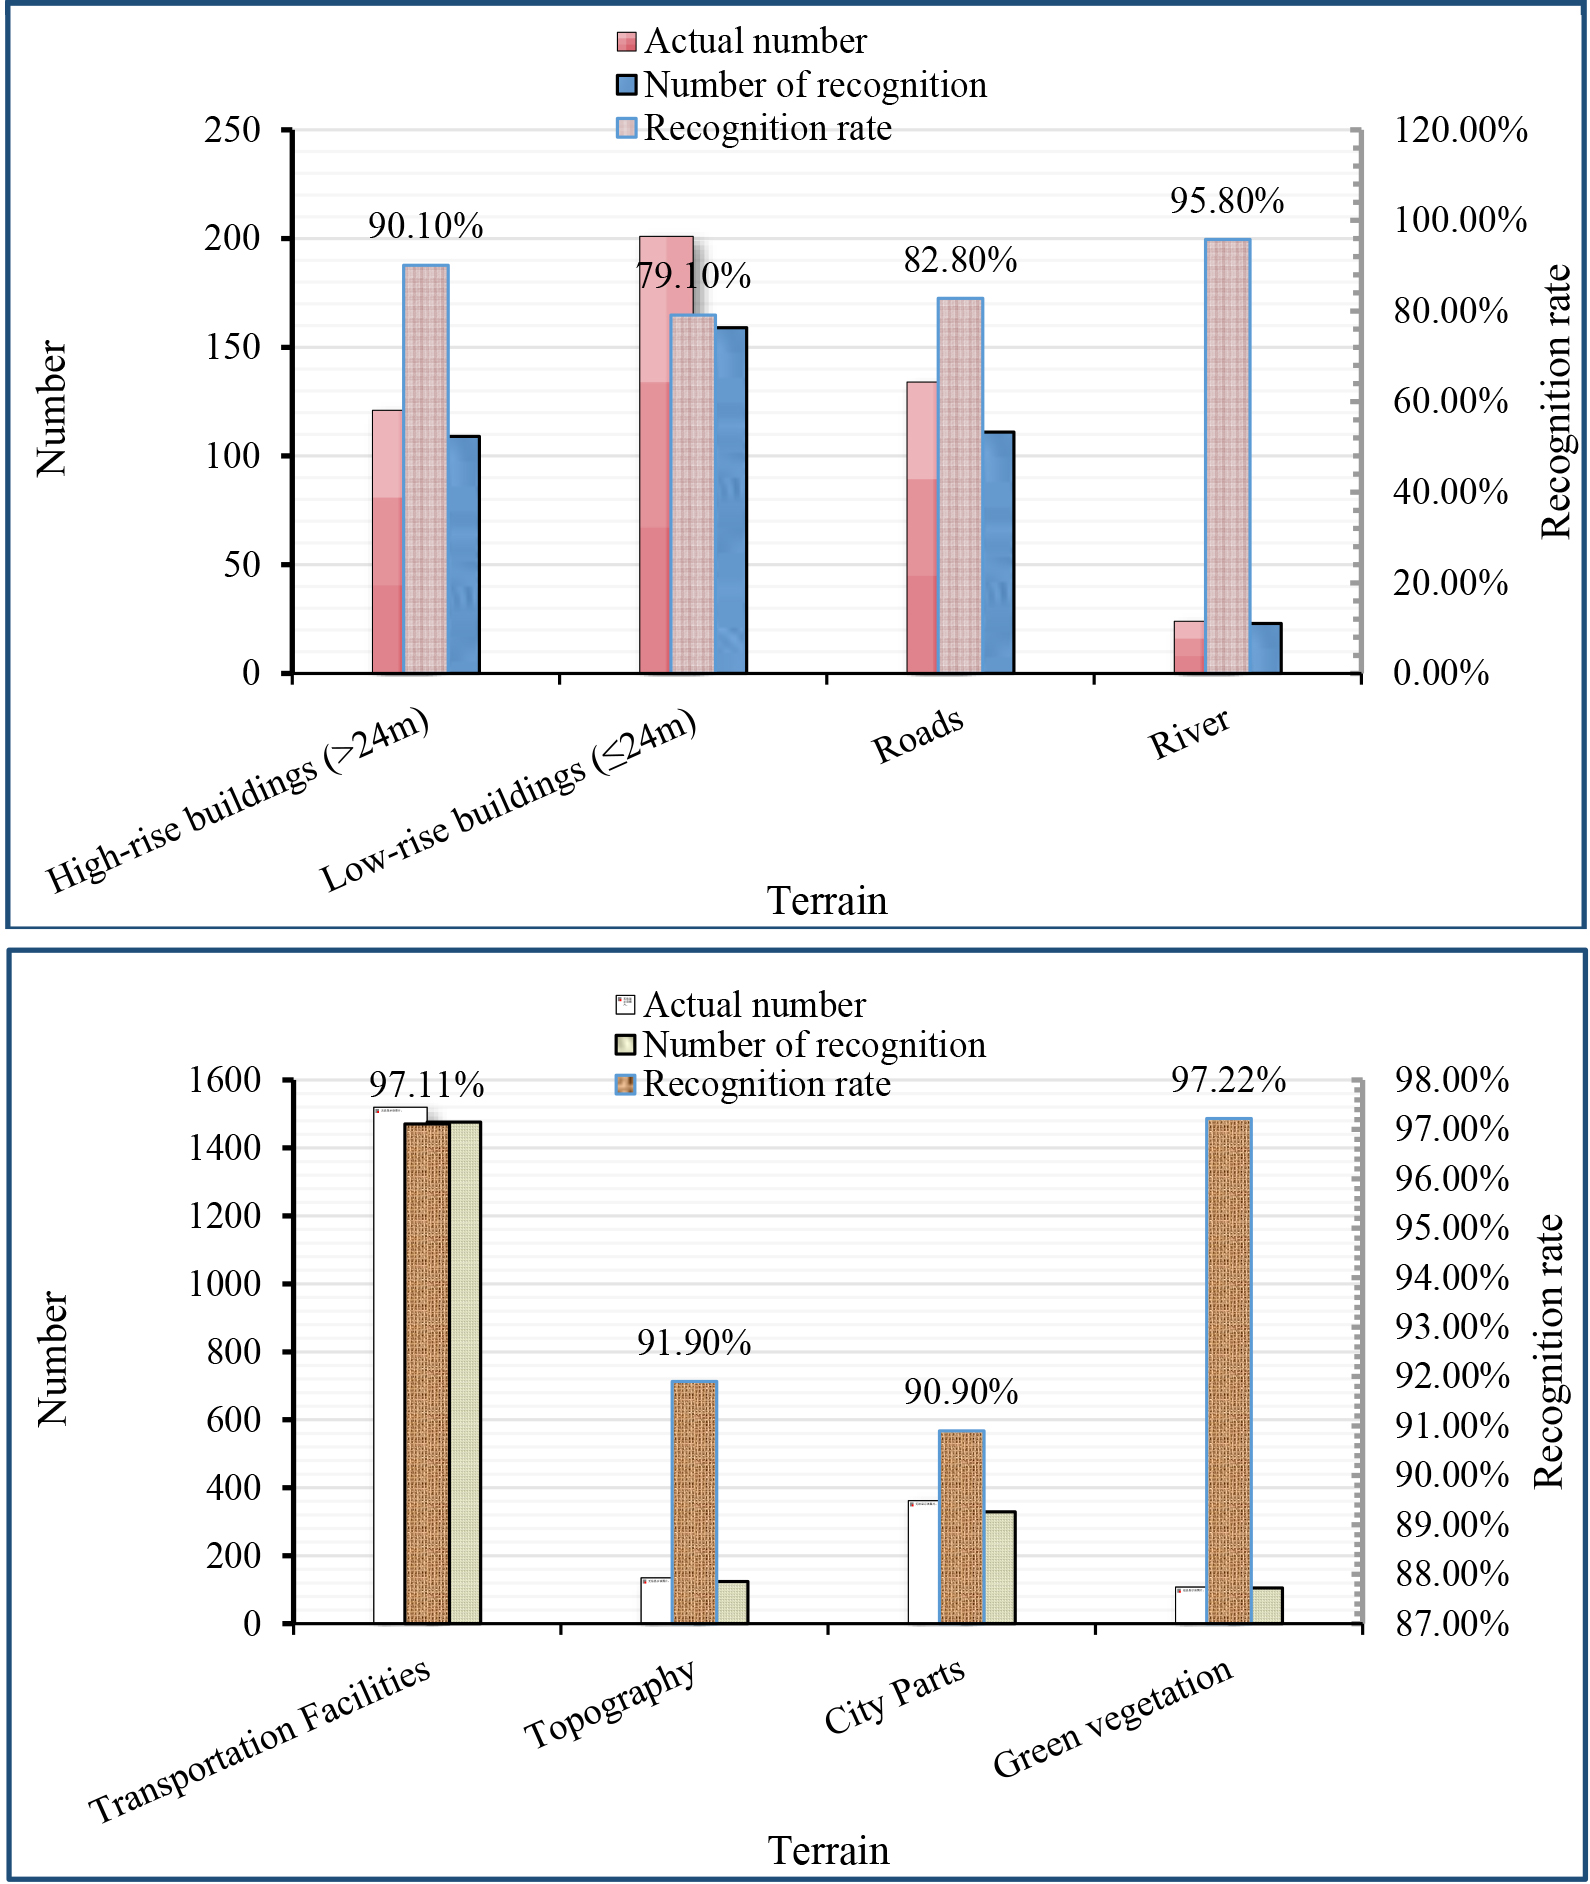
Export of 3D model. It converts the built model into *.x or *.flt format supported by Skyline. After conversion, the building models can be added directly to the MPT file in the TerraExplorer Pro module. After grouping all objects in the building before exporting, it determines the value of the midpoint of the building and changes the collapse of the stack, then exits the building as a single object.
Corresponding number of displayed frames at different viewpoint heights in large-scale scenes.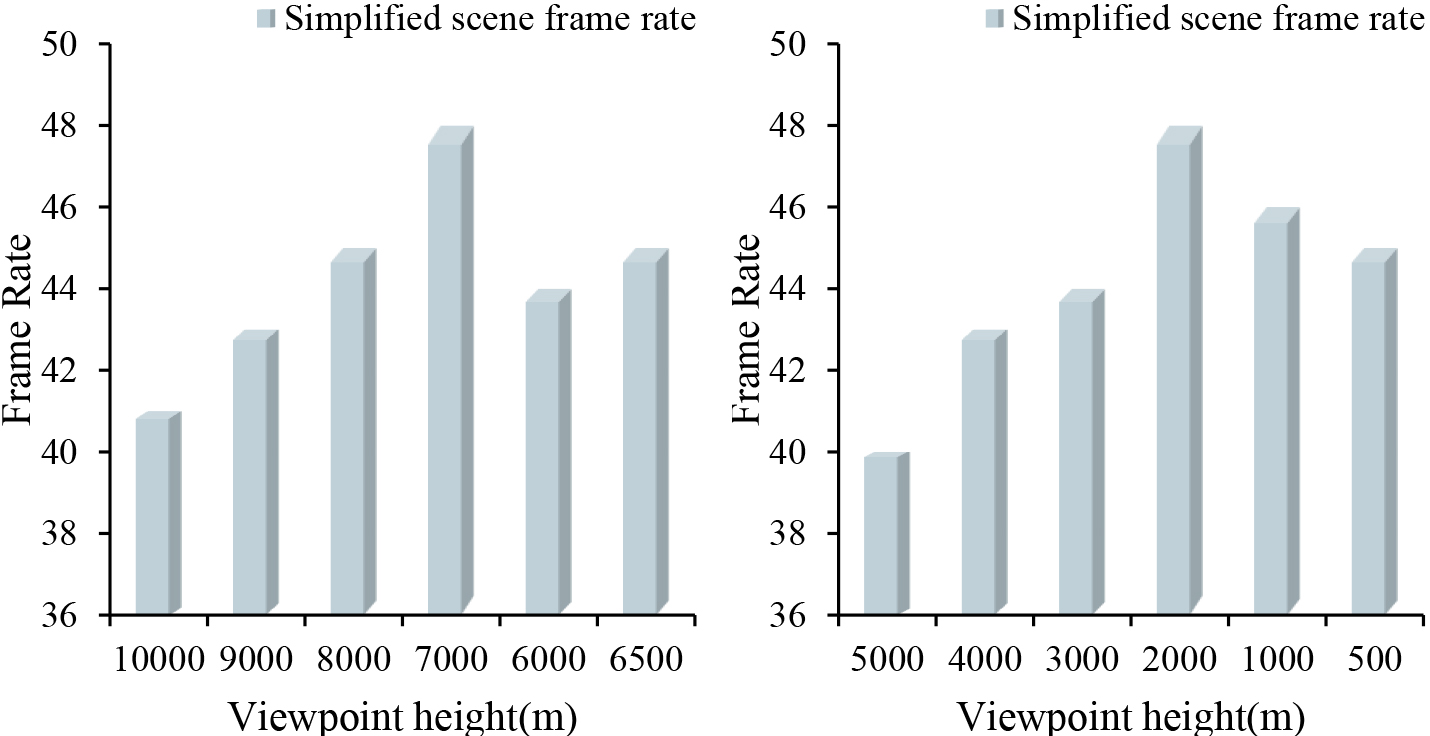
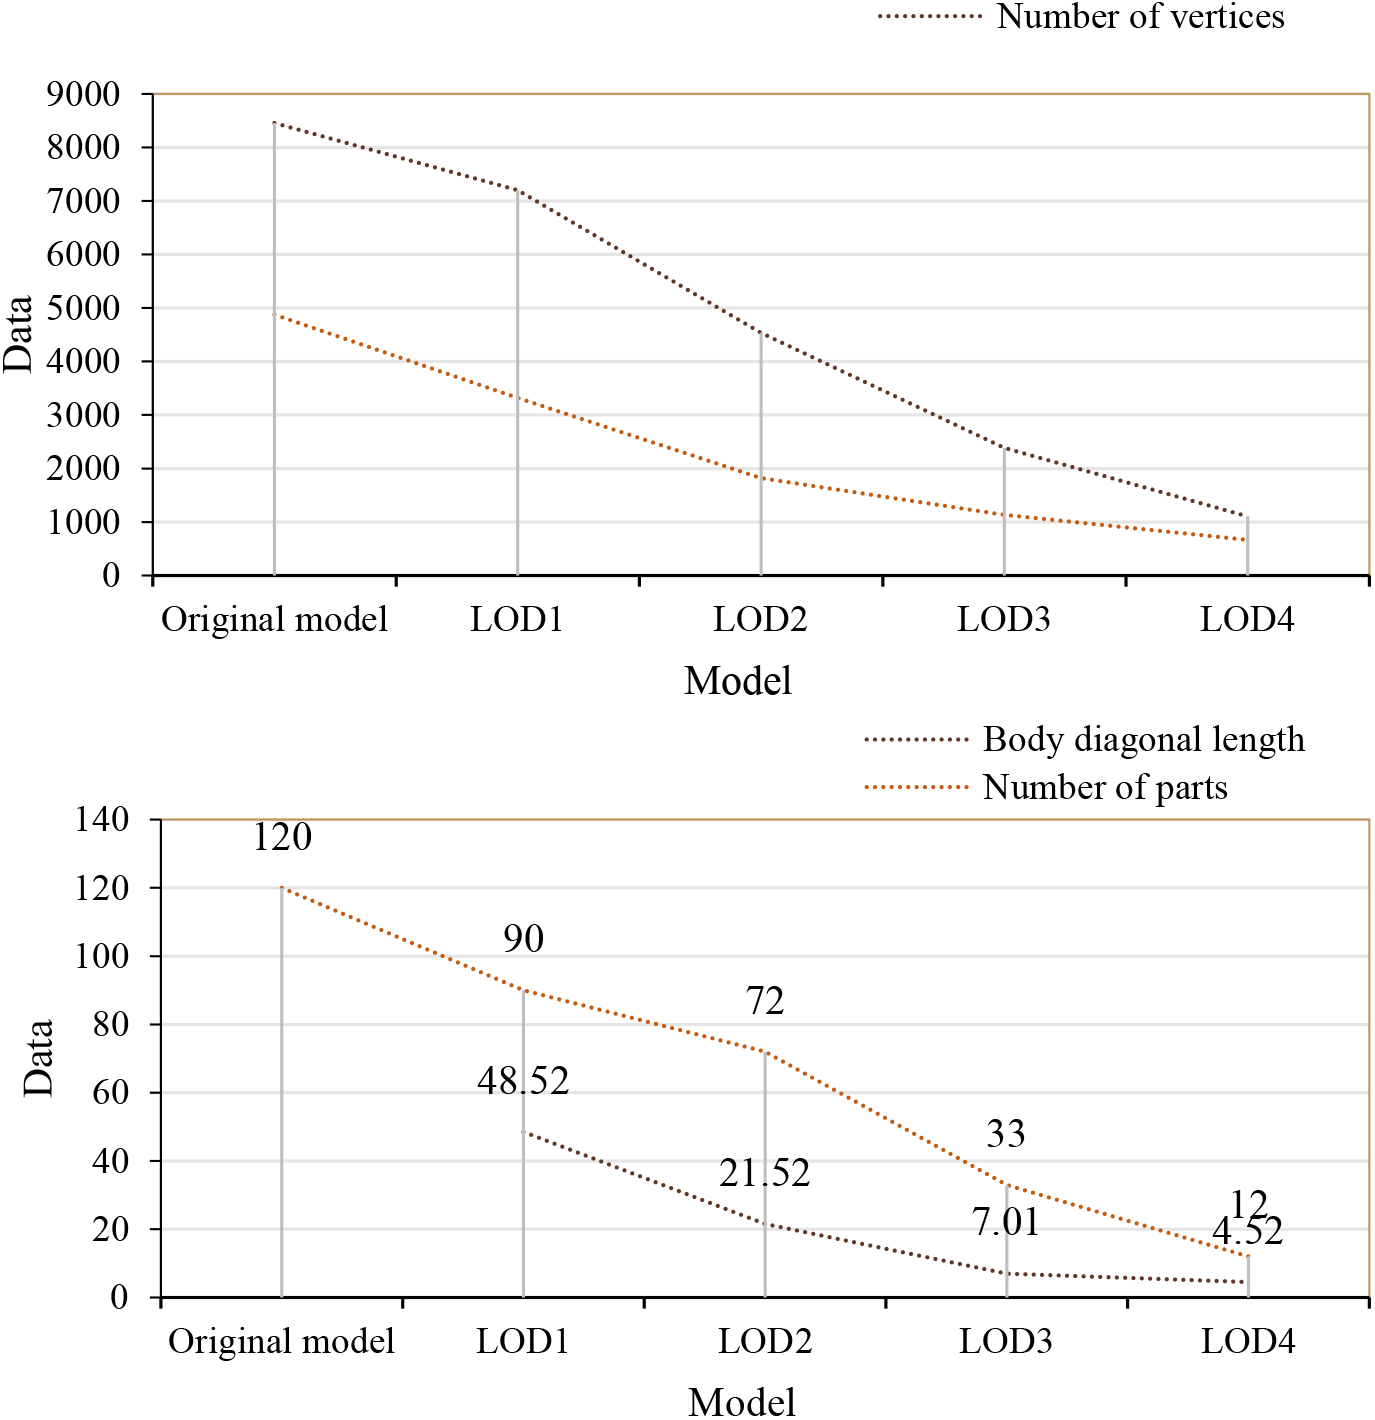
For a certain building model, a simplified algorithm is used to form a 5-level LOD, the geometric information statistics are shown in Fig. 8.
From Fig. 8, we can see that the number of parts in the original model is 120, and the number of parts in LOD4 is 12. Relative to the original model, the resulting incremental LOD sequence is a decomposition of the original model with hardly any new objects added. When parts belonging to different levels share the same texture, redundant storage of the same texture object can be avoided by recording only the texture name in the part. For the number of LOD-forming series, if the number of LOD layers is too small, the transition from layer to layer will be obvious. A large number of layers will lead to long calls to read the model data of different levels of detail, which affects the real-time design and fluency of the scene.
In the improved view segmentation method, according to the results of the two experimental test graphs, this method can handle the situation where the bounding boxes intersect and can correctly complete the view separation. In the process of 3D reconstruction, column and wall recognition can be completed for test images with complex composition. The identification data is shown in Fig. 9.
From Fig. 9, it can be found that the algorithm proposed in this paper is feasible, except that the recognition rate of rivers (82.8%) and low-rise buildings (79.1%) is low, and the recognition rate of other types reaches more than 90%. The system also realizes the preparation, reconstruction, and visual interaction of the three-dimensional architectural landscape. But there is less test data. In order to complete the test of the applicable drawings of various engineering drawings, the accuracy of the system cannot be rigorously summarized, and it needs to be strengthened in this aspect.
The PowerCity3D system uses a scene with a certain amount of data to verify the LOD algorithm proposed above. The experimental results show that after using the LOD algorithm, the performance of the system has been significantly improved. The speed at which the scene is drawn is also significantly improved. Table 3 is a comparison of scene rendering speed with and without LOD algorithm.
It can be seen from Table 3 that the drawing speed using the LOD algorithm is faster than that without the LOD algorithm. The speed without LOD algorithm is 5.263 frames/s, and the speed with LOD algorithm is above 8.850 frames/s.
This paper takes the experimental area of 70 square kilometers in a city as the viewpoint area and divides the LOD of complex buildings into four levels: LOD1, LOD2, LOD3, and LOD4. Using the above theoretical basis, this paper preprocesses the large-scale city data and uses the model compression method to call for 3D visualization. In Fig. 10, the final modeling effect of the modeled building model at different viewpoint heights shows that the average number of frames can reach about 45 frames. It can meet the efficiency and effect needs of most 3D city model imaging applications.
This paper mainly studies the related problems in the three-dimensional rendering technology of urban landscape for smart cities. It improves the speed of 3D rendering of large-scale scenes and the visualization of 3D images by relying on view-dependent models and texture LODs. In recent years, with the development of science and technology, the urban landscape structure is no longer a simple combination of reinforced concrete, but gradually becomes intelligent and technological. With the acceleration of the process of urban informatization, in the process of construction and application of digital urban landscape, the research on its authenticity and practicability has been paid increasingly attention. The use of science and technology for more effective urban landscape construction has become the latest form of urban development. Smart city is a comprehensive embodiment of digital city, smart city, and ecological city. It is a modern urban system. In this system, information technology is the foundation. Other resources of the city interact with each other with the support of information technology to provide simpler and more humane city services. It should encourage smart city management. Smart city is one of the important directions of future urban development, and 3D landscape rendering and optimization algorithm is one of the key technologies to realize smart city. The smart city of the future will use advanced technological means for urban planning and design, in which 3D landscape rendering and optimization algorithms will play an important role. Through high-precision geographic information data and real-time data collected by sensors, a real and accurate urban geomorphic model can be built. Through the application of 3D landscape rendering and optimization algorithms, the future smart city will have a better and livable environment. This can not only improve people’s quality of life, but also help promote sustainable development and green construction of cities.
Footnotes
Funding
Project: 3D Urban Landscape Rendering and Optimization Algorithm for Smart City (2022447).