
Abstract
This article aimed to use the proximal policy optimization (PPO) algorithm to address the limitations of power system startup strategies, to enhance the adaptability, coping ability, and overall robustness of the system to variable grid demand and integrated renewable energy, the constraints in the power system start-up strategy are optimized. Firstly, this article constructed a dynamic model of the power system, including key components such as generators, transformers, and transmission lines; secondly, it integrated the PPO algorithm and designed interfaces that allow the algorithm to interact with the power system model; afterward, the state variables of the power system were determined, and a reward function was designed to evaluate the startup efficiency and stability of the system. Next, this article adjusted the reward function and trained and iterated multiple times in the simulation environment to guide the algorithm to learn the optimal startup strategy. Finally, an effective evaluation of the strategy can be conducted. The research results showed that after optimization by the PPO algorithm, the stable frequency startup of the power system only took about 23 seconds, and the system recovery time was reduced by 33.3% under a sudden load increase. The algorithm used can significantly optimize the intelligent startup strategy of the power system.
Keywords
Introduction
With distributed generation and dynamic demand, traditional power grid start-up scheduling faces challenges like grid stability [1, 2], energy integration [3, 4], and rapid response to extreme events [5, 6]. Conventional methods, based on linear programming or classical control theory [7, 8], are limited with fluctuating demands and renewable integration [9]. Intelligent, flexible scheduling is essential for efficient, reliable grid operation.
This article employs the PPO algorithm to optimize power generation startup and simulate a dynamic power system. A reward function, considering stability, startup efficiency, and penalties for instability and delays, drives iterative optimization. Initial strategy parameters, based on historical data, are encoded as neural network weights. During simulation training, PPO optimizes strategies through environmental interaction. The experiment evaluates the impact on startup time and system stability, verifying PPO’s effectiveness. It also tests the algorithm’s adaptability and robustness in emergencies by measuring recovery time and performance indicators. In this paper, the PPO algorithm is combined with a neural network to optimize the start-up strategy of the power system, which significantly enhances the adaptability and robustness of the system under a complex environment. The innovation lies in the successful construction of a dynamic model, which can comprehensively evaluate and optimize the behavior of the power system, and improve the response efficiency and stable operation ability of the system to various emergencies.
Optimizing the startup strategy of intelligent power systems using the Proximal Policy Optimization algorithm, enhancing system stability and startup efficiency comprehensively through dynamic model construction and reward function design. In a simulated environment, by adjusting the reward function and iterating through training, the algorithm guides the learning of the optimal startup strategy, significantly reducing the startup time of the power system and enhancing its ability to respond to emergencies such as sudden load increases. Following optimization with the PPO algorithm, the stable frequency startup time of the power system is approximately 23 seconds, reducing system recovery time by 33.3% under sudden load increase scenarios. The application of the algorithm greatly optimizes the intelligent startup strategy of the power system.
Optimizing power system start-up scheduling often relies on deterministic models and basic data-driven methods. Some studies employ Optimal Power Flow (OPF) [10, 11] and adaptive control strategies [12, 13]. Other studies have explored the application of machine learning techniques such as neural networks [14, 15] and support vector machines (SVM) [16, 17] to predict electricity demand and load changes. Furthermore, a multi-step recovery method based on Distributed Generators (DGs) can achieve maximum energy recovery in the power grid system startup strategy [18]. The comprehensive power grid startup system utilizing ubiquitous power IoT can effectively solve the problem of strong random disturbances and continuously coordinate key behavioral strategies [19]. Researchers such as Shaik Jan Bhasha [20] proposed the Firefly Algorithm-based Time-series Neural Network (FATNN) assisted voltage source converter high-voltage direct current technology power system recovery method for soft start problems in power systems. Chen Changming [21] and other researchers discussed the grid startup system based on renewable energy and the emerging power system startup method of energy internet.
The PPO algorithm, as a reinforcement learning technique, has demonstrated its superiority in multiple high-complexity fields and is suitable for handling dynamic environments and uncertainty problems. In automatic control [22], intelligent robot navigation [23], and complex resource allocation problems [24], PPO significantly improves decision quality and efficiency by learning optimal strategies [25, 26]. Currently, a large number of studies have applied the PPO algorithm to intelligent control of power systems. Due to the negative impedance potential of Constant Power Load (CPL), the stability of distribution networks based on power electronic converters is prone to instability. Some studies [27] have successfully applied the PPO algorithm to adjust the coefficients of MFSMC (Model-Free Sliding Mode Controller) controllers. To adapt to the volatility of renewable energy and changes in grid topology, other researchers [28] propose using the PPO algorithm for real-time decision-making, to achieve effective integration of renewable energy in the power system. For resource management and spectrum sharing issues in the power system, researchers such as Zhang Haijun [29] have adopted power control based on Distributed Proximal Policy Optimization (DPPO). Regarding the distribution network embedded with renewable energy and storage devices, scholars such as Cao Di [30] have formulated the multi-period nonlinear programming decision problem as a Markov Decision Process (MDP) process and solved it sequentially using the PPO algorithm. When facing modern power grid startup problems such as load fluctuations and energy integration, applying PPO to the intelligent startup strategy of the power system can effectively improve the system’s ability to handle complex power grid dynamics and overall robustness.
Recent optimization advances have improved power system management. Sun Xinwei et al. [31] used Proximal Policy Optimization for grid reliability. Zhang Bin et al. [32] applied deep reinforcement learning for renewable energy systems. Abidi Mustufa Haider et al. [33] introduced chaotic elephant herding for cyber-physical systems. Shengren Hou et al. [34] developed a constraint-aware reinforcement learning algorithm for energy scheduling. Alkahtani Mohammed et al. [35] proposed a Gannet optimization algorithm to reduce industrial costs. Chen Qingchuan et al. [36] created a deep reinforcement learning-based anti-jamming algorithm for wireless communications. Garg Vaneet et al. [37] proposed a predictive virtual machine consolidation approach that significantly improves resource utilization and system response speed. Srivani B et al. [38] conducted a theoretical analysis and compared the performance of 10 optimization algorithms with the DMS algorithm, further deepening the understanding and application of various optimization algorithms. For large-scale wireless sensor networks with multiple sink nodes, Reddy Chada Sampath et al. [39] developed a secure and energy-efficient technique based on adaptive squirrel-coyote optimization. Dimitropoulos Nikos et al. [40] conducted a comparative analysis of AI-based models for short-term photovoltaic power forecasting. These research outcomes collectively advance the optimization of power system management, enhancing overall system efficiency and reliability.
Environmental modeling and PPO algorithm construction
Environmental modeling
The research topic is to optimize the startup strategy of intelligent power systems, constructing the following system model: including three key components - generators, transformers, and transmission lines. The generator model considers parameters such as rotor inertia coefficient, damping ratio, excitation system, etc.; the transformer model considers parameters such as rated capacity, turns ratio, and short-circuit impedance; the transmission line model considers parameters such as resistance, inductance, and capacitance to simulate the behavior of the power system under different voltage and load conditions. The PPO algorithm is utilized for policy optimization, updating policy network parameters by maximizing the objective function. The algorithm comprises policy and value function networks, where the policy network generates the probability distribution of actions, and the value function network estimates state values. The advantage function is calculated to evaluate the advantage of taking certain actions. The goal is to dynamically adjust the strategy through interaction with the power system model to achieve efficient system startup. A PWM (Pulse Width Modulation) -controlled DC (direct current) motor model is used to optimize the motor startup process by adjusting PWM signals to control motor power and speed, reducing grid load and improving startup efficiency.
Based on the above system model, the following questions are clarified: How to define the state of the power system and executable actions to interact with the PPO algorithm for dynamic policy adjustment of the system? How to construct an appropriate reward function to evaluate the performance of the power system and apply it to the PPO algorithm to guide policy optimization and implementation. How to iterate and optimize startup strategies within the framework of the PPO algorithm to adapt to different power system startup scenarios and ensure efficient and stable system startup. How to adjust the parameters of the PPO algorithm, including learning rate and neural network structure, to improve the training efficiency of the algorithm and the performance of startup strategies.
A dynamic model is constructed based on MATLAB software in the study to simulate the behavior and response of the actual power system. This model includes three key components of the power system: generators, transformers, and transmission lines. Each component is assigned detailed parameters and characteristics.
The generator model is equipped with a 4.5 Hz rotor inertia coefficient and a 0.02 damping ratio, the excitation system time constant is set to 1.6 seconds, and the gain of the governor is set to 3.5. For the electrical model of the generator, the synchronous reactance of 0.15 p.u., the transient reactance of 0.07 p.u., and sub transient reactance of 0.05 p.u. can be set to accurately simulate the response of the generator under different load conditions. The transformer model is set with a rated capacity of 100 MVA, a 10 kV/110 kV ratio, and a short-circuit impedance of 0.01 to simulate the behavior of the transformer during power system startup and load changes.
Algorithm development
The PPO algorithm updates policies by maximizing the objective function, which is expressed as an estimate of expected returns under a specific policy:
Here, is the policy network parameter; is the probability ratio, representing the ratio of new and old policies; is the estimate of the dominance function, and is the hyperparameter used to limit the magnitude of policy updates. The advantage function is used to evaluate the superiority of taking a certain action compared to the average action. The calculation is as follows:
Among them, is the TD (Temporary Difference) residual; is the reward, and is the discount factor. is a GAE (Generalized Advantage Estimation) parameter, and is a value function used to estimate the expected return in states. In the study, the PPO algorithm uses two main neural networks: policy network and value function network. The strategy network is used to generate the probability distribution of actions, and the value function network is used to estimate the state value. The strategy network updates use the following gradients:
The goal of a value function network is to minimize the following loss functions:
Here,
PWM-controlled DC motor model.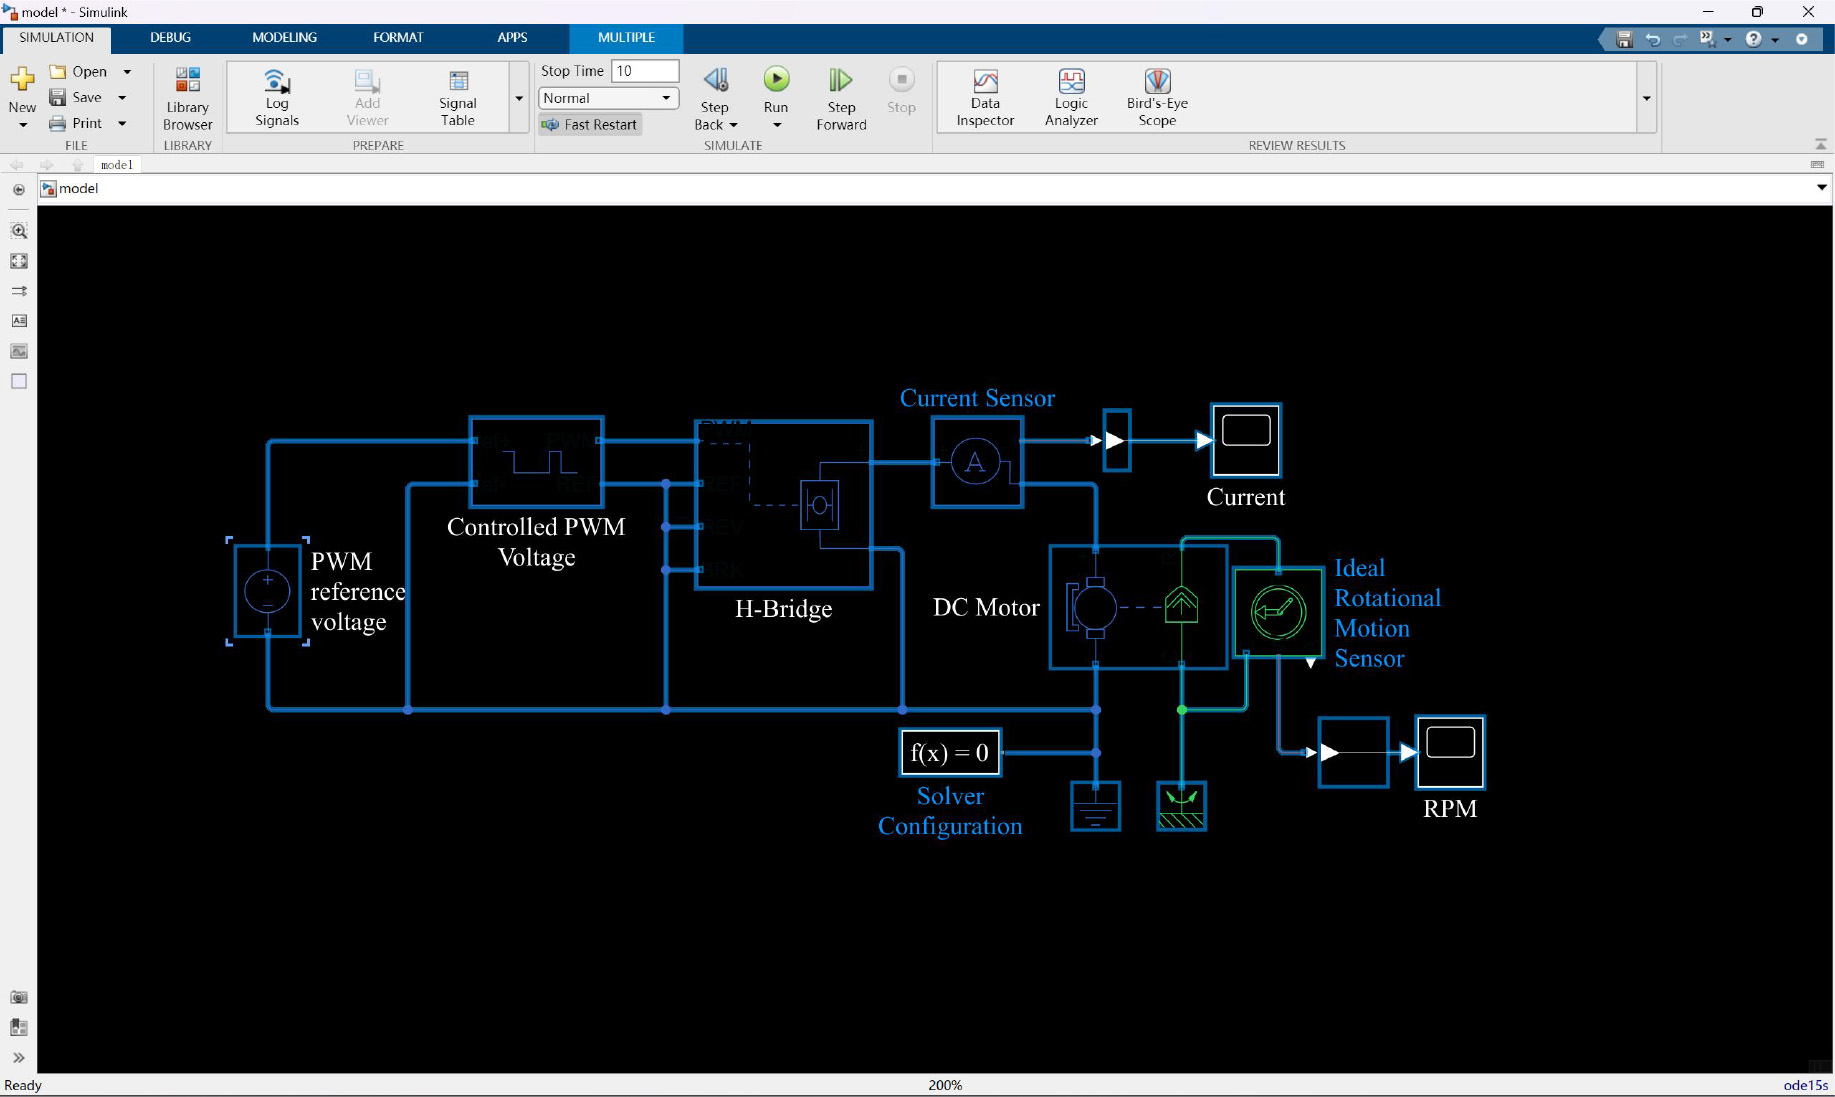
Figure 1 shows the constructed PWM-controlled DC motor system model. “DC” represents Direct Current, while “RPM” represents Revolutions Per Minute. By adjusting the PWM signal to optimize the motor starting process, the power grid load is reduced and the starting efficiency is improved, achieving energy management in the power system. PWM reference voltage is used to set the required motor speed, determine the duty cycle of the PWM signal, and thereby control the power and speed of the motor. The Controlled PWM Voltage is the actual output of the PWM signal, which is adjusted according to the setting of the PWM reference voltage. The change in the duty cycle of the signal can cause a change in the effective value of the motor input voltage. H-Bridge is a circuit composed of switches that allow current to flow in two directions, thereby controlling the direction of motor rotation. The H-Bridge in the model receives PWM signals and adjusts the current flowing to the motor accordingly.
As shown in Fig. 2 the entire process of designing and optimizing the state and reward in the startup strategy of intelligent power systems based on the PPO algorithm starts from “state definition”, identifying key state variables: “voltage level”, “system frequency”, and “load demand”.
Each state variable undergoes specific analysis to ensure a comprehensive evaluation. This article incorporates the analysis results into the “reward function construction” step, where a reward mechanism is developed to evaluate different aspects of power system performance. The reward function considers “system stability evaluation”, “startup efficiency evaluation”, and “penalty for poor performance”, the latter including penalties for “instability” and “startup delay”. It can maintain positive rewards for stability and efficiency while optimizing the reward function for any unstable or delayed initiation of negative rewards. One is an iterative process that includes data-driven adjustments, balancing positive and negative rewards, and experimental validation to optimize the reward function and guide optimal performance. Next, this article establishes an optimized reward function to guide strategy implementation and testing. Theoretical models can be applied to practical scenarios. In the performance evaluation, the effectiveness of the implementation strategy is evaluated, and based on these evaluations, feedback, and re-optimization are carried out to further improve the strategy, ensuring that the startup process of the power system is as efficient and stable as possible. The flowchart finishes with an “end” node, indicating the completion of the optimization cycle.
Some parameter settings for the startup strategy of the power system are shown in Table 1.
Different reward function parameter settings in power system startup strategy
Different reward function parameter settings in power system startup strategy
State and reward design process of intelligent power system startup strategy.
In Table 1, each row represents a different set of reward function parameter settings. The values of stability reward and start-up efficiency reward increase with the increase of setting number, indicating higher rewards for system stability and rapid start-up. At the same time, the values of the instability penalty and startup delay penalty also increase, indicating stricter punishment for poor performance. The data shows different attempts of the power system startup strategy in the process of adjusting the reward function parameters, reflecting the adjustment and balance of different factor weights in the optimization process.
Strategy update
Strategy updates in different power system startup scenarios. (a) High-load startup. (b) Low-temperature start. (c) Emergency recovery start. (d) Distributed resource integration initiation.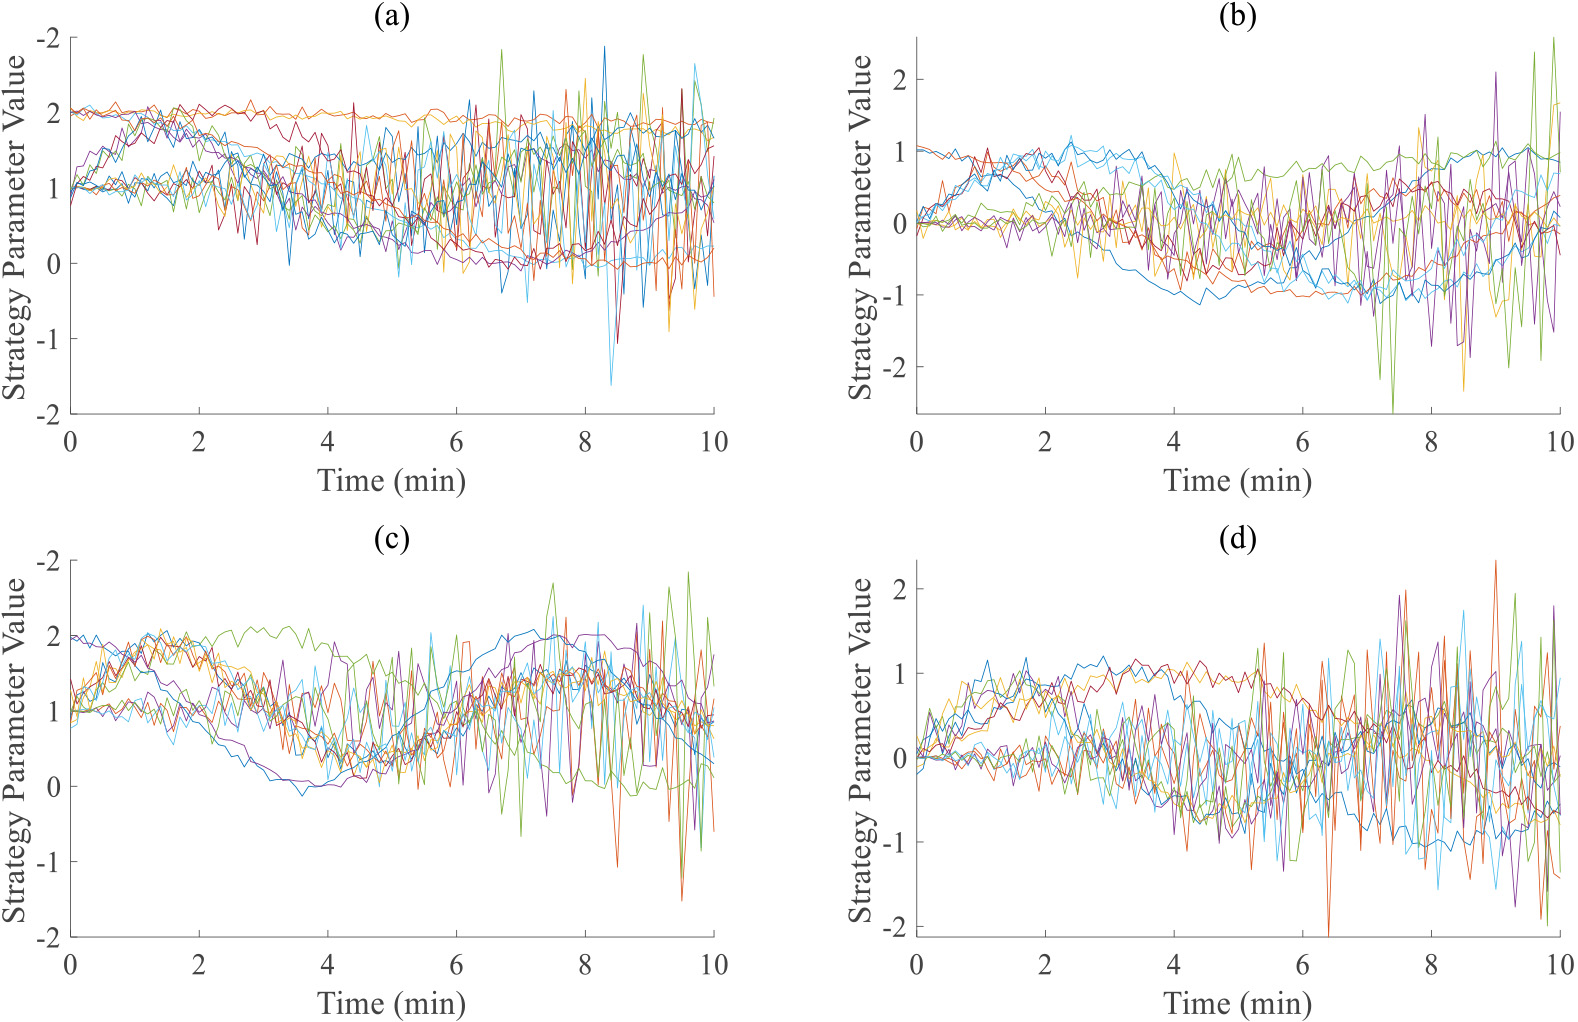
The initial strategy parameters, based on the analysis of historical power system startup data, include the probability distribution of startup actions and the expected system response, encoded as the initial weights of the neural network. During the simulation training phase, the PPO algorithm learns and optimizes strategies through interaction with the simulated environment. It executes a series of startup actions and adjusts its strategies based on feedback from the reward function. This process involves two key steps: strategy execution, which generates startup commands based on the current strategy, and strategy update, which adjusts strategy parameters based on the results (rewards). To improve training efficiency, a batch training method is used, with each batch containing dozens of simulated startups to collect sufficient data for strategy updates. The strategy update process, shown in Fig. 3, includes major scenarios such as high-load startup, low-temperature startup, emergency recovery startup, and distributed resource integration startup.
Figure 3(a), (b), (c) and (d) respectively show the strategy updates for power system startup under high load, low temperature, emergency recovery, and distributed resource integration scenarios. The X-axis represents time (10 minutes), and the Y-axis represents strategy parameter values. Different curves represent different simulated start-up batches (16 times for high load and 13 times for the rest). With time, the PPO algorithm can effectively update the parameters of the startup strategy based on real-time situations, and can efficiently cope with different power system startup scenarios. After a certain number of training iterations, the current strategy can be evaluated by executing the startup strategy in different testing scenarios and recording its performance indicators.
Learning rate adjustment method and convergence speed calculation.
Correlation between neural network architecture optimization scheme and system utilization.
This article analyzes the underperforming strategies and makes corresponding adjustments to the PPO algorithm parameters, including adjusting the learning rate (Fig. 4) and optimizing the neural network architecture (Fig. 5).
During the simulation training phase, the learning rate adjustment method of the PPO algorithm plays a crucial role in the stability and efficiency of the optimization process. The choice of learning rate affects the step size of the algorithm’s parameter updates, thereby directly influencing the convergence speed and stability of the model. A comparison of different learning rate adjustment methods in Fig. 4 reveals that with an increase in the number of iterations, various learning rate adjustment methods can effectively reduce the model’s convergence speed, indicating that an appropriate learning rate can expedite the optimization process to reach a stable state more quickly. However, if the learning rate is too large, it may cause parameters to update too rapidly, leading to instability in the optimization process, or even failure to converge to the optimal solution. Conversely, if the learning rate is too small, the optimization process will be slow, requiring more iterations to reach the desired state, thereby reducing training efficiency. Therefore, when selecting a learning rate adjustment method, it is necessary to balance convergence speed and stability to ensure that the optimization process proceeds smoothly and converges to the optimal solution.
Figure 4 shows the learning rate adjustment method and the convergence speed calculation, and the number of iterations is set to 100, 500, and 1000 times, respectively. The X-axis representation includes 10 different learning rate adjustment methods: Fixed, Time Decay, Adaptive, Exponential Decay, Step Decay, Cyclical, Momentum-based, adaptive Moment Estimation, Cosine Annealing, and Learning Rate Restart. The Y-axis represents the convergence speed in seconds, and a comparison of the convergence speed before and after optimization was conducted. It can be seen that when the iteration number is 100, the average convergence speed of the 10 learning rate adjustment methods changes from 1.07s to 1.09s. At this point, due to too few iterations, the model was unable to effectively reduce the convergence speed. At 500 iterations, the convergence speed decreased by 27.1%, while at 1000 iterations, it reached 25.9%. It can be seen that as the number of iterations increases, various learning rate adjustment methods in the research can effectively reduce the convergence speed of the model, making the power system start-up to a higher level of response.
Figure 5 shows the correlation between neural network architecture optimization schemes and system utilization. The X-axis represents optimization solutions for neural network architecture, including Incremental Layers/Neurons, Convolutional Neural Networks, Recurrent Neural Networks, short-term Term Memory, Gated Recurrent Unit, Self Attention Mechanism, Residual Networks, Batch Normalization, Dropout, and Network Pruning. The Y-axis represents the improved performance indicators, including Response Time, Computational efficiency, Stability, Resource Usage, Error Rate, Generalization Ability, Training Time, Memory Usage, Energy consumption, and Parallel Processing Capability. The Z-axis represents the system utilization rate (%) corresponding to different optimization schemes and performance indicators. It can be seen that the optimization plan can make different and efficient adjustments to the various performance indicators to be improved. Among them, through network pruning optimization, the parallel processing ability of the system is effectively improved, and the system utilization rate reaches 91.7%.
System startup time evaluation
Power system startup time evaluation.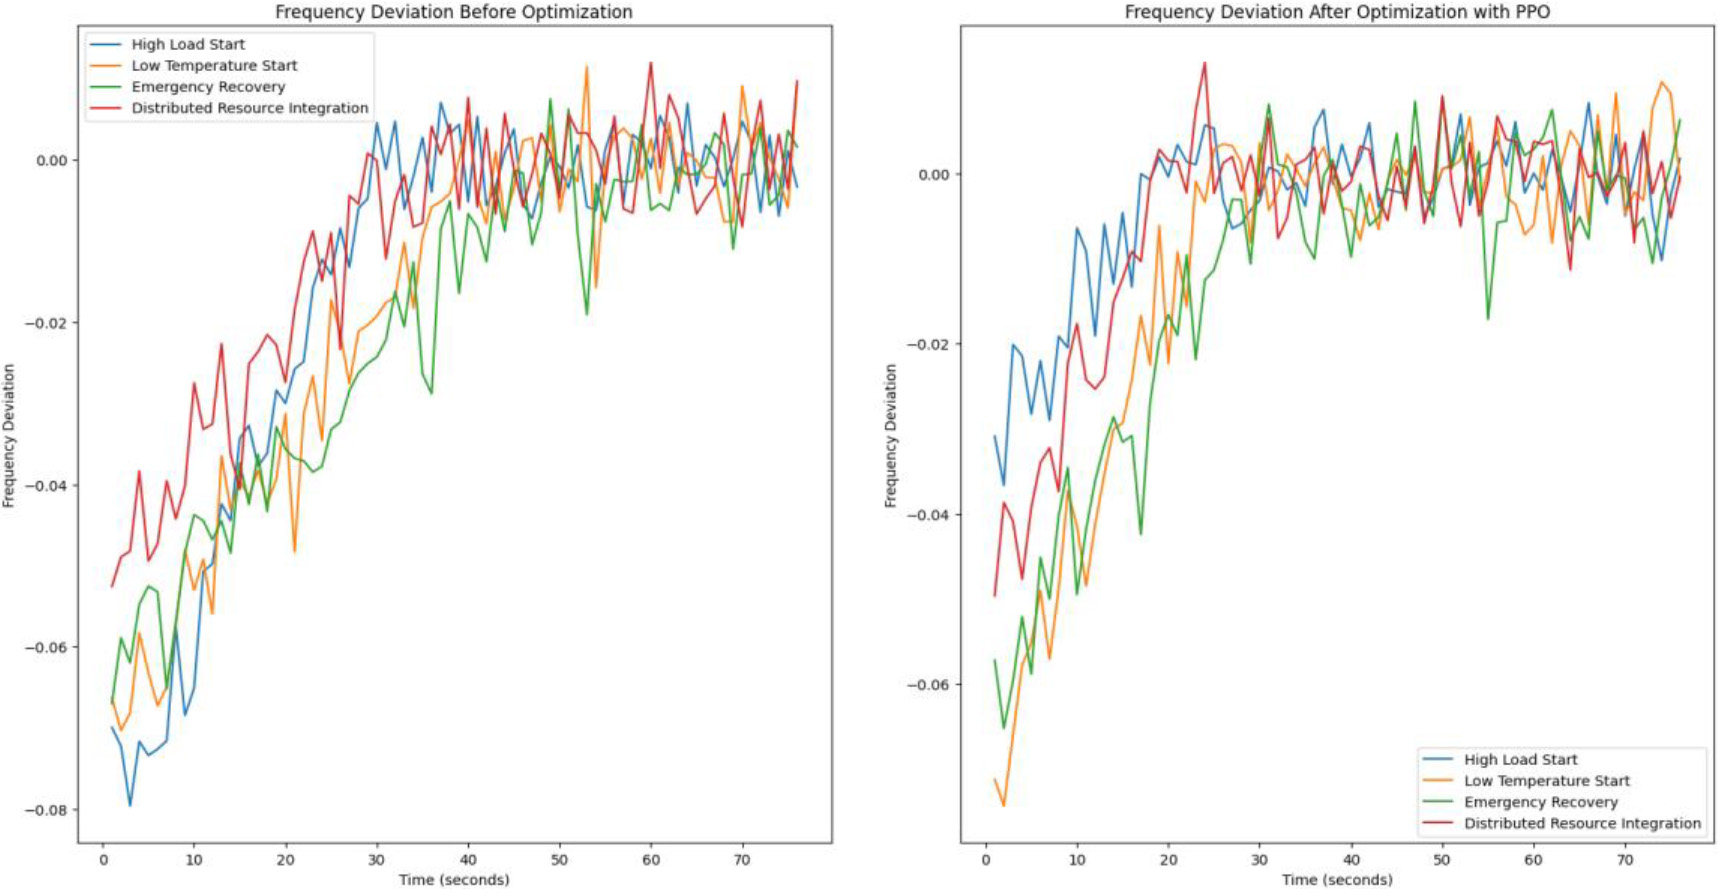
This article uses the time series analysis method to evaluate the system startup time, records the time required for the system to reach a stable operating state during multiple simulated startup processes, and quantifies the impact of the PPO algorithm on startup efficiency, as shown in Fig. 6.
The X-axis in Fig. 6 represents the system startup time (1 second to 76 seconds), and the Y-axis represents the power frequency deviation. The two subgraphs on the left and right show a comparison of the time it takes for the system to reach a stable frequency before and after optimization, including four scenarios: high load, low temperature, emergency recovery, and distributed resource integration startup. Before optimization by the algorithm, the power frequency deviation of the system began to stabilize around 39 seconds and fluctuated around 0. However, after optimization by the PPO algorithm, the time was reduced to about 23 seconds. Based on the PPO algorithm, startup time optimization can be effectively carried out for different scenarios.
System stability assessment is conducted by monitoring and analyzing the fluctuations of key parameters (including voltage, frequency, and load) during the startup process of the power system. The voltage stability index can be used to quantify the performance of the system under different startup strategies, and the system response before and after PPO algorithm optimization can be compared to evaluate the effectiveness of the algorithm. The results are shown in Fig. 7.
In Fig. 7, the X-axis represents different startup strategies, and the Y-axis represents the voltage stability index (0 to 1). Each strategy involves conducting three different initiation experiments separately. The voltage stability index before PPO optimization: the fast response is 0.90, 0.92, 0.88, and the load balancing is 0.85, 0.87, and 0.86, respectively. The frequency adjustment is 0.91, 0.90, 0.92, and the voltage control is 0.89, 0.88, and 0.90 respectively. The demand forecast was 0.87, 0.85, 0.86, and the emergency response was 0.93, 0.94, and 0.92 respectively. The voltage stability index after PPO optimization: the fast response is 0.95, 0.96, 0.94, and the load balancing is 0.92, 0.93, and 0.91, respectively. The frequency adjustment is 0.94, 0.95, 0.93, and the voltage control is 0.91, 0.90, and 0.92 respectively. The demand forecast was 0.89, 0.90, 0.88, and the emergency response was 0.97, 0.96, and 0.98 respectively.
System emergency response capability
Evaluation of emergency response capability of power system
Evaluation of emergency response capability of power system
Power system startup stability assessment.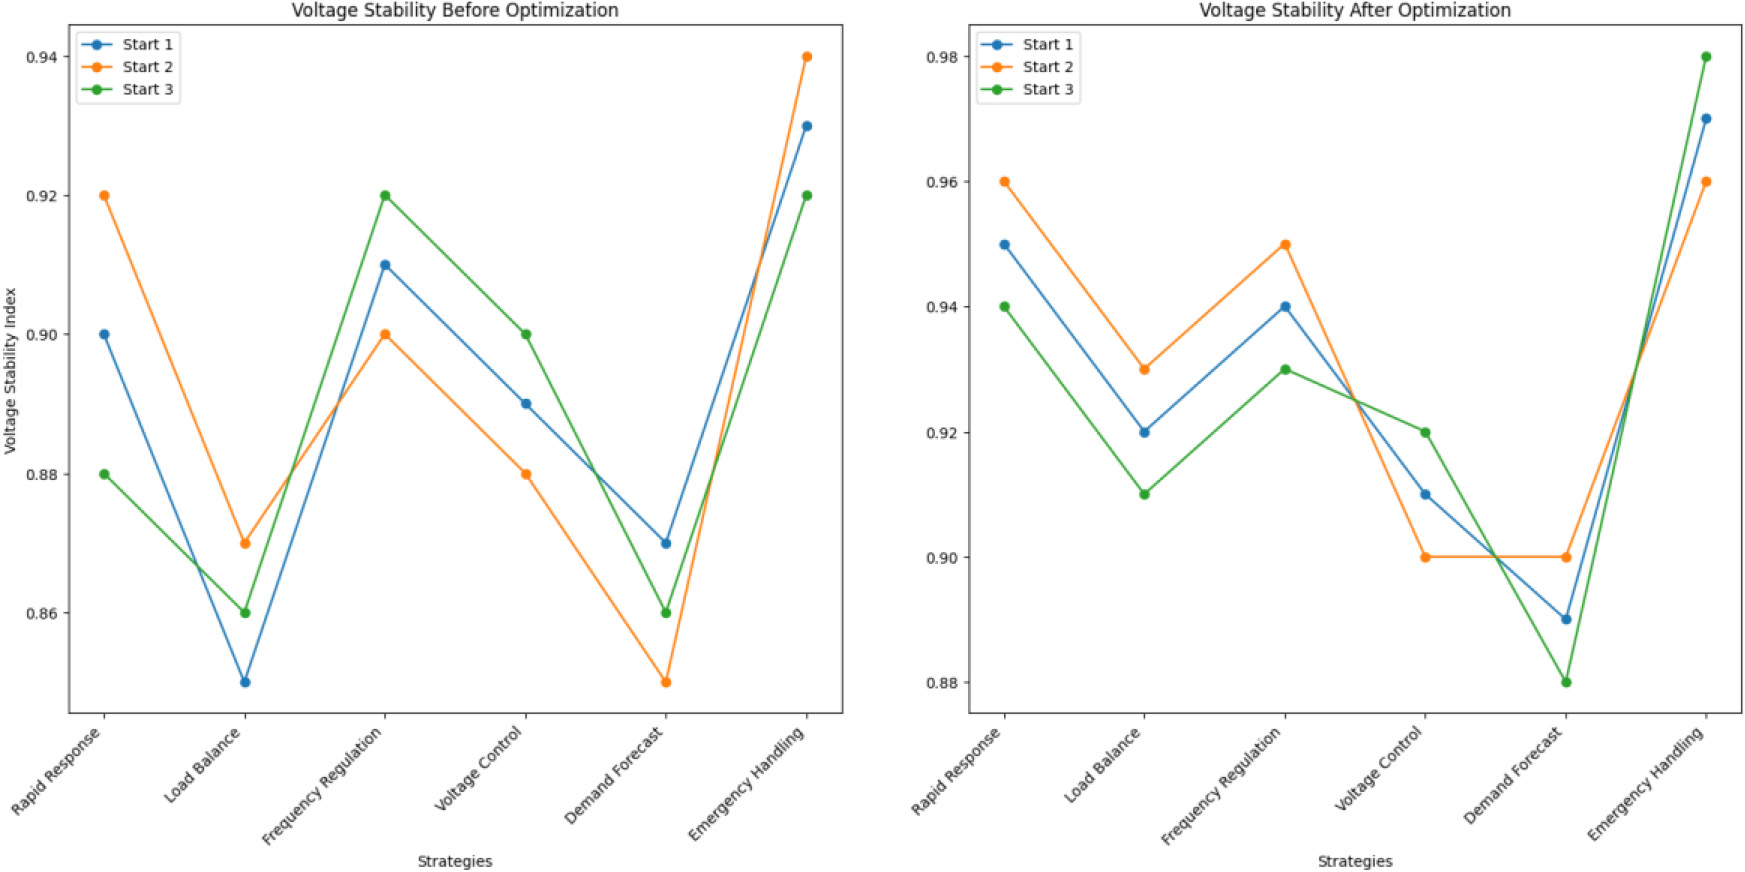
This article records the time required for the system to recover to a stable state and the performance indicators during the recovery process, to quantify the response efficiency of the intelligent startup strategy to emergencies. The results are shown in Table 2.
Table 2 shows the performance of the power system intelligent startup strategy optimized using the PPO algorithm in response to different types of emergencies. It can be seen that whether facing common emergencies such as a sudden increase in load, generator failure, transmission line damage, or complex situations such as main transformer failure, abnormal frequency, voltage drop, or even extreme challenges such as control system failure, ring network disconnection, equipment overheating, and natural disasters, the optimized startup strategy of PPO algorithm significantly reduces the time required for the system to recover from event occurrence to stable state. Under the sudden increase in load, the system recovery time before and after optimization was reduced from 45 seconds to 30 seconds, an improvement of 33.3%. The data reflects that the PPO algorithm not only improves the rapid response ability of the power system to emergencies but also enhances its adaptability and robustness in complex and ever-changing environments.
Comparison of reinforcement learning algorithms in power system startup optimization
Table 3 indicates PPO’s superior performance in reducing startup time, recovery time, and improving stability index compared to baseline methods. While alternatives like DDPG, A3C, and SARSA may have slight advantages in certain cases, overall, their performance is comparable or slightly lower. However, for scenarios with continuous action spaces or non-stationary environments, other algorithms might be more appropriate. Thus, choosing the right algorithm depends on specific application requirements.
This article demonstrates PPO’s effectiveness in optimizing power system startup strategies. By constructing a dynamic model and designing a reward function, system stability and startup efficiency were improved. However, further research is needed to assess the model’s adaptability to different power system configurations and operational conditions. Future studies could explore challenges in transferring the optimized strategy to diverse setups and validate effectiveness in practical scenarios, enhancing power system efficiency and stability.